-
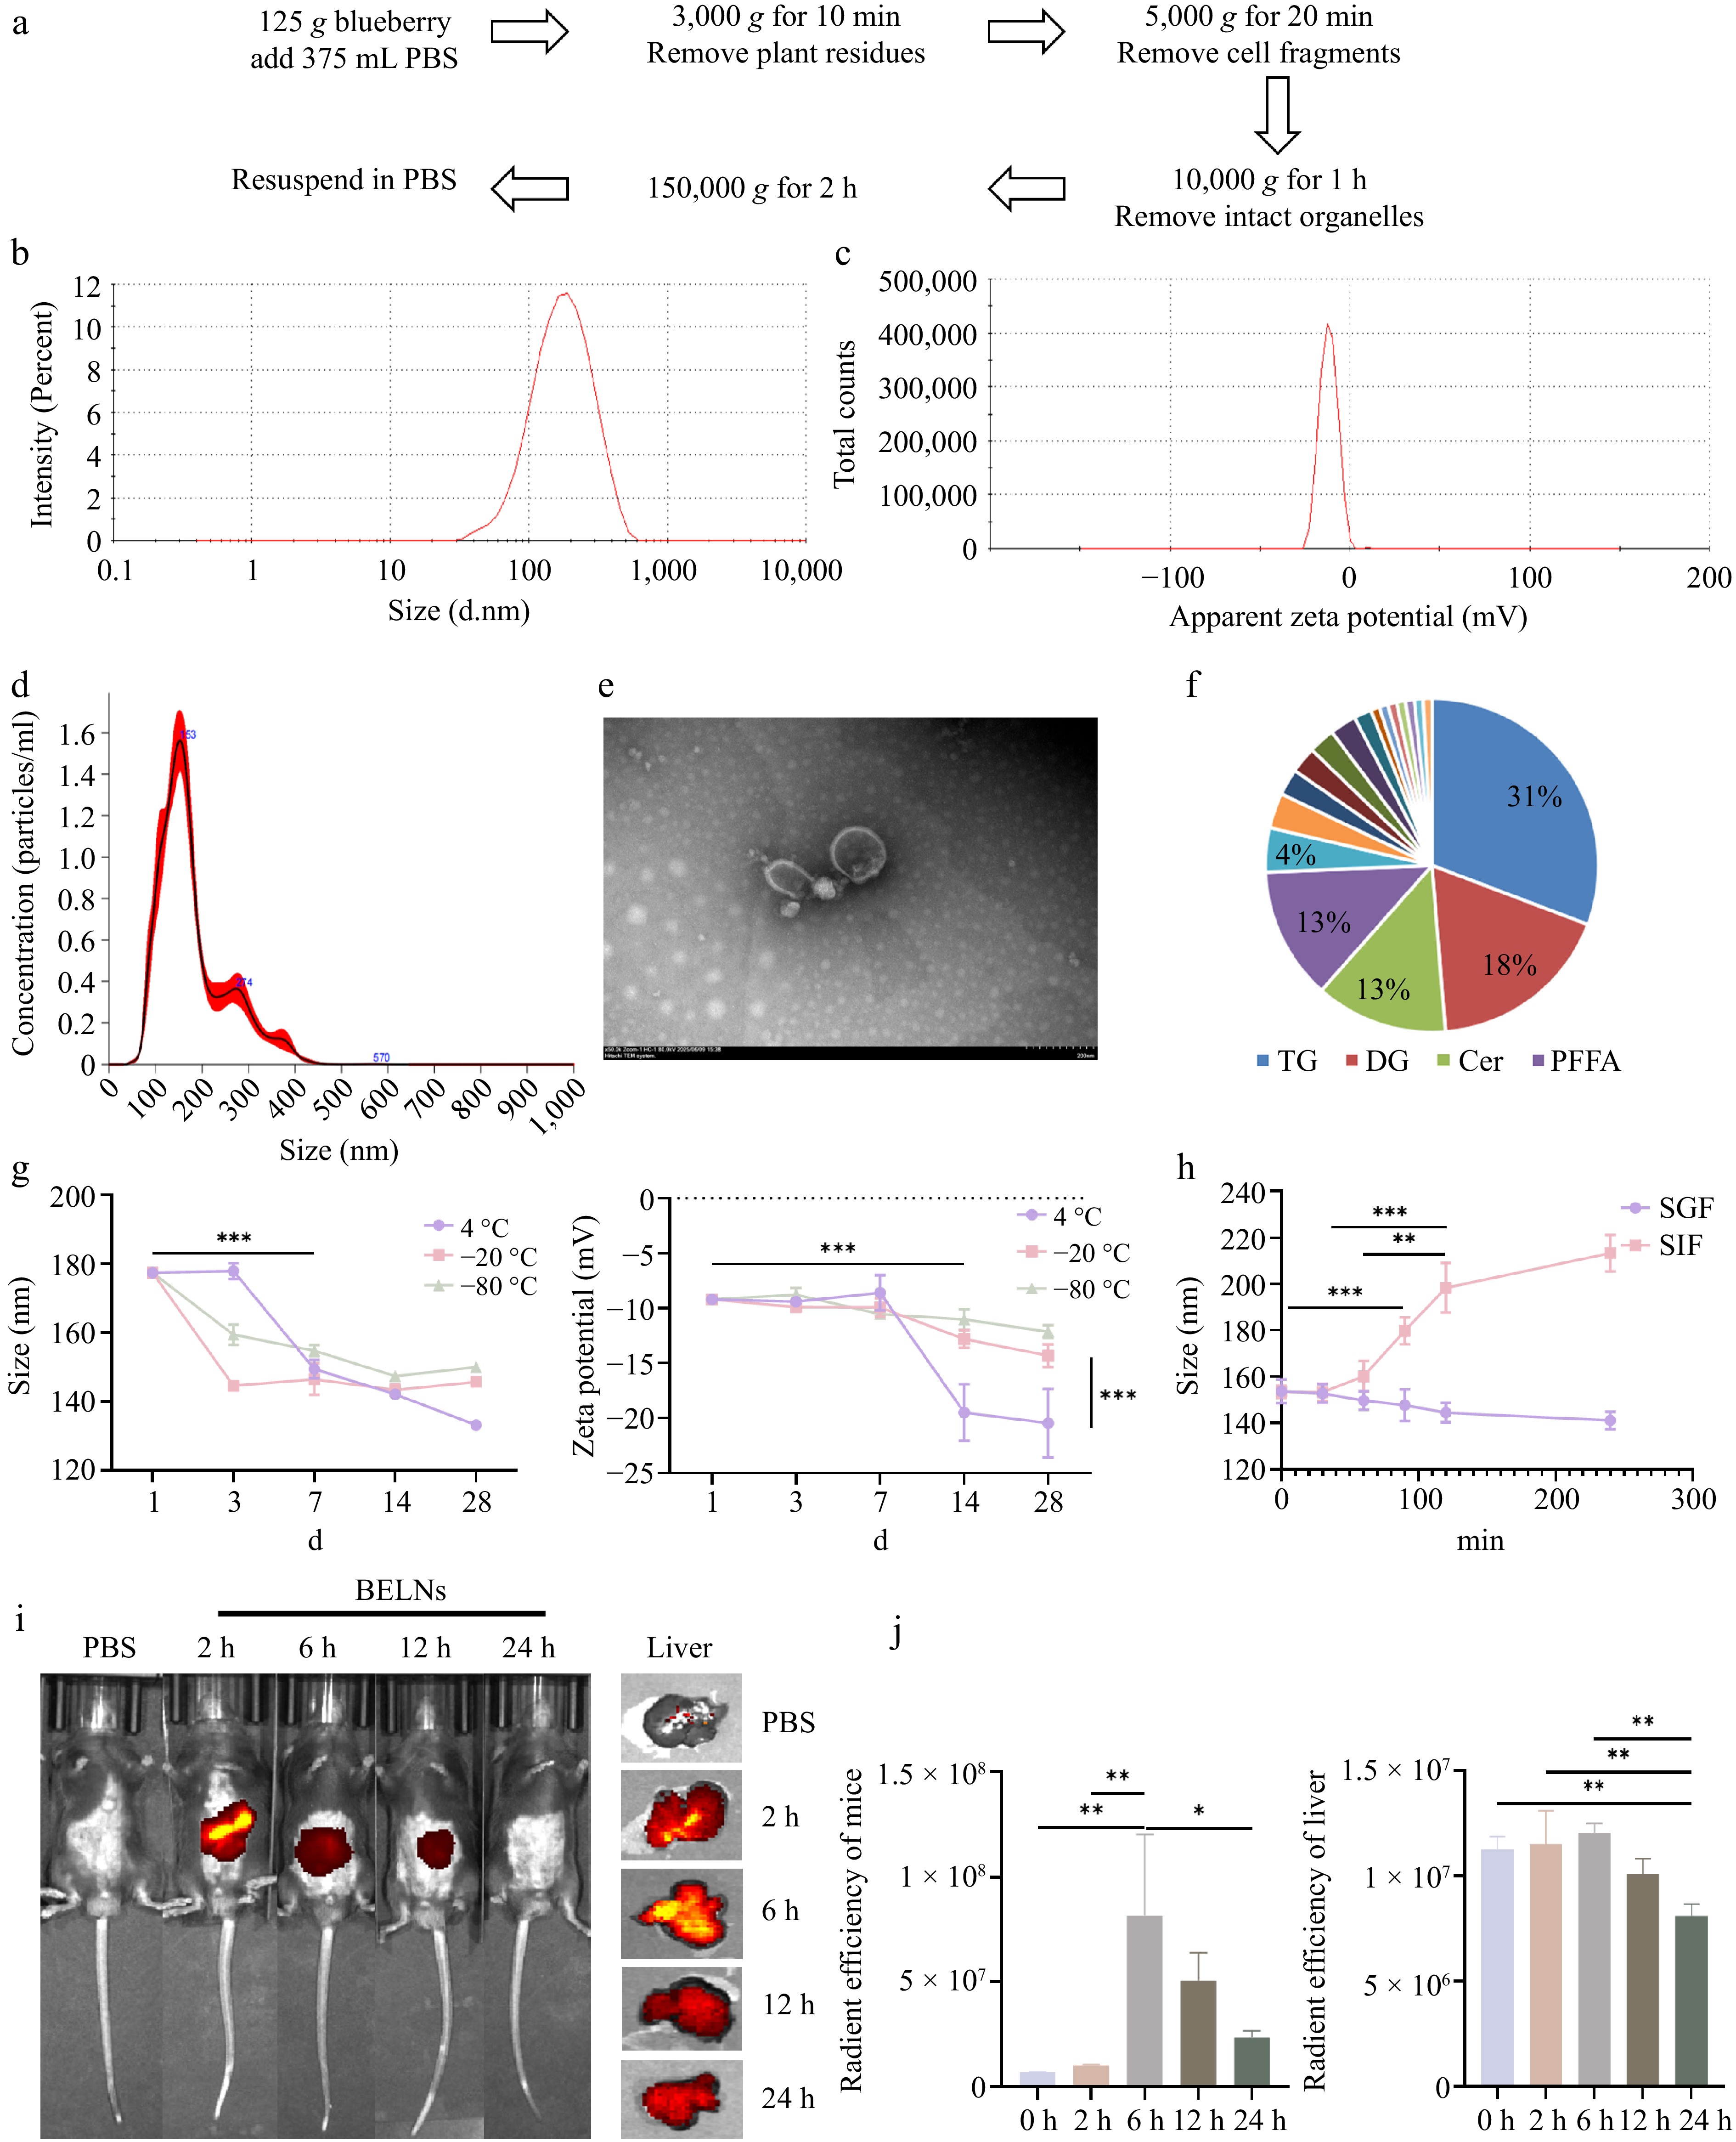
Figure 1.
Isolation and characterization of BELNs. (a) Schematic representation of the BELNs extraction protocol. (b) Size distribution profile measured by DLS. (c) Surface charge characterization through zeta potential analysis. (d) Concentration assessment via nanoparticle tracking analysis. (e) Transmission electron micrographs demonstrating morphological features (scale bar: 200 nm). (f) Comprehensive lipid composition analysis. (g) Stability monitoring under different storage temperatures (4, −20, −80 °C) and duration periods (1, 3, 7, 14, 28 d). (h) Size stability evaluation in simulated gastric and intestinal fluids over a 4-h incubation. (i) Temporal biodistribution patterns following oral administration. (j) Quantitative fluorescence intensity measurements corresponding to the whole-body and liver in Fig. 1i, respectively. * p < 0.05, ** p < 0.01, *** p < 0.001.
-
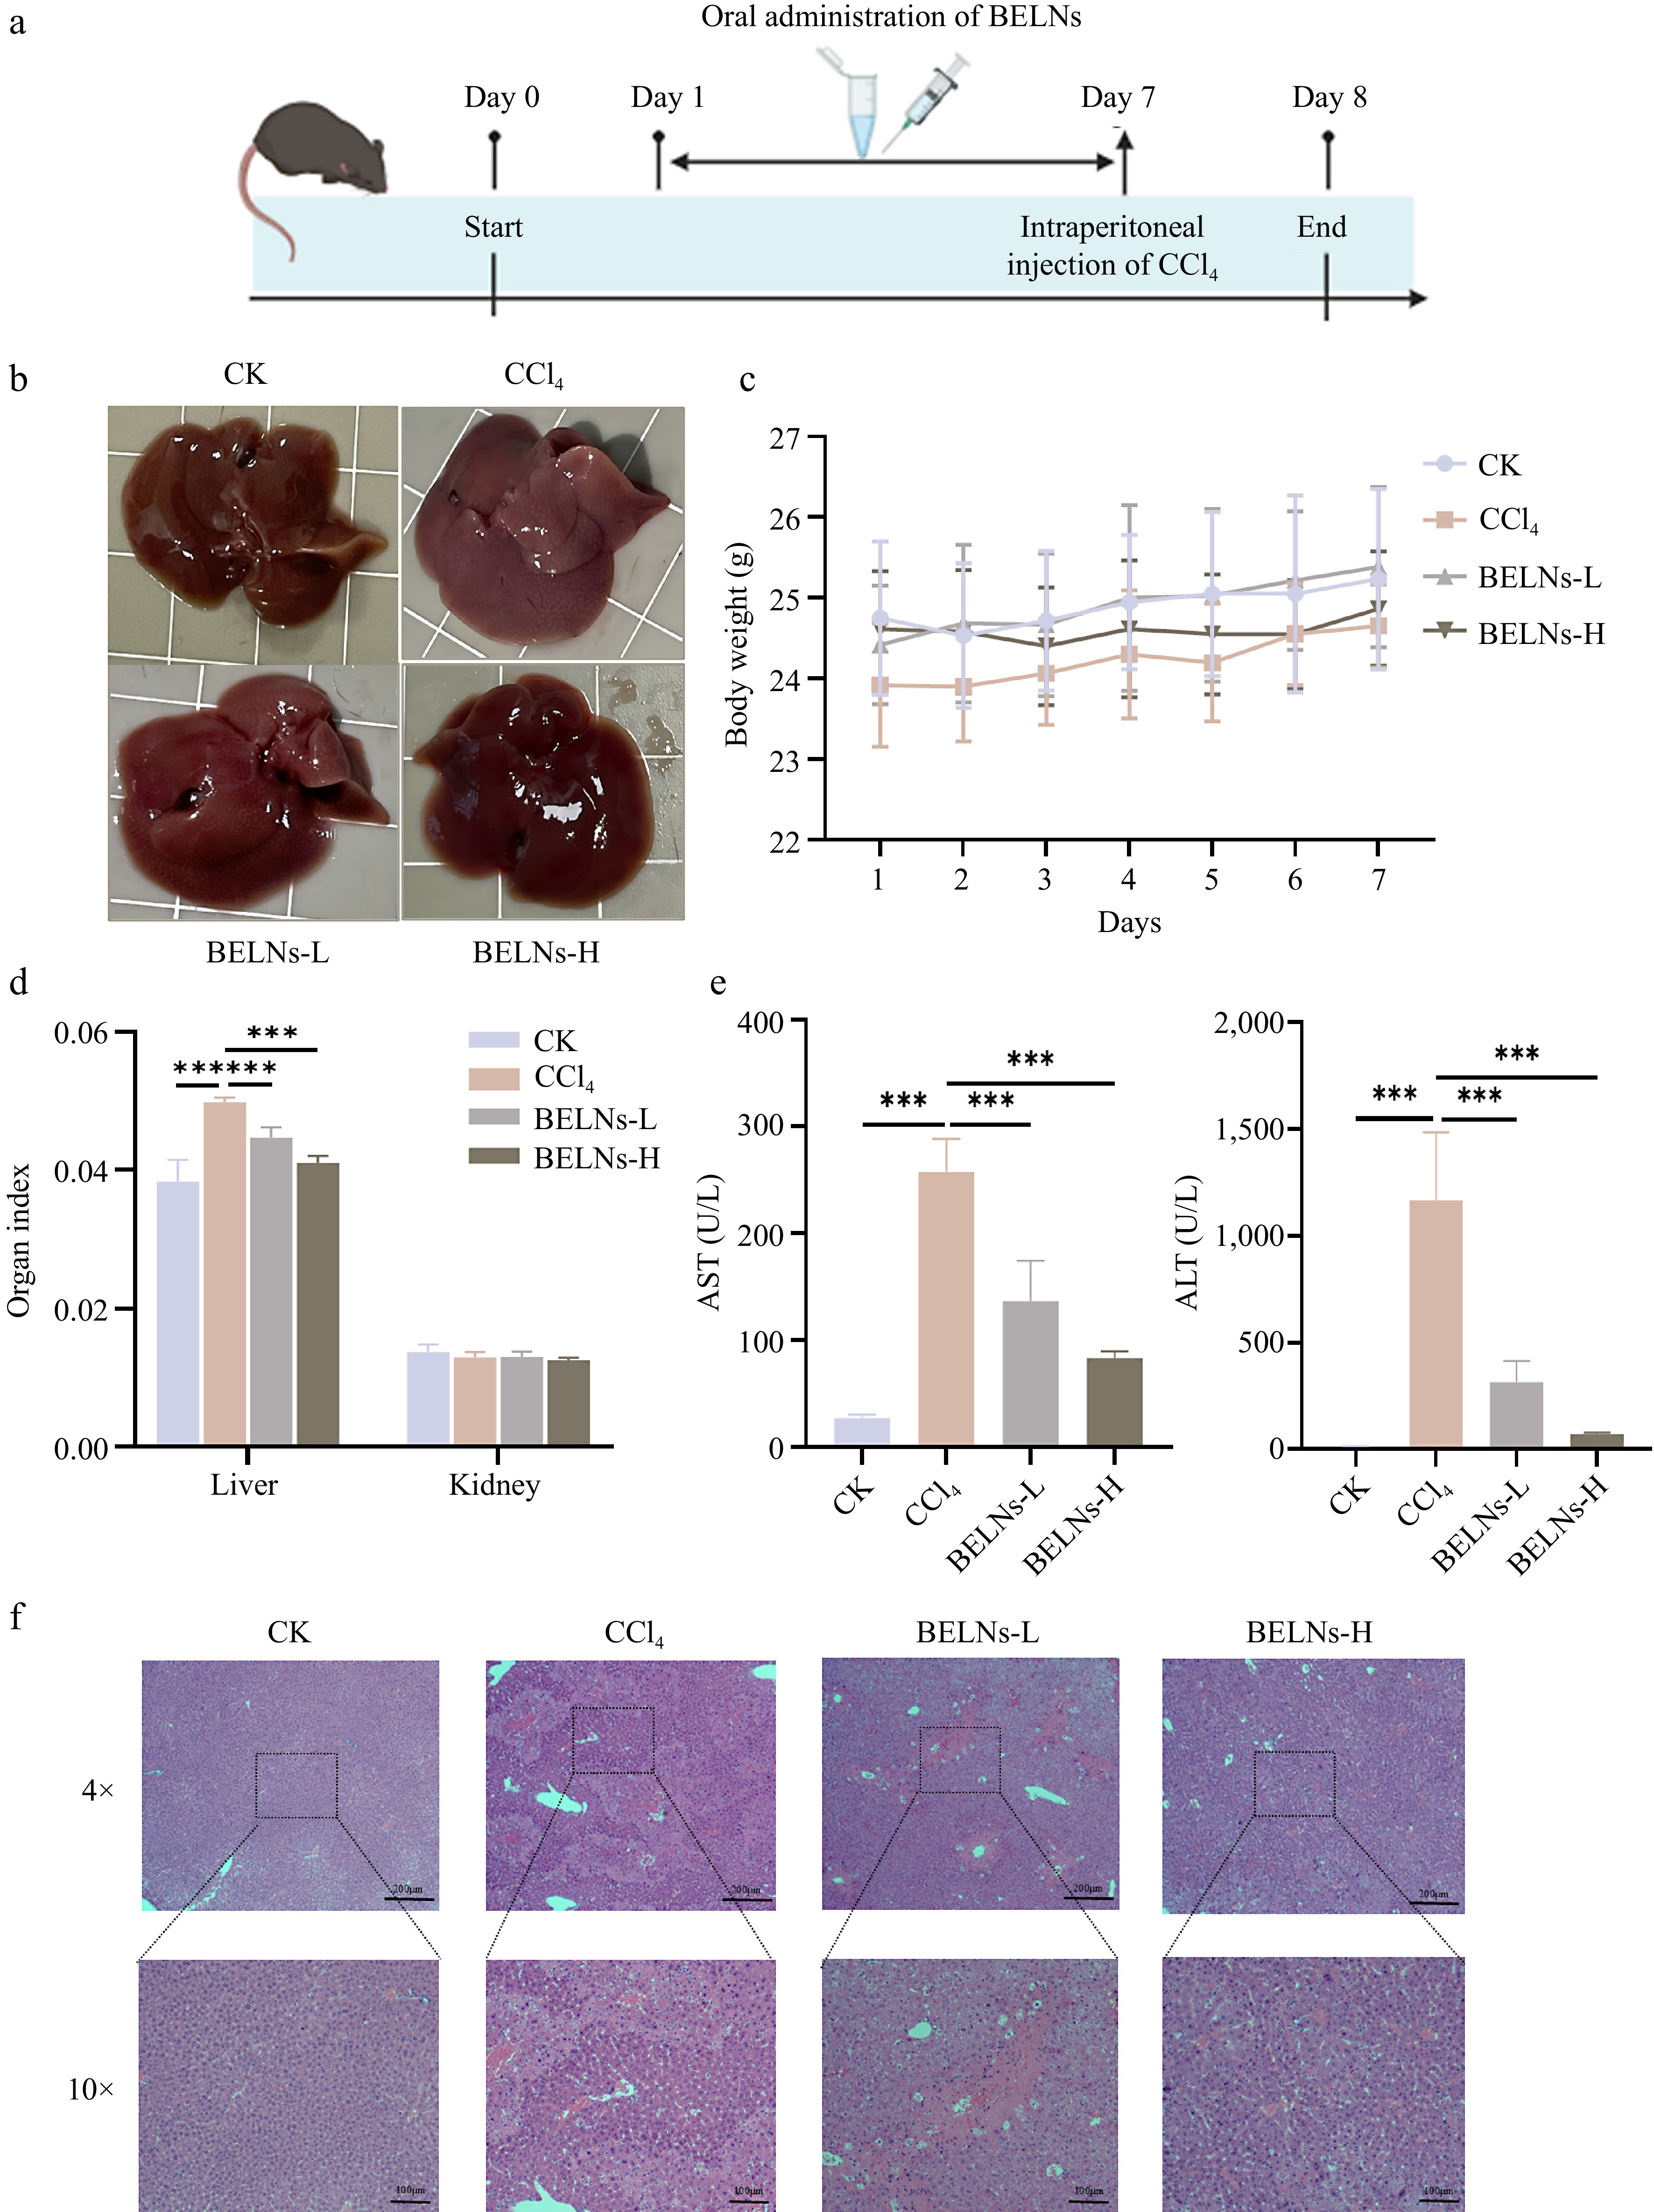
Figure 2.
Protective effects of BELNs against ALI in mice. (a) Schematic diagram of experimental protocol. (b) Representative hepatic morphology and (c) corresponding body weight measurements. (d) Organ index calculations, and (e) serum transaminase profiles. (f) Histopathological examination through H&E staining across treatment conditions. *** p < 0.001.
-
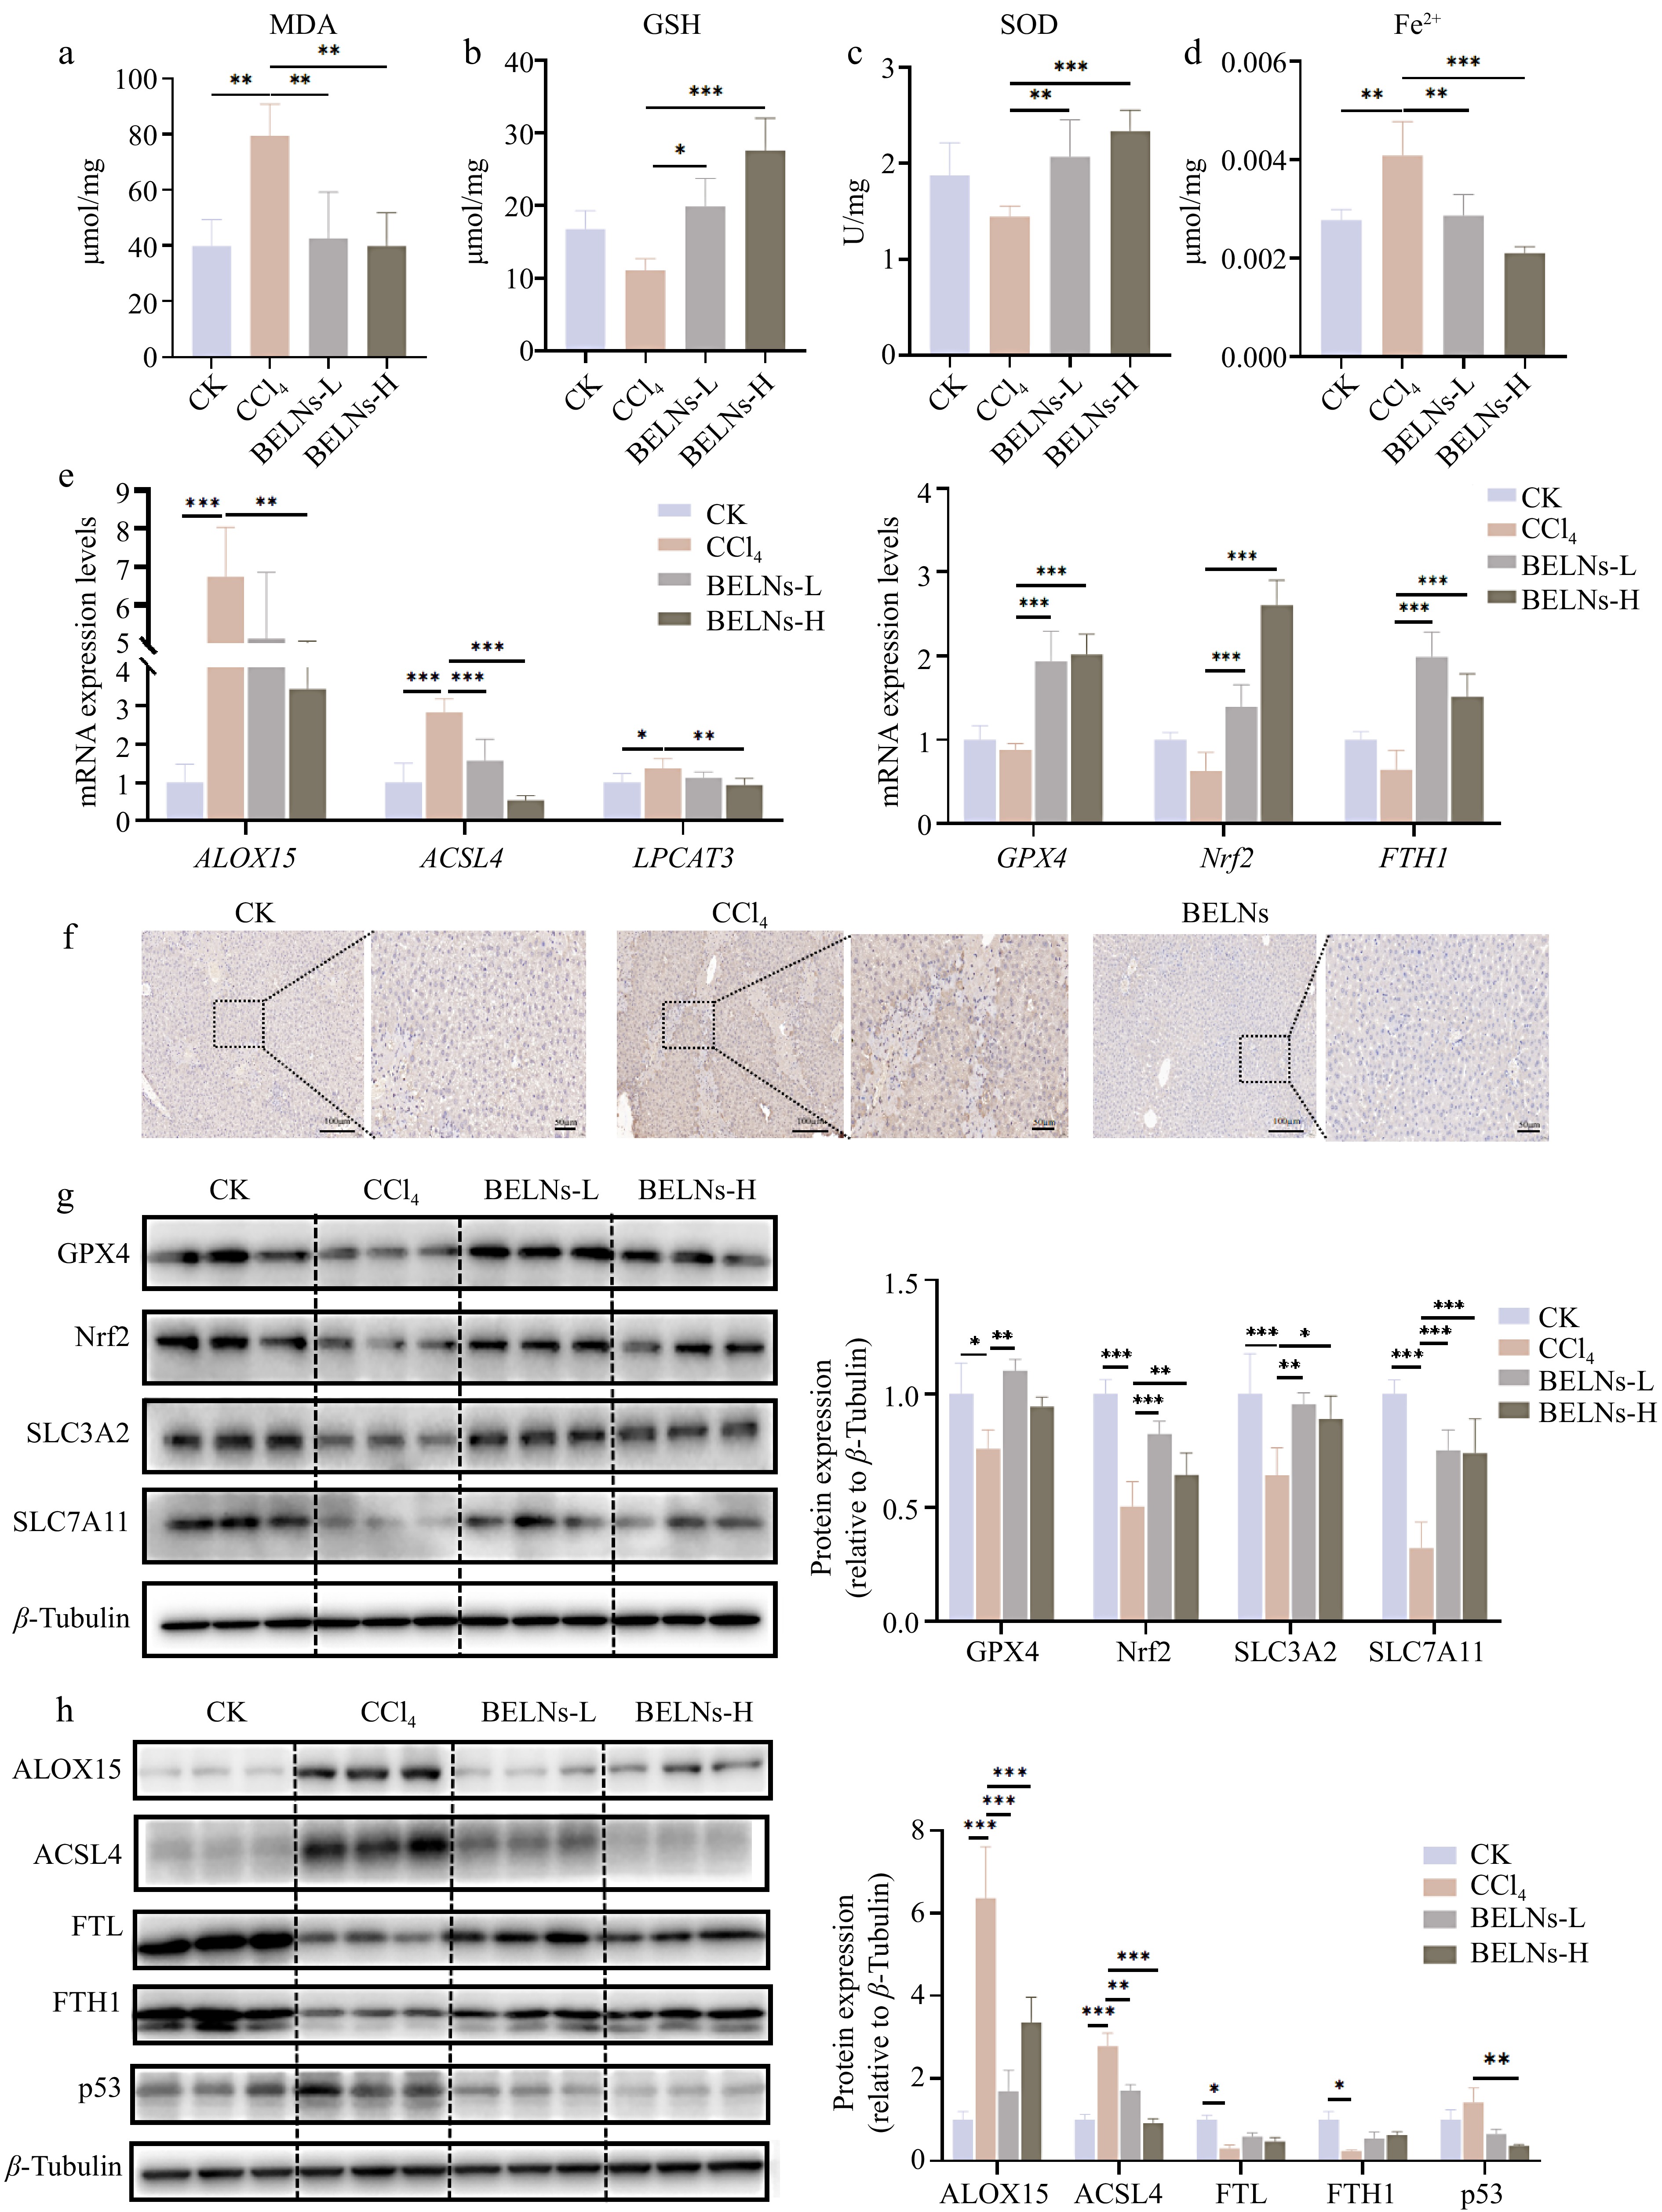
Figure 3.
The expression levels of various indicators in AML12 cells after administration of CCl4 and BELNs. (a) MDA levels of AML12 cells. (b) GSH levels of AML12 cells. (c) SOD levels of AML12 cells. (d) Fe2+ levels of AML12 cells. (e) mRNA expression profiles: left panel shows ALOX15, ACSL4, and LPCAT3; right panel displays GPX4, Nrf2, and FTH1; bottom panel presents IL-6 and TNF-α. (f) Immunohistochemical detection of 4-HNE adducts. (g) Immunoblot analysis of GPX4, Nrf2, SLC3A2, and SLC7A11 proteins. (h) Western blot detection of ALOX15, ACSL4, FTL, FTH1, and p53 expression. β-tubulin were used as loading controls. * p < 0.05, ** p < 0.01, *** p < 0.001.
-
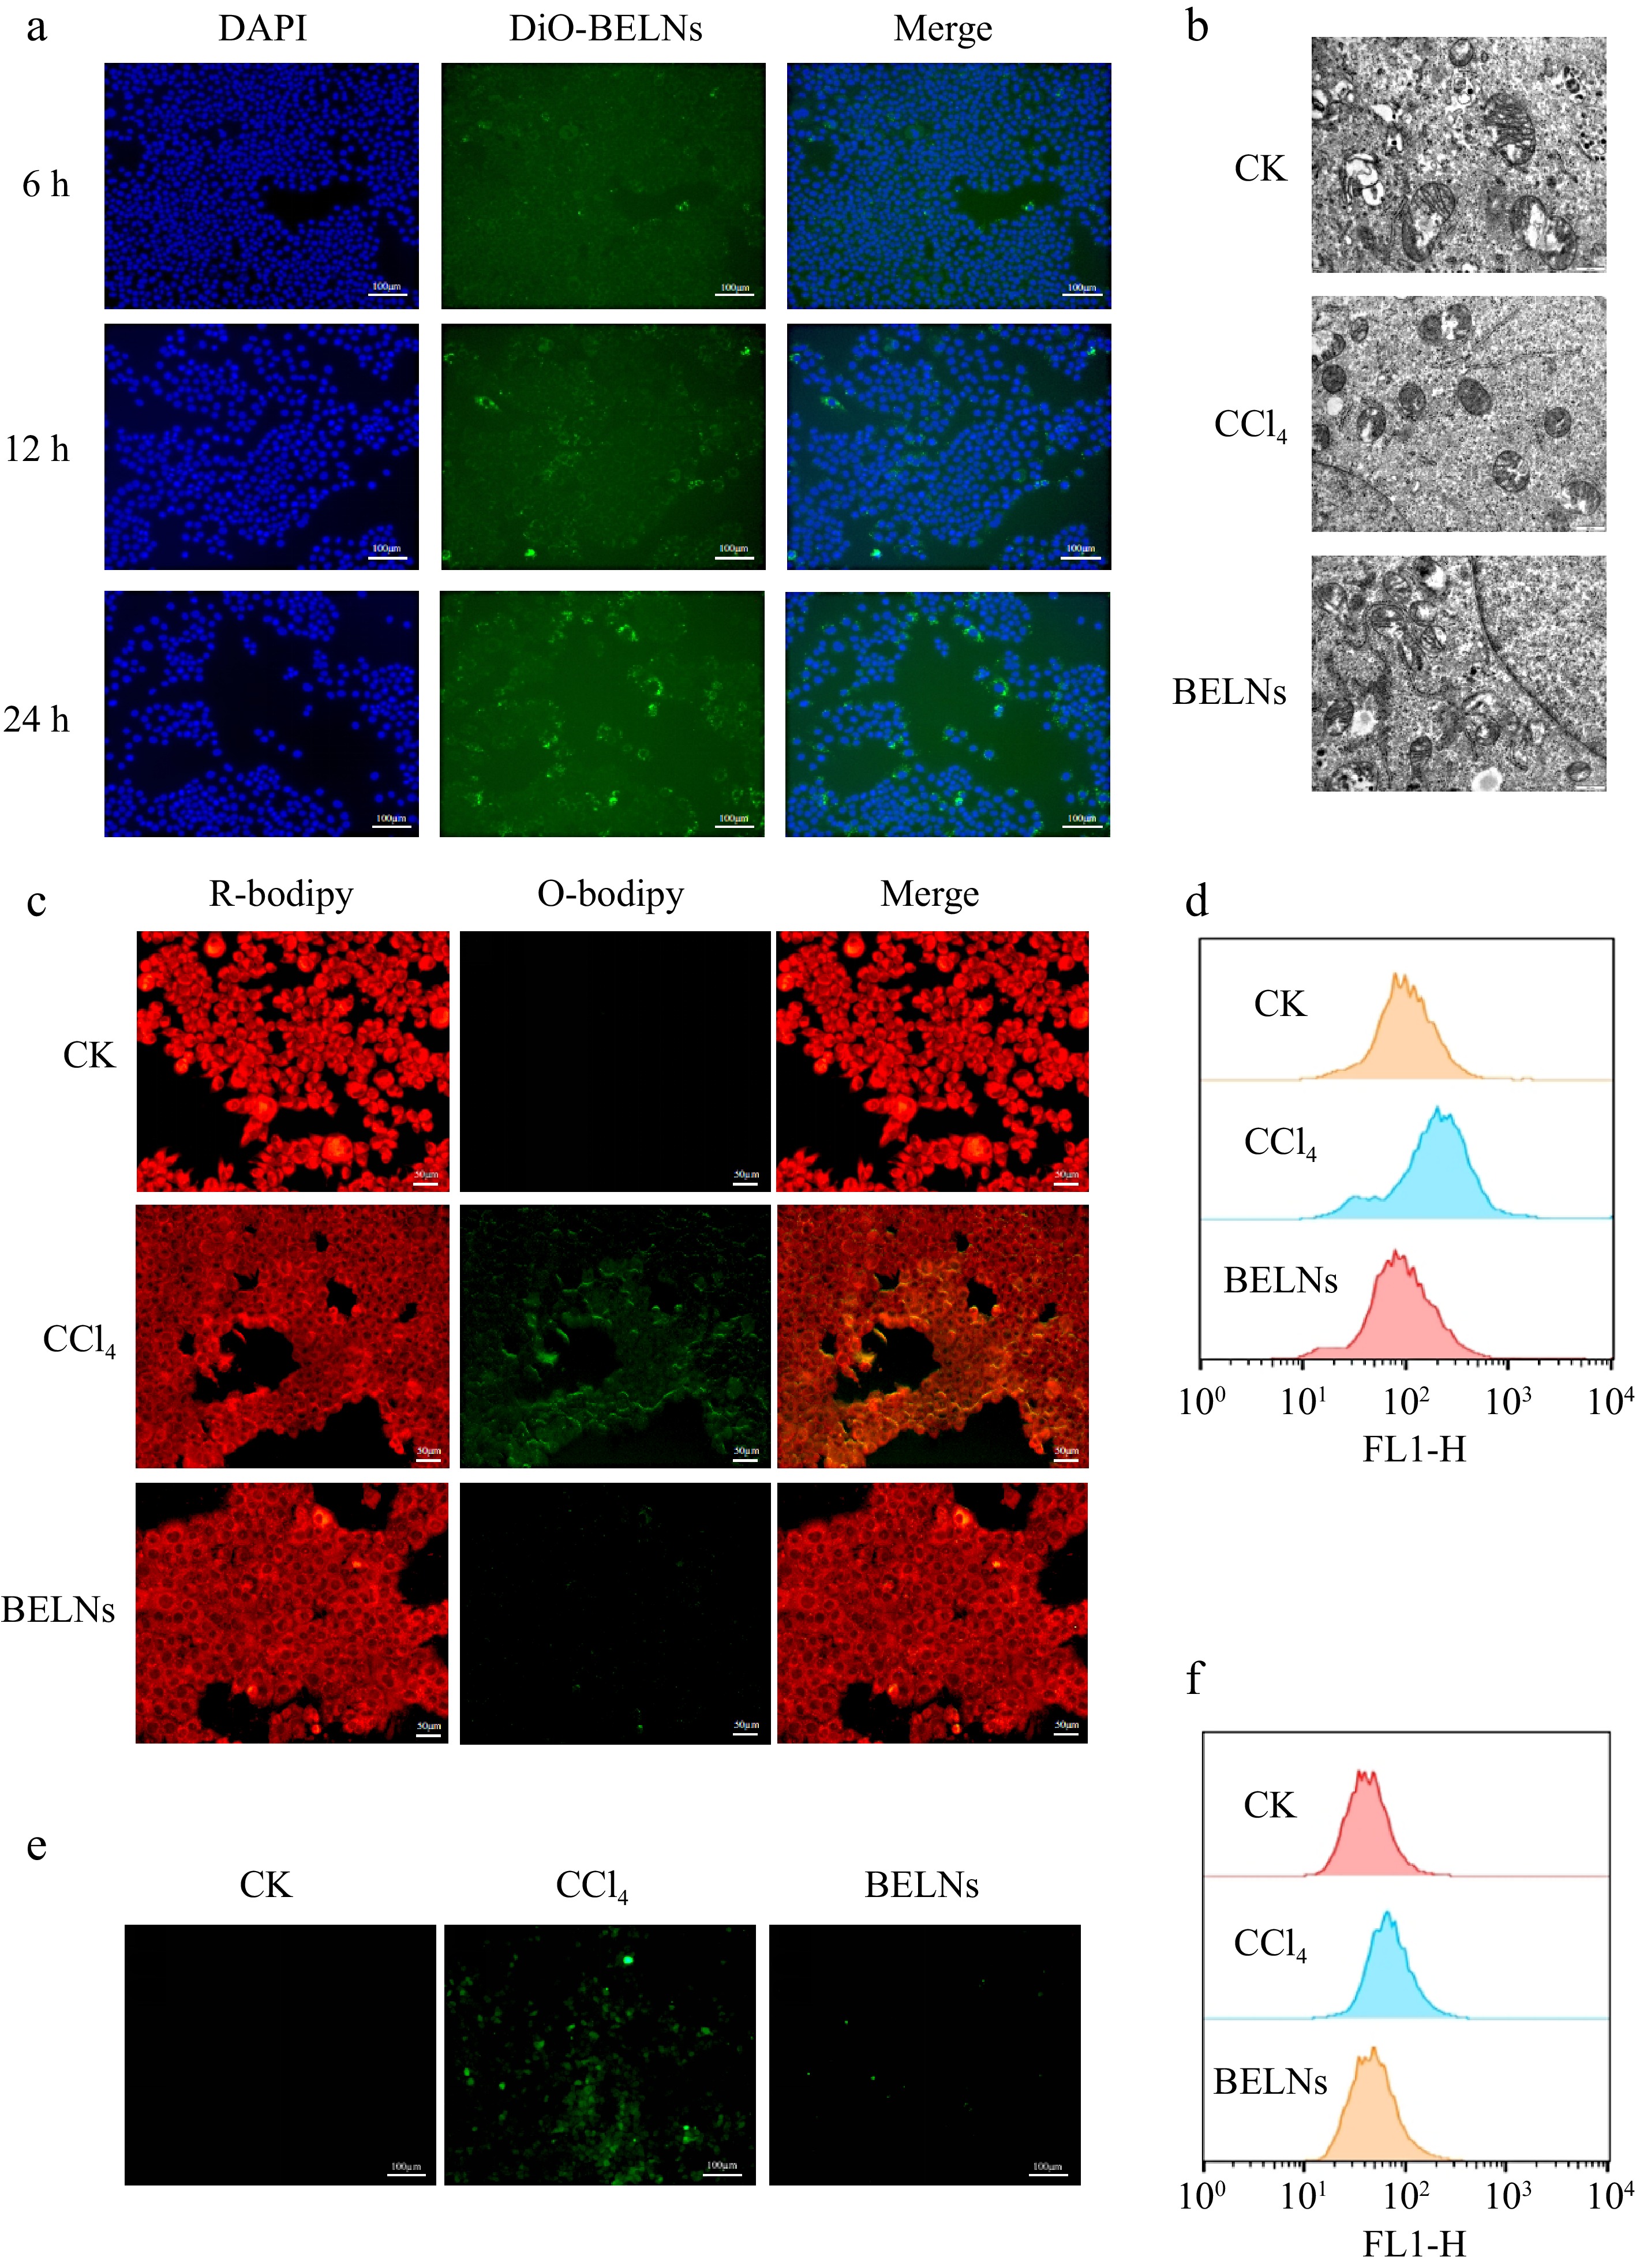
Figure 4.
Cellular uptake and therapeutic effects of BELNs in AML12 hepatocytes. (a) Internalization analysis of BELNs by AML12 cells. (b) Mitochondrial ultrastructure examination via transmission electron microscopy across treatment conditions. (c) BODIPY C11 fluorescence imaging and corresponding flow cytometric quantification (d) of lipid peroxidation. (e) DCFH-DA fluorescence visualization, and (f) subsequent flow cytometric analysis of intracellular ROS levels.
-
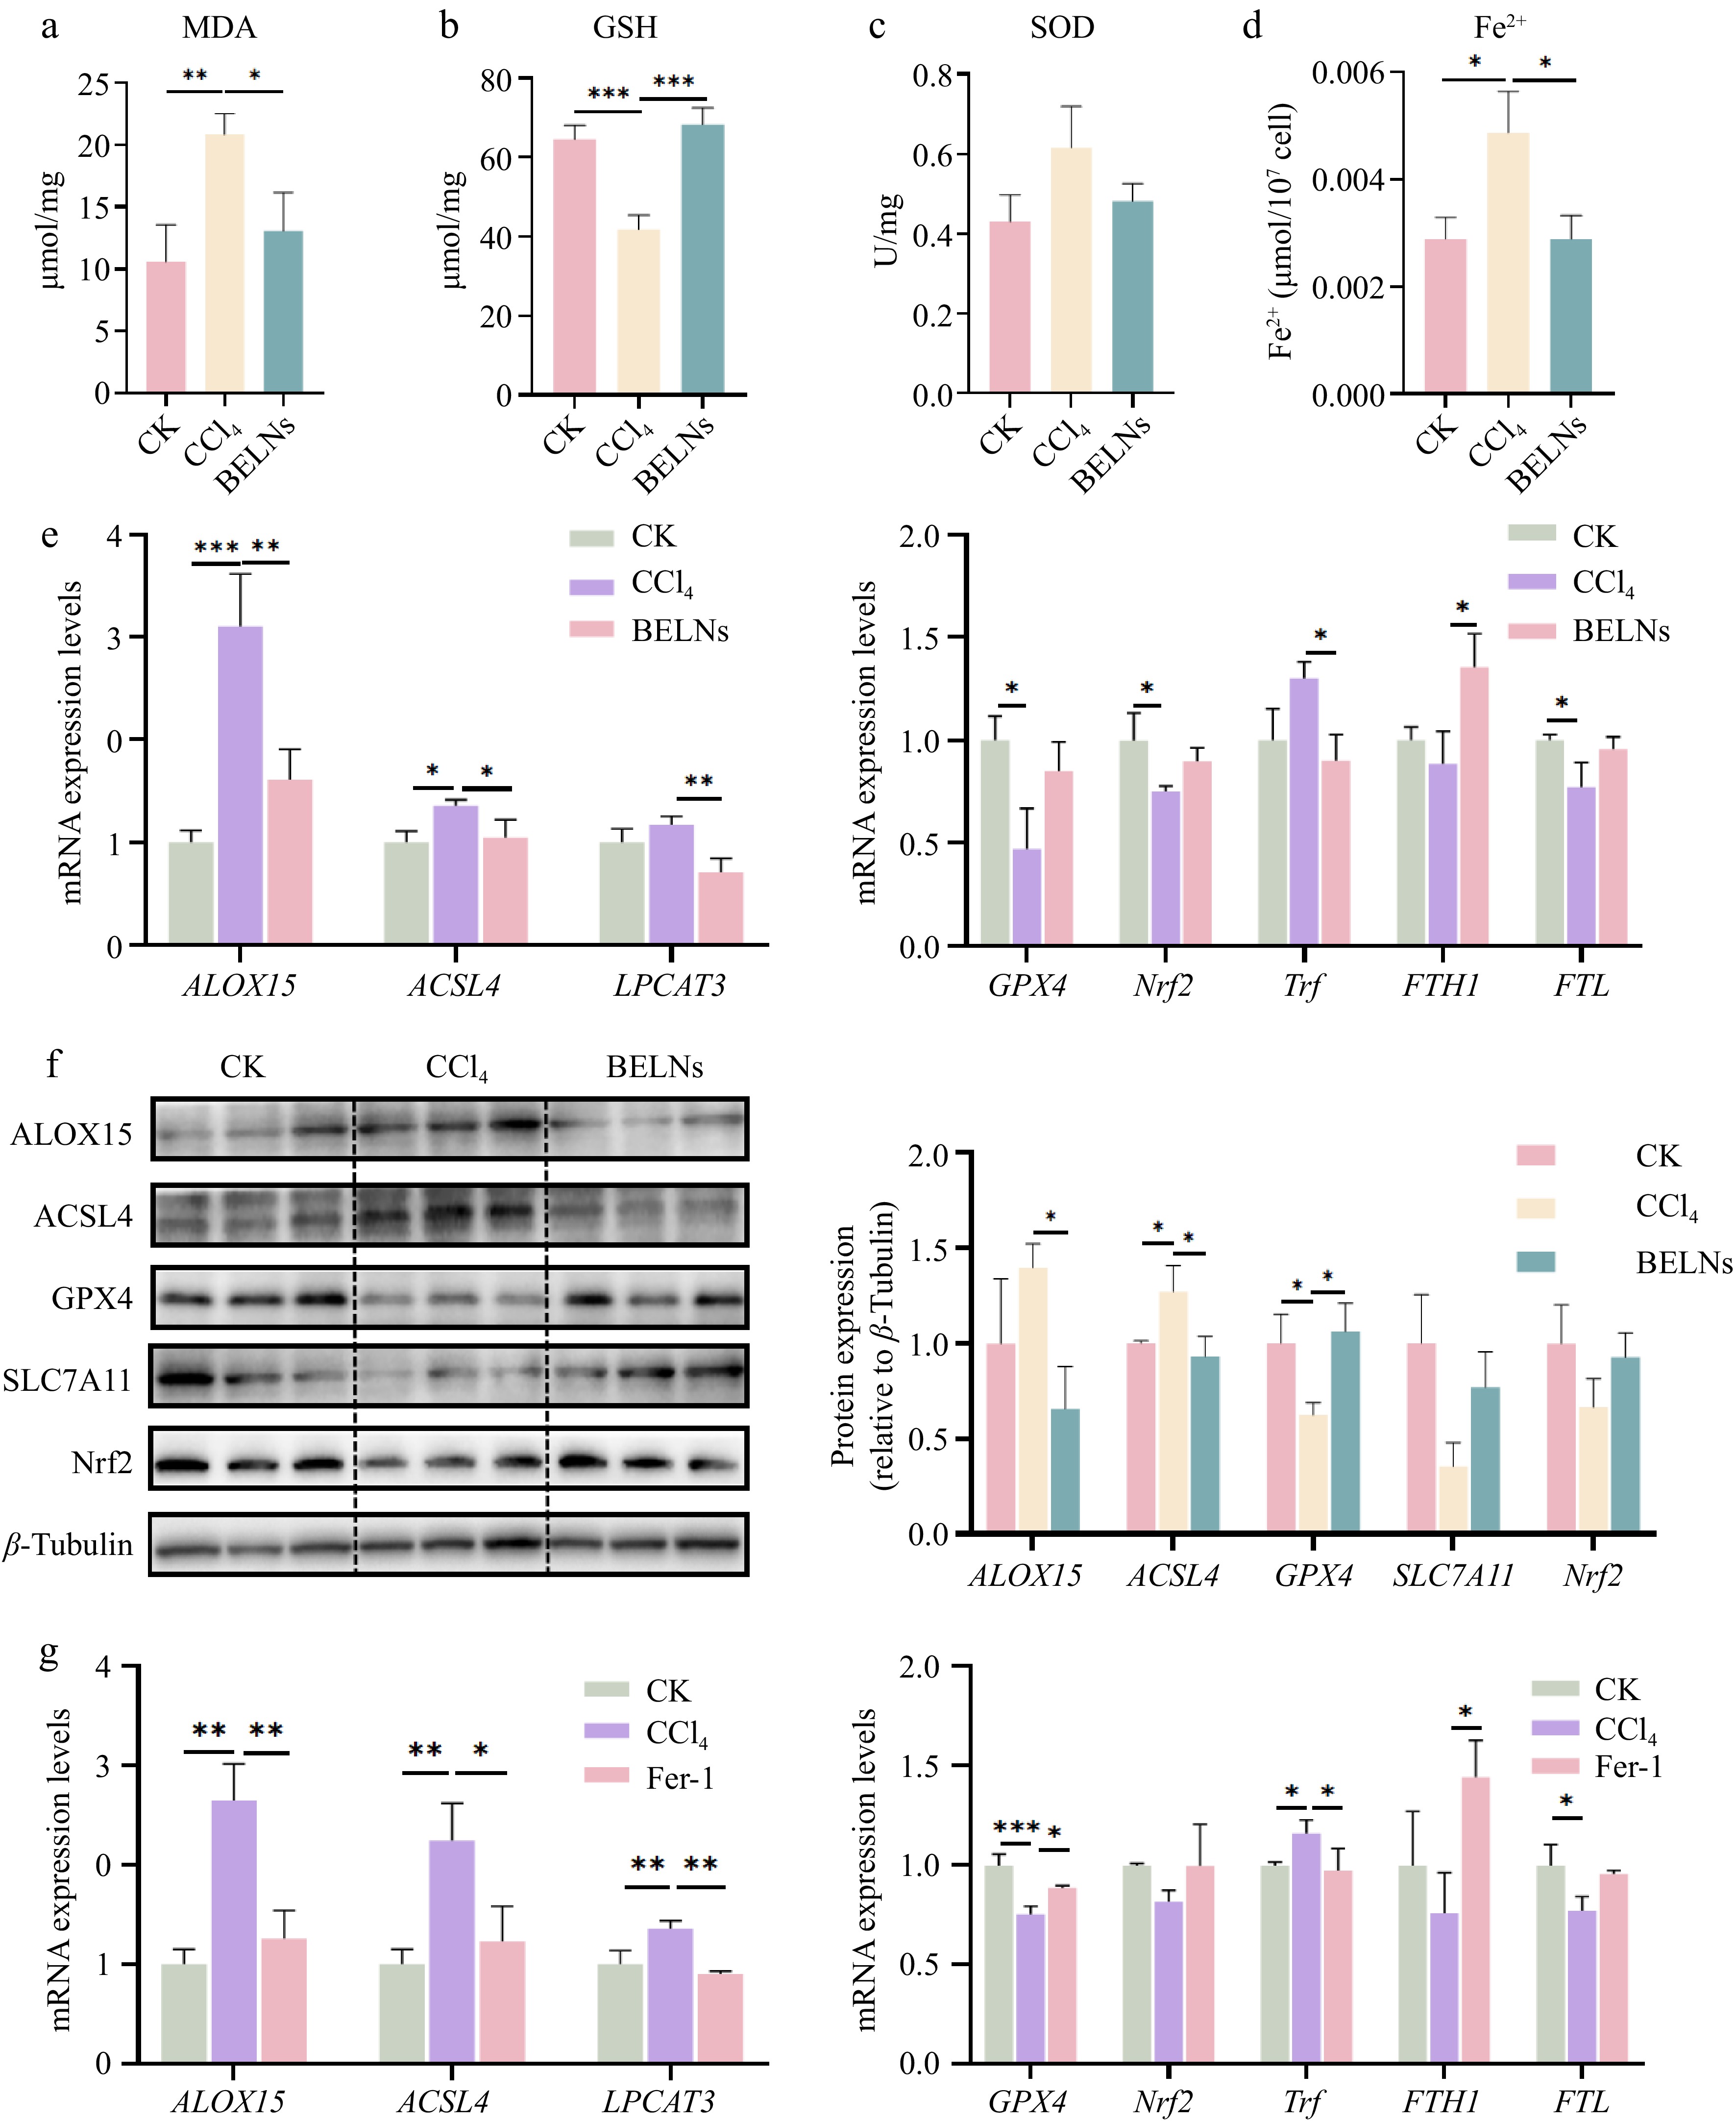
Figure 5.
The expression levels of various indicators in AML12 cells after administration of CCl4, BELNs and Fer-1. (a) MDA levels of AML12 cells. (b) GSH levels of AML12 cells. (c) SOD levels of AML12 cells. (d) Fe2+ levels of AML12 cells. (e) mRNA expression analysis: left - ALOX15, ACSL4, LPCAT3; right - GPX4, Nrf2, Trf, FTH1, FTL. (f) Protein immunoblots of key pathway components (ALOX15, ACSL4, GPX4, SLC7A11, Nrf2). β-tubulin was used as loading controls. (g) qPCR results for GPX4, Nrf2, Trf, FTH1, and FTL expression following Fer-1 treatment. * p < 0.05, ** p < 0.01, *** p < 0.001.
-
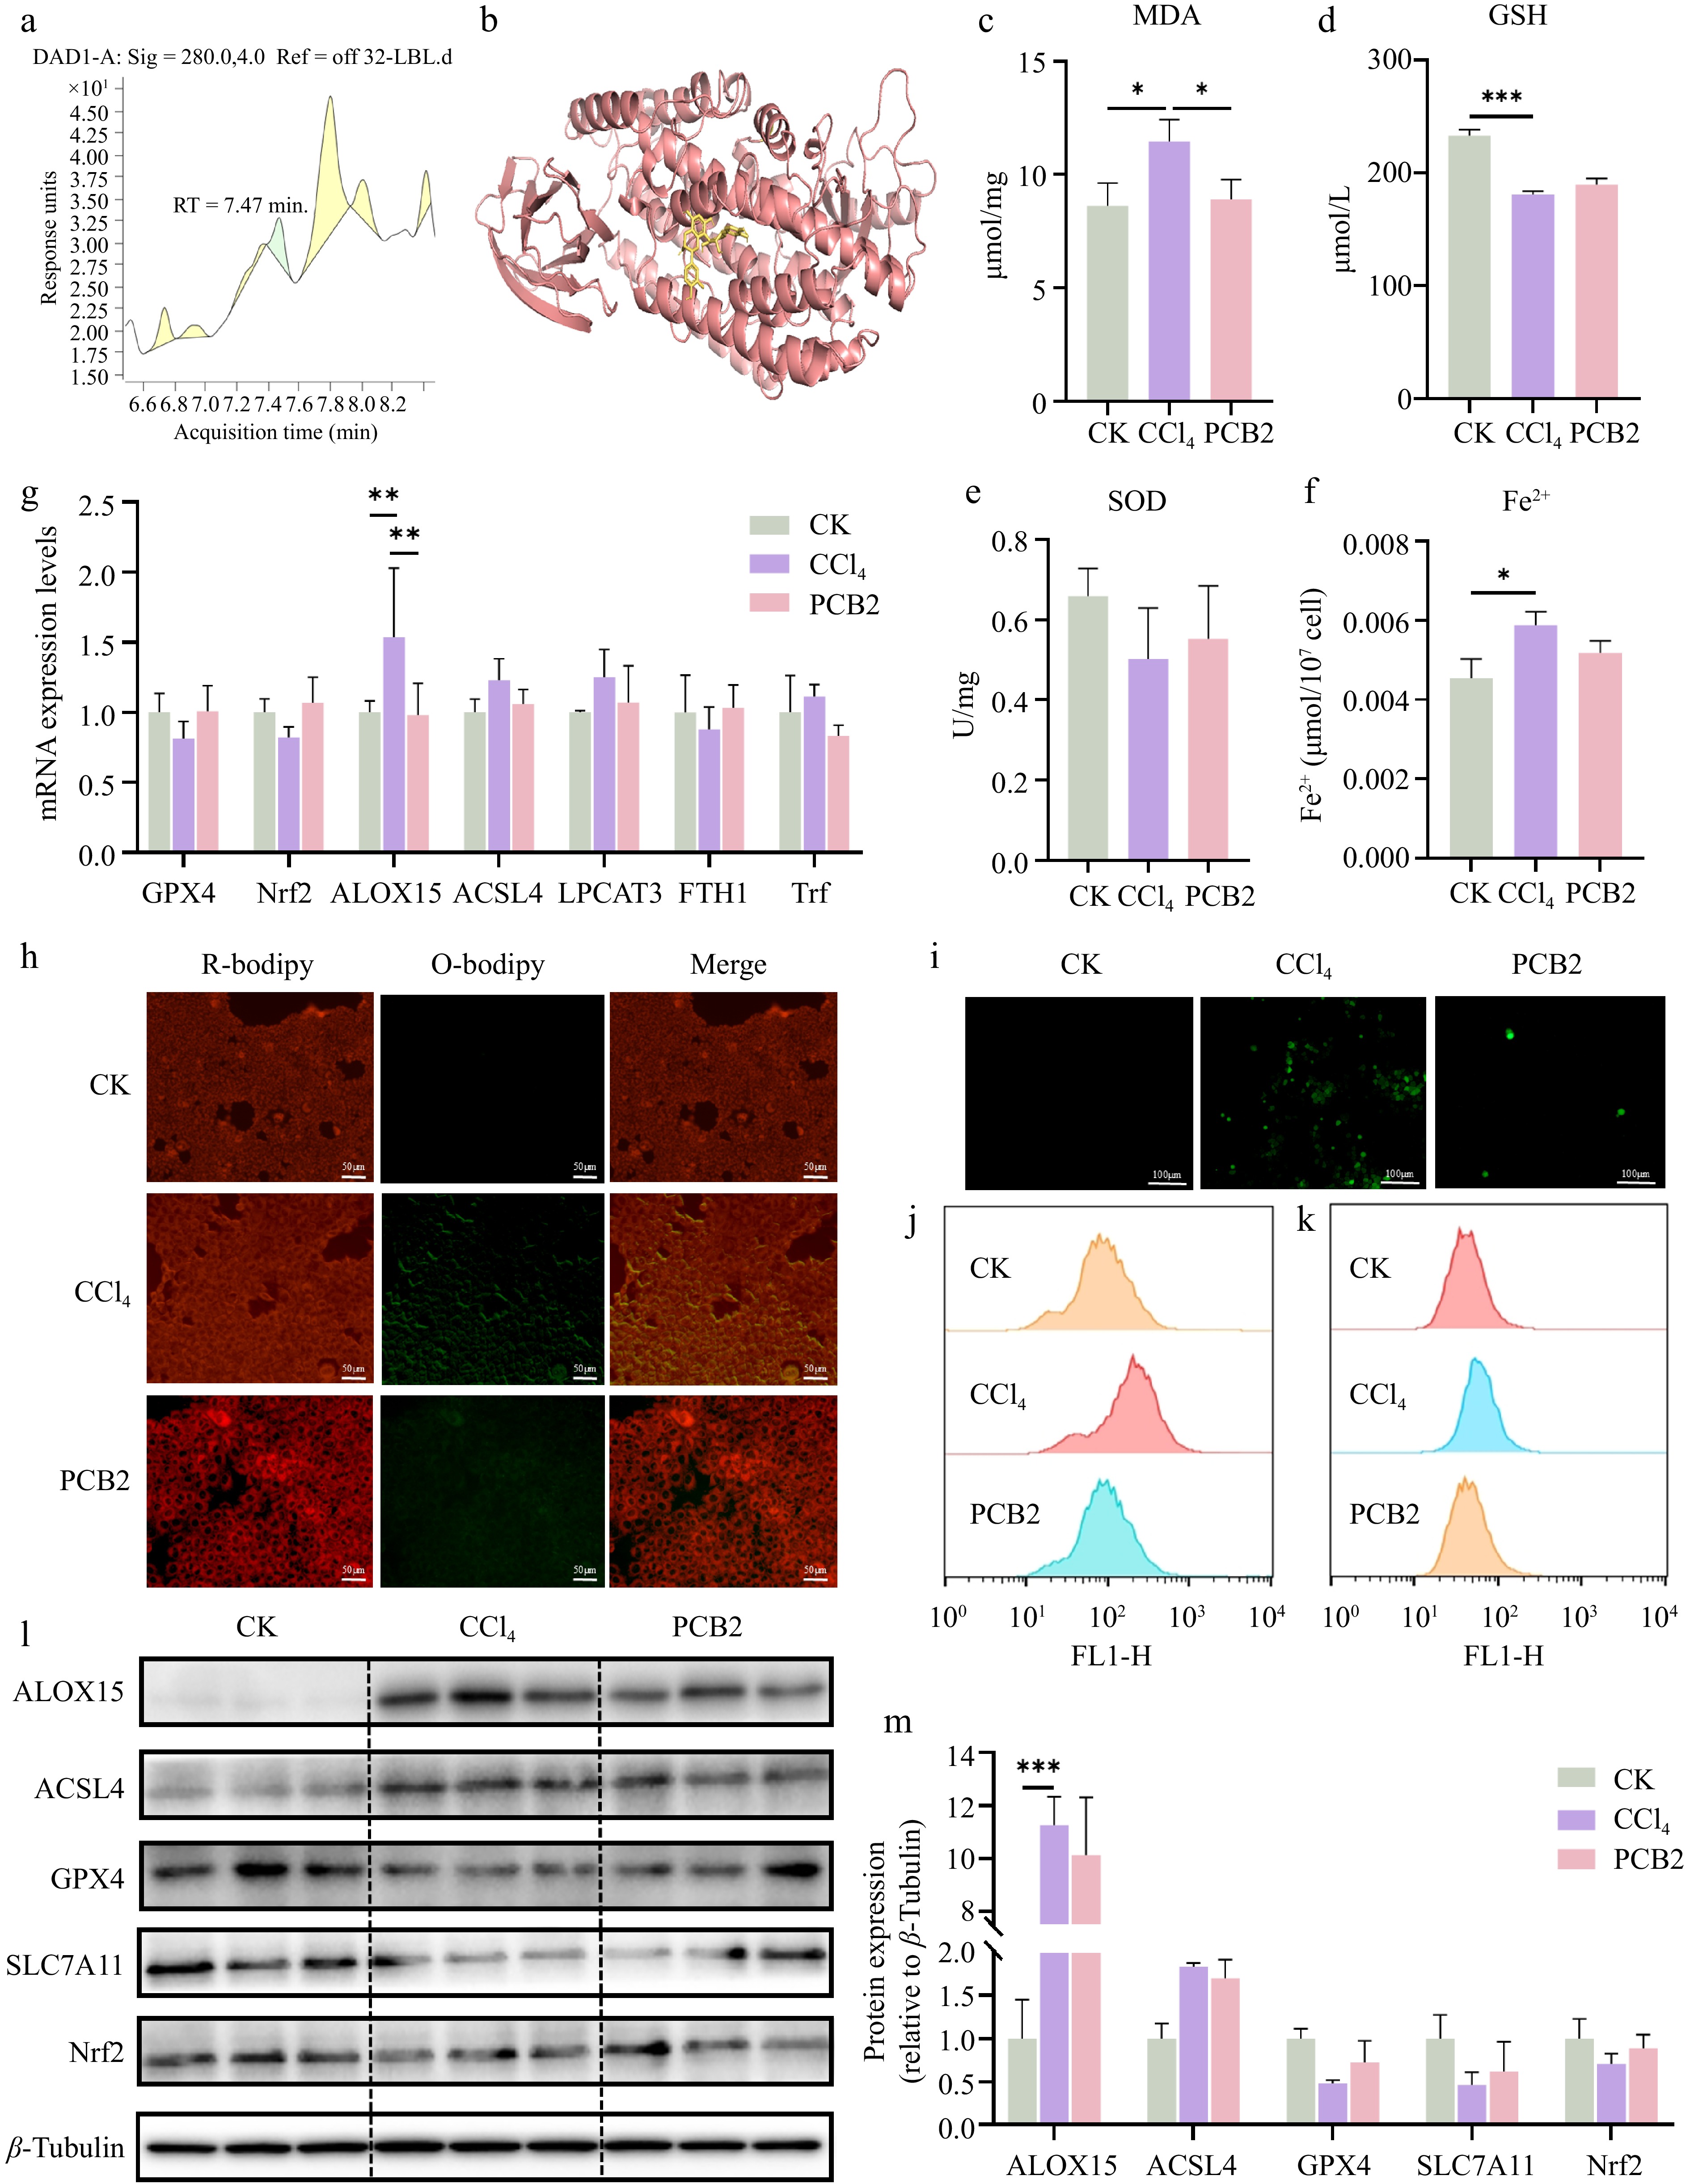
Figure 6.
The expression levels of different indicators in AML12 cells treated with CCl4 and PCB2. (a) Non-targeted metabolomics of BELNs. (b) Molecular docking analysis using CB-Dock predicted specific binding interactions between ALOX15 and PCB2, revealing potential active sites and binding affinities. (c) MDA levels of AML12 cells. (d) GSH levels of AML12 cells. (e) SOD levels of AML12 cells. (f) Fe2+ levels of AML12 cells. (g) qPCR results for GPX4, Nrf2, ALOX15, ACSL4, LPCAT3, FTH1, and Trf expression. (h)−(k) Lipid peroxidation (C11) and ROS detection by fluorescence microscopy and flow cytometry. (l)−(m) Protein expression analysis of key pathway regulators. β-tubulin was used as loading controls. * p < 0.05, ** p < 0.01, *** p < 0.001.
-
Gene Forward sequences (5'-3') Reverse sequences (3'-5') ALOX15 GGCTCCAACAACGAGGTCTAC AGGTATTCTGACACATCCACCTT ACSL4 CTCACCATTATATTGCTGCCTGT TCTCTTTGCCATAGCGTTTTTCT LPCAT3 GACGGGGACATGGGAGAGA GTAAAACAGAGCCAACGGGTAG GPX4 AGGAGCCAGGAAGTAATCAAGAA GCTAGAGATACCACGCAGGT Nrf2 CTTTAGTCAGCGACAGAAGGAC AGGCATCTTGTTTGGGAATGTG Trf AGGAGCCAGGAAGTAATCAAGAA GCTAGAGATACCACGCAGGT FTH1 TCCTACGTTTACCTGTCCATGT GTTTGTGCAGTTCCAGTAGTGA FTL CAGCCTGGTCAATTTGTACCT GCCAATTCGCGGAAGAAGTG GAPDH GGTTGTCTCCTGCGACTTCA TGGTCCAGGGTTTCTTACTCC Table 1.
Primer sequences.
Figures
(6)
Tables
(1)