-
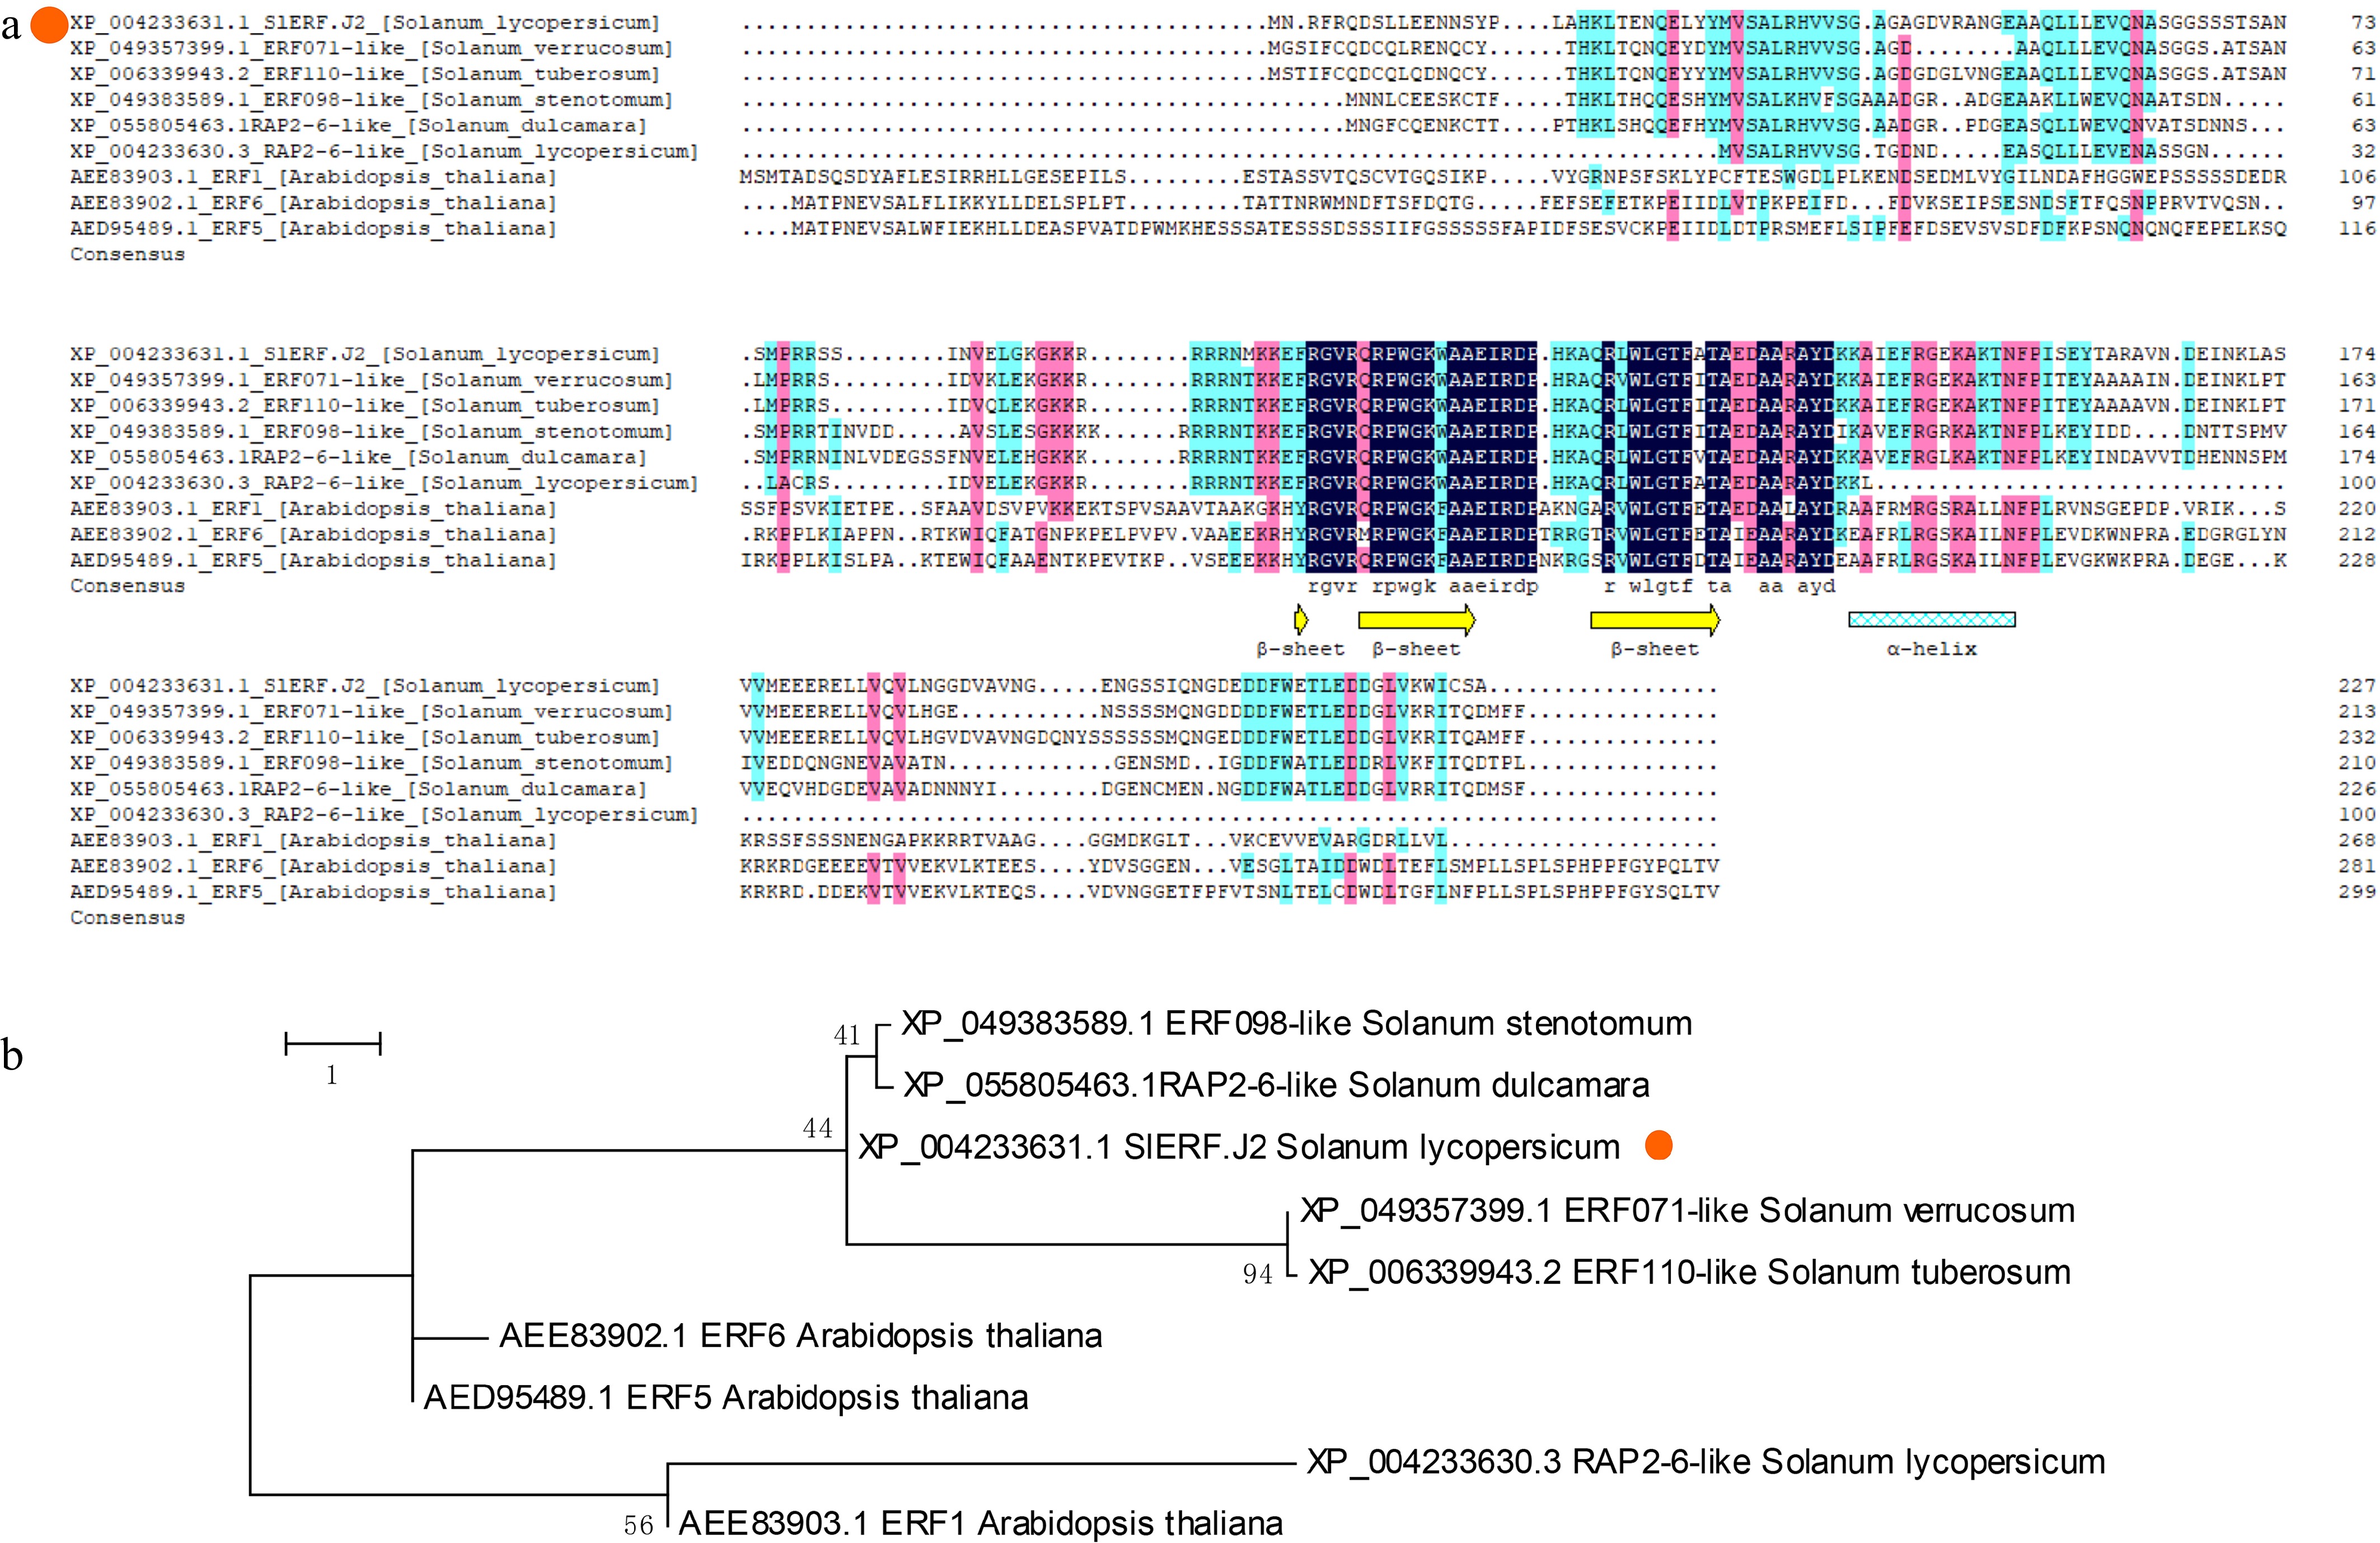
Figure 1.
Sequence analysis of SlERF.J2. (a) SlERF.J2 and other ERF protein sequences were aligned comparatively. Conserved amino acid residues are marked with black shading. The protein structure of SlERF.J2 contained three β-sheets and one α-helical domain. (b) Phylogenetic reconstruction relied on the neighbor-joining approach with 1,000 bootstrap repetitions; SlERF.J2 is labeled with a circle. The relevant protein accession numbers are SlERF.J2 (XP_004233631.1), SsERF098-like (XP_049383589.1), SdRAP-like (XP_055805463.1), SvERF071-like (XP_049357399.1), StERF110-like (XP_006339943.1), AtERF6 (AEE83902.1), AtERF5 (AED95489.1), SlRAP-6-like (XP_004233630.3), and AtERF1 (AEE83903.1).
-
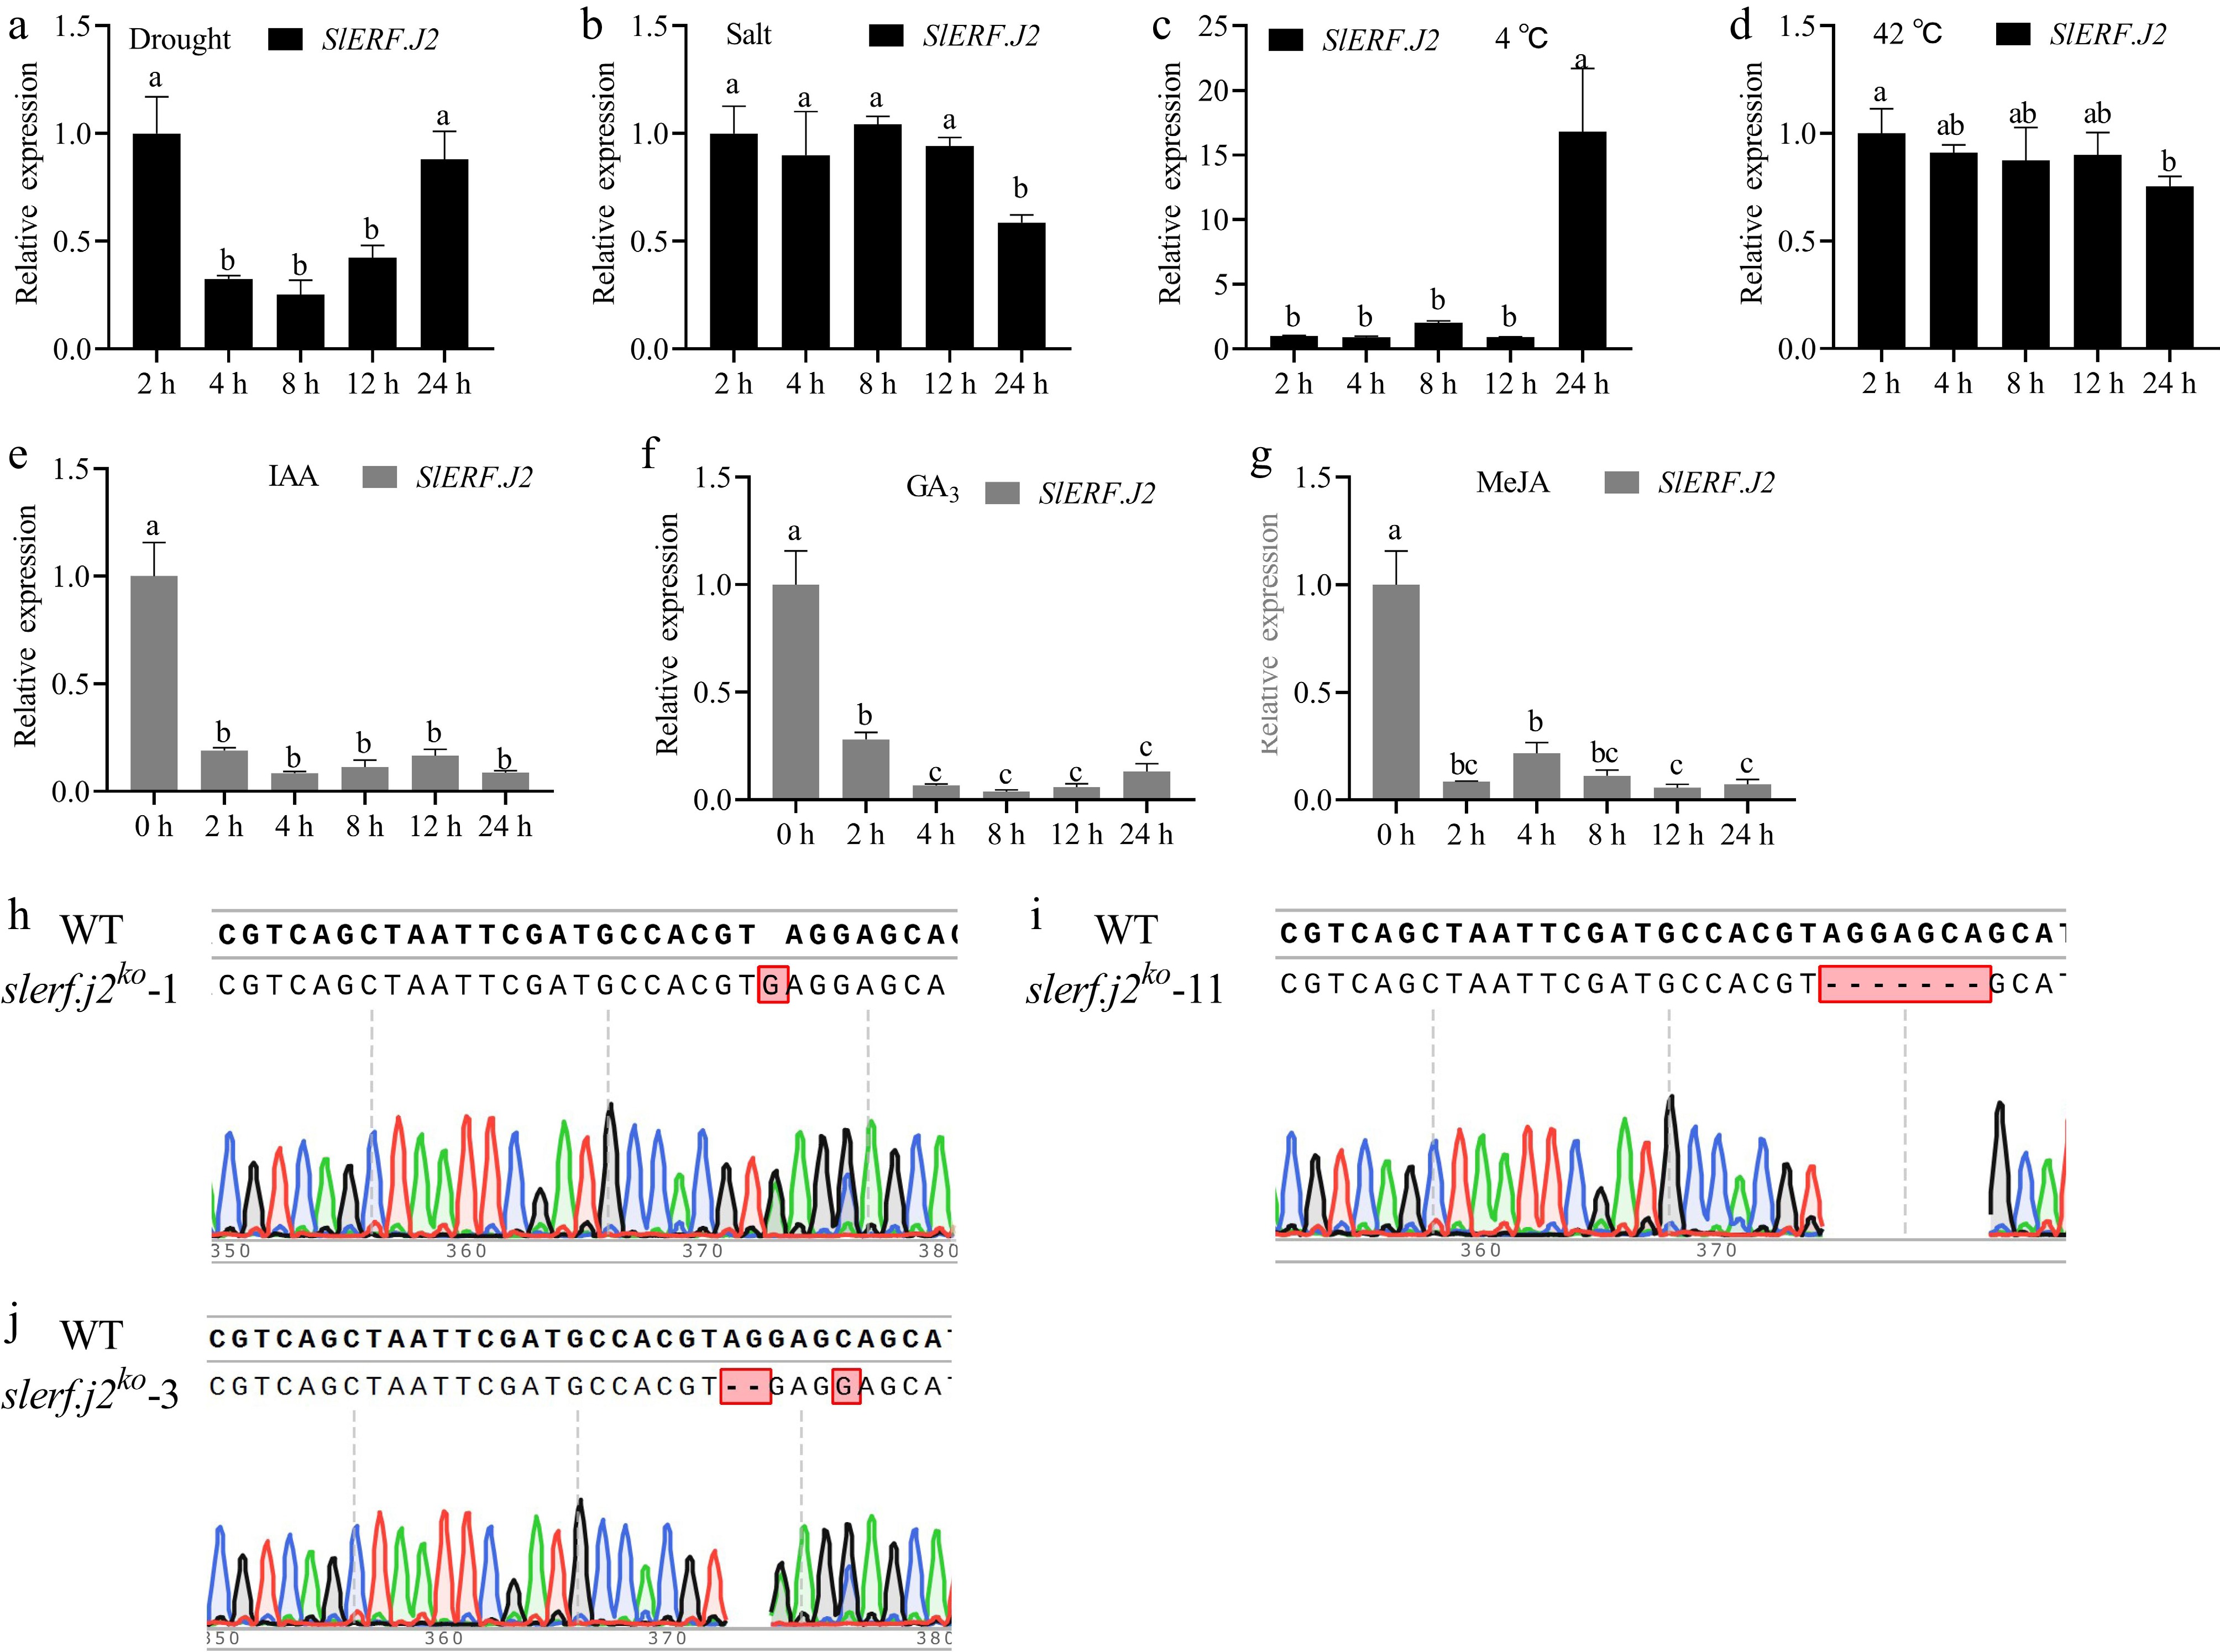
Figure 2.
Transcript abundance of SlERF.J2 under abiotic constraints and hormone stimuli, alongside functional verification for CRISPR-generated slerf.j2 knockout materials. (a)–(g) Time-related expression patterns of SlERF.J2 under different treatments: Drought, salt, 4 °C (cold), 42 °C (heat), IAA, GA3, and MeJA. Values are presented as the mean ± standard error (SE) from three independent biological replicates. Significant differences among groups were determined by one-way ANOVA and are marked with disparate lowercase letters. (h)–(j) Validation of the mutation sites in slerf.j2 knockout lines (ko-1, ko-3, and ko-11) via Sanger sequencing.
-
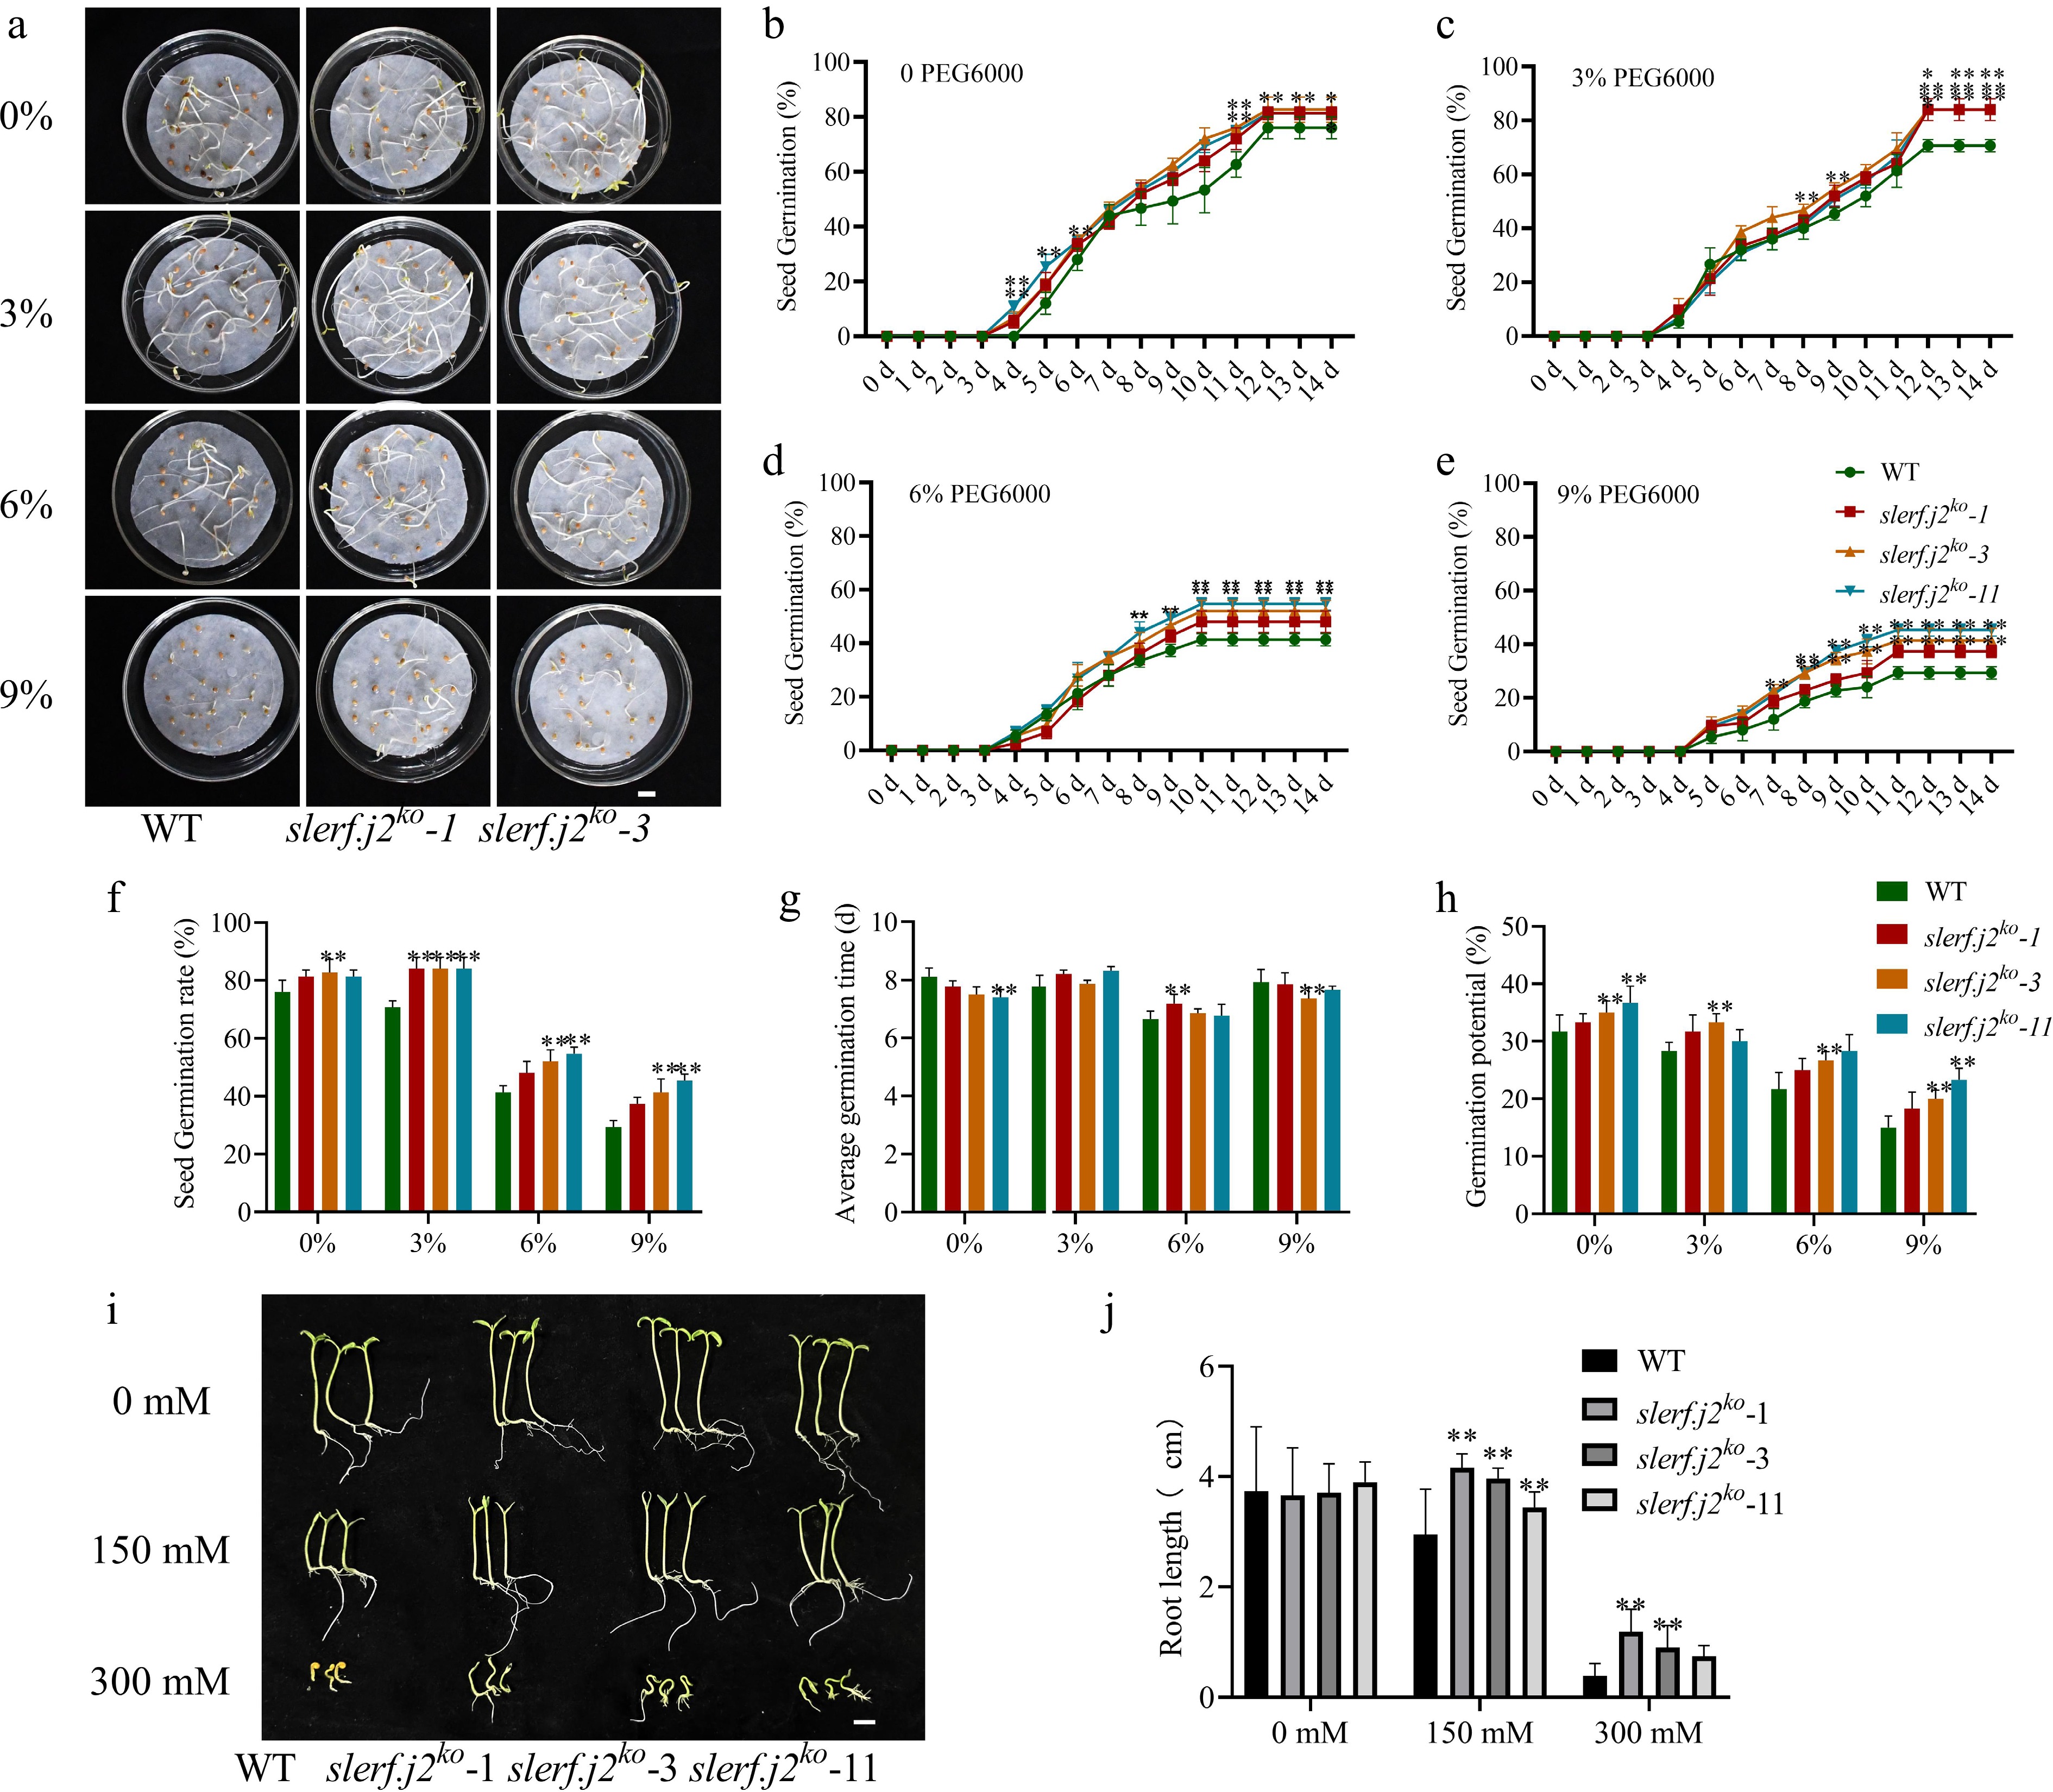
Figure 3.
Loss-of-function slerf.j2 mutants gained increased tolerance to PEG6000 and mannitol-induced osmotic stress during seed germination and post-germination seedling establishment. (a) Phenotypic analysis of seed germination in the WT and slerf.j2 knockout lines under varying PEG6000 stress levels. The images display the germination status of seeds in Petri dishes under different drought-simulating osmotic stress conditions. (b)–(e) Profiles of the germination rate over time of WT and slerf.j2ko lines under the (b) 0%, (c) 3%, (d) 6%, and (e) 9% PEG6000 treatment, respectively; data reflect the percentage of germinated seeds over time. (f) Statistical evaluation of the ultimate seed germination levels of the tested lines under graded PEG6000 stress conditions. (g) Average germination time of the WT and knockout lines under different PEG6000 treatments. (h) Germination potential of WT and knockout lines under different PEG6000 concentrations. Growth status of WT and knockout lines seedlings (n ≥ 25) cultured on MS media containing a gradient of PEG6000 concentrations (0%, 3%, 6%, 9%) for 5 days after germination to observe the phenotypic growth traits. (i) Seedling phenotypes of WT and knockout lines under treatment with different concentrations of mannitol (n ≥ 25). Scale bar = 1 cm. (j) Root length of WT and knockout materials determined along a mannitol concentration gradient. Student's t-test was used to assess statistical differences relative to the WT, with * p < 0.05 and ** p < 0.01 as the significance thresholds.
-
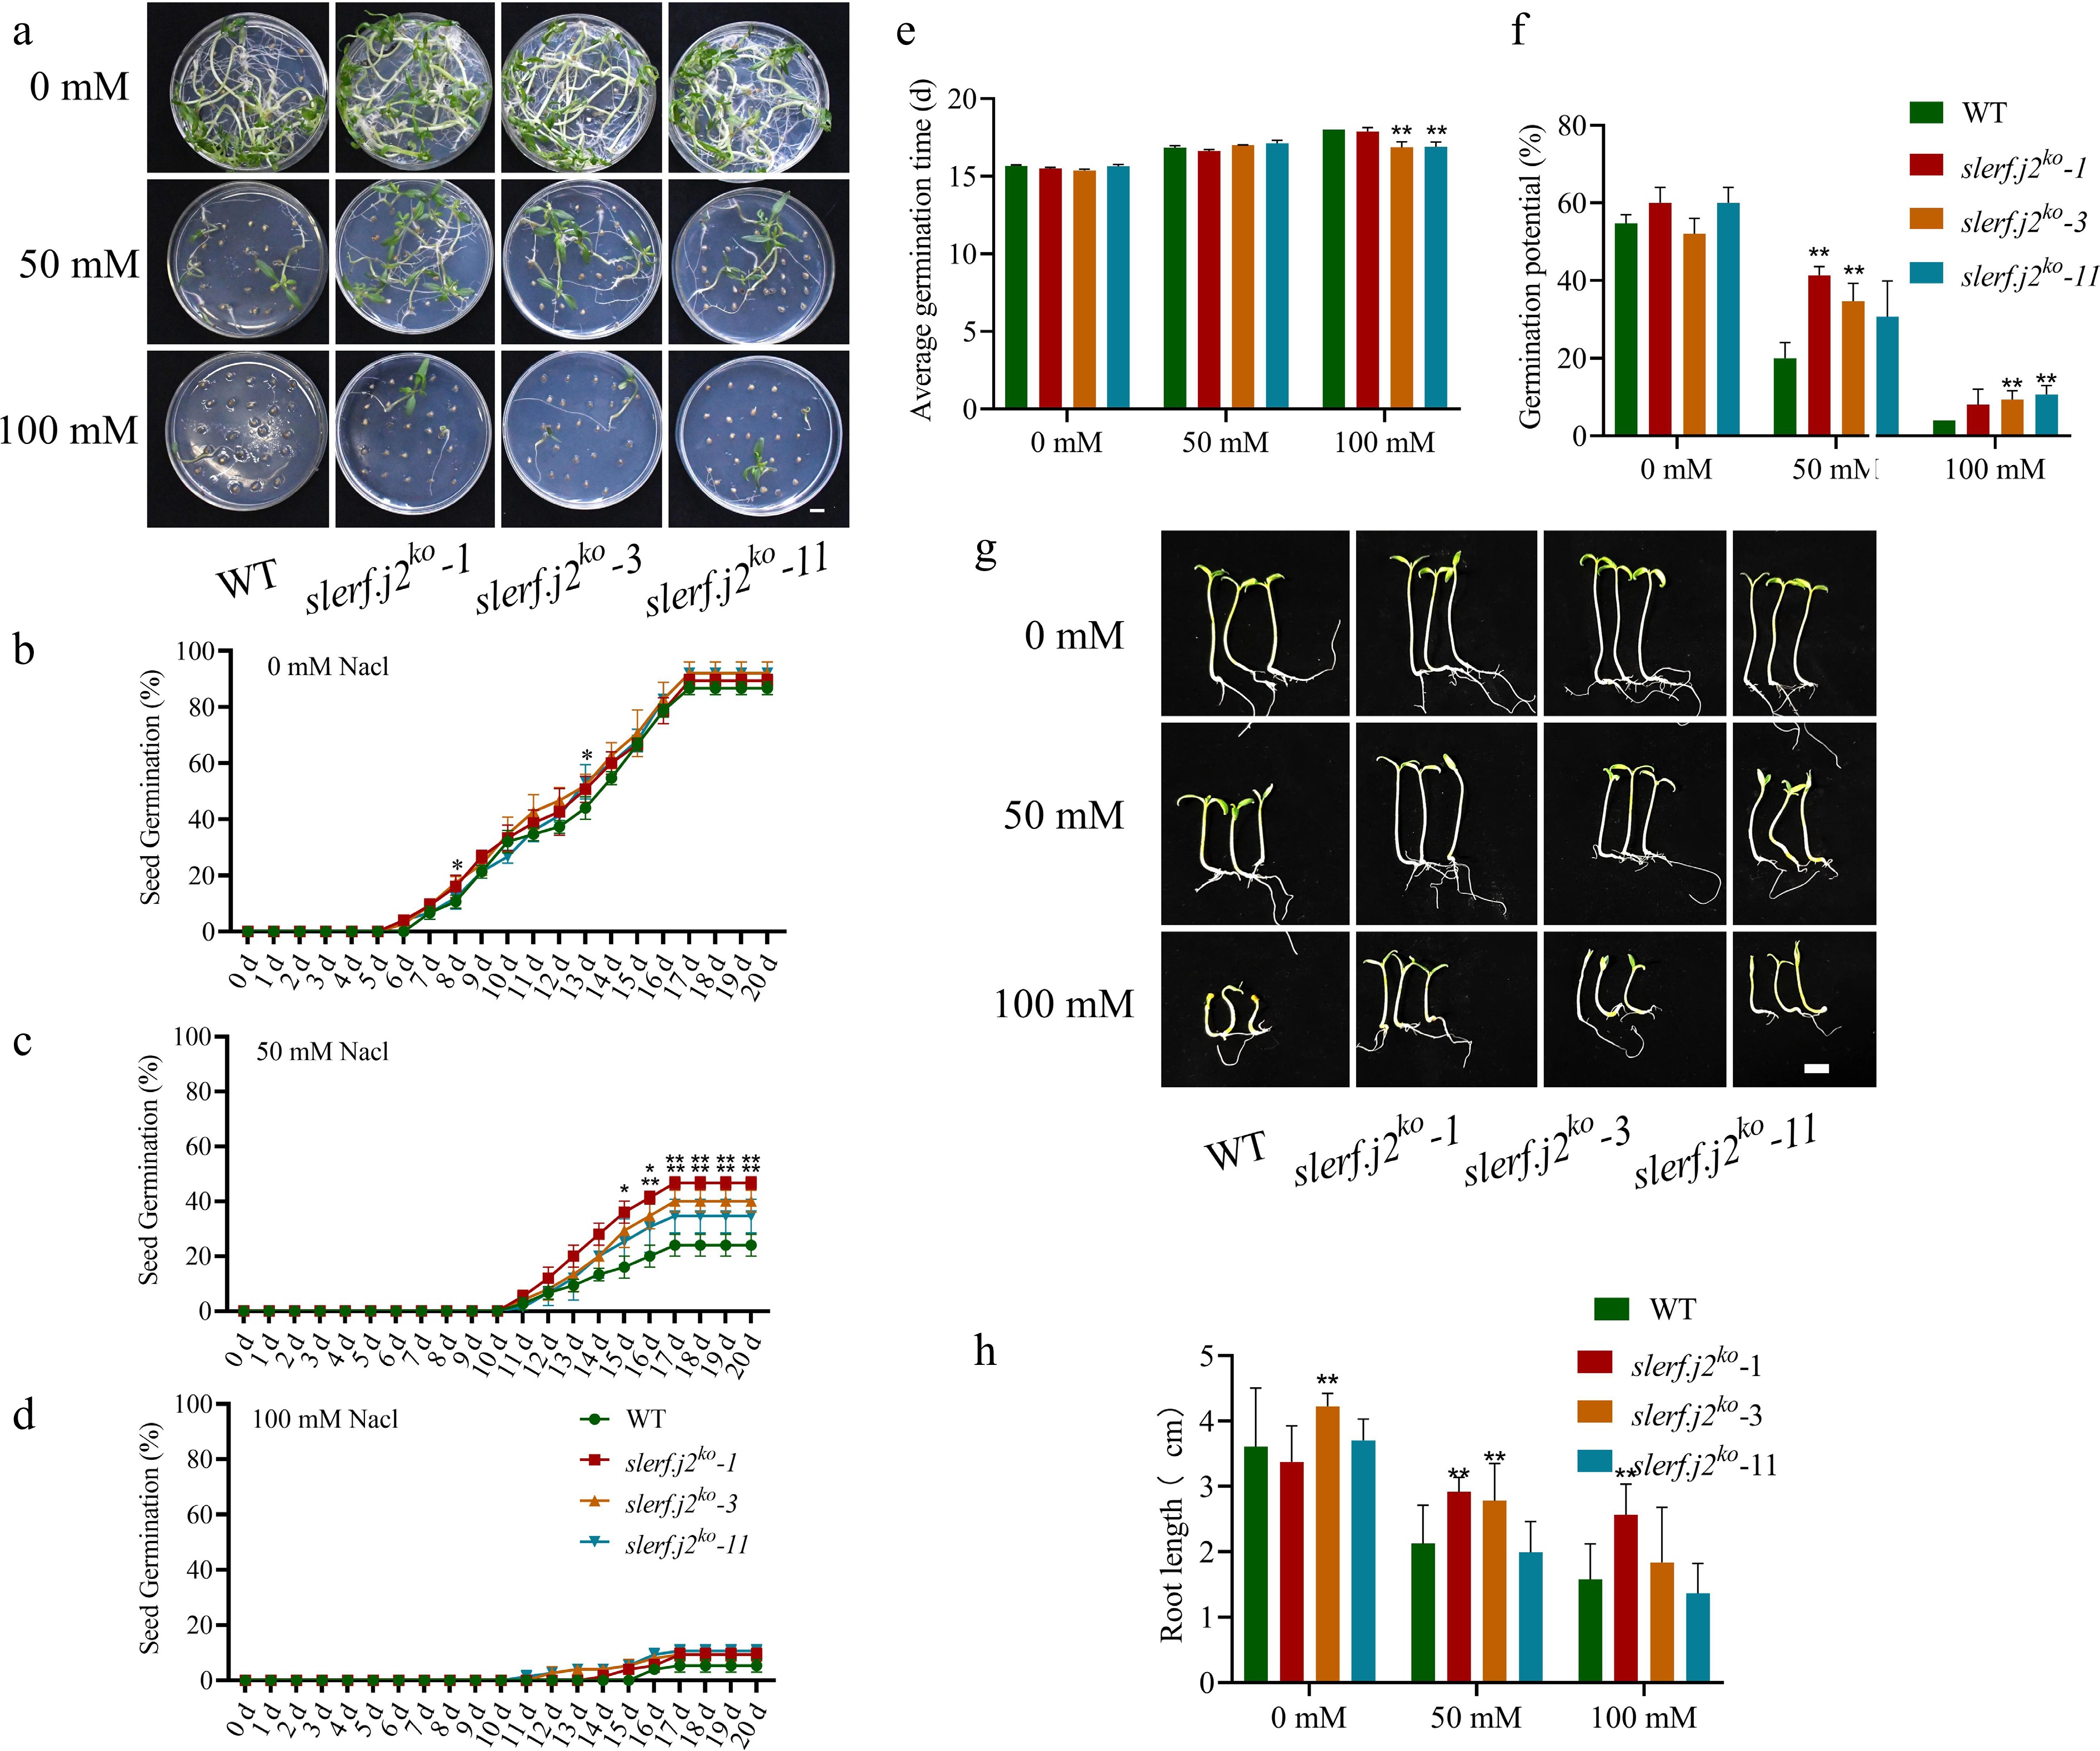
Figure 4.
The slerf.j2 mutants exhibited superior germination capacity and seedling growth under salt stress conditions. (a) Germination performance of WT and slerf.j2 knockout tomato lines (ko-1, ko-3, and ko-11) under gradient NaCl treatments (0, 50, and 100 mM). The images show the germination status of seeds in Petri dishes under different salt concentrations. (b)–(d) Germination rate curves across time for the genotypes under three NaCl concentrations: (b) 0 mM, (c) 50 mM, and (d) 100 mM; vertical data denote cumulative seed germination percentages at different time points. (e) Statistical analysis of the average germination time of WT and slerf.j2ko lines under different NaCl concentrations. (f) A comparison of germination potential between WT plants and slerf.j2 knockout lines under varying salinity treatments. (g) Seedling phenotypes of WT and slerf.j2ko lines (ko-1, ko-3, ko-11) treated with different concentrations of NaCl. The images display the root morphology of seedlings under different salt concentrations (scale bar = 1 cm). (h) Quantification of root length in WT and slerf.j2 mutant lines exposed to a gradient of NaCl treatments. Seedling growth of both lines (n ≥ 25) cultured on NaCl-supplemented MS medium for 5 d. Data are the mean ± standard error (SE). Statistical analysis was performed via Student's t-test; asterisks denote significant differences relative to the WT (* p < 0.05, ** p < 0.01).
-
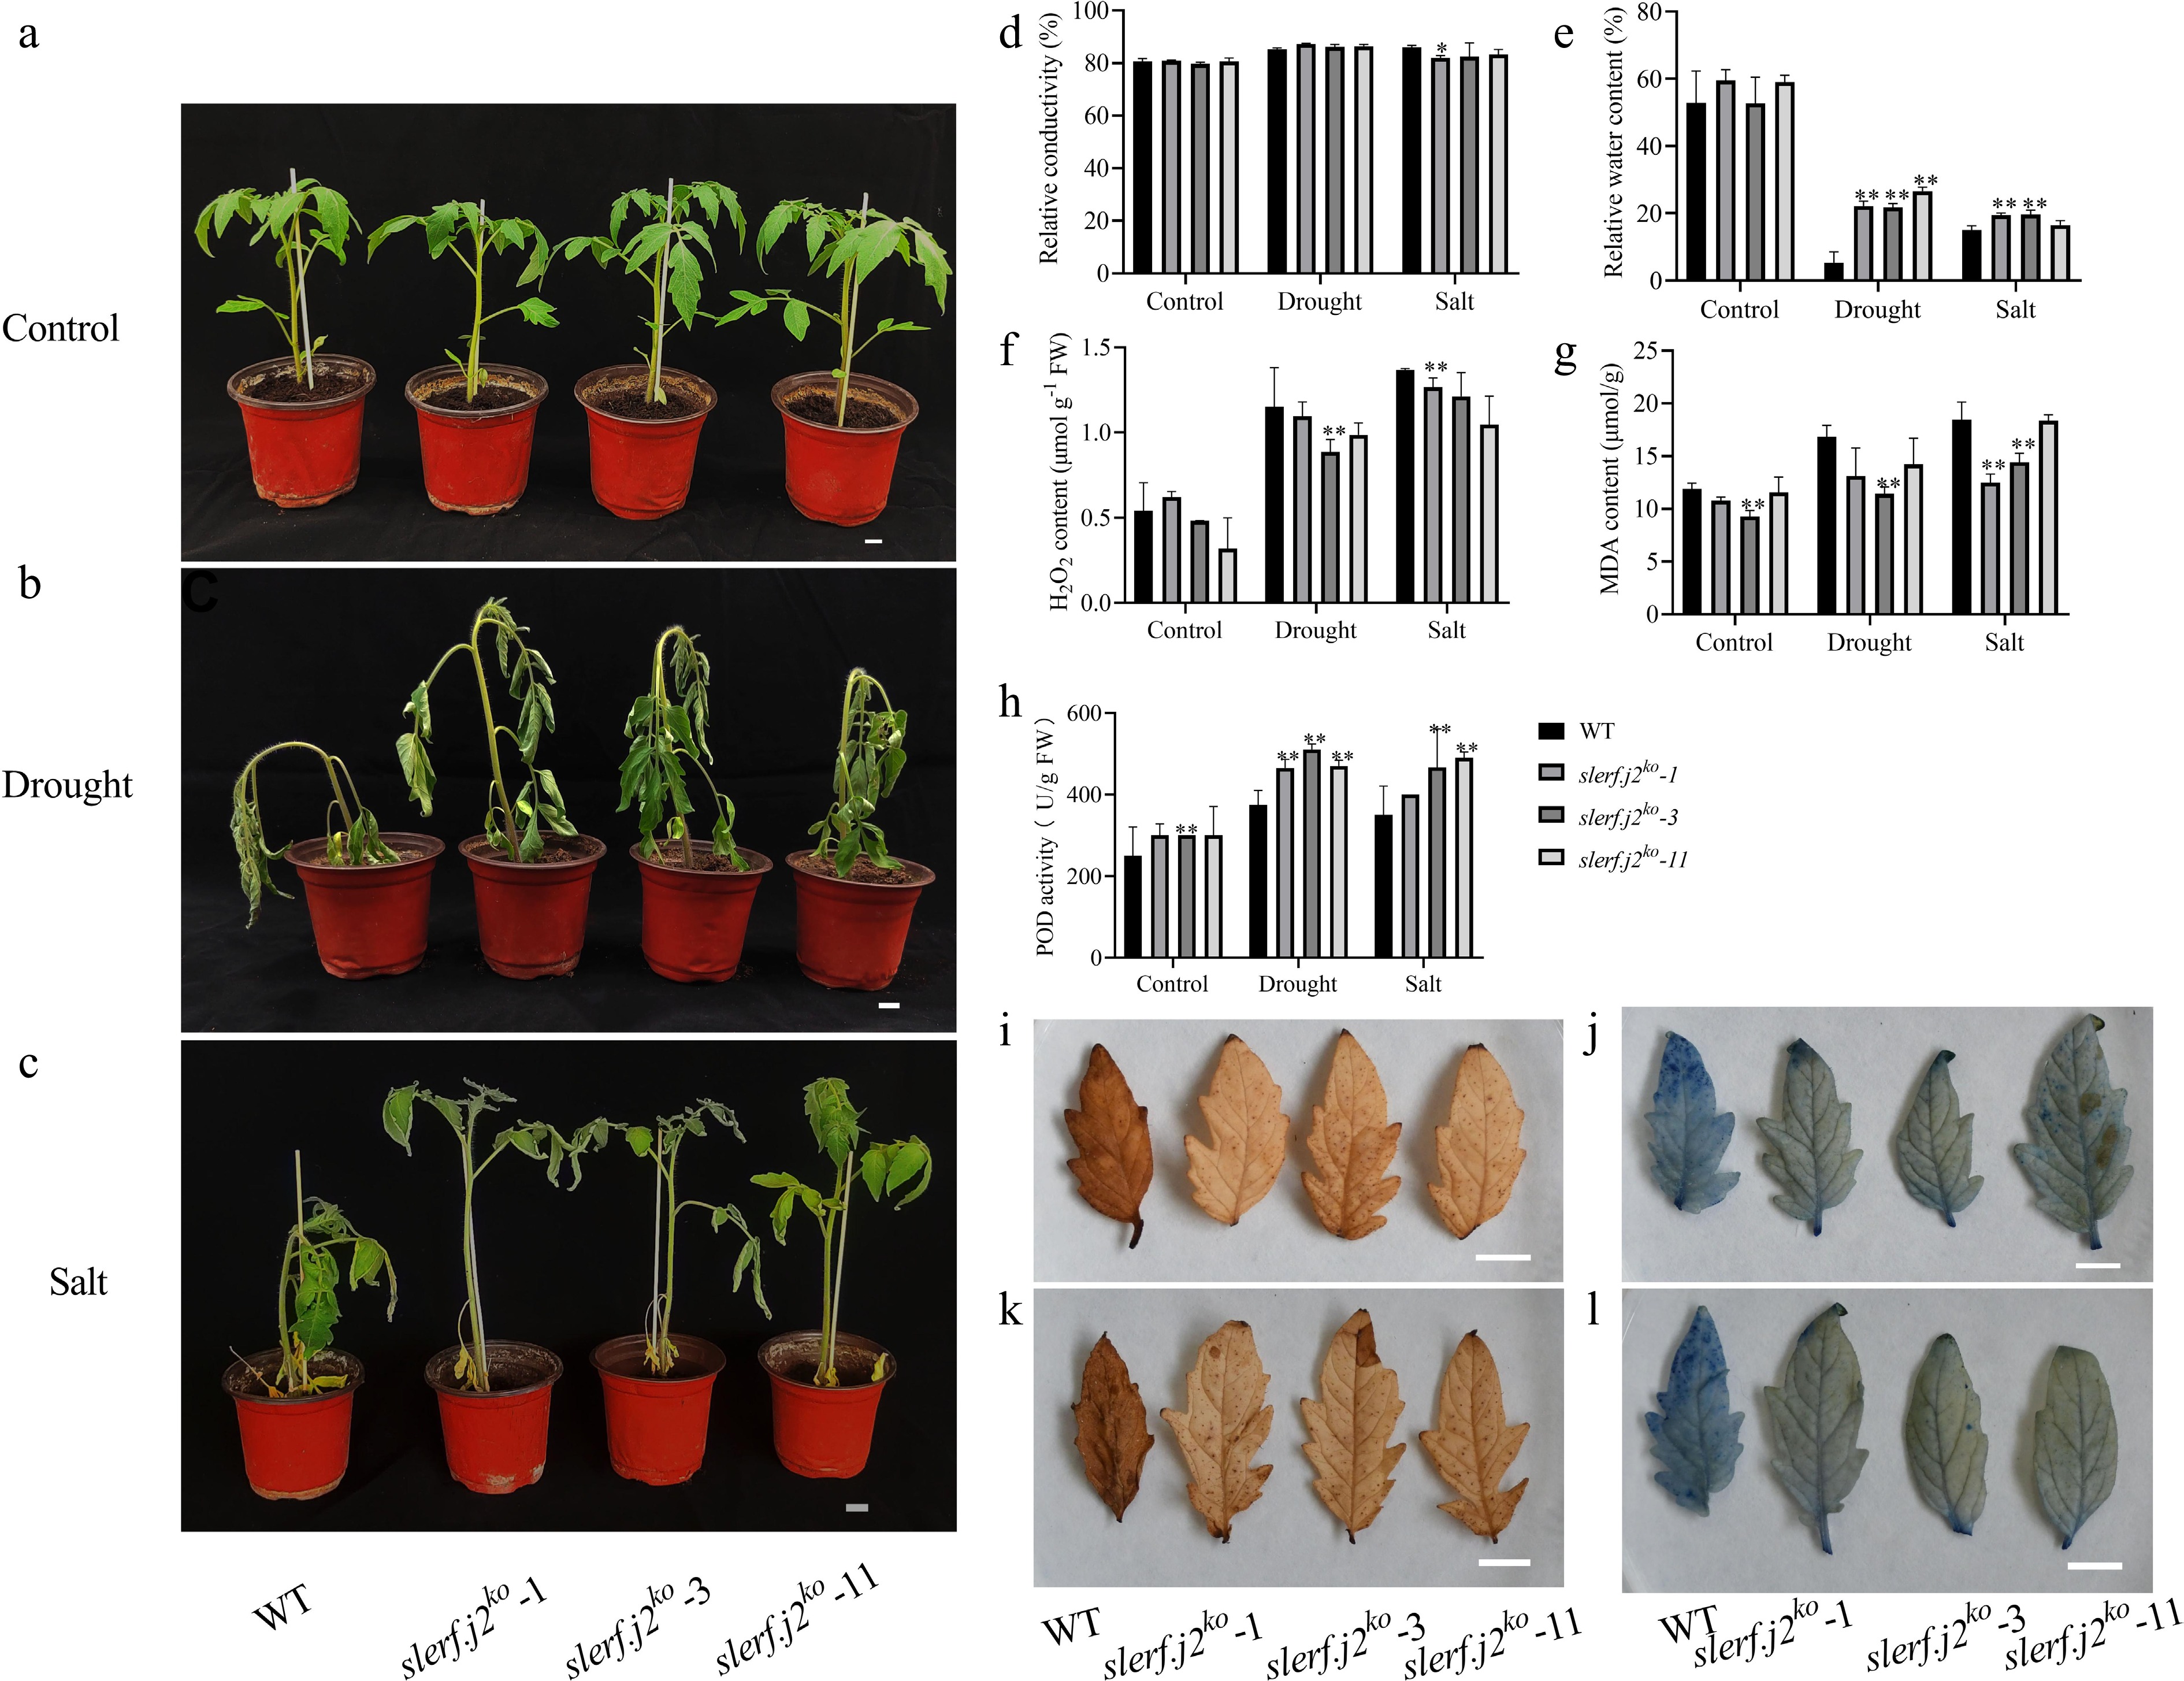
Figure 5.
The slerf.j2ko lines show improved growth performance and altered physiological responses under drought and salt stress. (a)–(c) Phenotypic traits of WT and slerf.j2ko lines (ko-1, ko-3, ko-11) under (a) control, (b) drought, and (c) salt stress conditions. Each treatment consisted of at least 15 tomato seedlings. Under drought and salt stress, WT plants wilted severely with inhibited growth, whereas slerf.j2ko lines maintained relatively robust growth. Scale bars in (a–c) = 1 cm. (d)–(h) Comparisons of REC, RWC, H2O2 content, MDA content, and POD activity in WT and slerf.j2ko lines. The results are presented as the mean ± SE based on three biological repeats, with significance compared with the WT at * p < 0.05 and ** p < 0.01 levels. (i), (k) DAB staining of leaves after 15 days of salt treatment and 21 days of drought treatment. Brown deposits indicate H2O2 accumulation. (j), (l) Trypan blue staining under stress conditions. Dark blue denotes severe cell death; lighter staining shows less cell damage in the mutants. Scale bars in (i)–(l) = 1 cm.
-
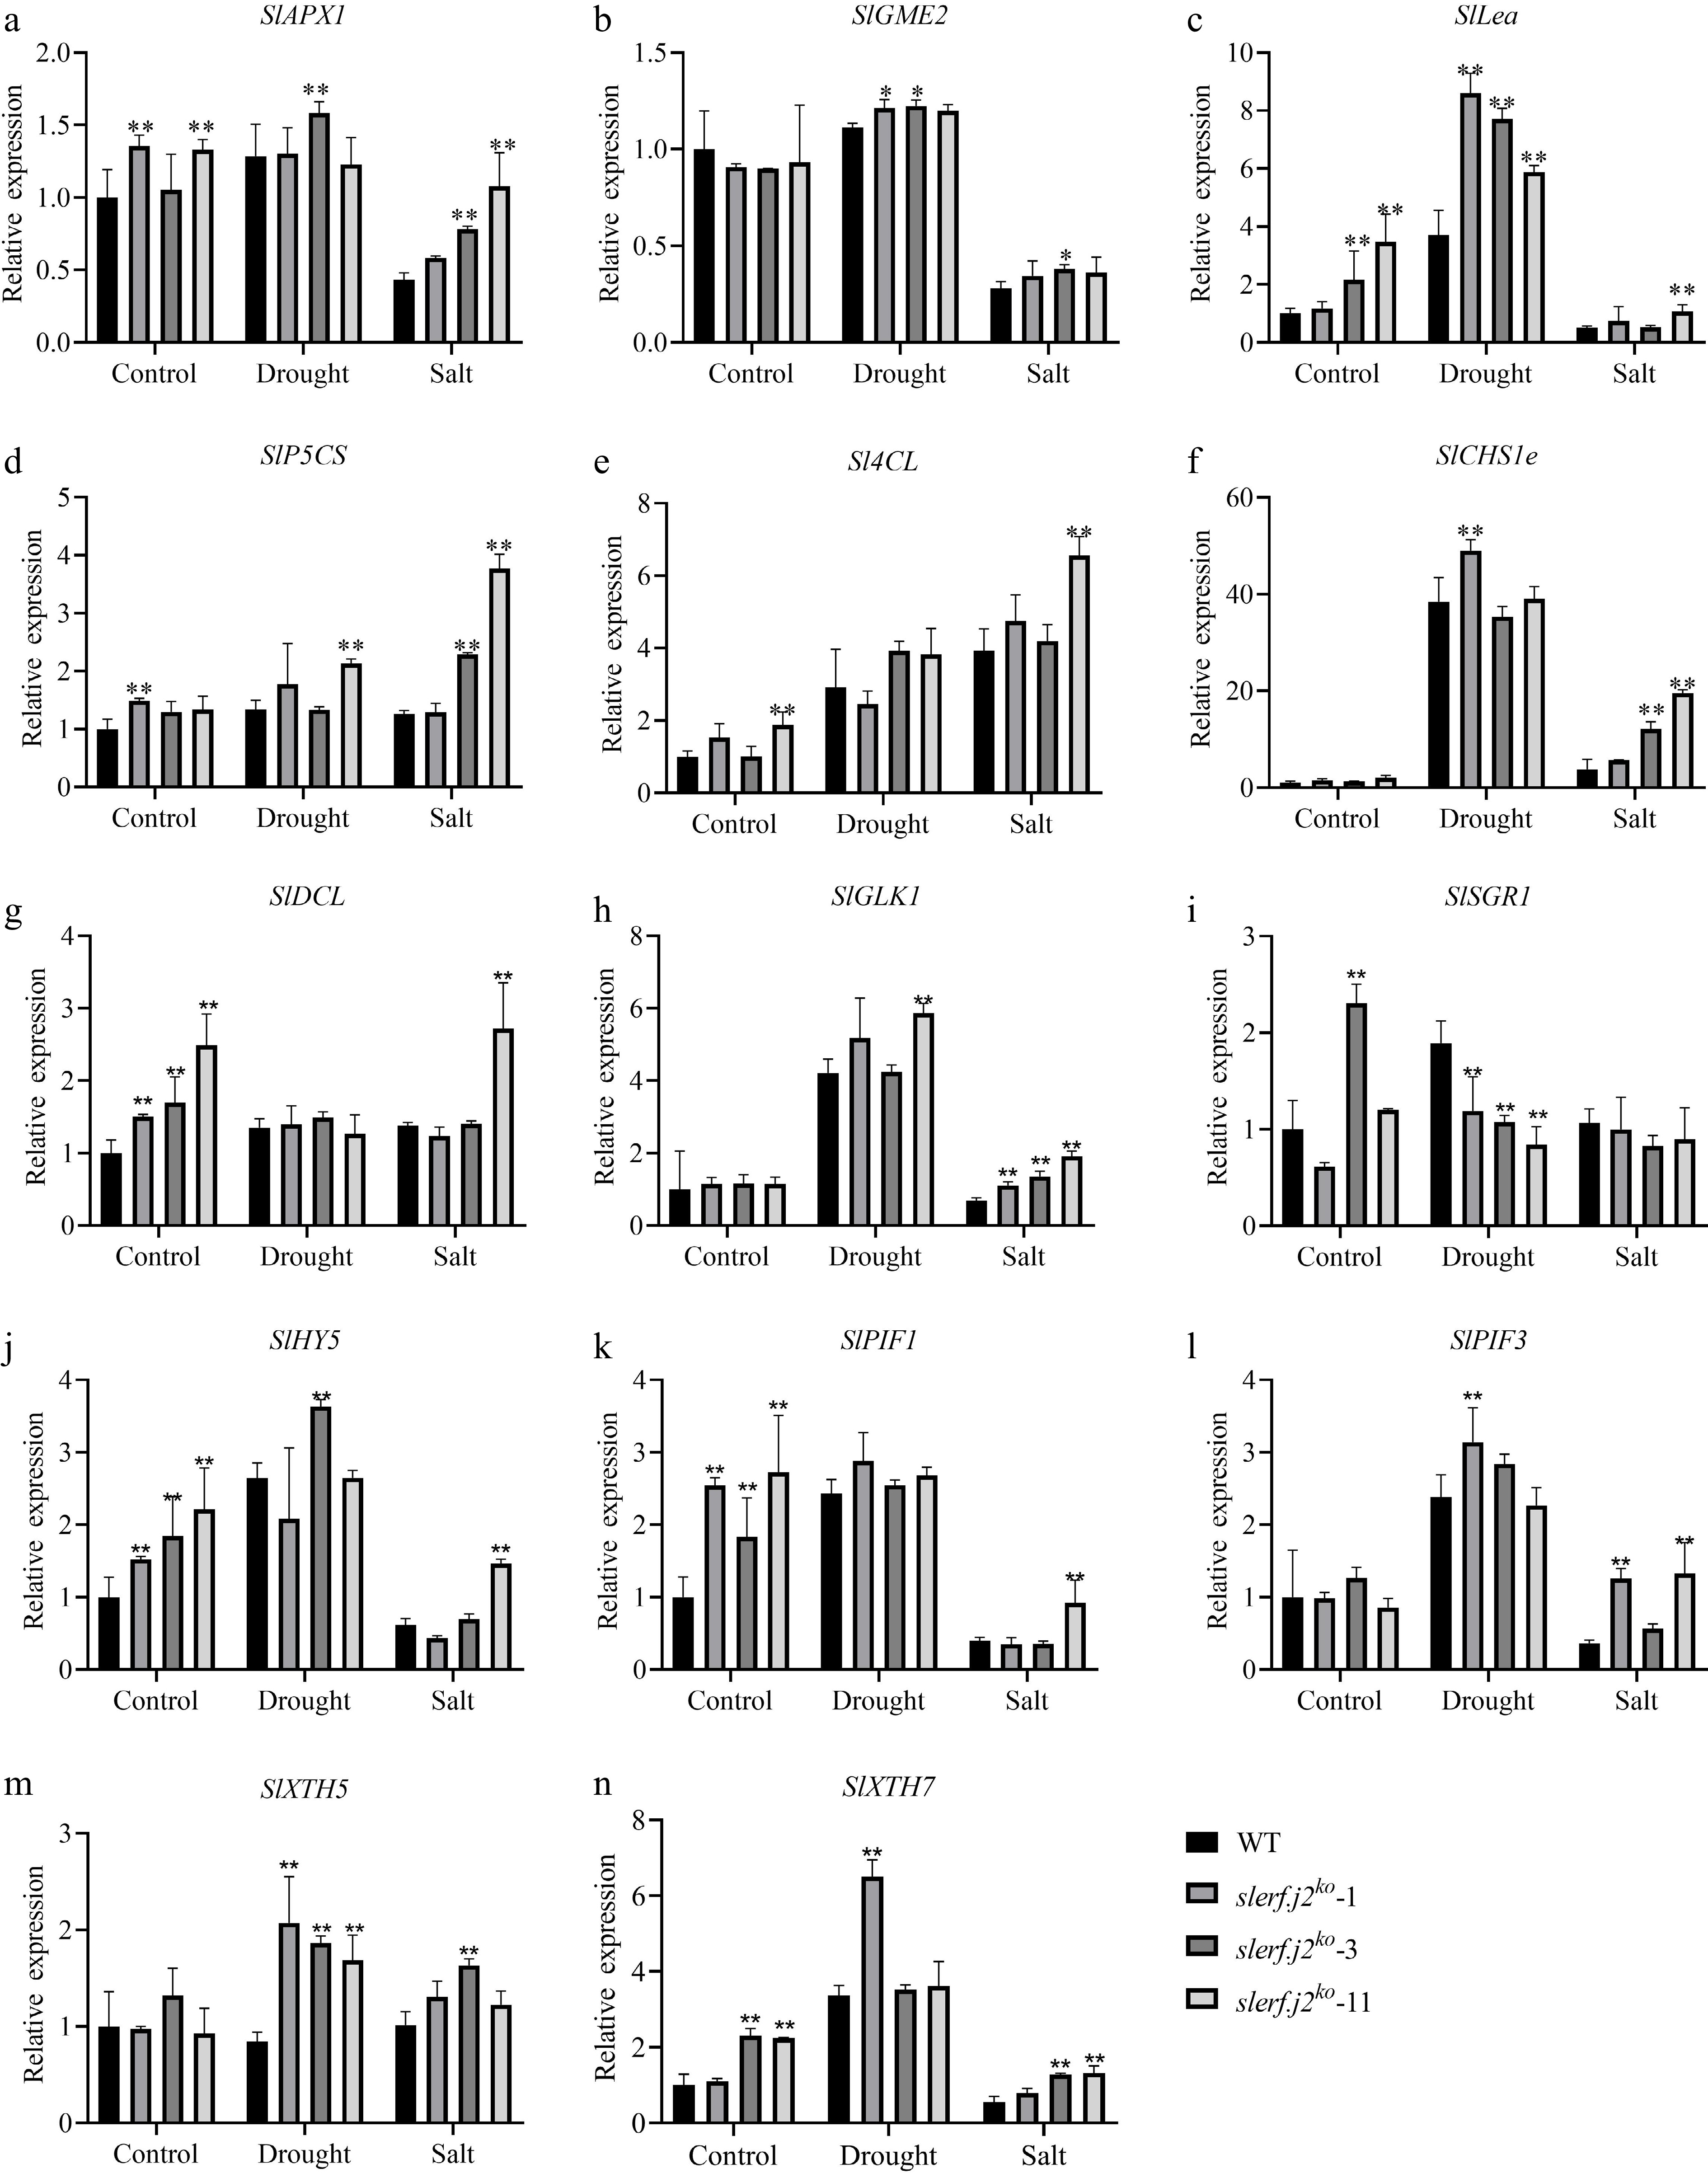
Figure 6.
Stress-related gene expression in slerf.j2 mutants under normal, drought, and salt conditions. (a)–(n) Transcript abundance of 14 stress-inducible genes: (a) SlAPX1, (b) SlGME2, (c) SlLea, (d) SlP5CS, (e) Sl4CL, (f) SlCHS1e, (g) SlDCL, (h) SlGLK1, (i) SlSGR1, (j) SlHY5, (k) SlPIF1, (l) SlPIF3, (m) SlXTH5, and (n) SlXTH7 in WT and slerf.j2ko plants under stress treatments. The results are expressed as mean ± standard error obtained from three biological repeats; Student’s t-test was applied for analyzing significance (* p < 0.05, ** p < 0.01).
-
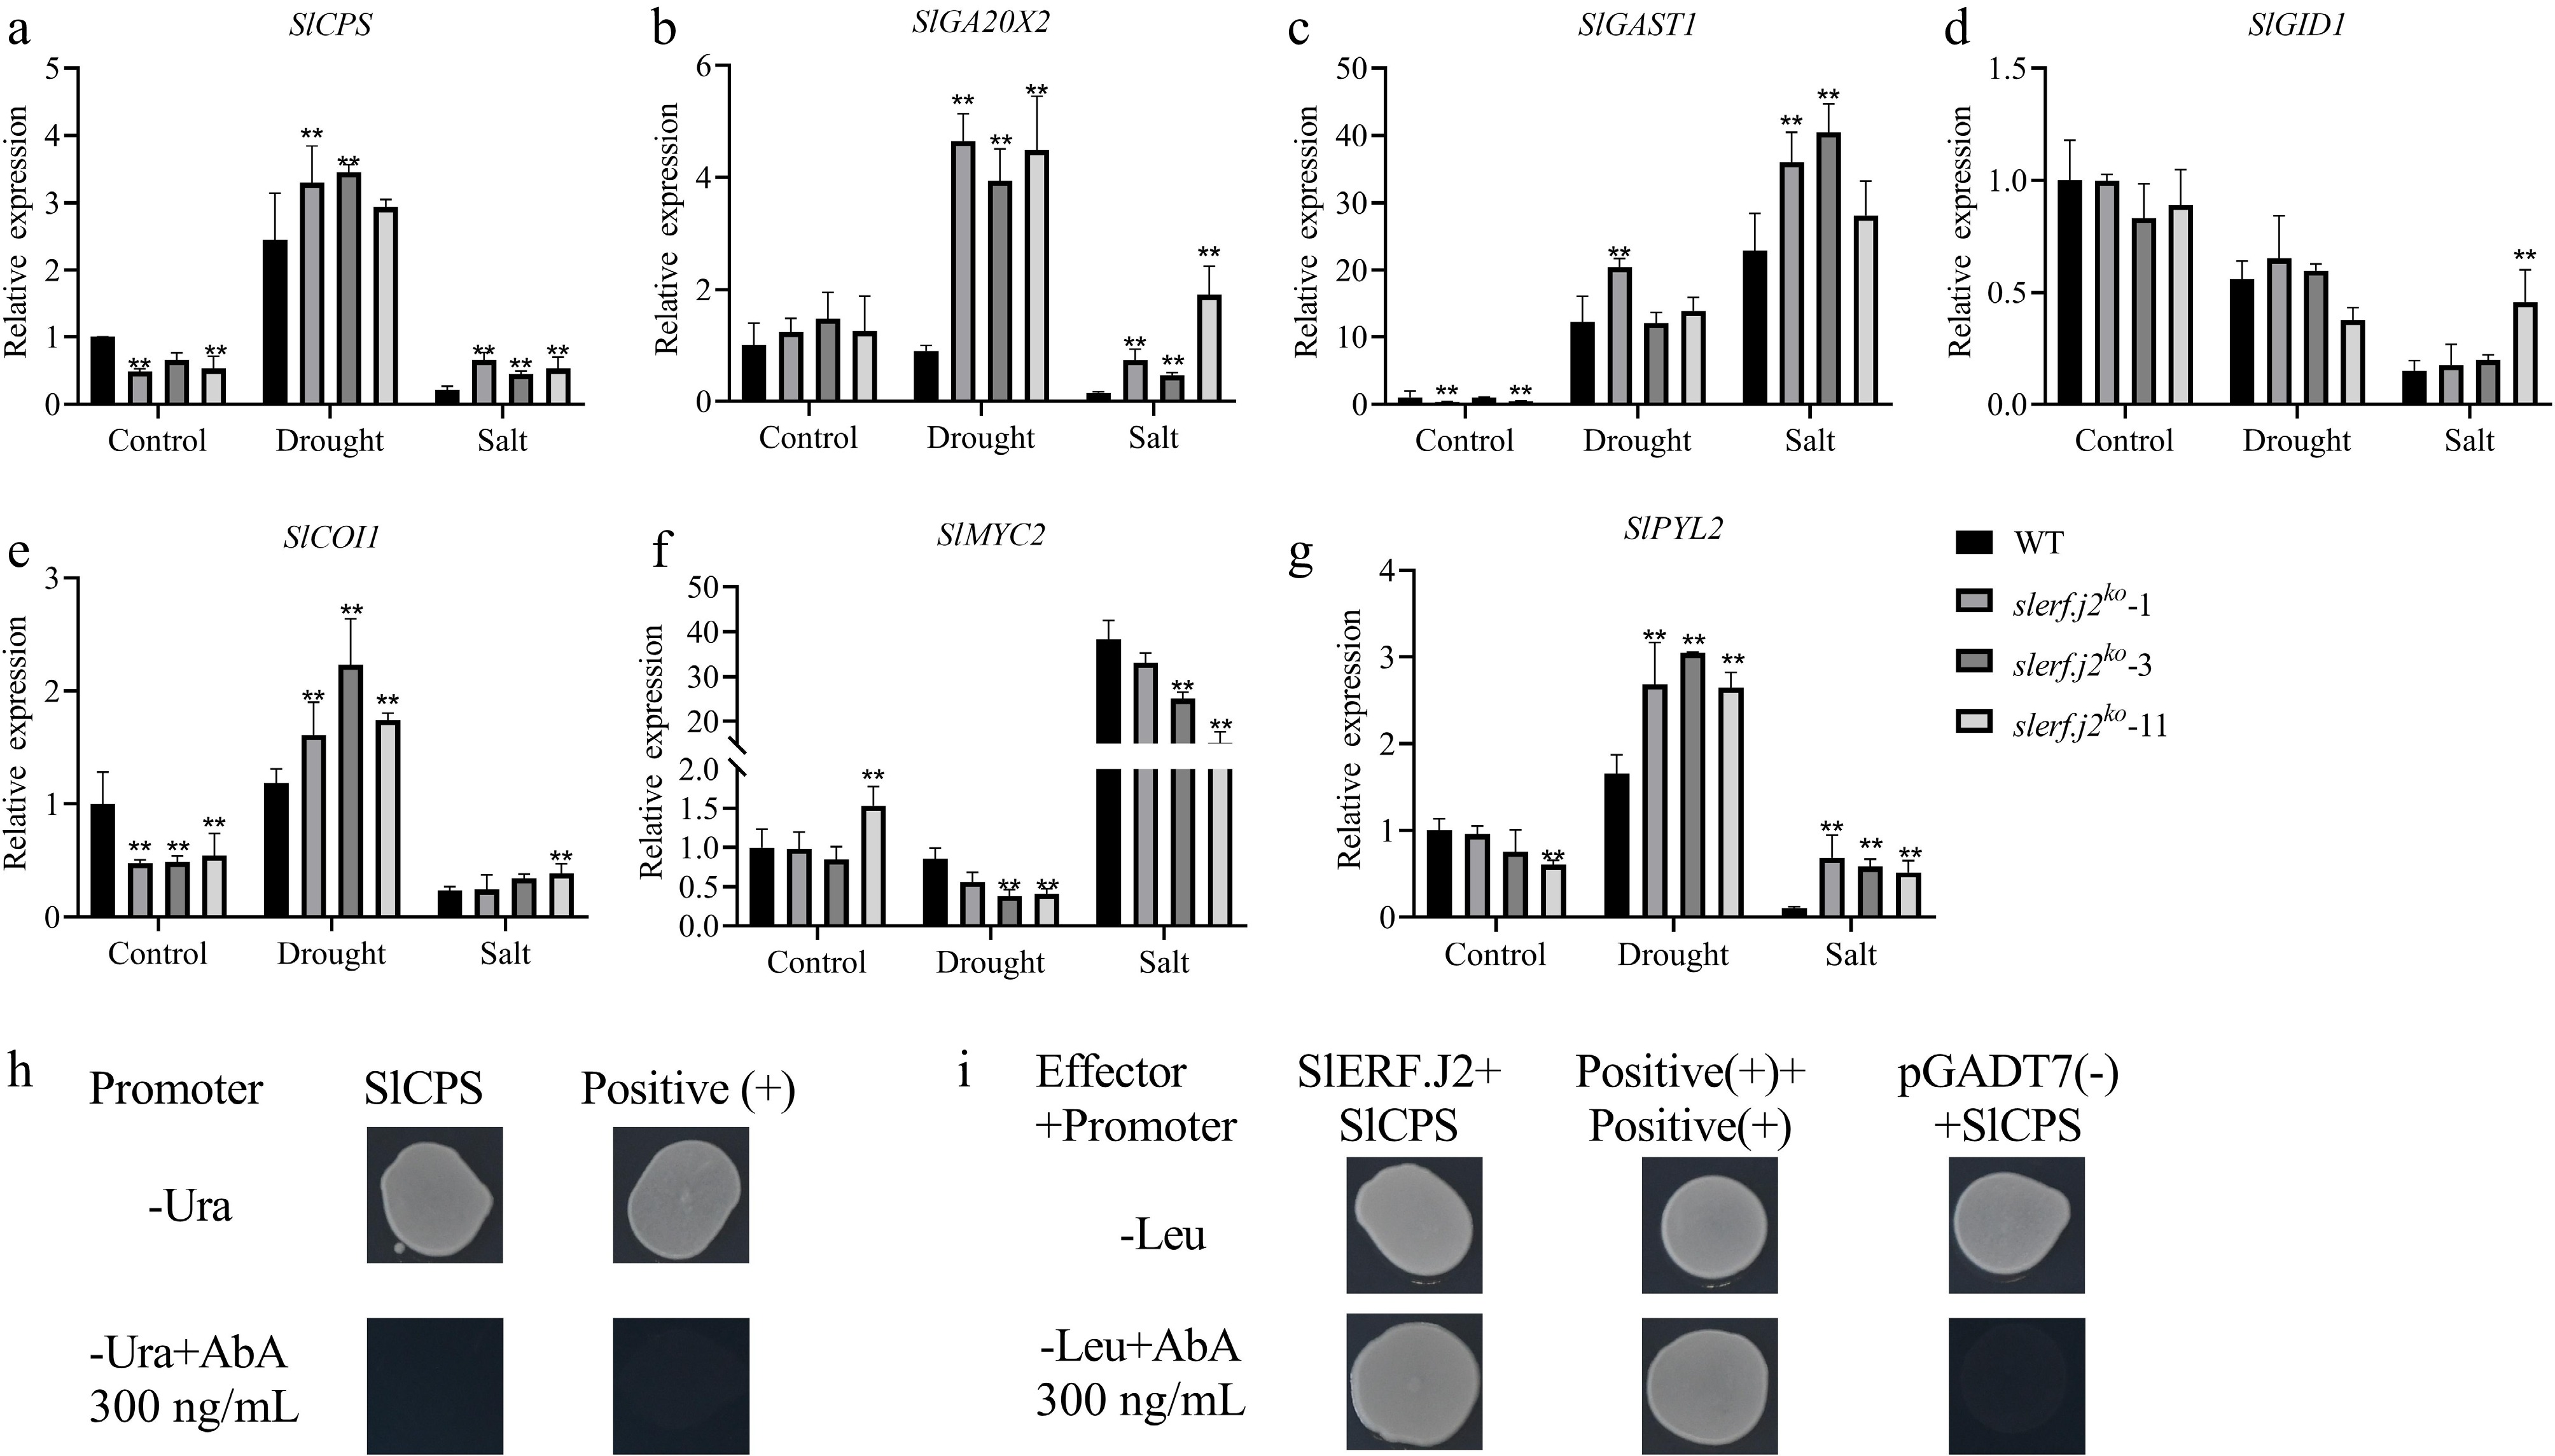
Figure 7.
Transcript profiles of stress-inducible genes in slerf.j2ko tomato plants across control, drought, and salinity treatments. Y1H assays validated that SlERF.J2 targets the SlCPS promoter. (a)–(g) Expression of seven hormone-associated genes in WT and slerf.j2 mutant lines: (a) SlCPS; (b) SlGA20x2; (c) SlGAST1; (d) SlGID1; (e) SlCOI1; (f) SlMYC2; (g) SlPYL2 (* p < 0.05, ** p < 0.01). (h) Autoactivation detection of the SlCPS promoter bait vector. Yeast cells harboring the SlCPS promoter bait plasmid were cultured on –Ura and –Ura + 300 ng/mL ABA plates. The SlCPS promoter bait did not support yeast growth on –Ura + ABA plates, demonstrating no autoactivation activity. (i) Y1H interaction assay between SlERF.J2 and the SlCPS promoter. Yeast cells co-transformed with the SlERF.J2 prey vector + the SlCPS promoter bait vector were cultured on –Leu and –Leu + 300 ng/mL ABA plates. Growth on –Leu + ABA plates verified the direct interaction of SlERF.J2 with the SlCPS promoter. The absence of growth in the pGADT7 + SlCPS group confirms the interaction's specificity.
-
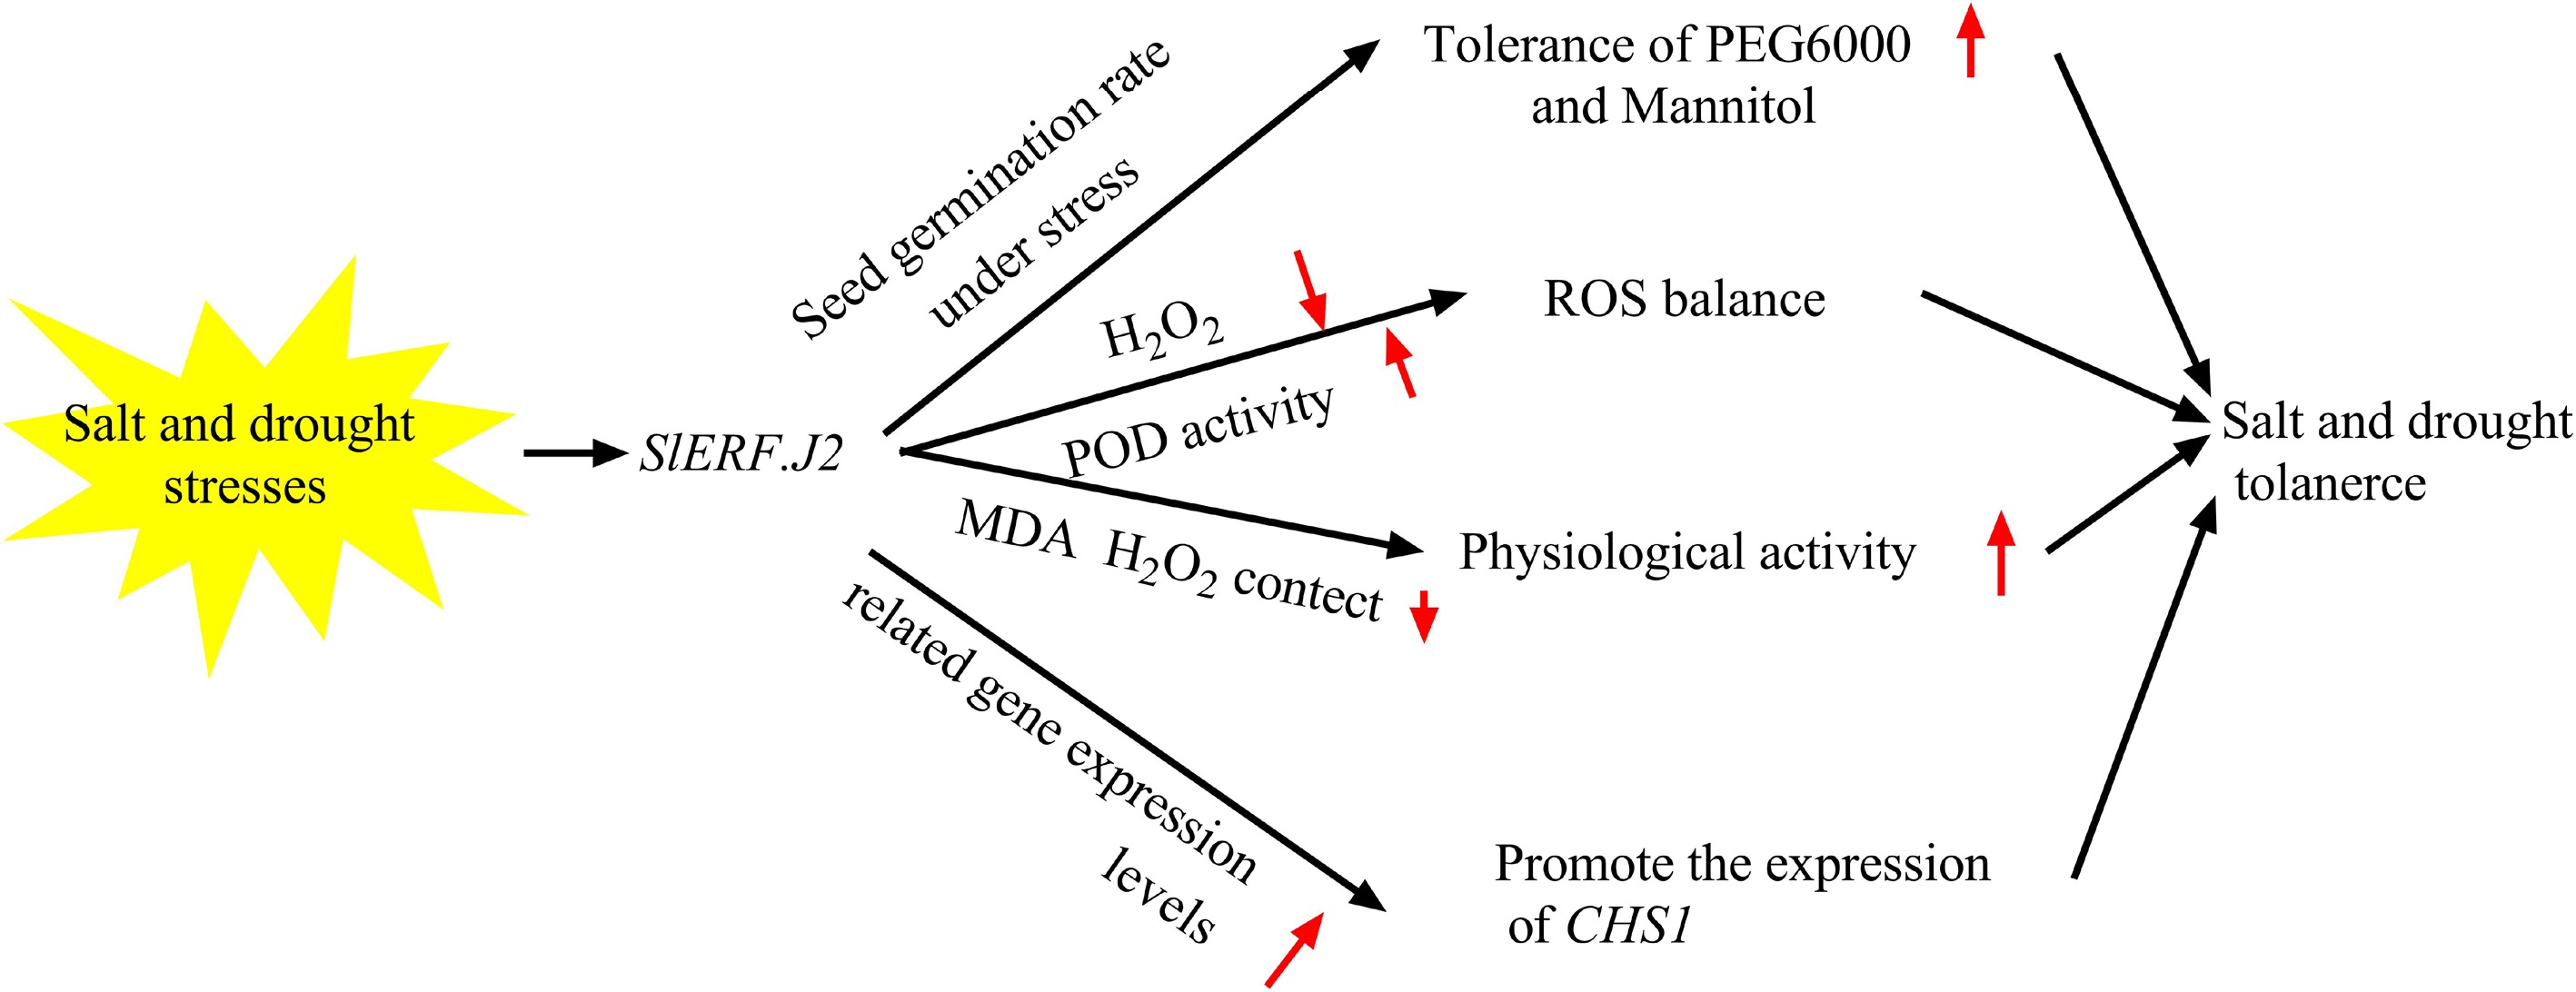
Figure 8.
Mechanistic model of SlERF.J2-mediated regulation of salt and drought tolerance in tomato.
Figures
(8)
Tables
(0)