-
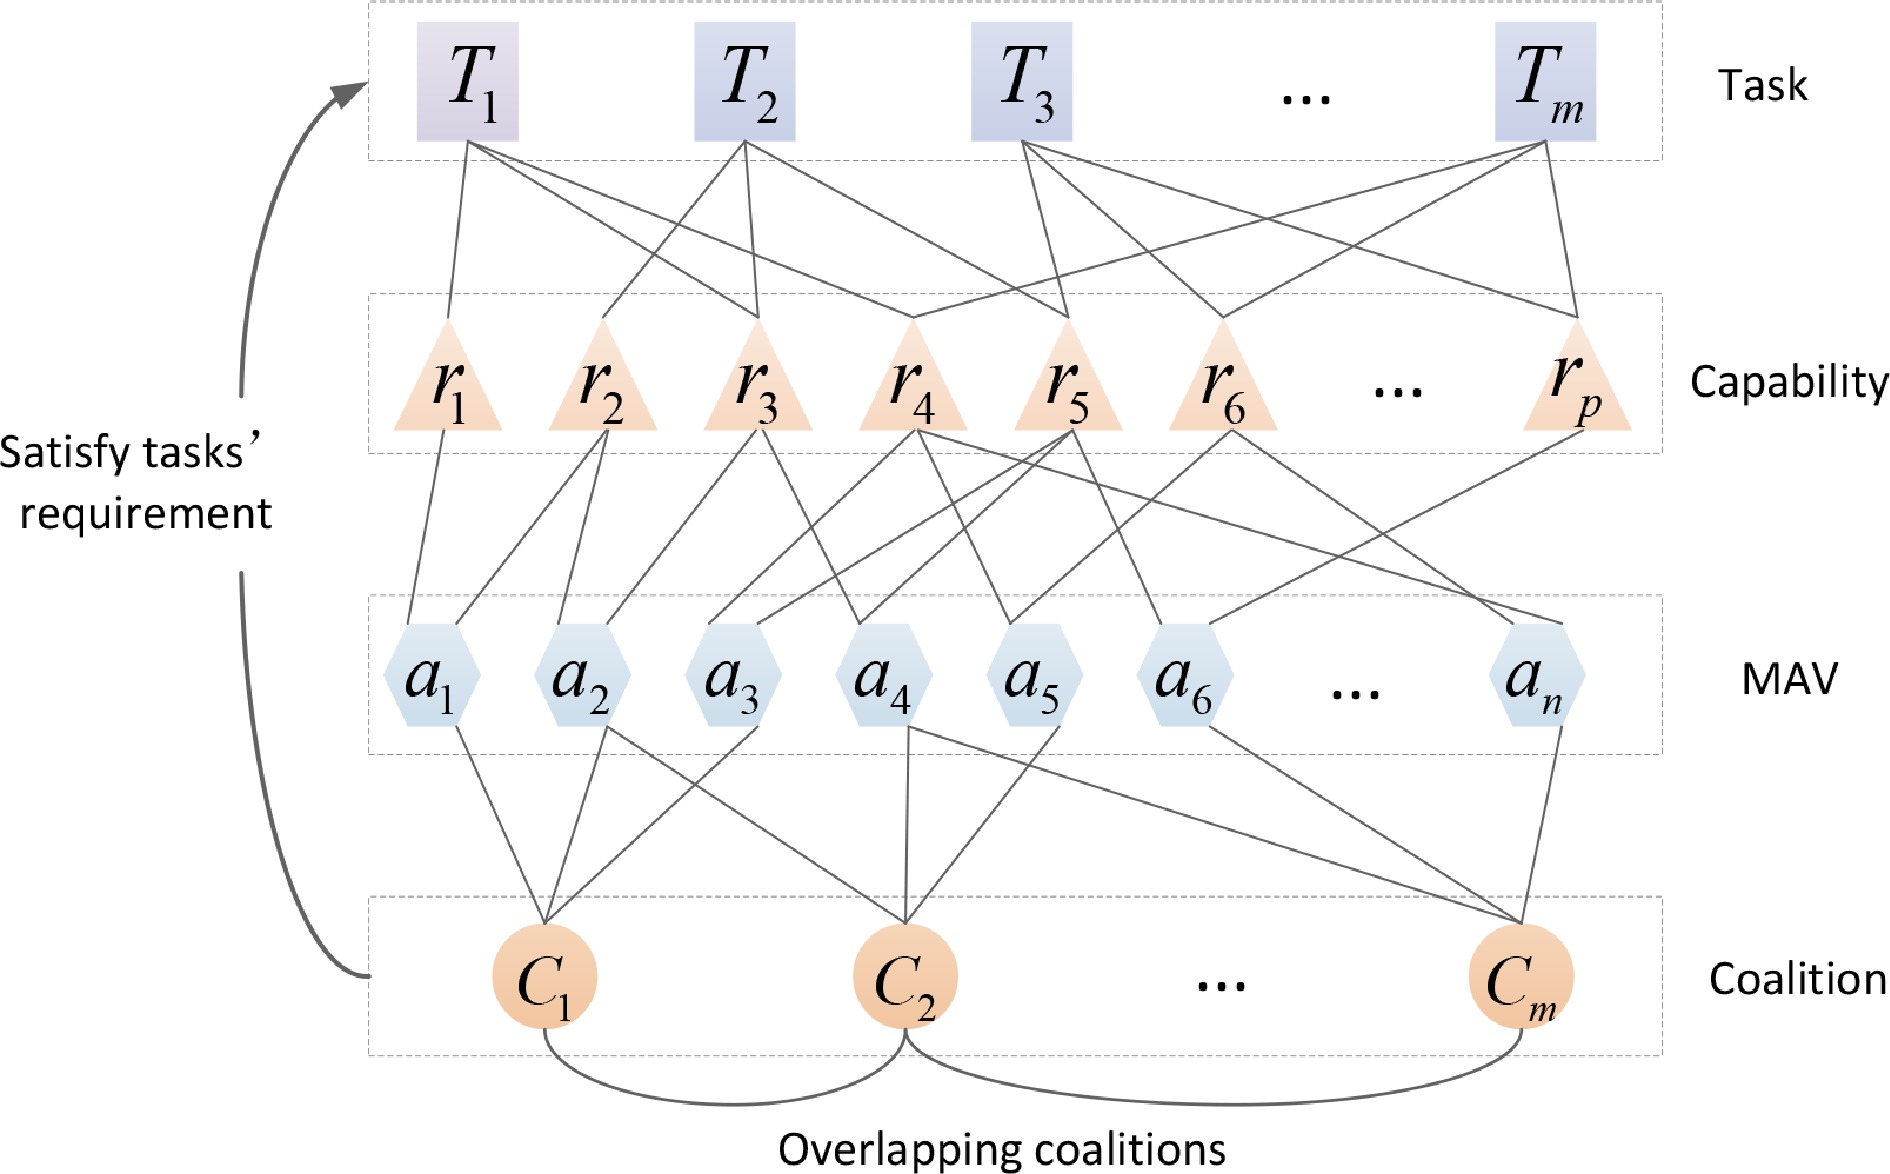
Figure 1.
Conceptual diagram of the capability-centric dynamic matching mapping for MAS.
-
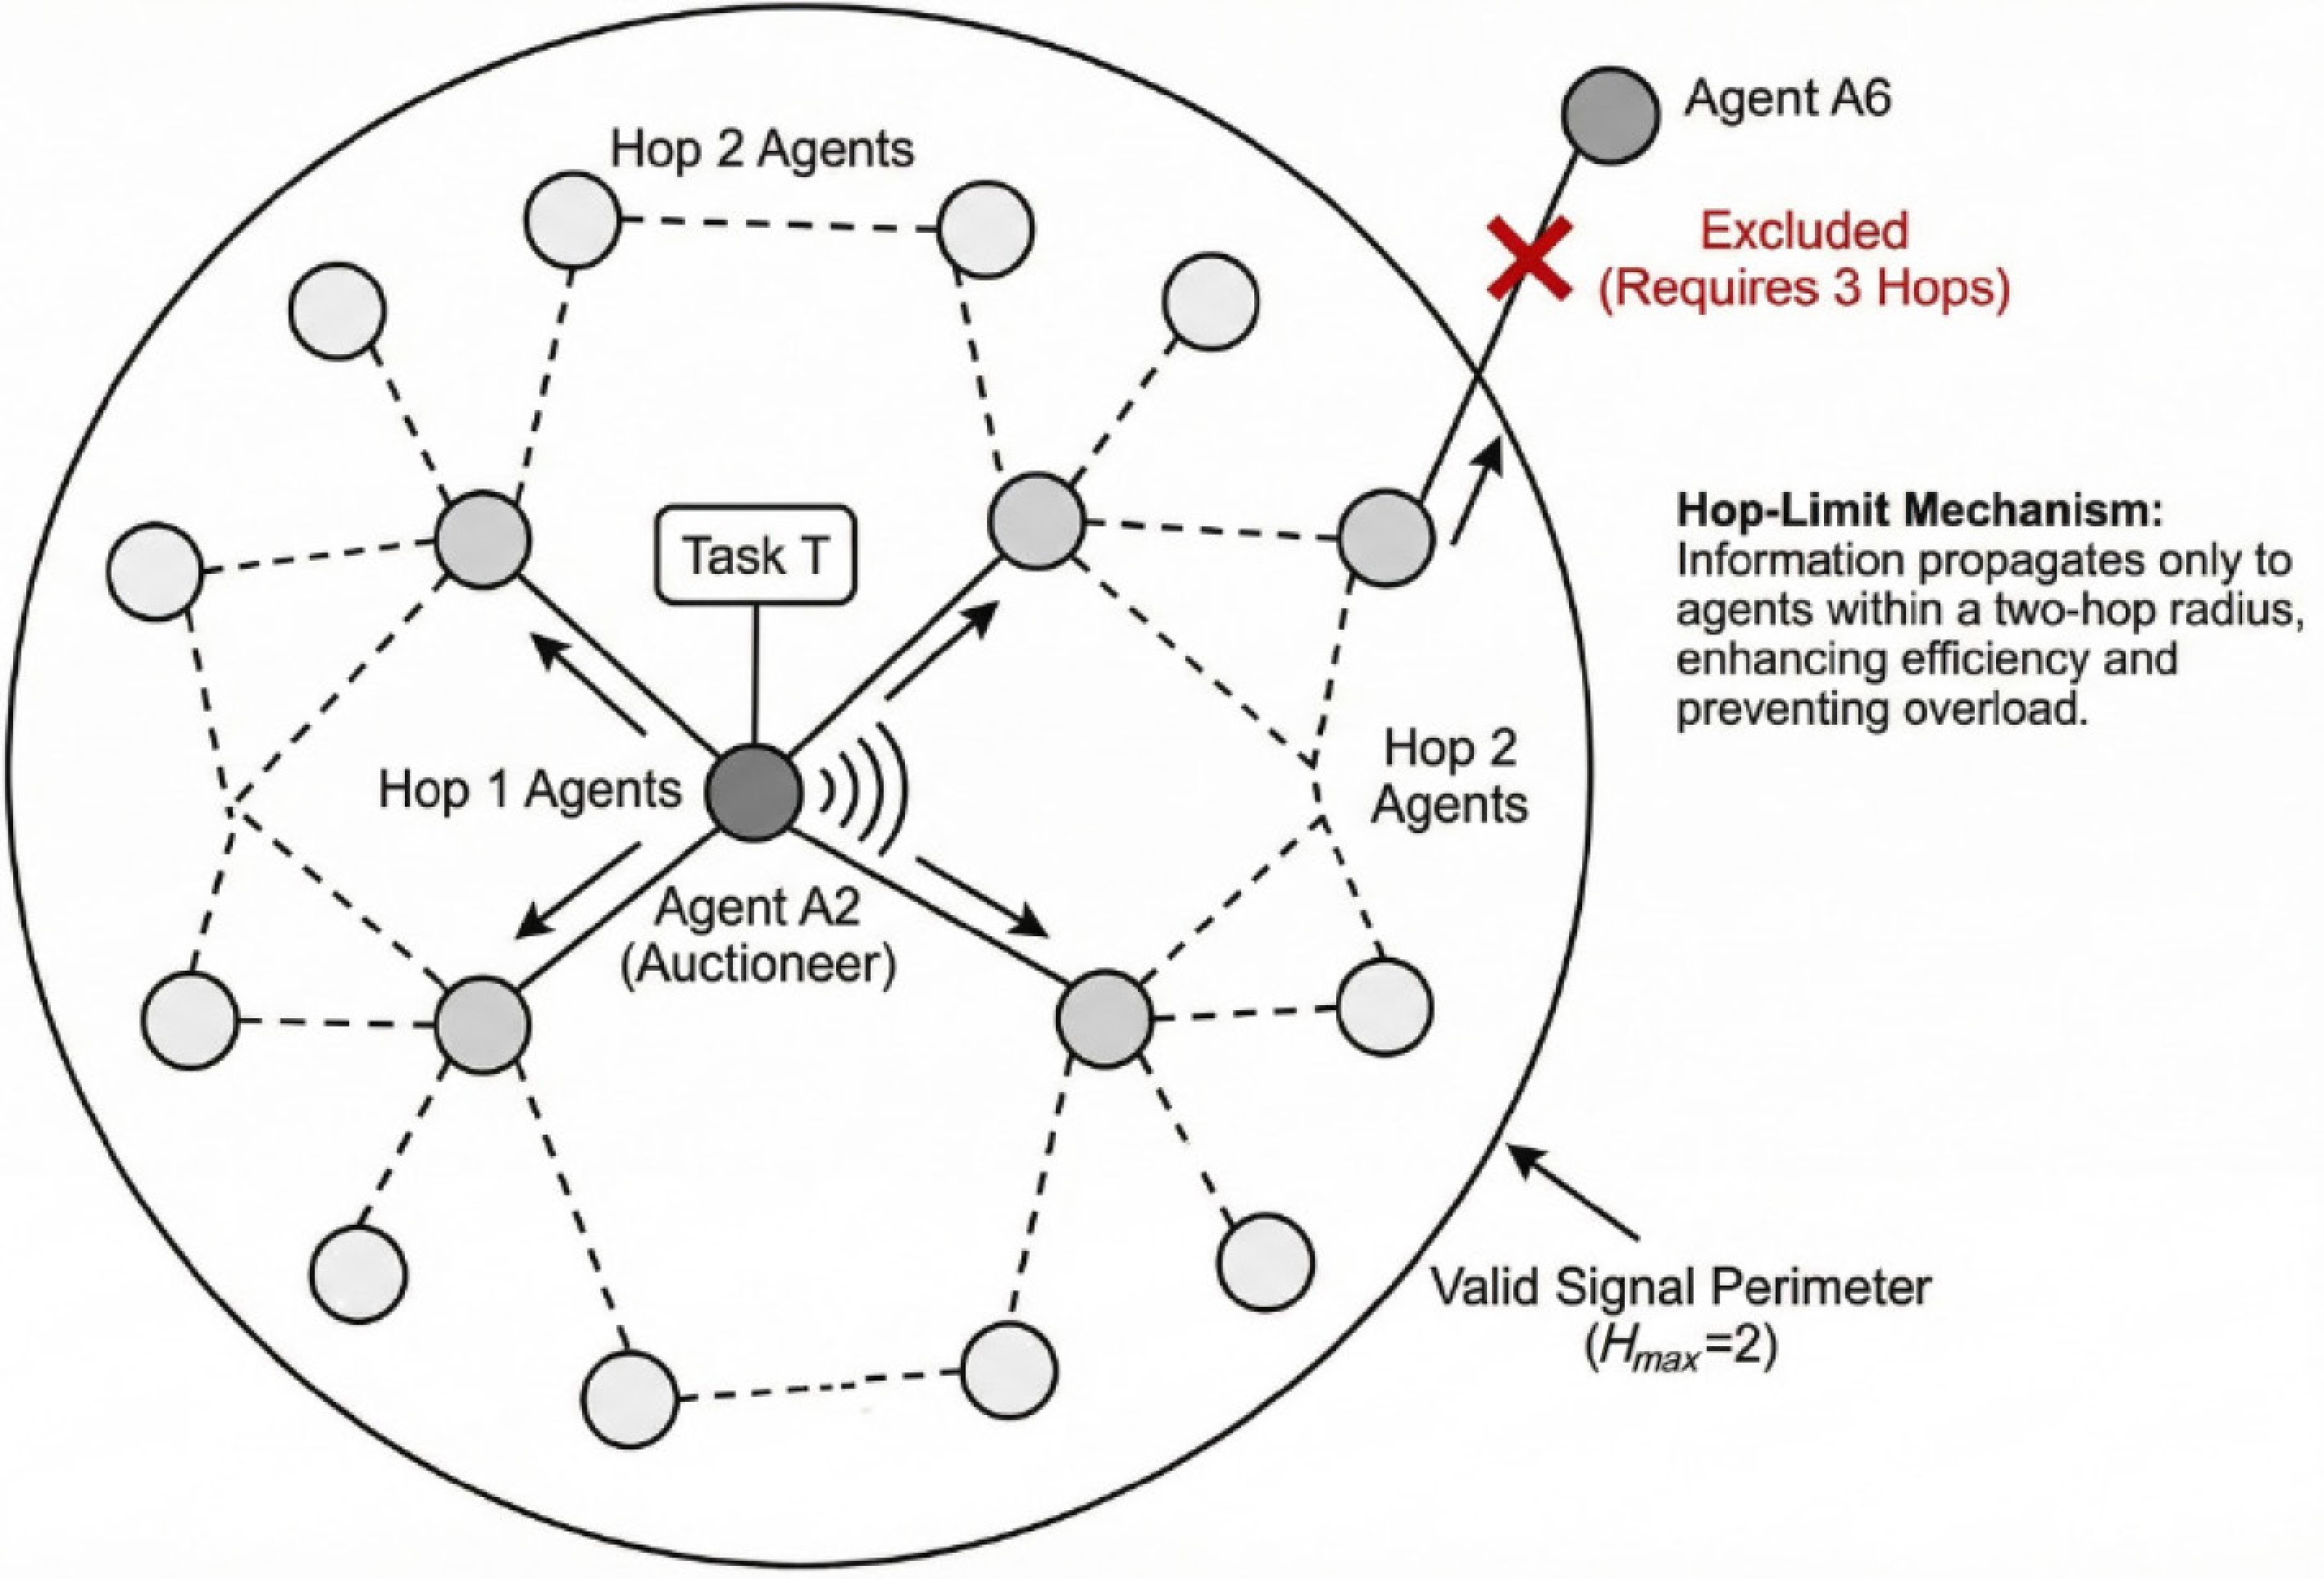
Figure 2.
Schematic diagram of the hop-limited propagation mechanism.
-
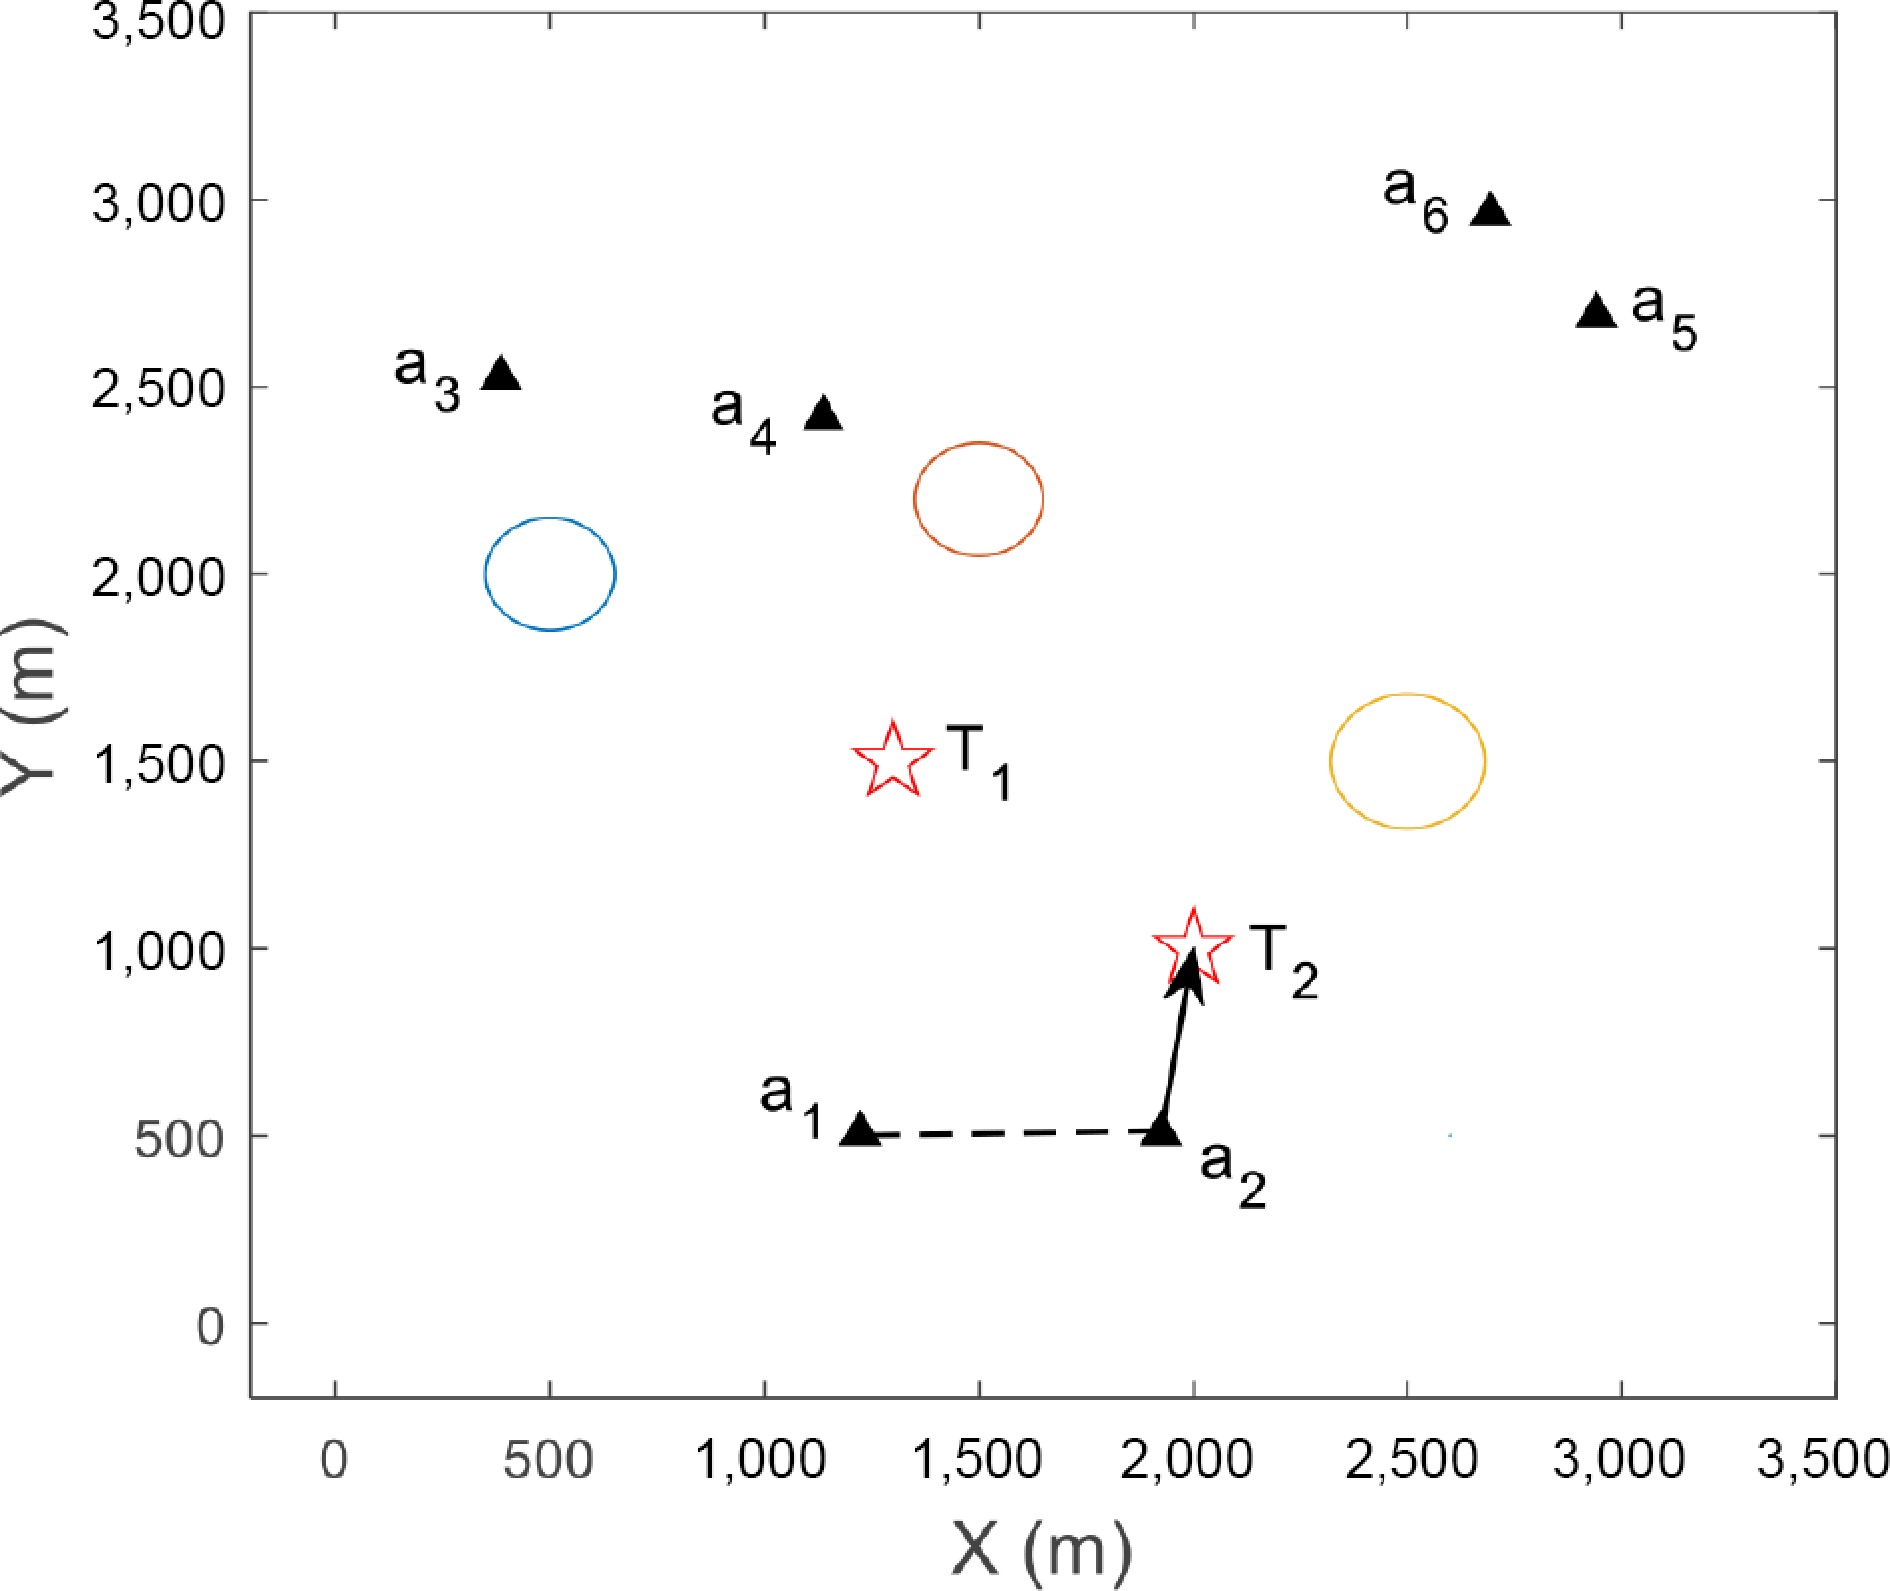
Figure 3.
Configuration of heterogeneous MAVs and tasks at t = 26.5 s in the dynamic environment.
-
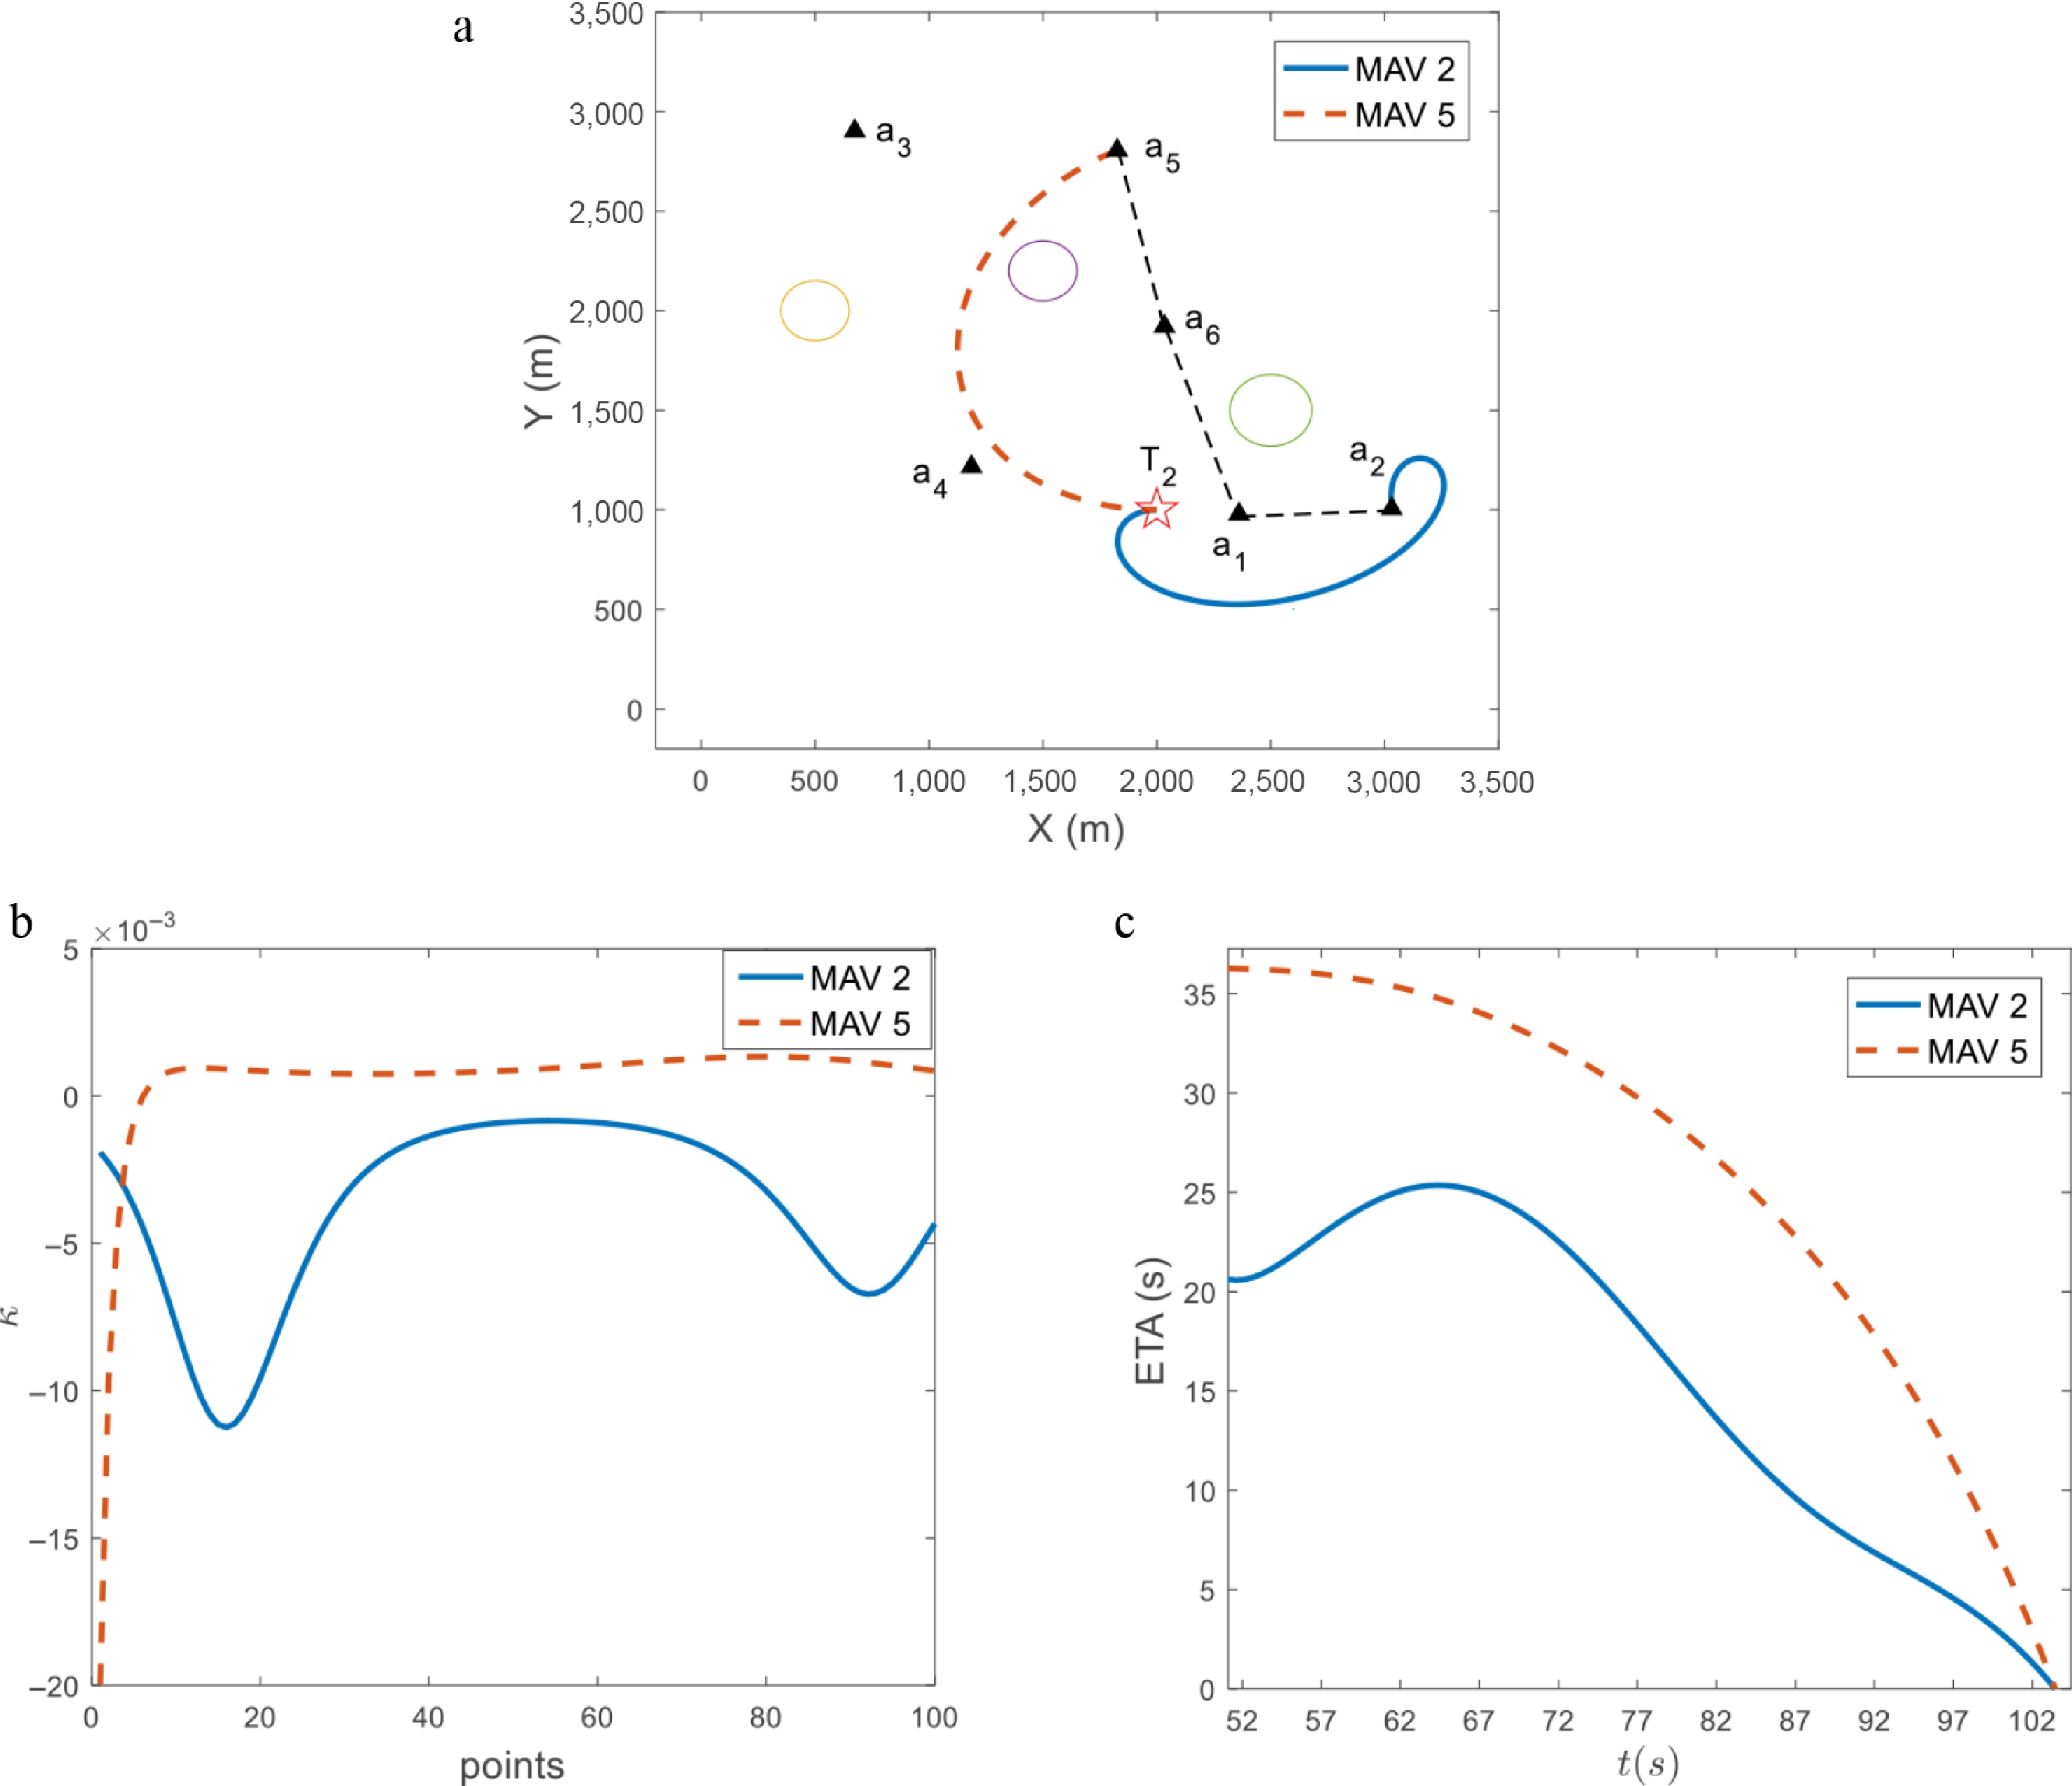
Figure 4.
The coalition formation results for task T2 at time 51.1 s. (a) MAV coalition for task T2. (b) Curvature of these paths. (c) Estimated time of arrival.
-
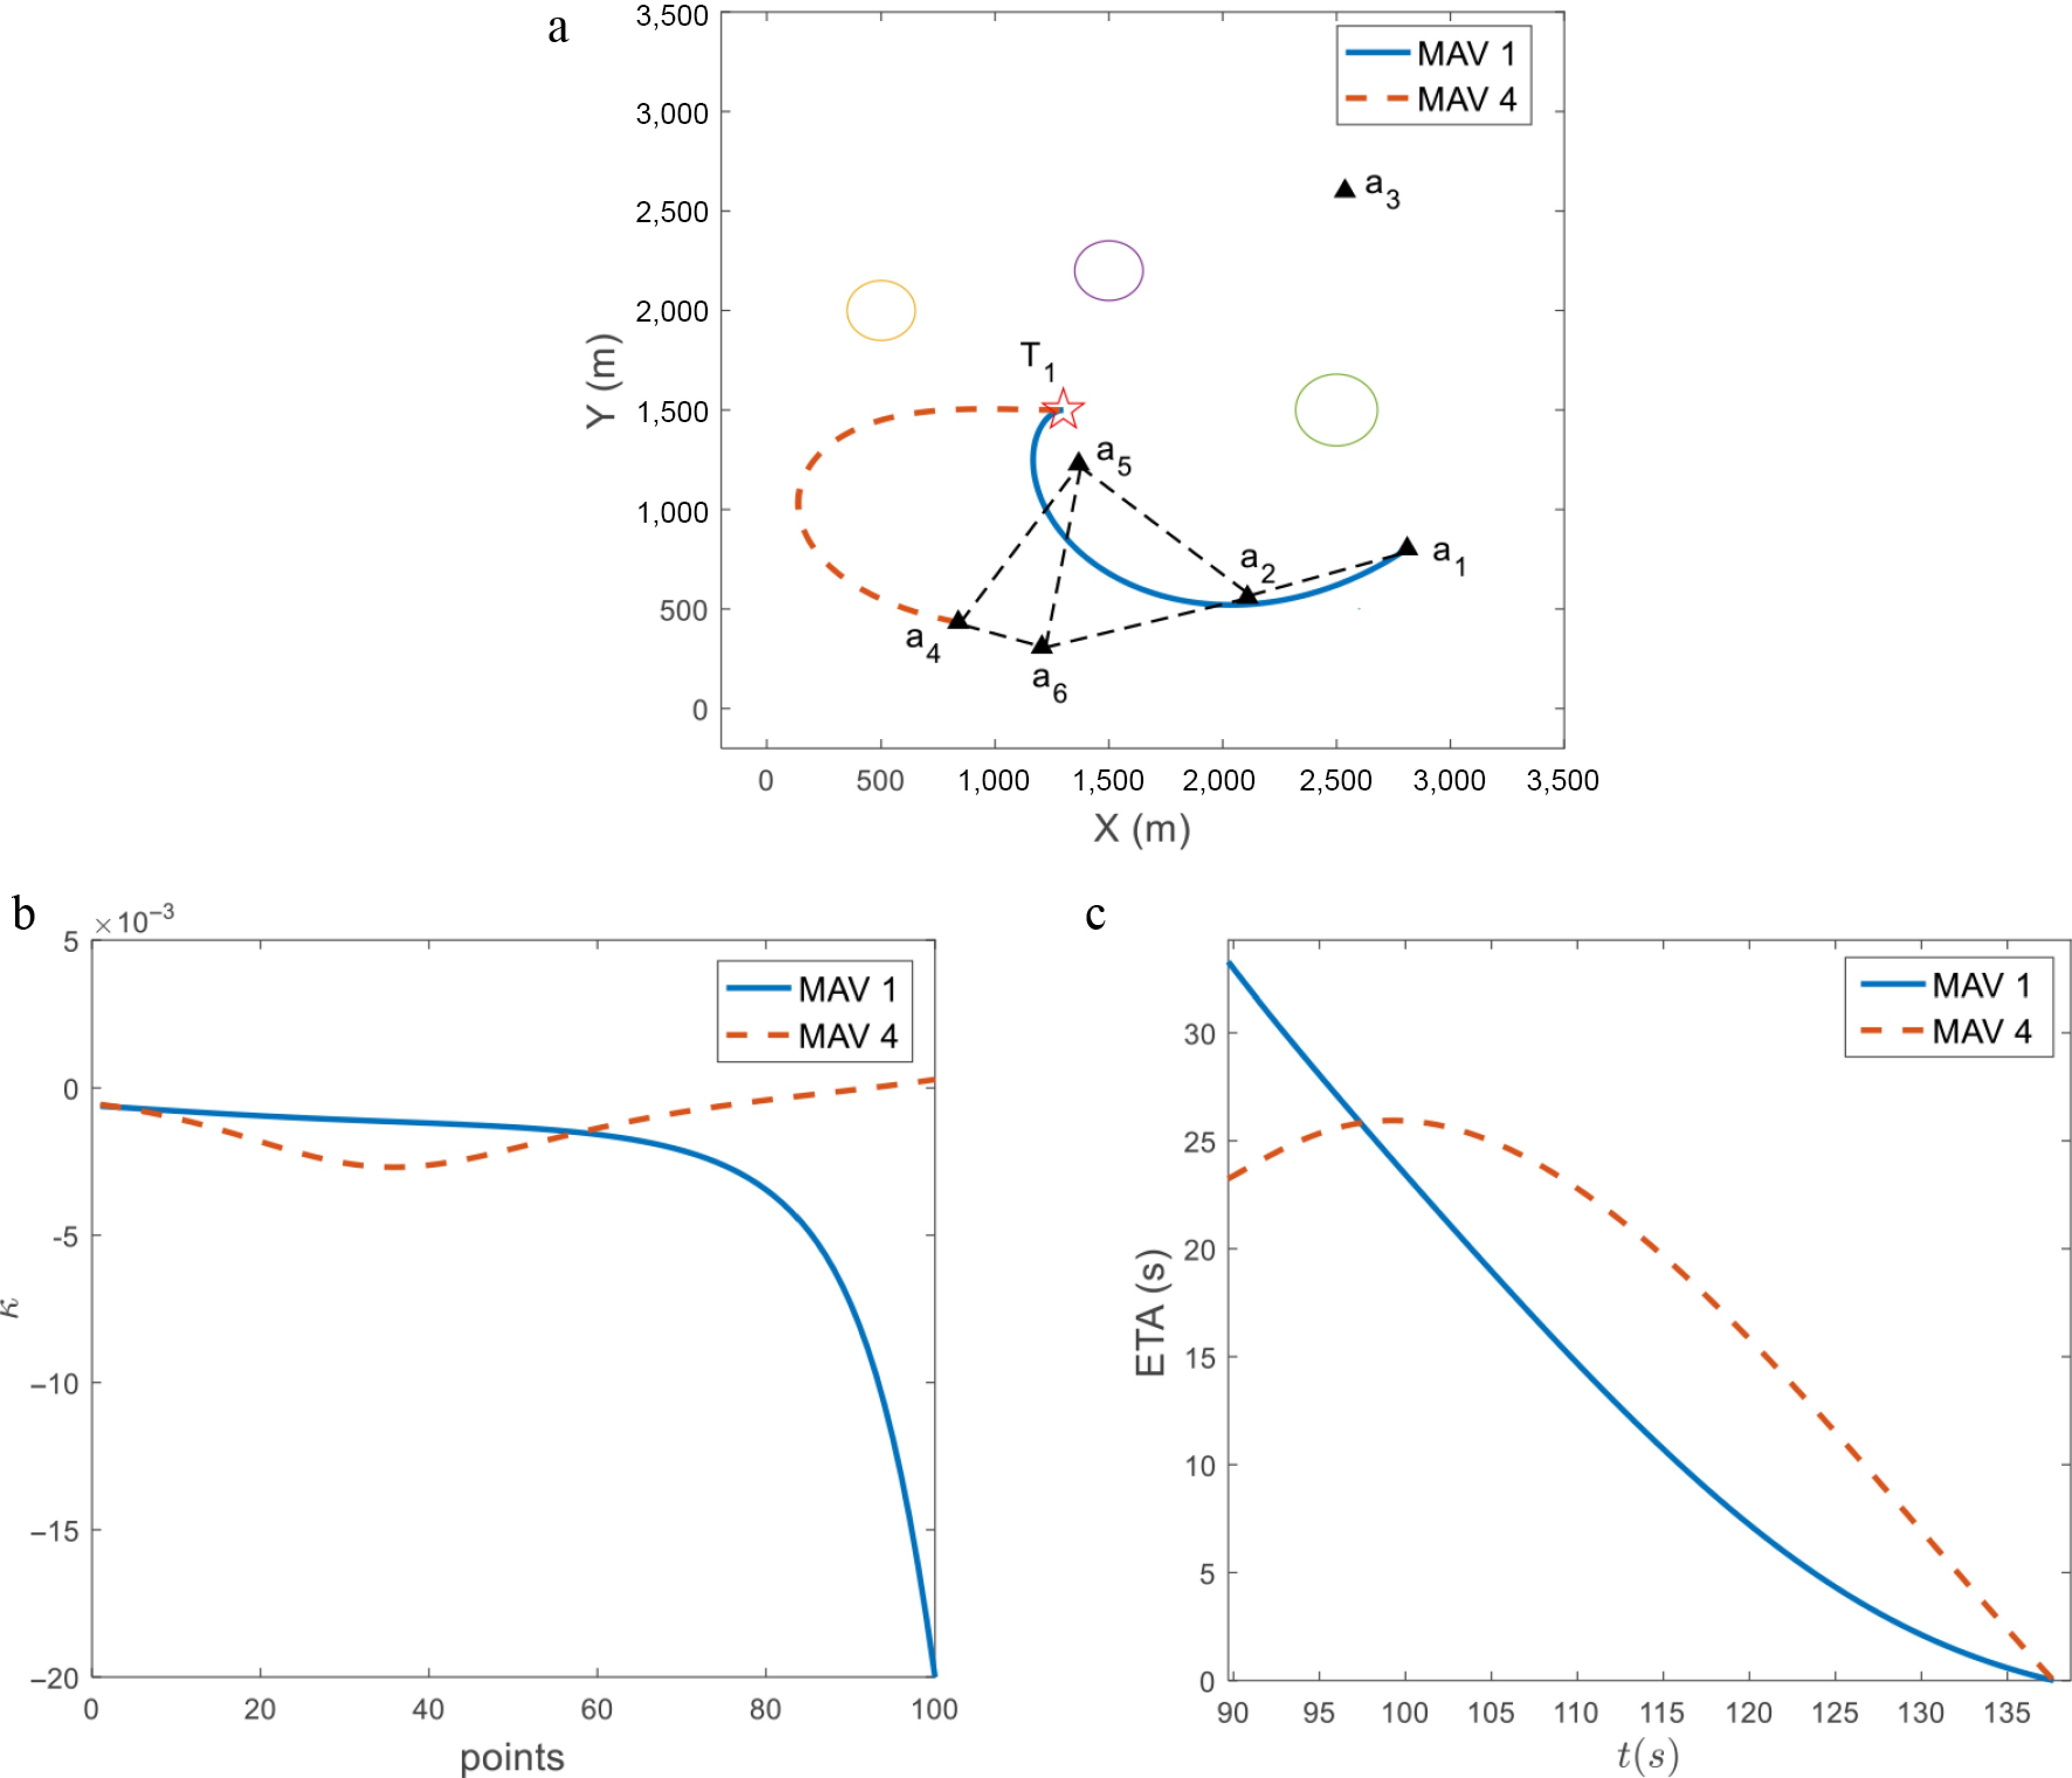
Figure 5.
The coalition formation results for task T1 at time 89.7 s. (a) MAV coalition for task T1. (b) Curvature of these paths. (c) Estimated time of arrival.
-
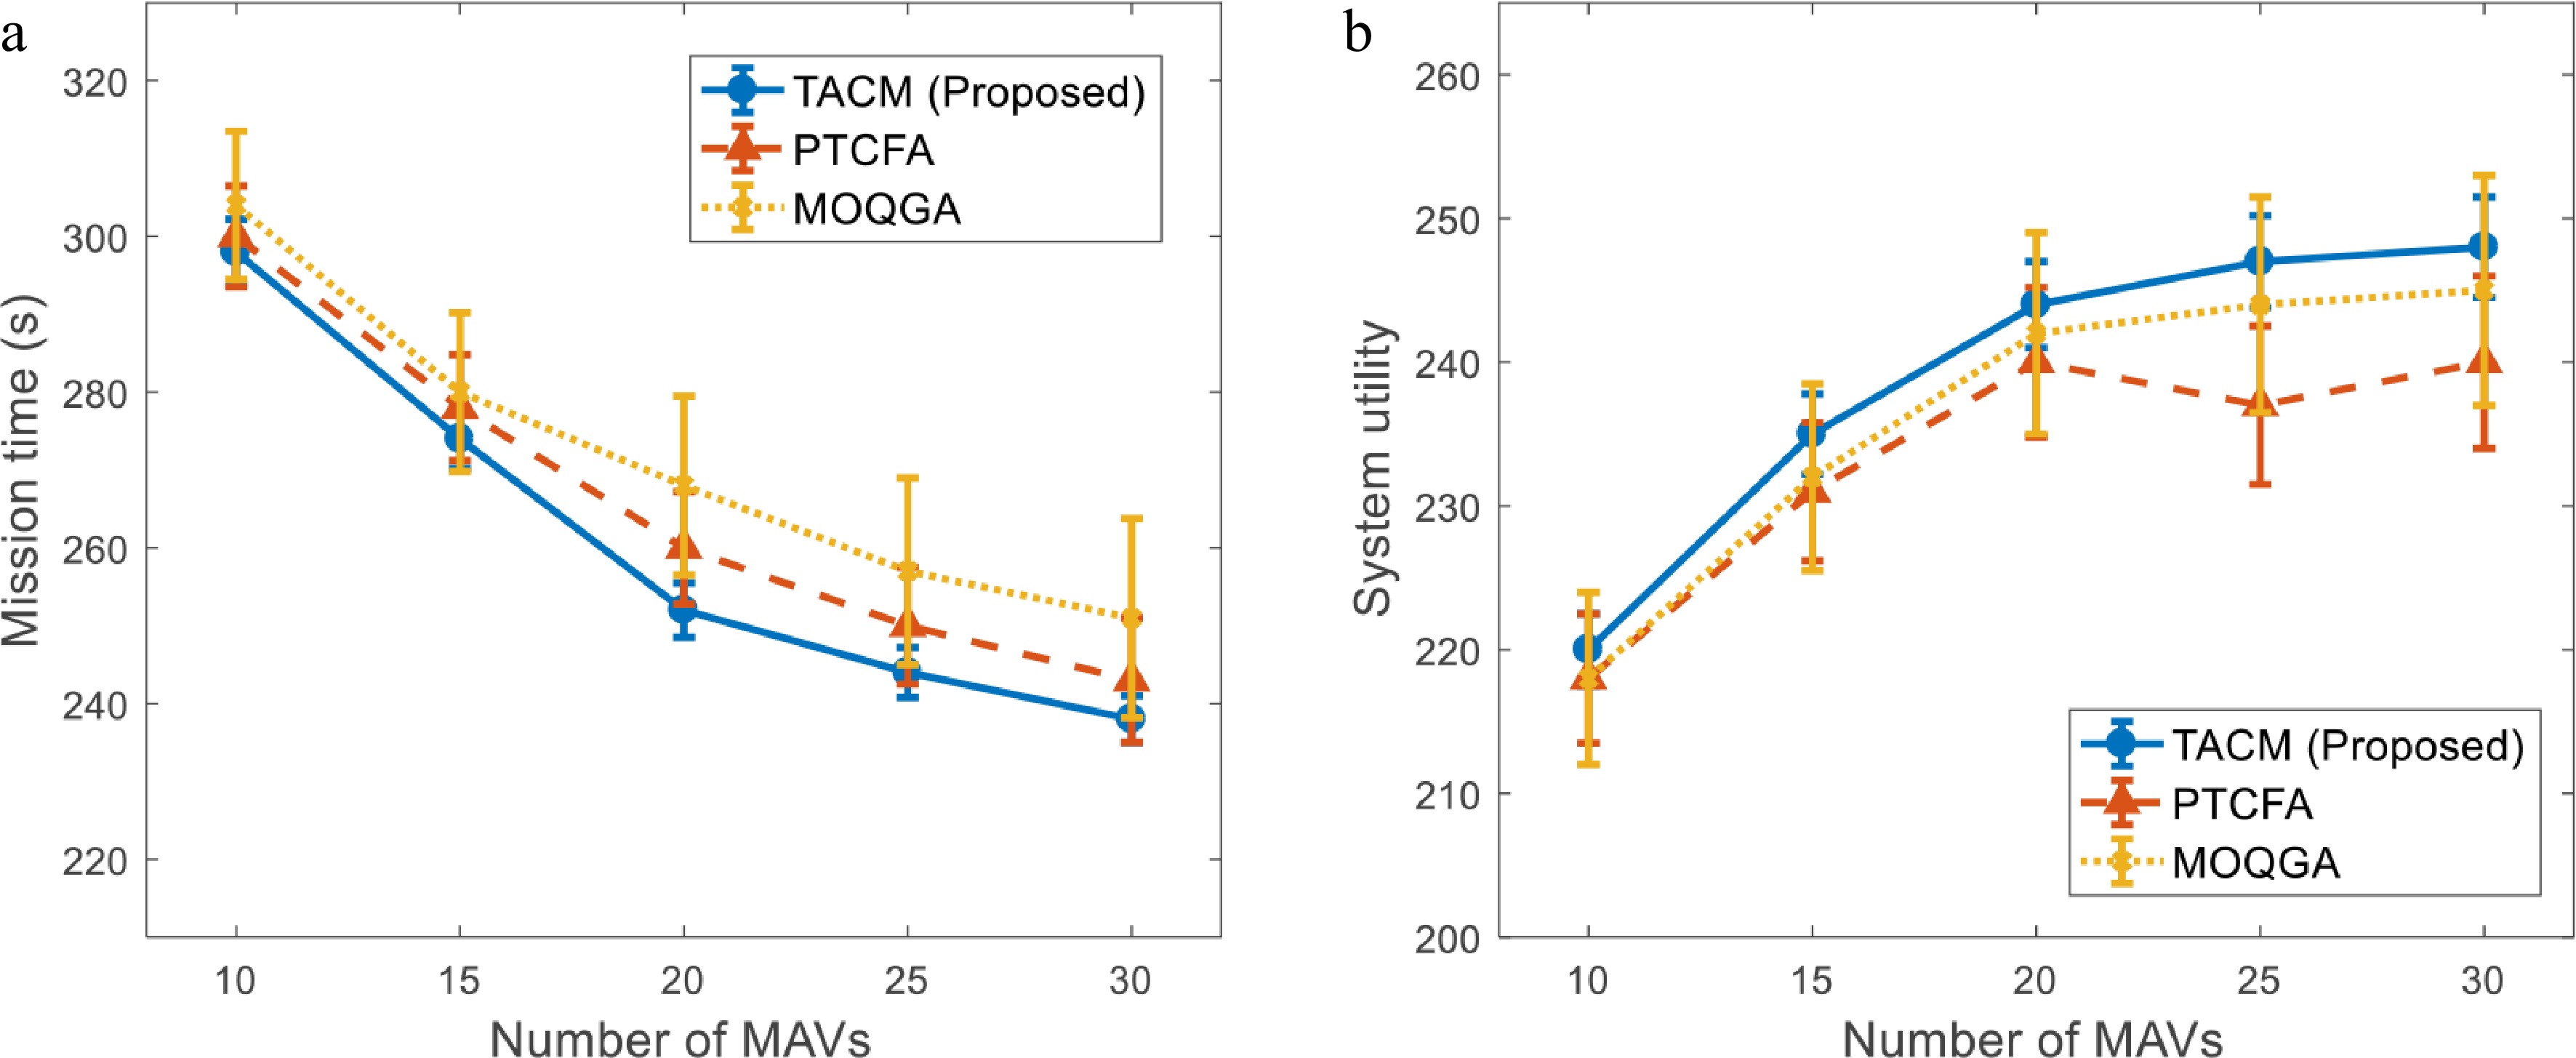
Figure 6.
Comparison of results from three coalition formation methods. (a) Average mission completion time. (b) Average system utility.
-
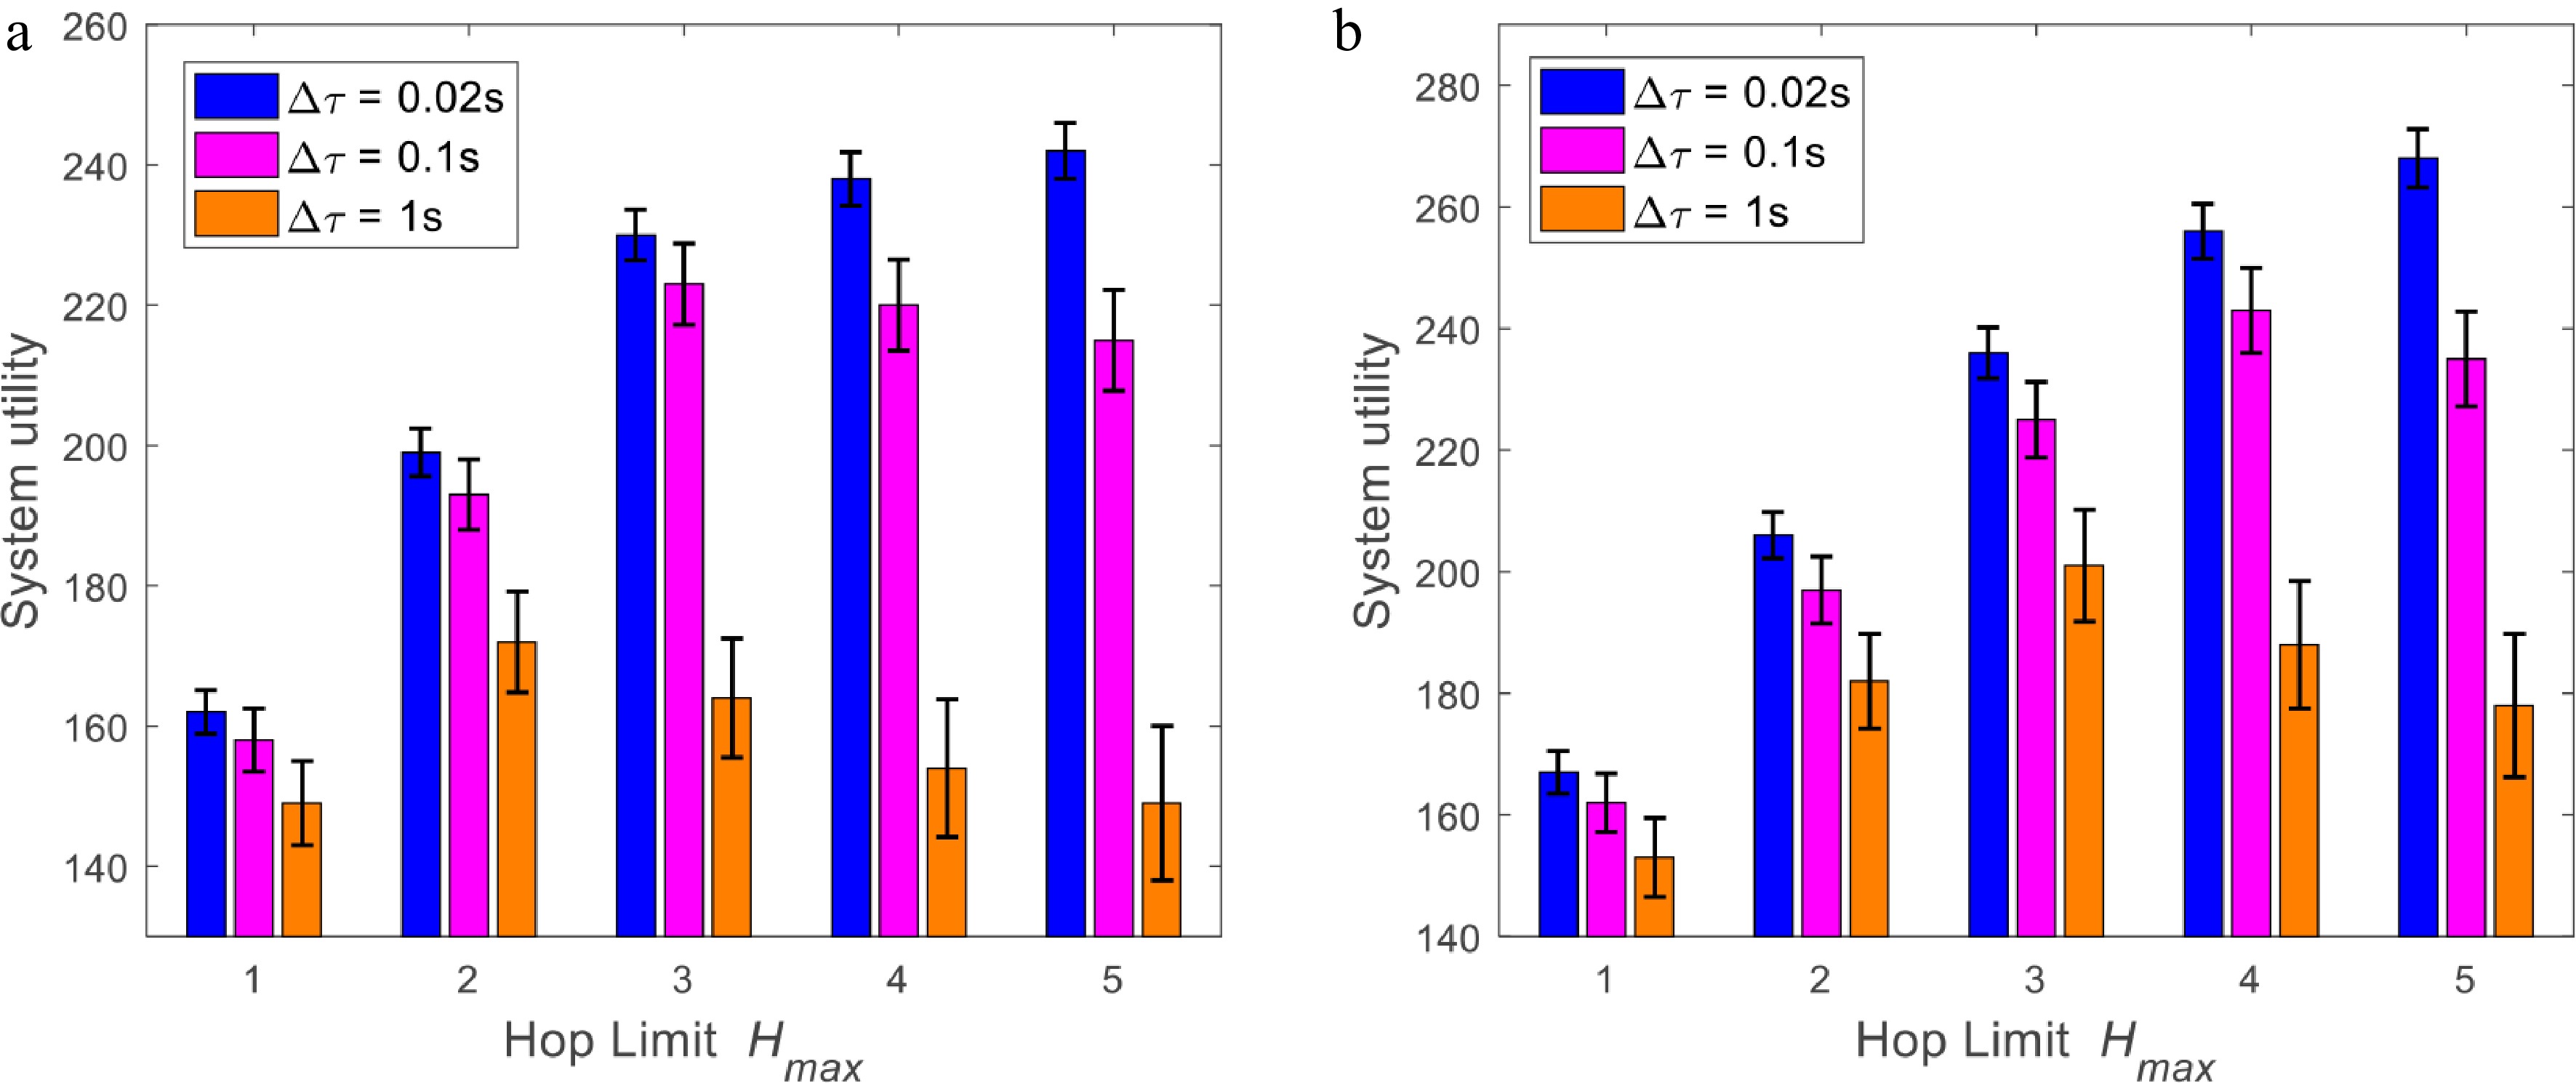
Figure 7.
Impact of communication constraints on the performance of the TACM method. (a) MAV's detection range: 300 m; communication range: 600 m. (b) MAV's detection range: 500 m; communication range: 1,000 m.
Figures
(7)
Tables
(0)