-

Figure 1.
Time course of accommodative parameters. AMP, amplitude of accommodation; NRA: negative relative accommodation; PRA, positive relative accommodation; AF, accommodative facility; cpm, cycles per minute.
-
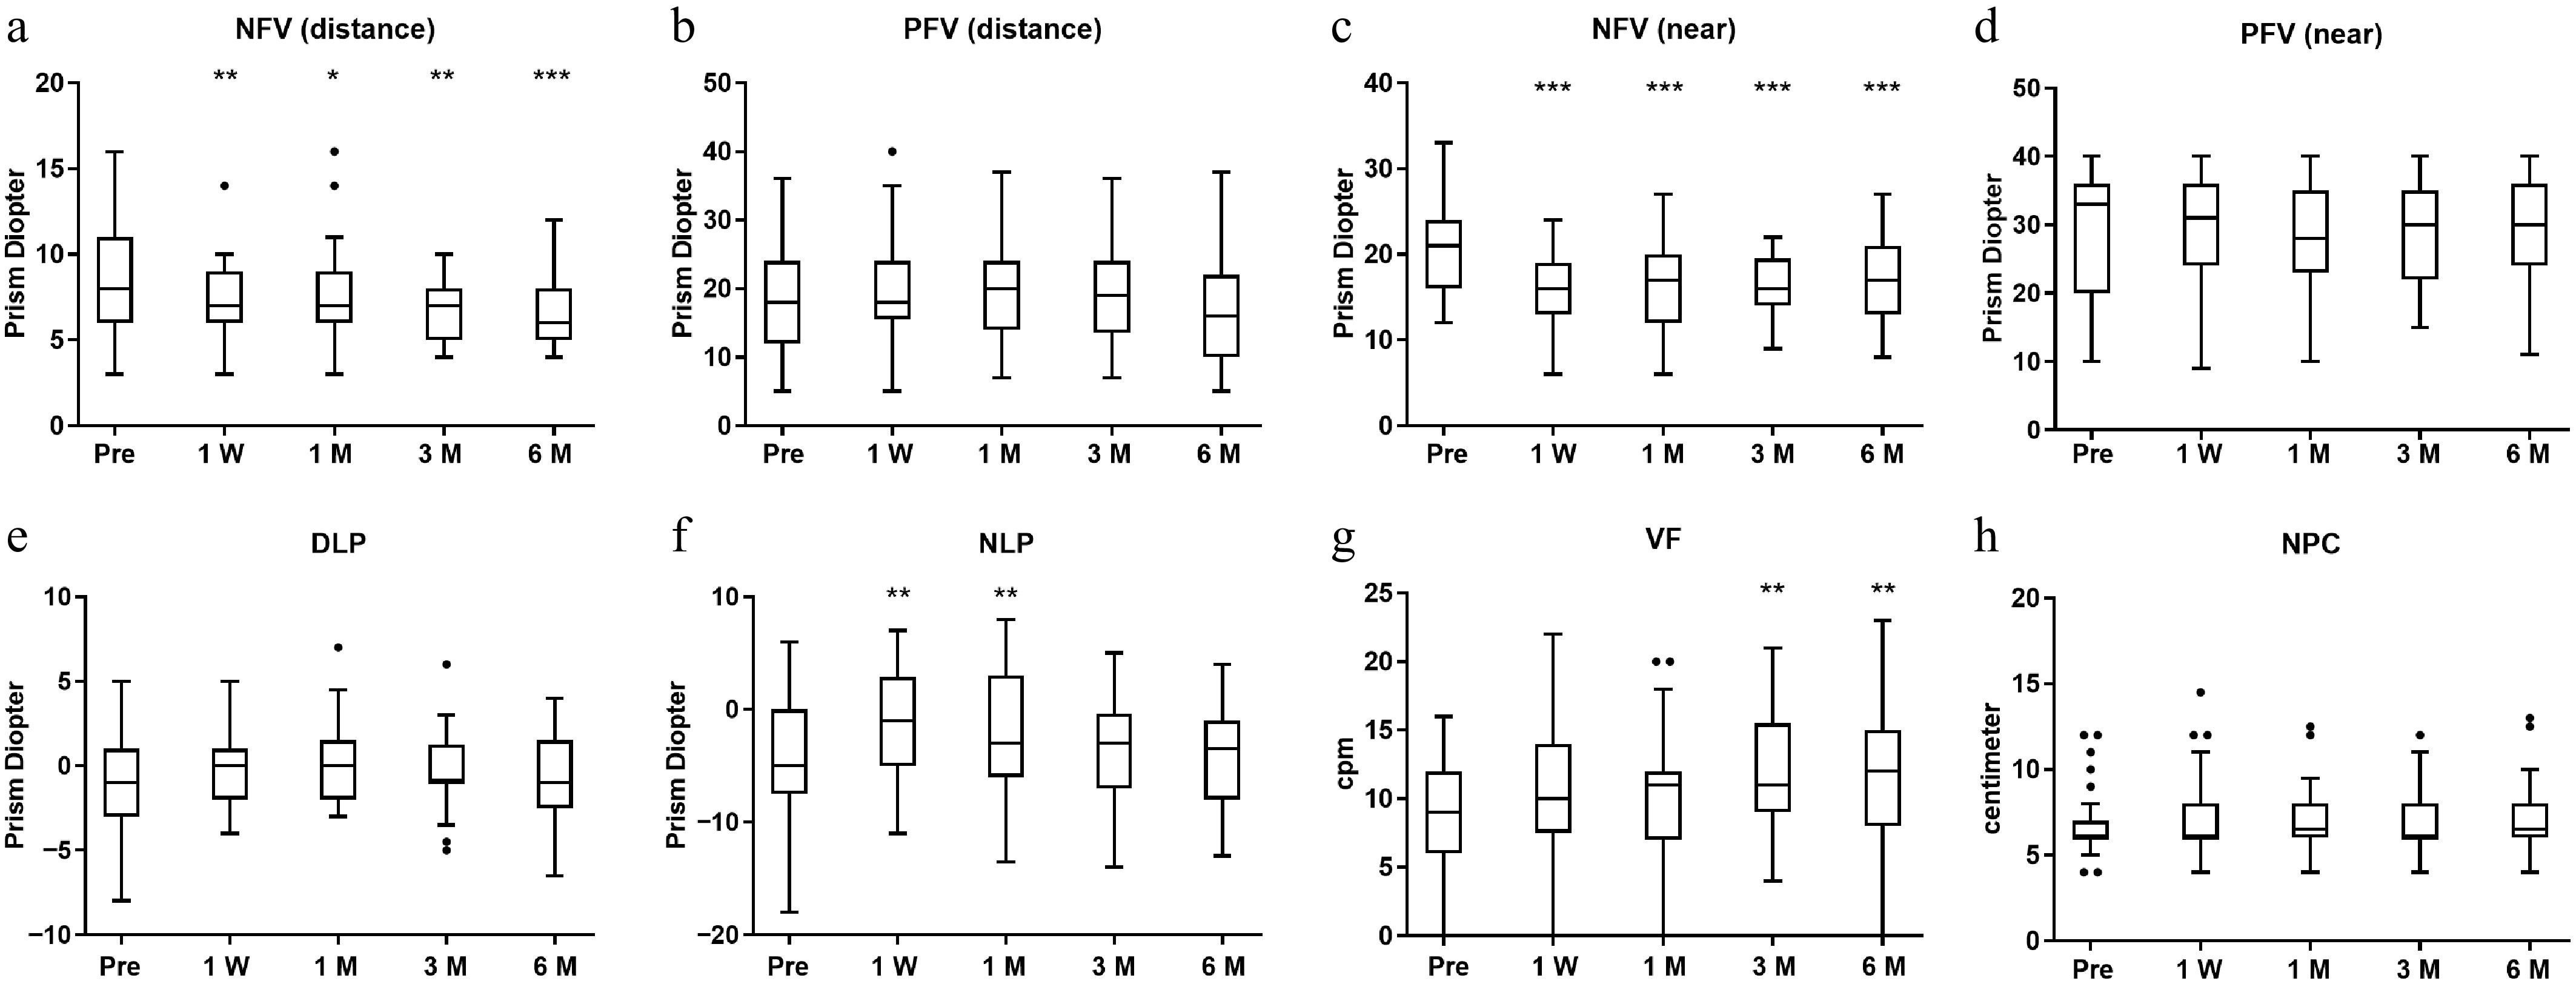
Figure 2.
Time course of phoria and vergence parameters. NFV, negative fusional vergence; PFV, positive fusional vergence; DLP, distance lateral phoria; NLP, near lateral phoria; NPC, near point of convergence; VF, vergence facility; cpm, cycles per minute.
-
Preoperative Postoperative Wald χ2 pa 1 Week 1 Month 3 Months 6 Months AMP 13.33 (11.11, 15.38) 10.00 (9.09, 12.50) 10.53 (9.09, 11.76) 11.11 (10.00, 12.50) 11.11 (10.00, 12.50) 48.120 < 0.001 pb < 0.001 < 0.001 0.003 0.007 NRA 2.50 (2.25, 2.50) 2.25 (2.25, 2.50) 2.50 (2.25, 2.50) 2.25 (2.25, 2.50) 2.50 (2.25, 2.50) 4.039 0.401 pb 1.000 0.645 1.000 0.615 PRA −2.50 (−3.75, −2.50) −2.25 (−2.75, −1.75) −2.50 (−3.25, −2.00) −3.00 (−3.50, −2.50) −3.00 (−3.50, −2.50) 29.771 < 0.001 pb 0.003 0.163 1.000 1.000 AF 9 (6, 11) 7 (4, 9) 7 (6, 10) 9 (7, 12) 9 (6, 12) 62.624 < 0.001 pb 0.039 1.000 0.006 0.018 Data are expressed as the median (Quantile 1, Quantile 3). AMP, amplitude of accommodation; NRA, negative relative accommodation; PRA, positive relative accommodation; AF, accommodative facility. pa-values represent the overall significance across all time points (GEE). pb-values represent the differences between the baseline and each postoperative follow-up visit, respectively. Table 1.
Time course of accommodative parameters.
-
Preoperative Postoperative Wald χ2 pa 1 Week 1 Month 3 Months 6 Months DLP −1 (−3, 1) 0 (−2, 1) 0 (−2, 2) −1 (−1, 2) −1 (−2, 2) 8.961 0.062 pb 0.554 0.107 1.000 1.000 NLP −5 (−8, 0) −1 (−5, 3) −3 (−6, 3) −3 (−8, −1) −3 (−7, −1) 54.819 <0.001 pb 0.001 0.008 0.432 1.000 NFV (distance) 8 (6, 10) 7 (6, 8) 7 (6, 8) 7 (5, 8) 6 (5, 7) 28.413 < 0.001 pb 0.007 0.010 0.009 0.001 PFV (distance) 18 (12, 24) 19 (16, 24) 20 (16, 26) 19 (13, 23) 16 (9, 22) 2.349 0.672 pb 1.000 1.000 1.000 1.000 NFV (near) 20 (15, 24) 16 (13, 19) 17 (12, 20) 16 (14, 20) 16 (13, 21) 66.526 < 0.001 pb < 0.001 < 0.001 < 0.001 < 0.001 PFV (near) 33 (22, 36) 32 (24, 36) 30 (24, 35) 31 (22, 36) 30 (25, 36) 4.902 0.298 pb 1.000 1.000 1.000 1.000 NPC 6.0 (6.0, 7.0) 6.0 (6.0, 8.0) 6.5 (6.0, 8.0) 6.0 (6.0, 8.0) 6.5 (6.0, 8.0) 4.156 0.385 pb 0.297 0.798 1.000 0.920 VF 9 (7, 12) 10 (8, 14) 11 (8, 14) 10 (9, 16) 12 (9, 15) 23.065 < 0.001 pb 0.086 0.092 0.004 0.003 Data are expressed as the median (Quantile 1, Quantile 3). DLP, distance lateral phoria; NLP, near lateral phoria; NFV, negative fusional vergence; PFV, positive fusional vergence; NPC, near point of convergence; VF, vergence facility. pa-values represent the overall significance across all time points (GEE). pb-values represent the differences between the baseline and each postoperative follow-up visit, respectively. Table 2.
Time course of phoria and vergence parameters.
-
Author (year) Surgery Key findings Proposed mechanisms Current study ICL Decreased AMP and NFV; improved AF and VF. Shift in the principal planes; change in retinal image magnification; neural adaptation. Li (2025) SMILE Decreased PRA and AF at 1 week. Related to the stimulation of corneal nerve function and acute refractive change. Haiting (2023) ICL Decreased AMP and AF at 1 week; improved at
3 months.Surgical trauma; inflammatory reactions; training-induced recovery. Long (2022) SMILE and ICL AMP decreased in the ICL group but remained stable in the SMILE group. Comparison of mechanical interaction between the haptics of the ICL and the ciliary muscle (ICL group) versus corneal remodeling (SMILE group). Sivaraman (2021) LASIK Decreased AMP; increased AF and NPC at
1 month.Improved accommodative accuracy and reduced depth of focus after correction. Karimian (2010) PRK Increased AMP and AF at 3 months. Influence of depth of focus, ocular aberrations, and ciliary body function. Prakash (2007) LASIK Decreased AC/A at 1 month; recovered by
3–9 months.Postoperative adjustment of accommodative effort to the new emmetropic state. AC/A, accommodative convergence/accommodation; AMP, amplitude of accommodation; AF, accommodative facility; NFV, negative fusional vergence; PRA, positive relative accommodation; NPC, near point of convergence. Table 3.
Summary of binocular visual function changes across various refractive procedures.
Figures
(2)
Tables
(3)