-
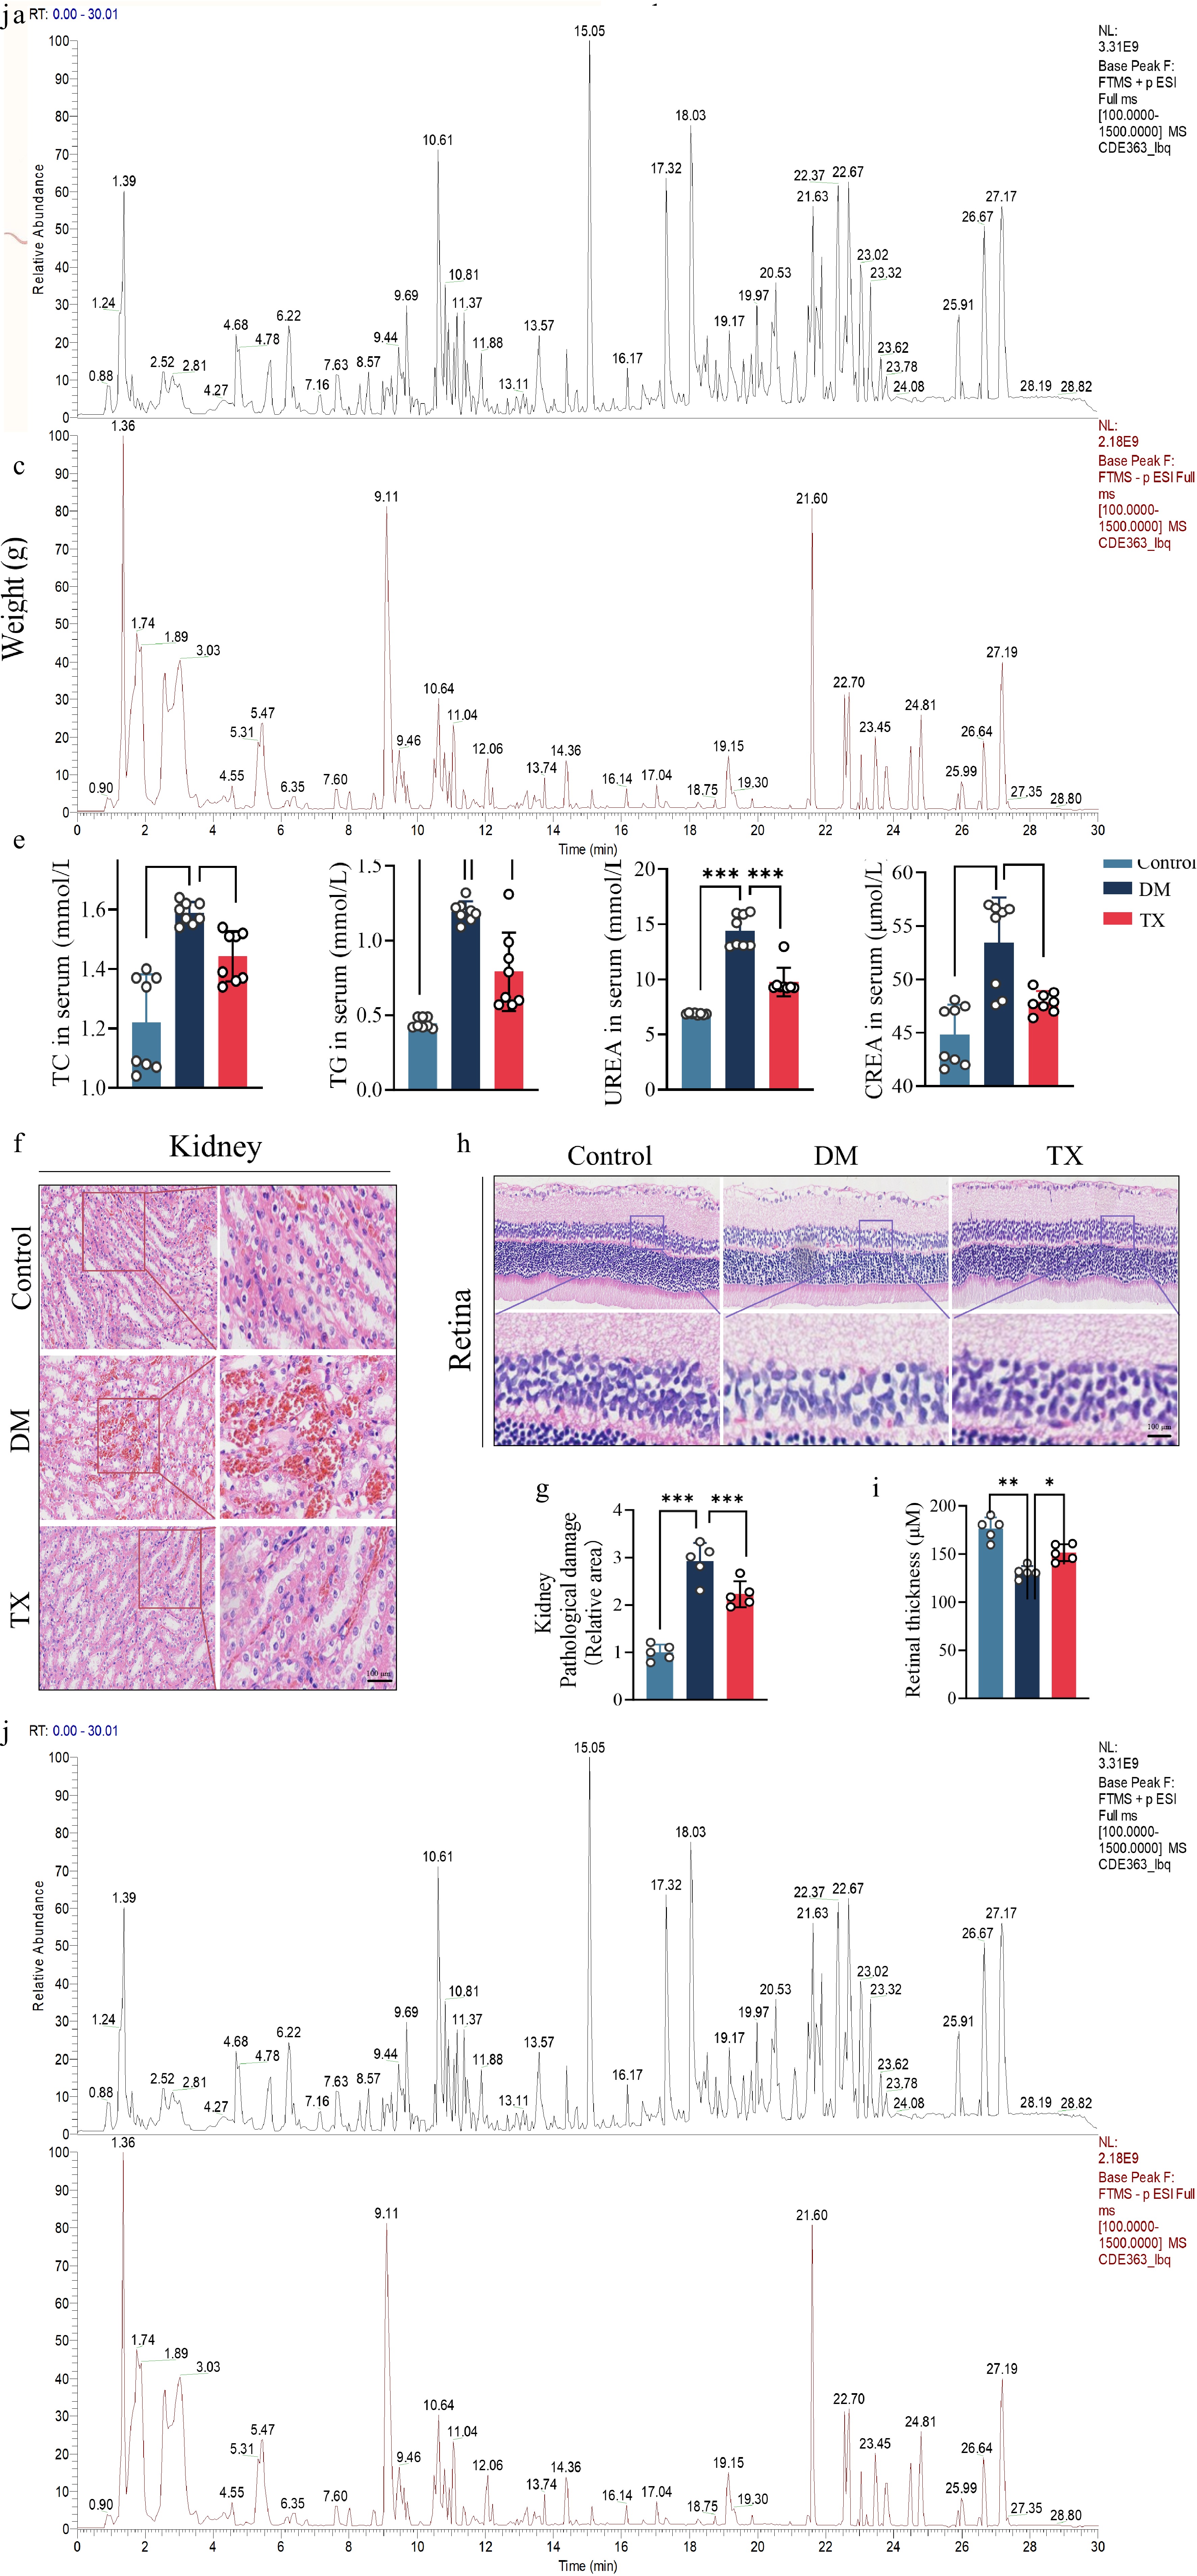
Figure 1.
ZJHY ameliorates metabolic disturbance, retinal and renal injury, and renal dysfunction in diabetic rats. (a) Schematic of the animal experimental design: Sprague-Dawley rats were randomized into the control group (Control), the diabetes mellitus group (DM), and the ZJHY-treated diabetic groups (TX). DM was induced by HFD and streptozotocin; ZJHY was administered 4 weeks post-STZ for 4 weeks. Time-course analysis of (b) fasting blood glucose (FBG), and (c) body weight during the experimental period (n = 7 per group). (d) Serum levels of inflammatory factors (IL-6, IL-1β) by ELISA or biochemical assays (n = 7 per group). (e) Serum levels of lipid metabolites (triglycerides [TG], total cholesterol [TC]), and renal function markers (urea [UREA], creatinine [CREA]) measured by ELISA or biochemical assays (n = 8 per group). Hematoxylin and Eosin (H&E) staining of (f) retinal, and (h) kidney tissues (scale bar: 100 μm). Quantitative histological scoring of (g) kidney, and (i) retinal damage (n = 5 per group). (j) Base Peak Chromatogram (BPC) of ZJHY extract analyzed by UPLC-Q-TOF/MS; 85 compounds were identified (Supplementary Table S2). Data are presented as mean ± SD. Statistical significance was determined by one-way ANOVA with Tukey's post-hoc test (* p < 0.05, ** p < 0.01, *** p < 0.001).
-
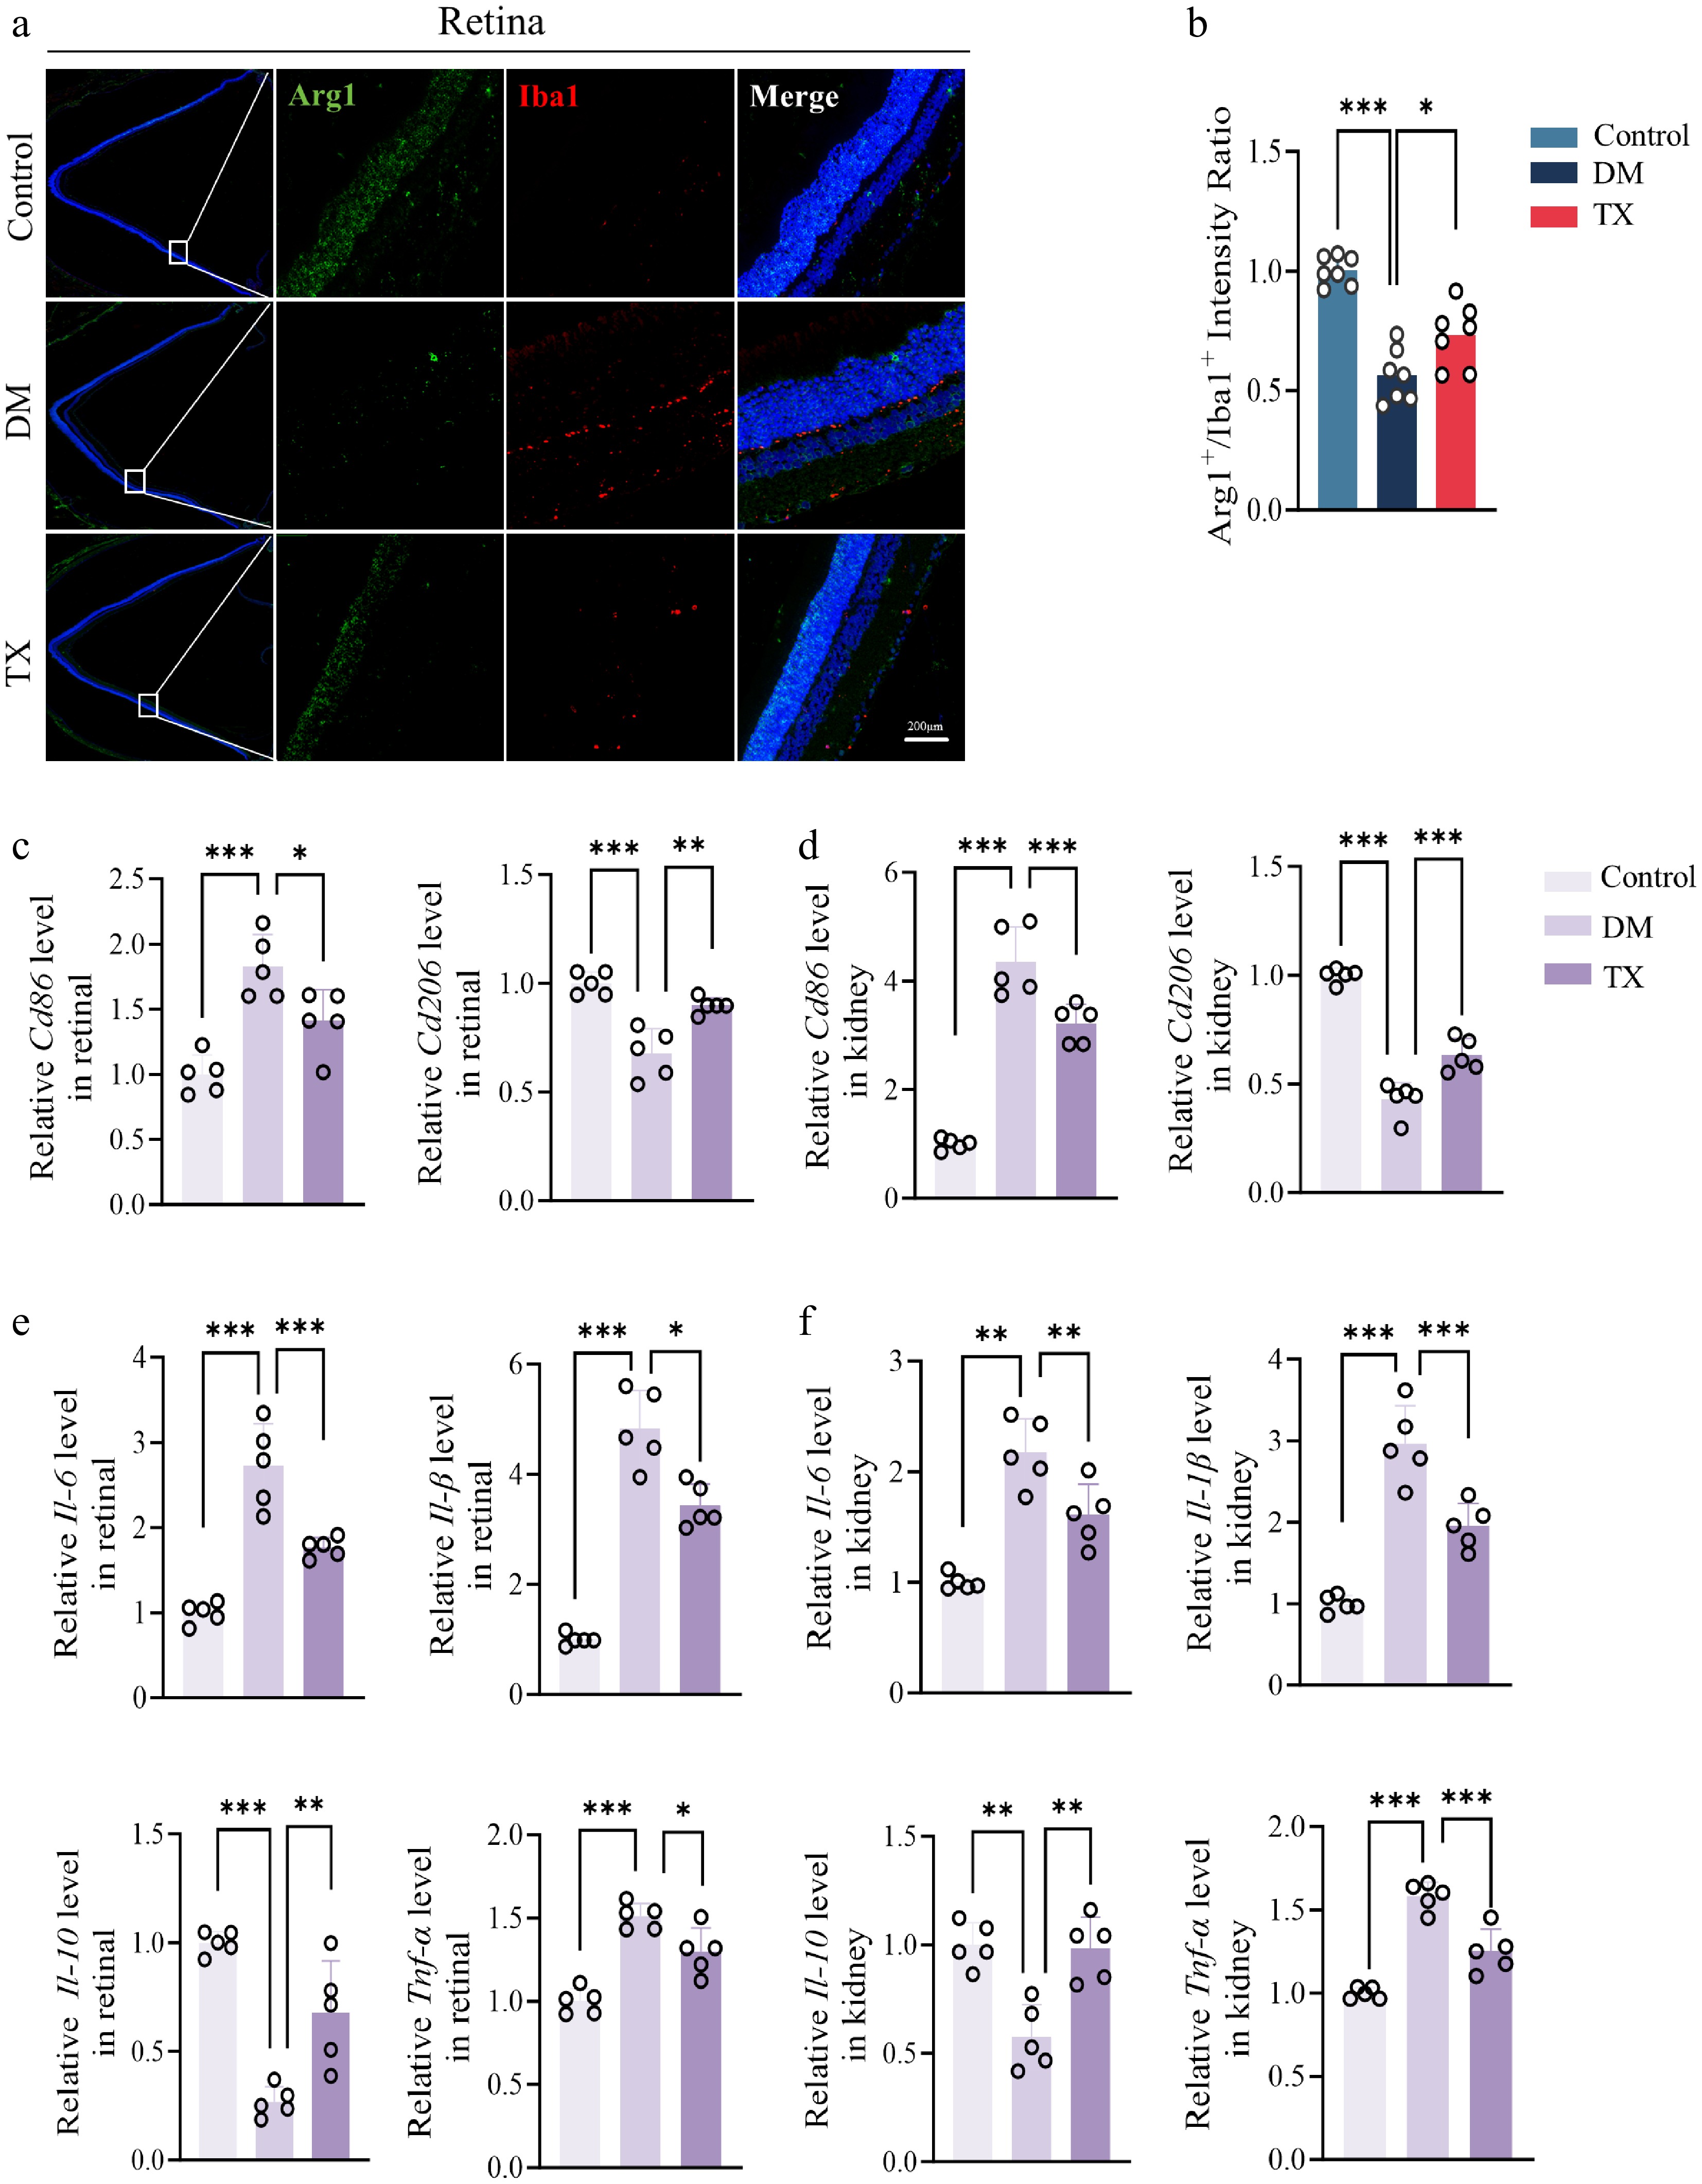
Figure 2.
ZJHY suppresses macrophage-mediated inflammation and cellular apoptosis in diabetic retinal and kidney. (a), (b) Immunofluorescence staining of retinal for (a) Iba-1 and Arg-1 (scale bar: 100 μm), and (b) quantification of the Arg1+ /Iba1+ratio (n = 7 per group). qPCR test for (c) Cd68, and (d) Cd206 in retinal and kidney tissues (n = 5 per group). (e), (f) Relative mRNA expression of pro-inflammatory genes (Tnf-α, Il-6, Il-1β) and anti-inflammatory gene (Il-10) in retinal and kidney measured by qPCR (n = 5 per group). Data are presented as mean ± SD. Statistical significance was determined by one-way ANOVA with Tukey's post-hoc test (* p < 0.05, ** p < 0.01, *** p < 0.001).
-
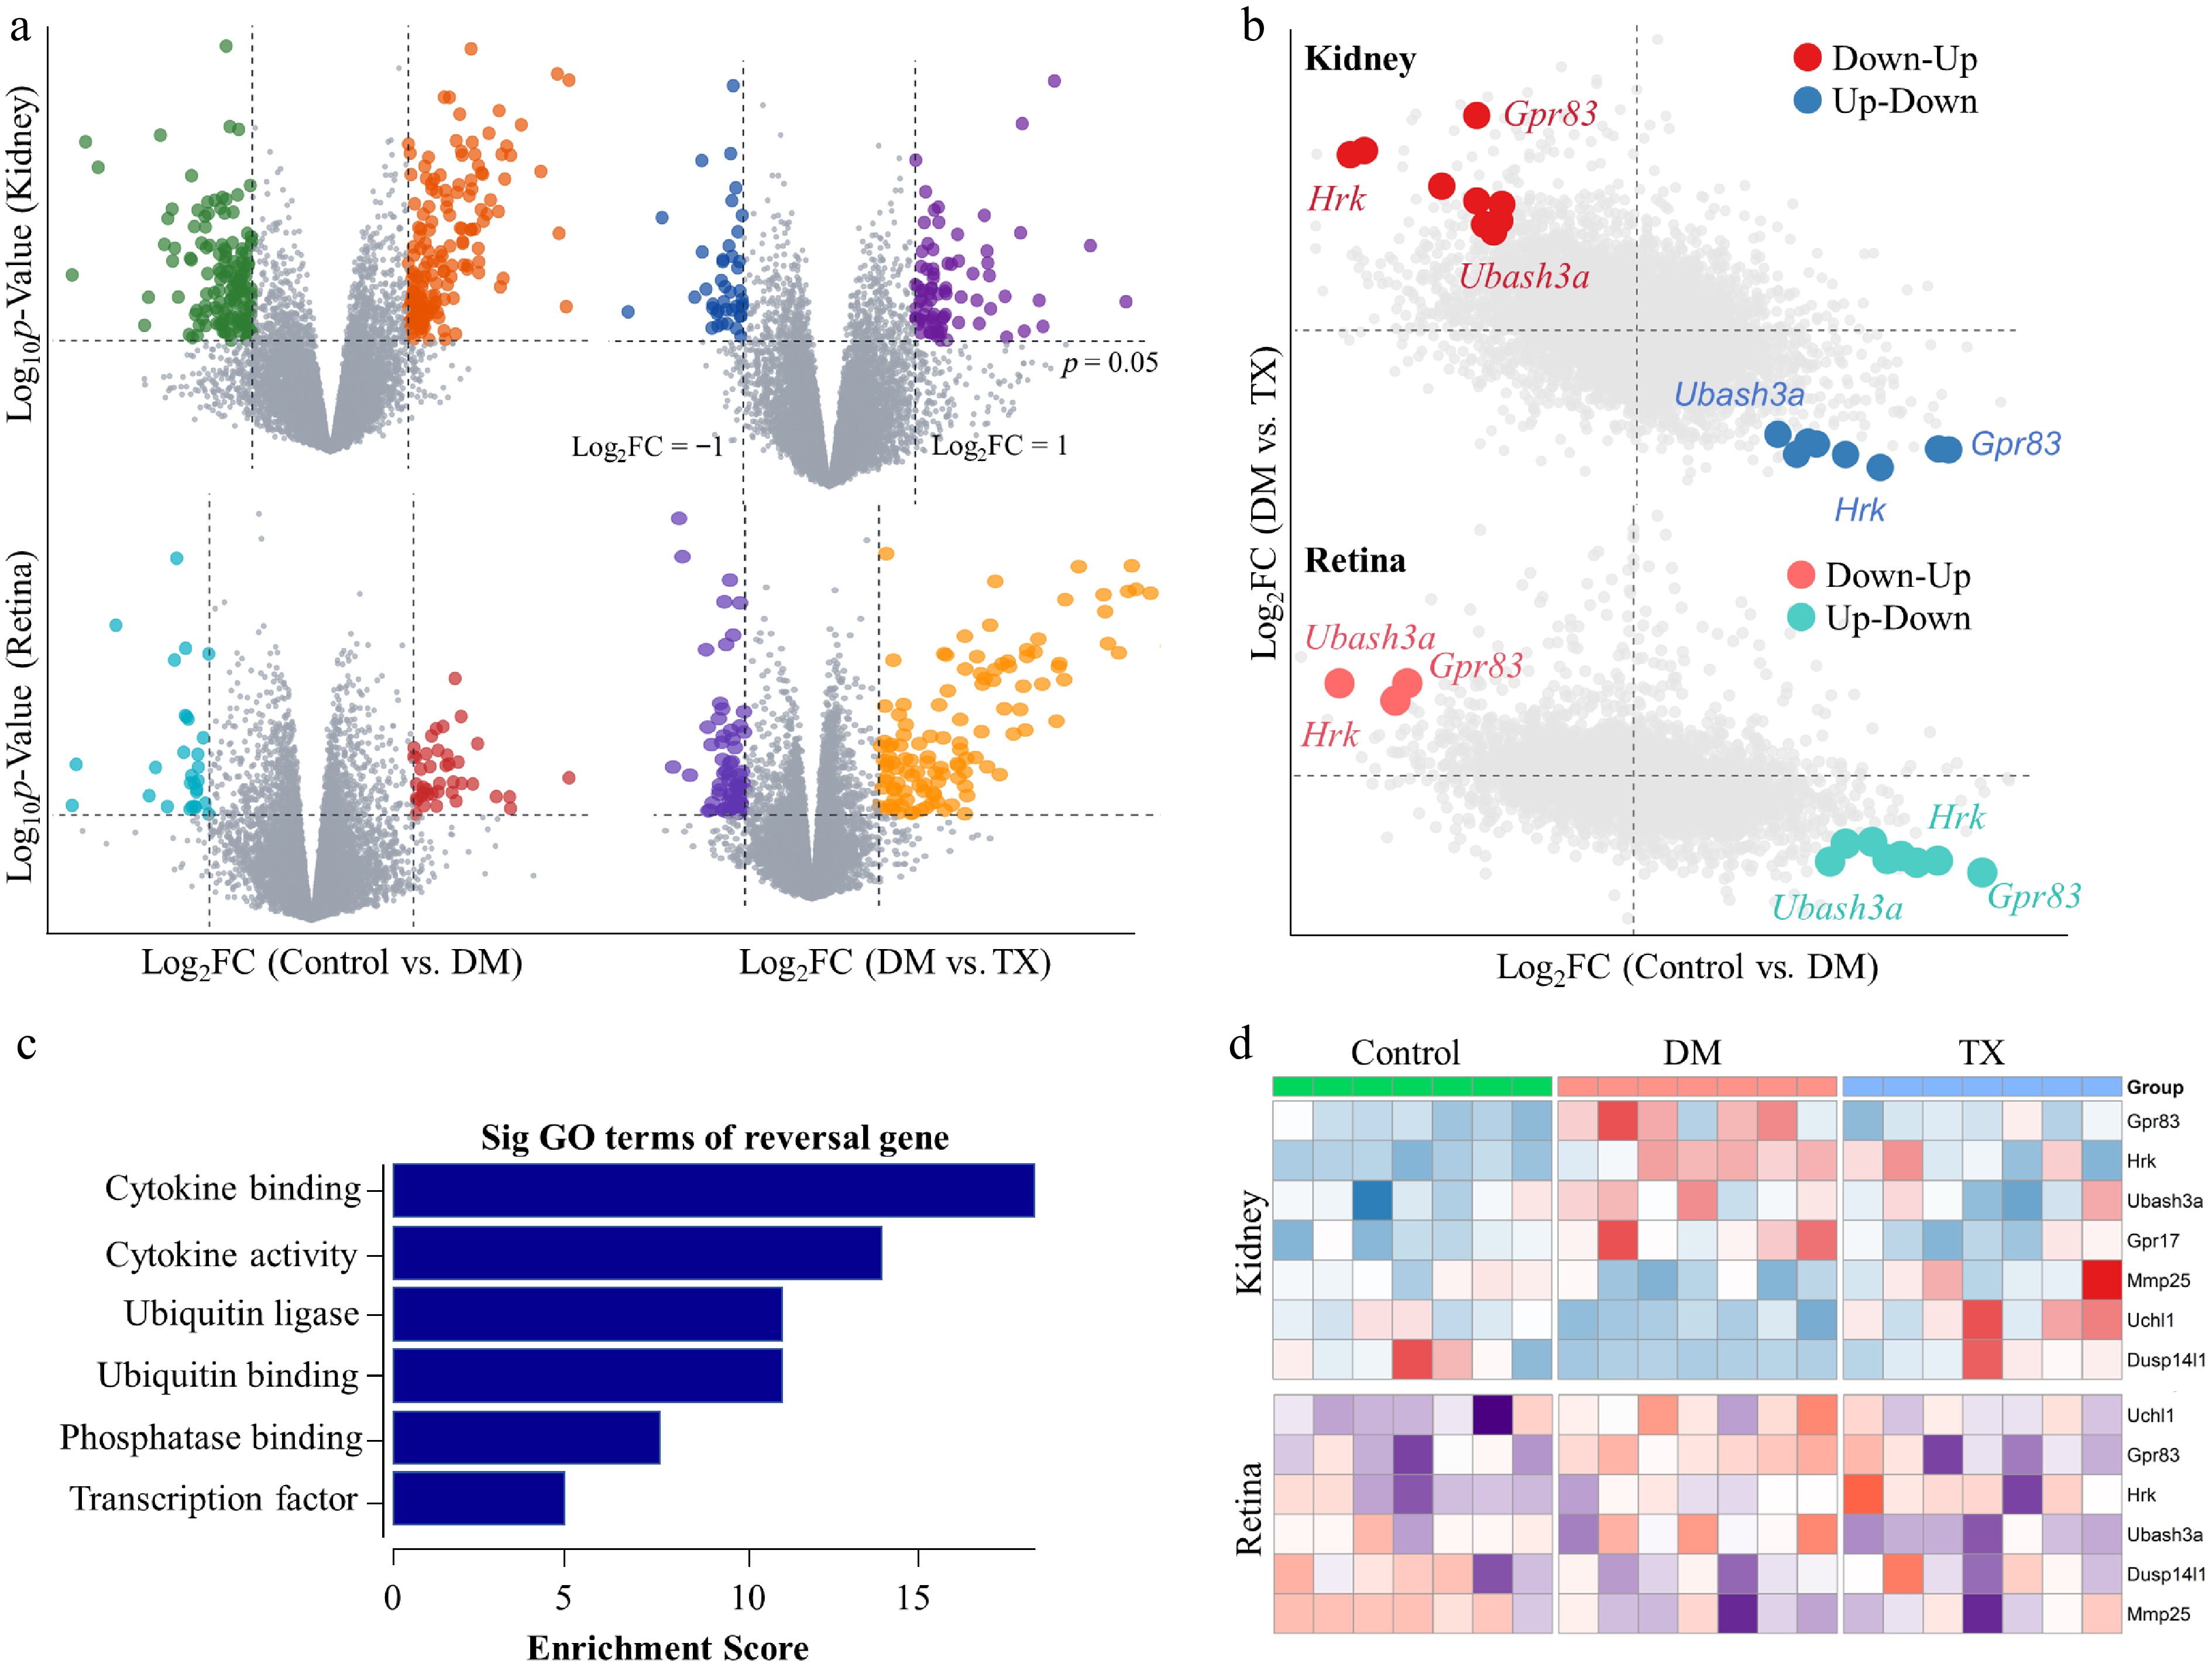
Figure 3.
Transcriptomic analysis identifies GPR83 as a key target of ZJHY in DR and DN. (a) Volcano plots of differentially expressed genes (DEGs) in the kidney and retina: left panels show DEGs between DM and Control groups, right panels show DEGs between the TX and DM groups (|log2 Fold Change| > 1, adj. p < 0.05). (b) Venn diagrams illustrating the overlap of DEGs with consistent expression patterns: upregulated in diabetes and downregulated by ZJHY treatment (top), or downregulated in diabetes and upregulated by ZJHY treatment (bottom) in both tissues. (c) Gene Ontology (GO) biological process and Kyoto Encyclopedia of Genes and Genomes (KEGG) pathway enrichment analysis of core co-regulated DEGs (adj. p < 0.05). (d) Heatmaps showing the expression of top candidate genes (Gpr83, Hrk, Ubash3a) in retinal and kidney tissues across groups.
-
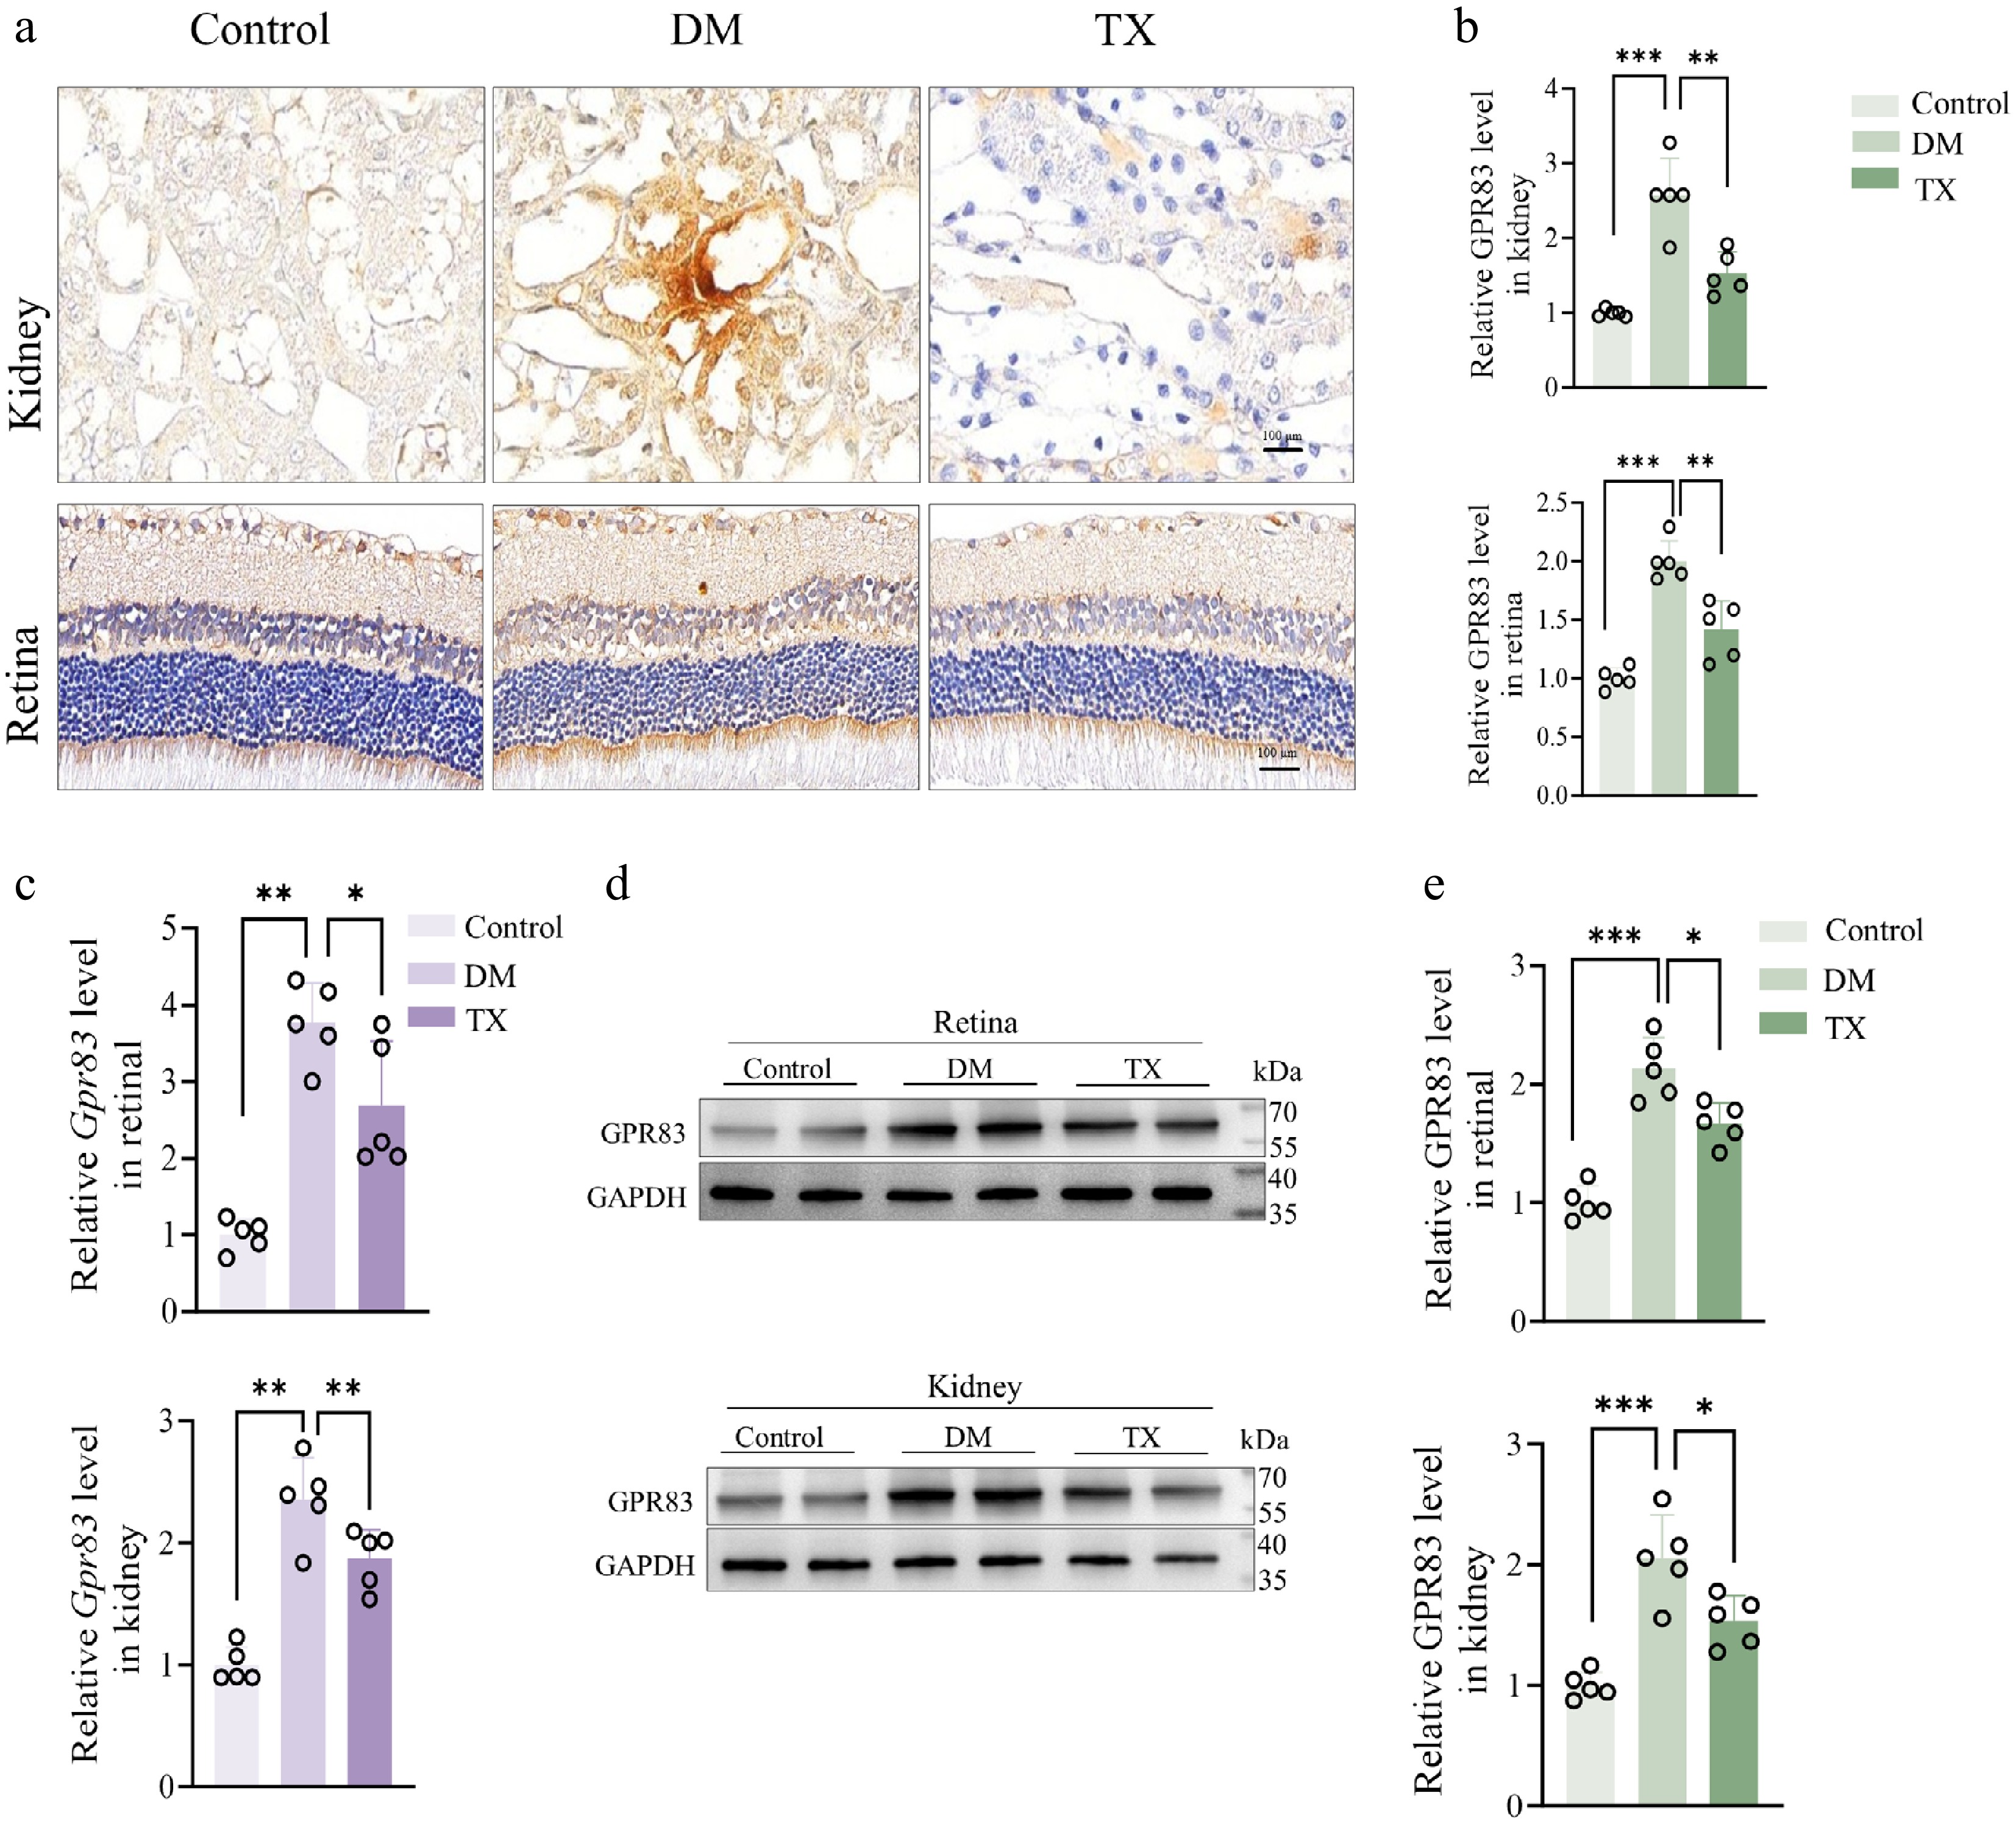
Figure 4.
ZJHY regulates the expression of GPR83 in the kidneys and retinal tissues in vivo. (a), (b) IHC staining of GPR83 in kidney and retinal tissues (scale bar: 50 μm) and quantification of positive staining intensity (n = 5 per group). (c) qPCR validation of Gpr83 mRNA expression in retina and kidney (n = 5 per group). (d), (e) Western blot analysis of GPR83 protein levels in retinal and kidney tissues (n = 5 per group). Data are presented as mean ± SD. Statistical significance was determined by one-way ANOVA with Tukey's post-hoc test (* p < 0.05, ** p < 0.01, *** p < 0.001).
-
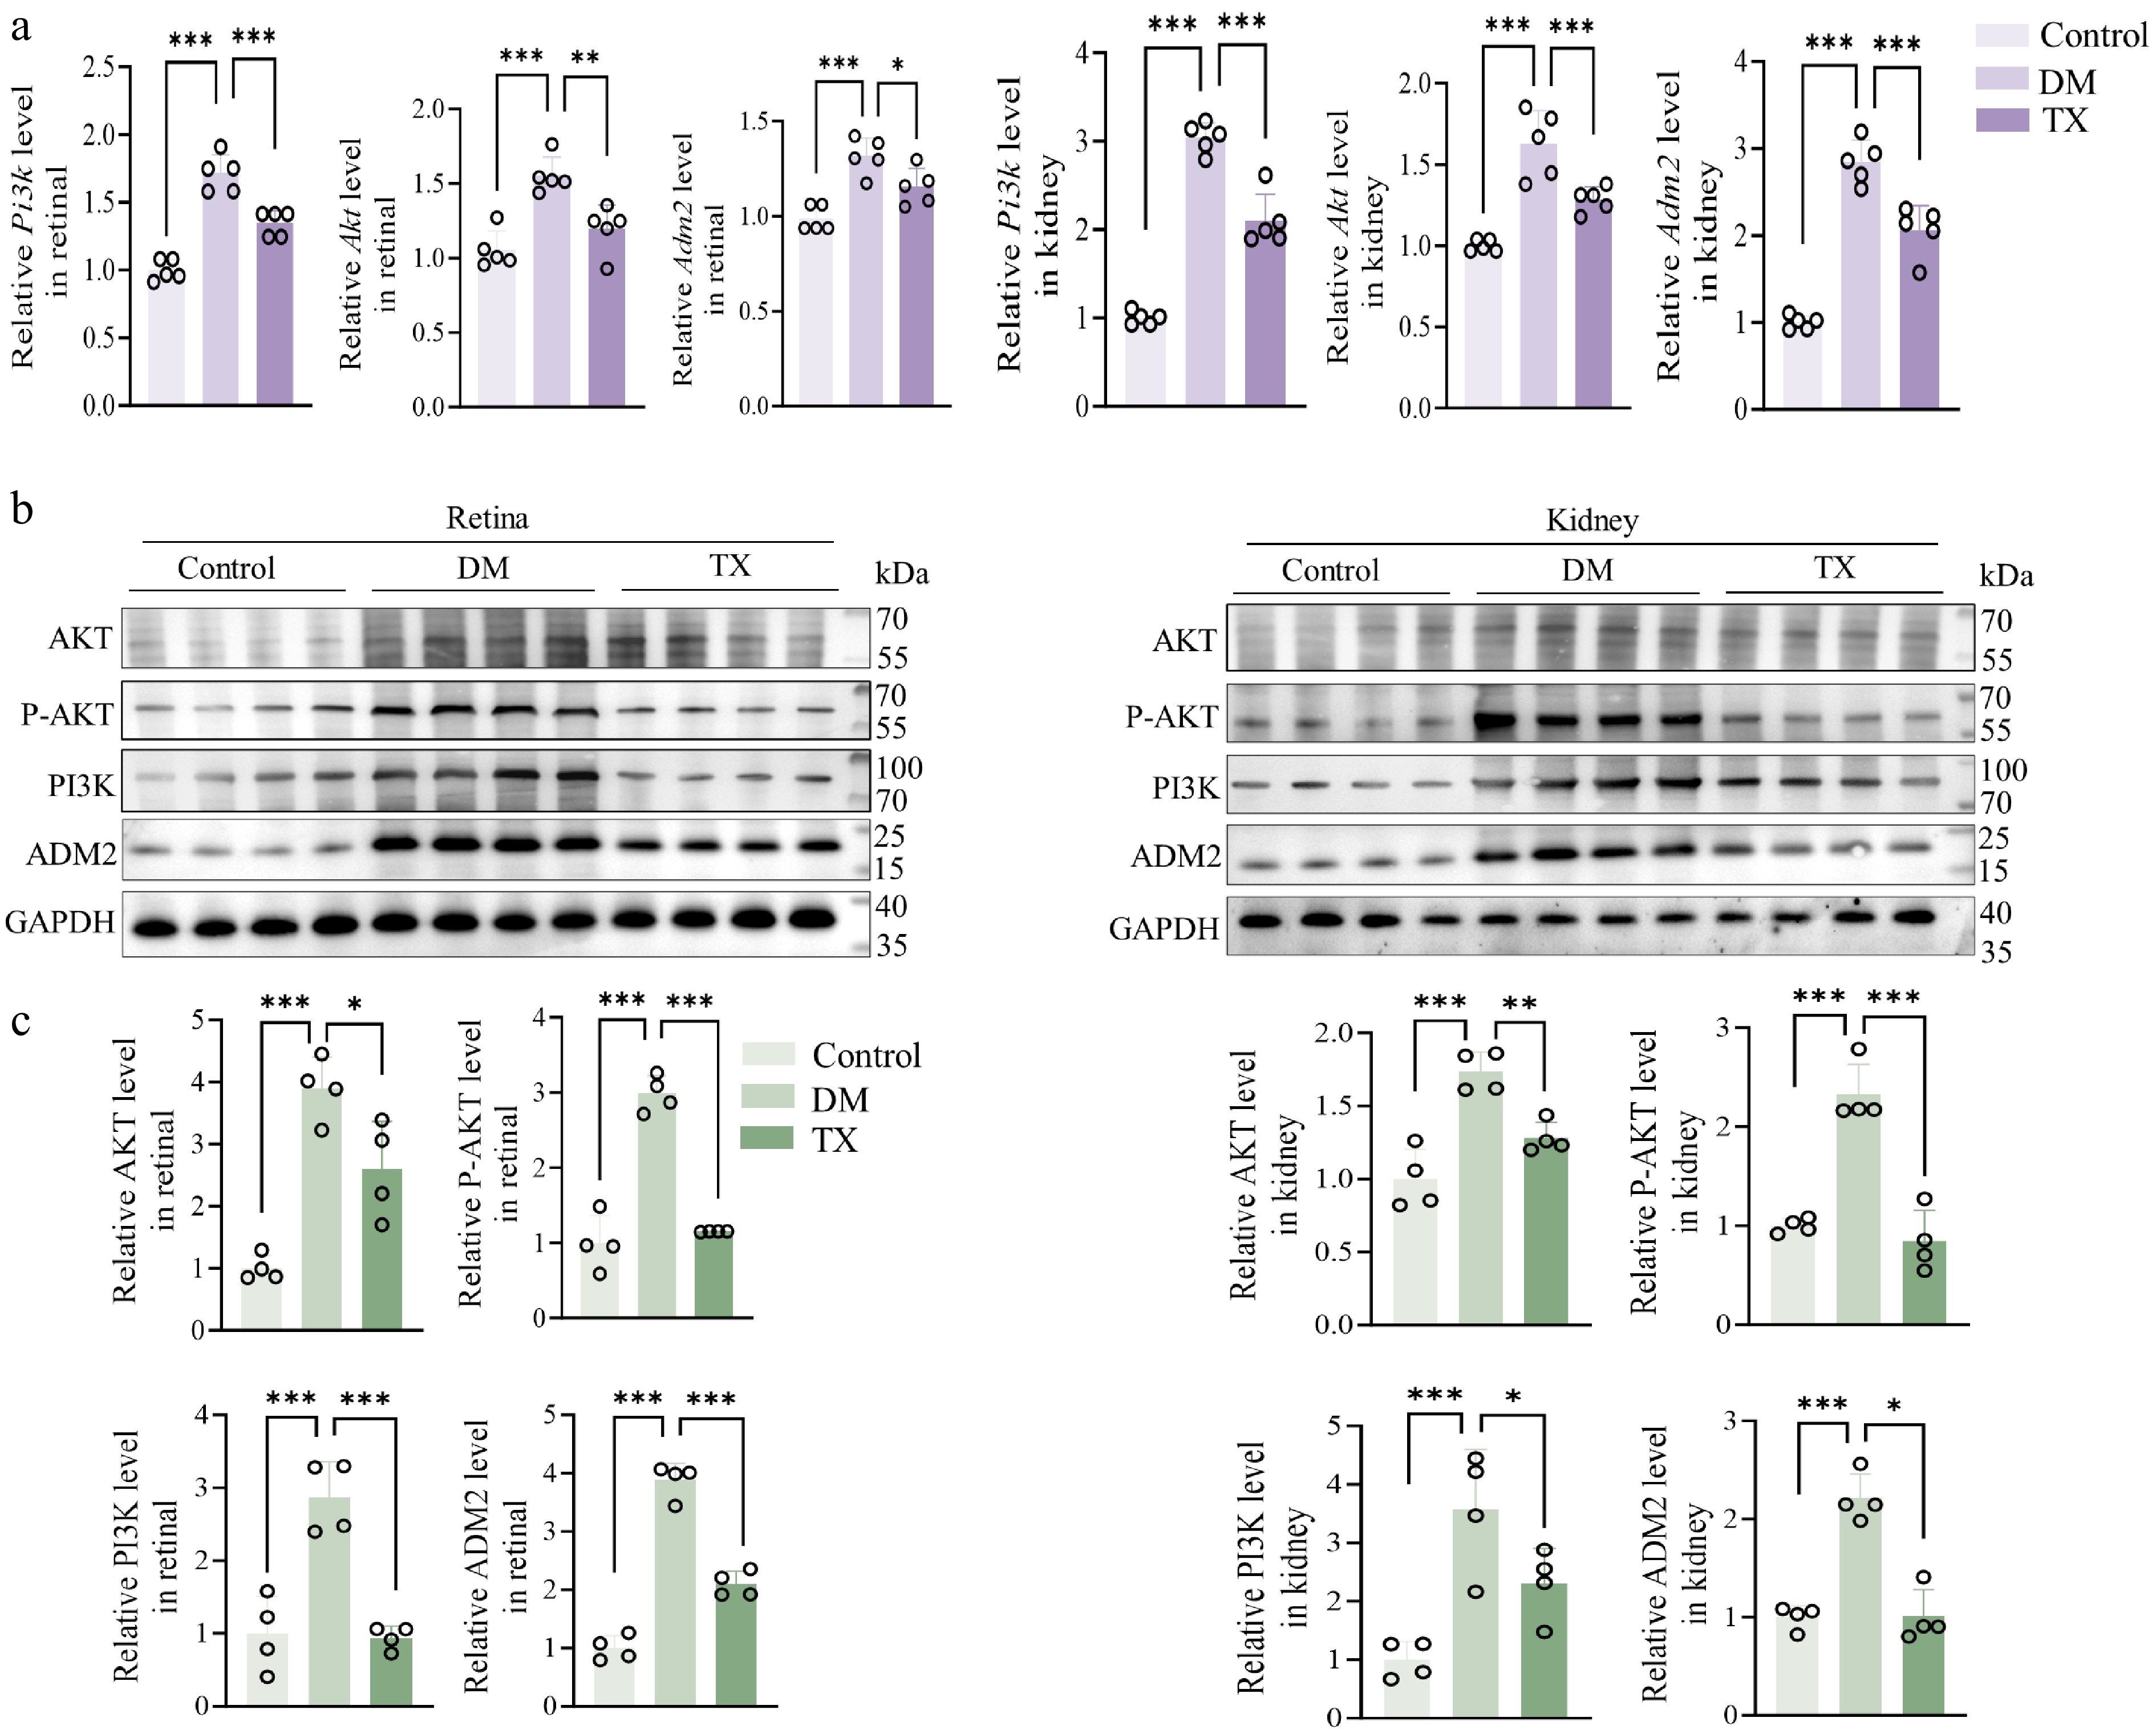
Figure 5.
ZJHY reverses diabetes-induced upregulation of ADM2 and AKT in retinal and renal tissues. (a) Relative mRNA expression of Pi3k, Akt, and Adm2 in retinal and kidney tissue measured by qPCR (n = 5 per group). (b), (c) Western blot analysis of PI3K, p-AKT, AKT, and ADM2 protein levels in retinal and kidney tissues (n = 4 per group). Data are presented as mean ± SD. Statistical significance was determined by one-way ANOVA with Tukey's post-hoc test (* p < 0.05, ** p < 0.01, *** p < 0.001).
-
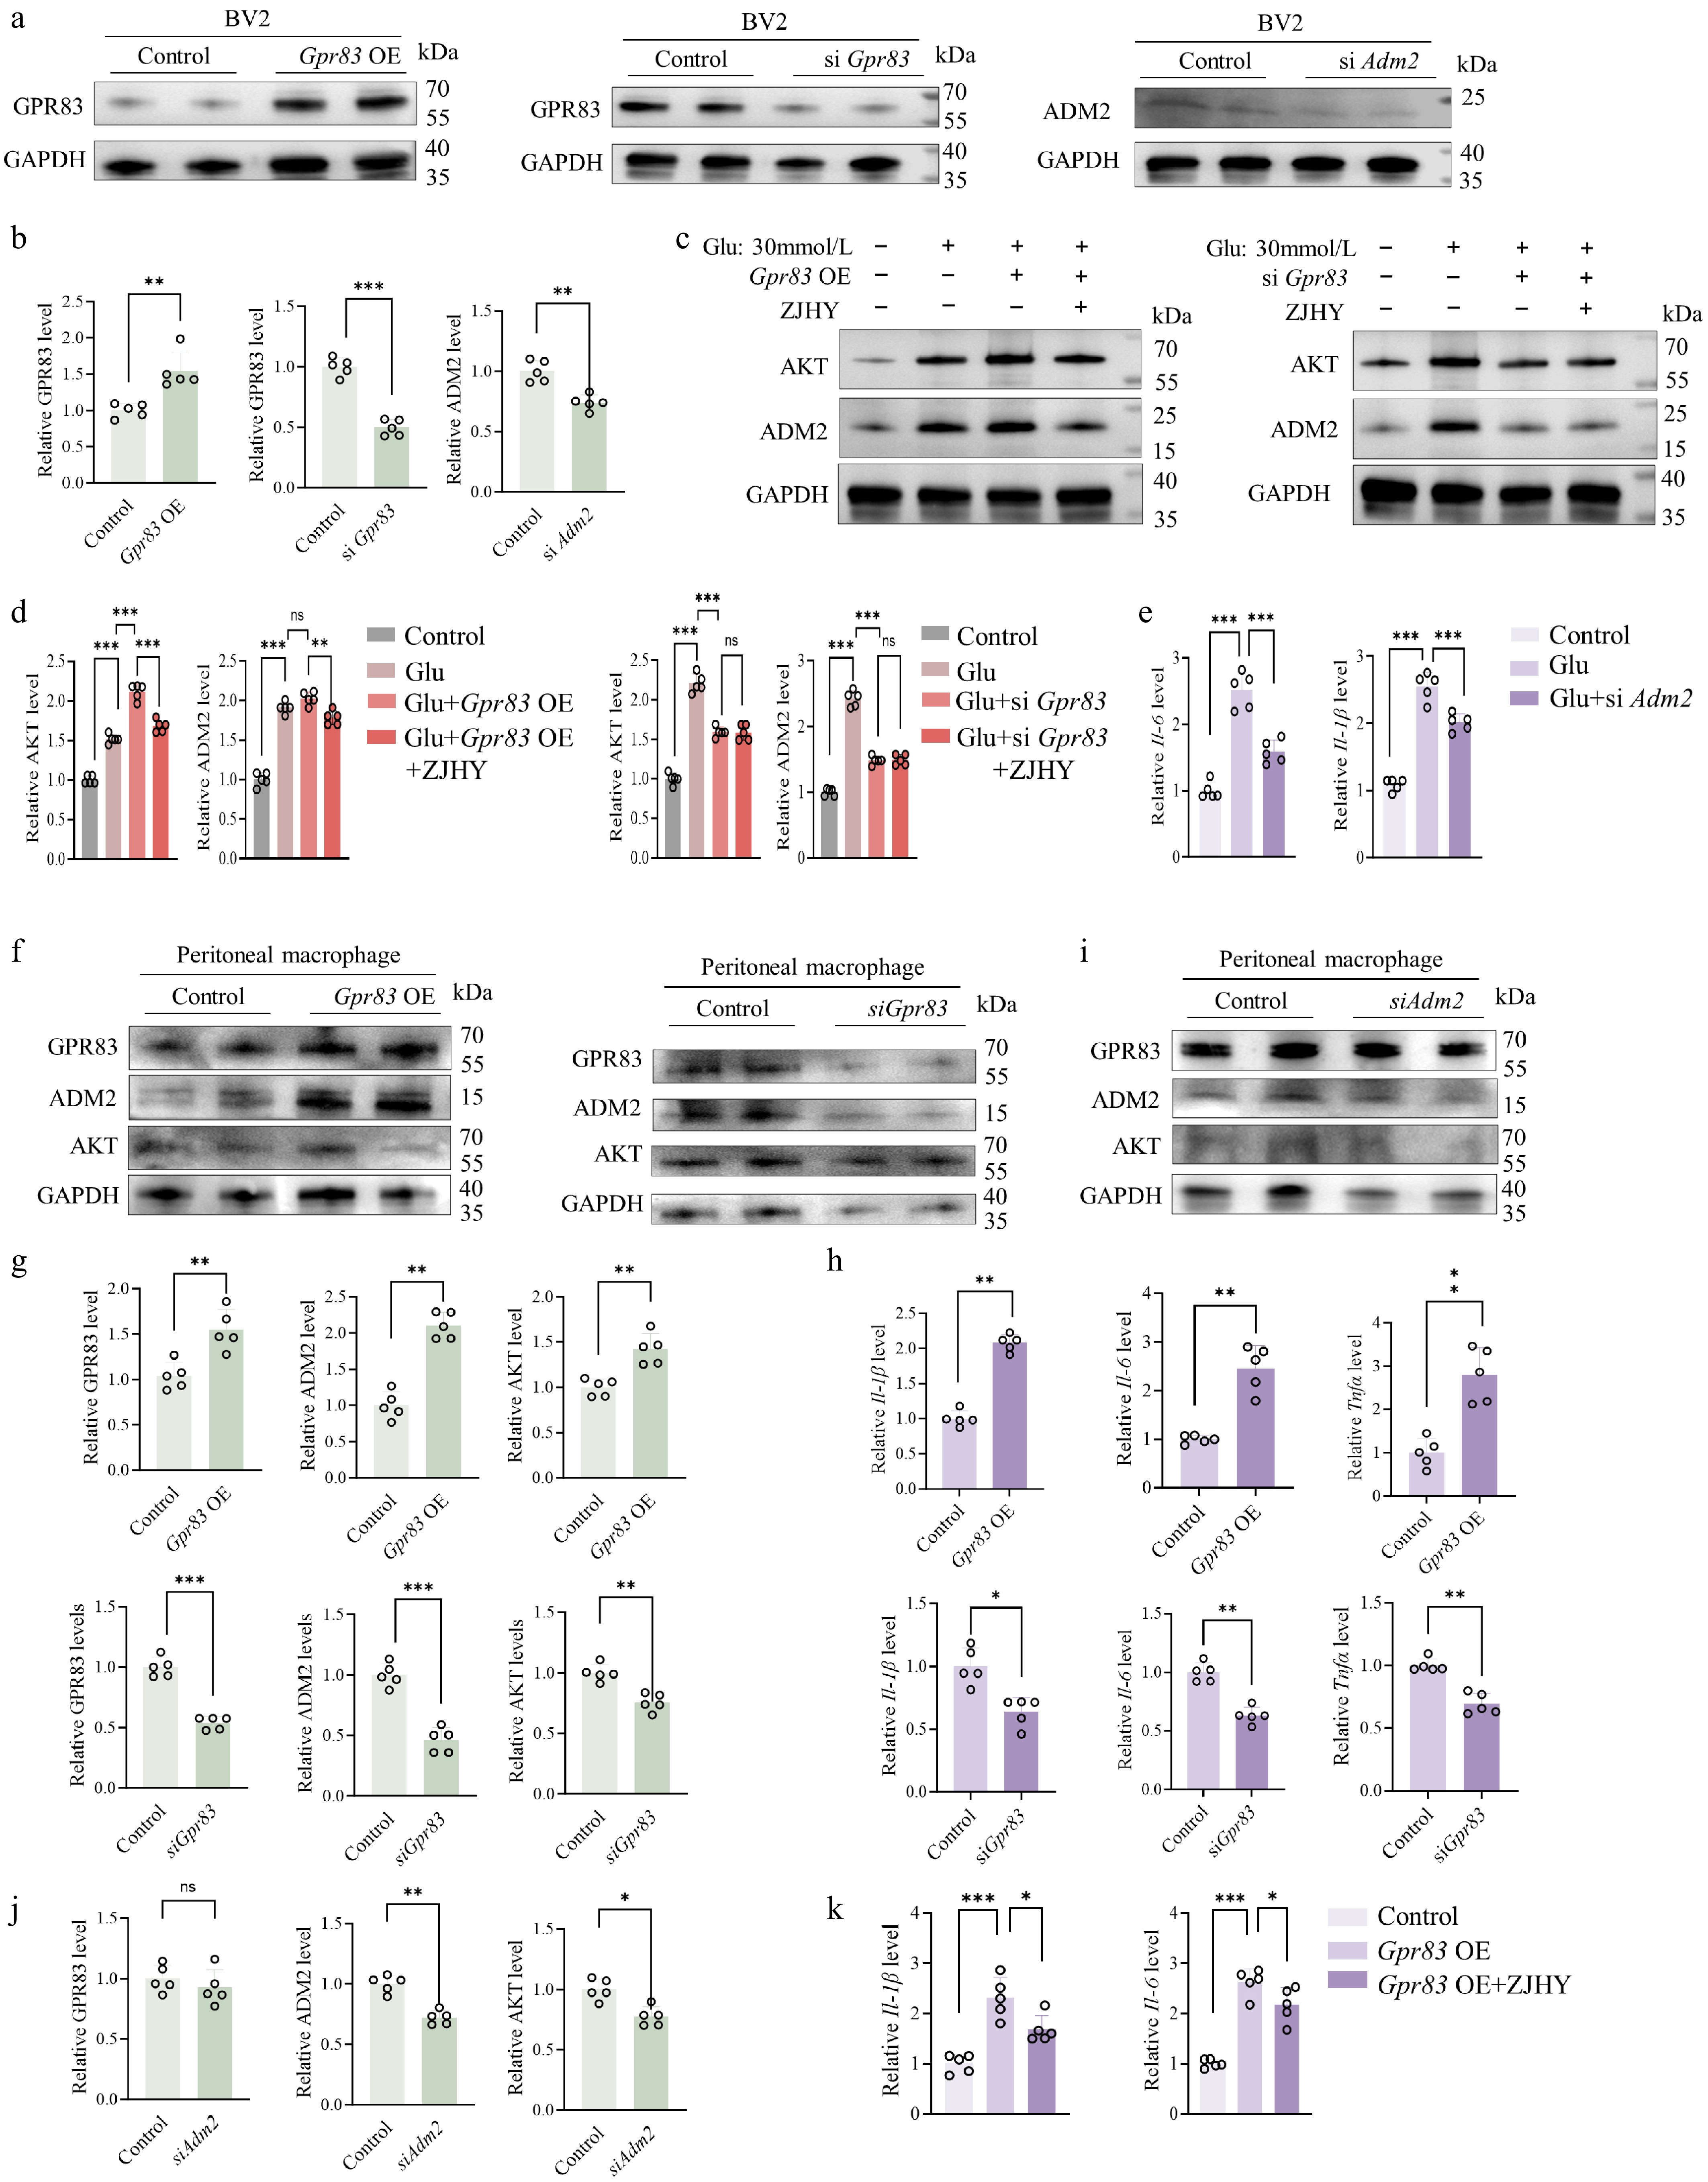
Figure 6.
ZJHY regulates the expression of the GPR83–ADM2–Akt axis in macrophages and inhibits the secretion of pro-inflammatory factors. (a), (b) Validation of Gpr83 overexpression and knockdown (siGpr83, siAdm2) efficiency in BV2 cells by Western blot (n = 5 per group). (c), (d) Western blot analysis of AKT and ADM2 protein levels in BV2 cells under ZJHY treatment, Gpr83 OE, or siGpr83 (n = 5 per group). (e) Relative mRNA expression of Il-6 and Il-1β in BV2 cells under Glu with siAdm2 transfection (n = 5 per group). (f), (g) Western blot analysis of GPR83, ADM2, and AKT protein levels in Peritoneal macrophage cells under Gpr83 OE, siGpr83, or siAdm2 (n = 5 per group). (h) Relative mRNA expression of Il-6, Il-1β, and Tnf-α in Peritoneal macrophage cells under Gpr83 OE, siGpr83 (n = 5 per group). (i), (j) Western blot analysis of GPR83, ADM2, and AKT protein levels in Peritoneal macrophage cells under siAdm2 (n = 5 per group). (k) Relative mRNA expression of Il-1β and Il-6 in Peritoneal macrophage cells under Gpr83 OE with ZJHY (n = 5 per group). Data are presented as mean ± SD. Statistical significance was determined by one-way ANOVA with Tukey's post-hoc test (* p < 0.05, ** p < 0.01, *** p < 0.001).
-
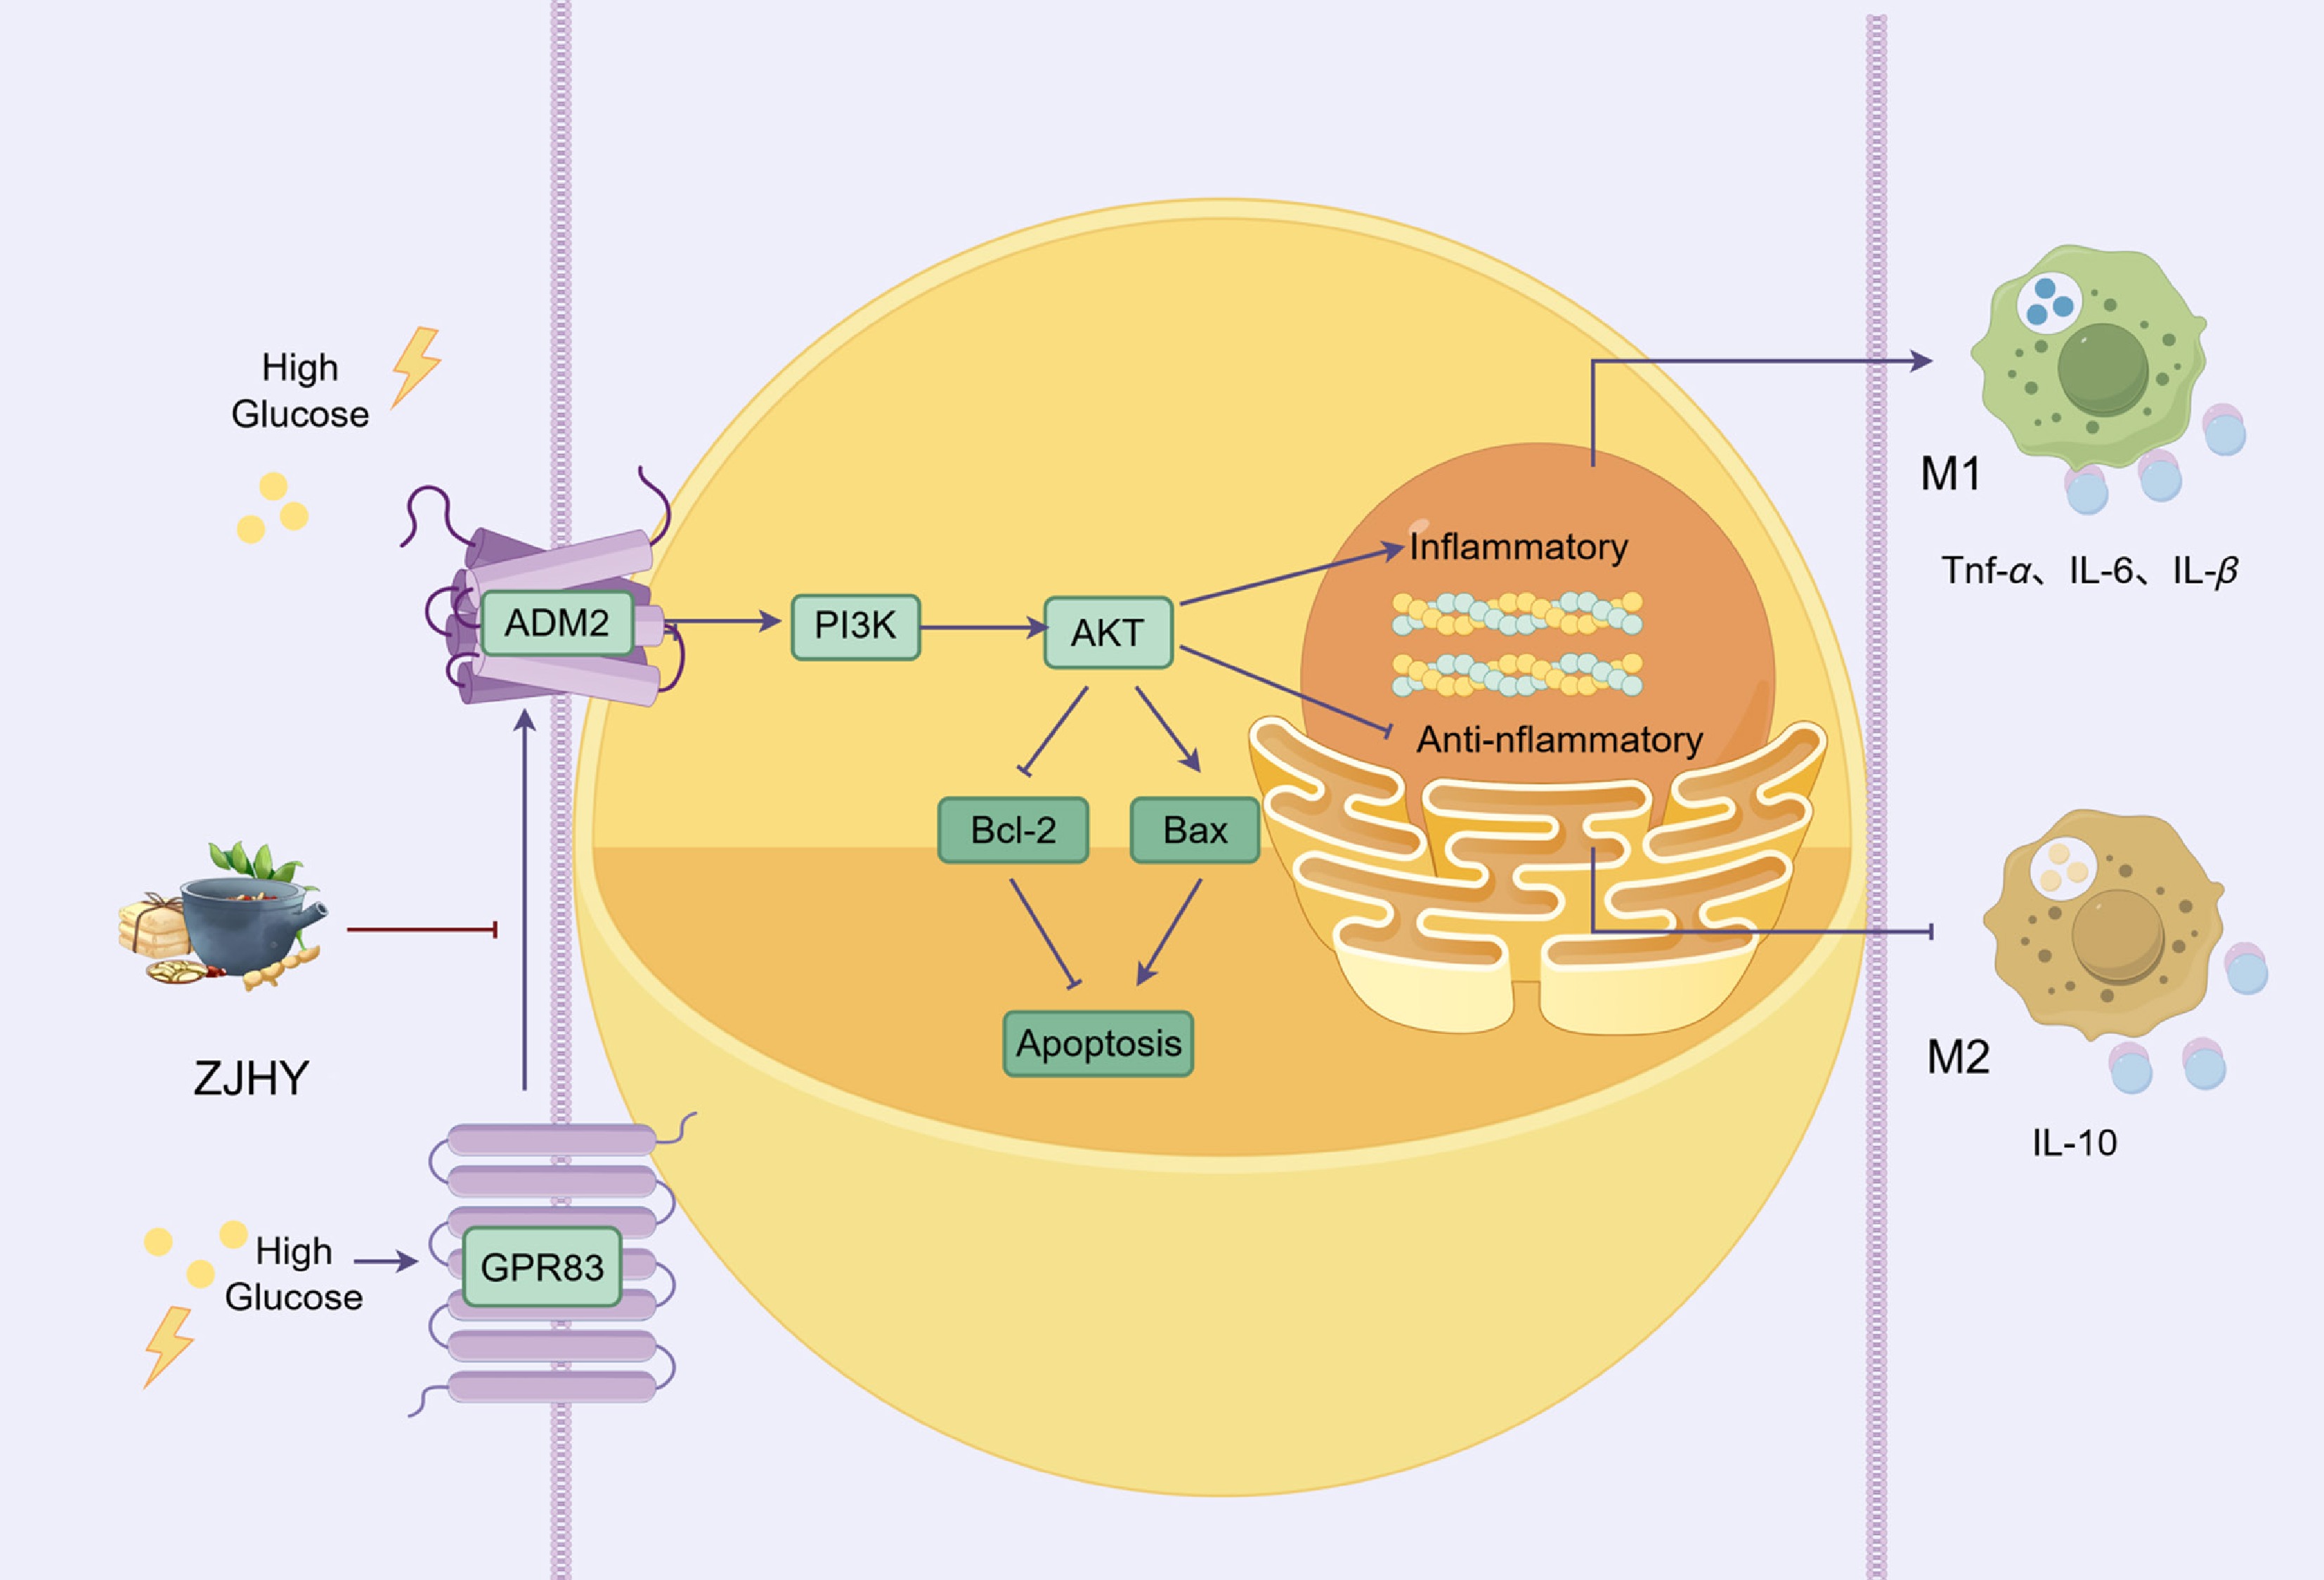
Figure 7.
ZJHY alleviates diabetic microvascular injury via ADM2–PI3K–AKT-mediated macrophage polarization and apoptosis suppression. The ZJHY formula mitigates high glucose-induced kidney and retinal damage by targeting the ADM2–PI3K–AKT signaling axis, which regulates macrophage polarization balance by shifting towards the anti-inflammatory M2 phenotype and suppressing pro-inflammatory M1-related cytokines like TNF-α, IL-6, and IL-1β, and modulating the Bcl-2/Bax ratio to inhibit excessive cellular apoptosis, ultimately alleviating tissue injury in diabetic microvascular complications.
-
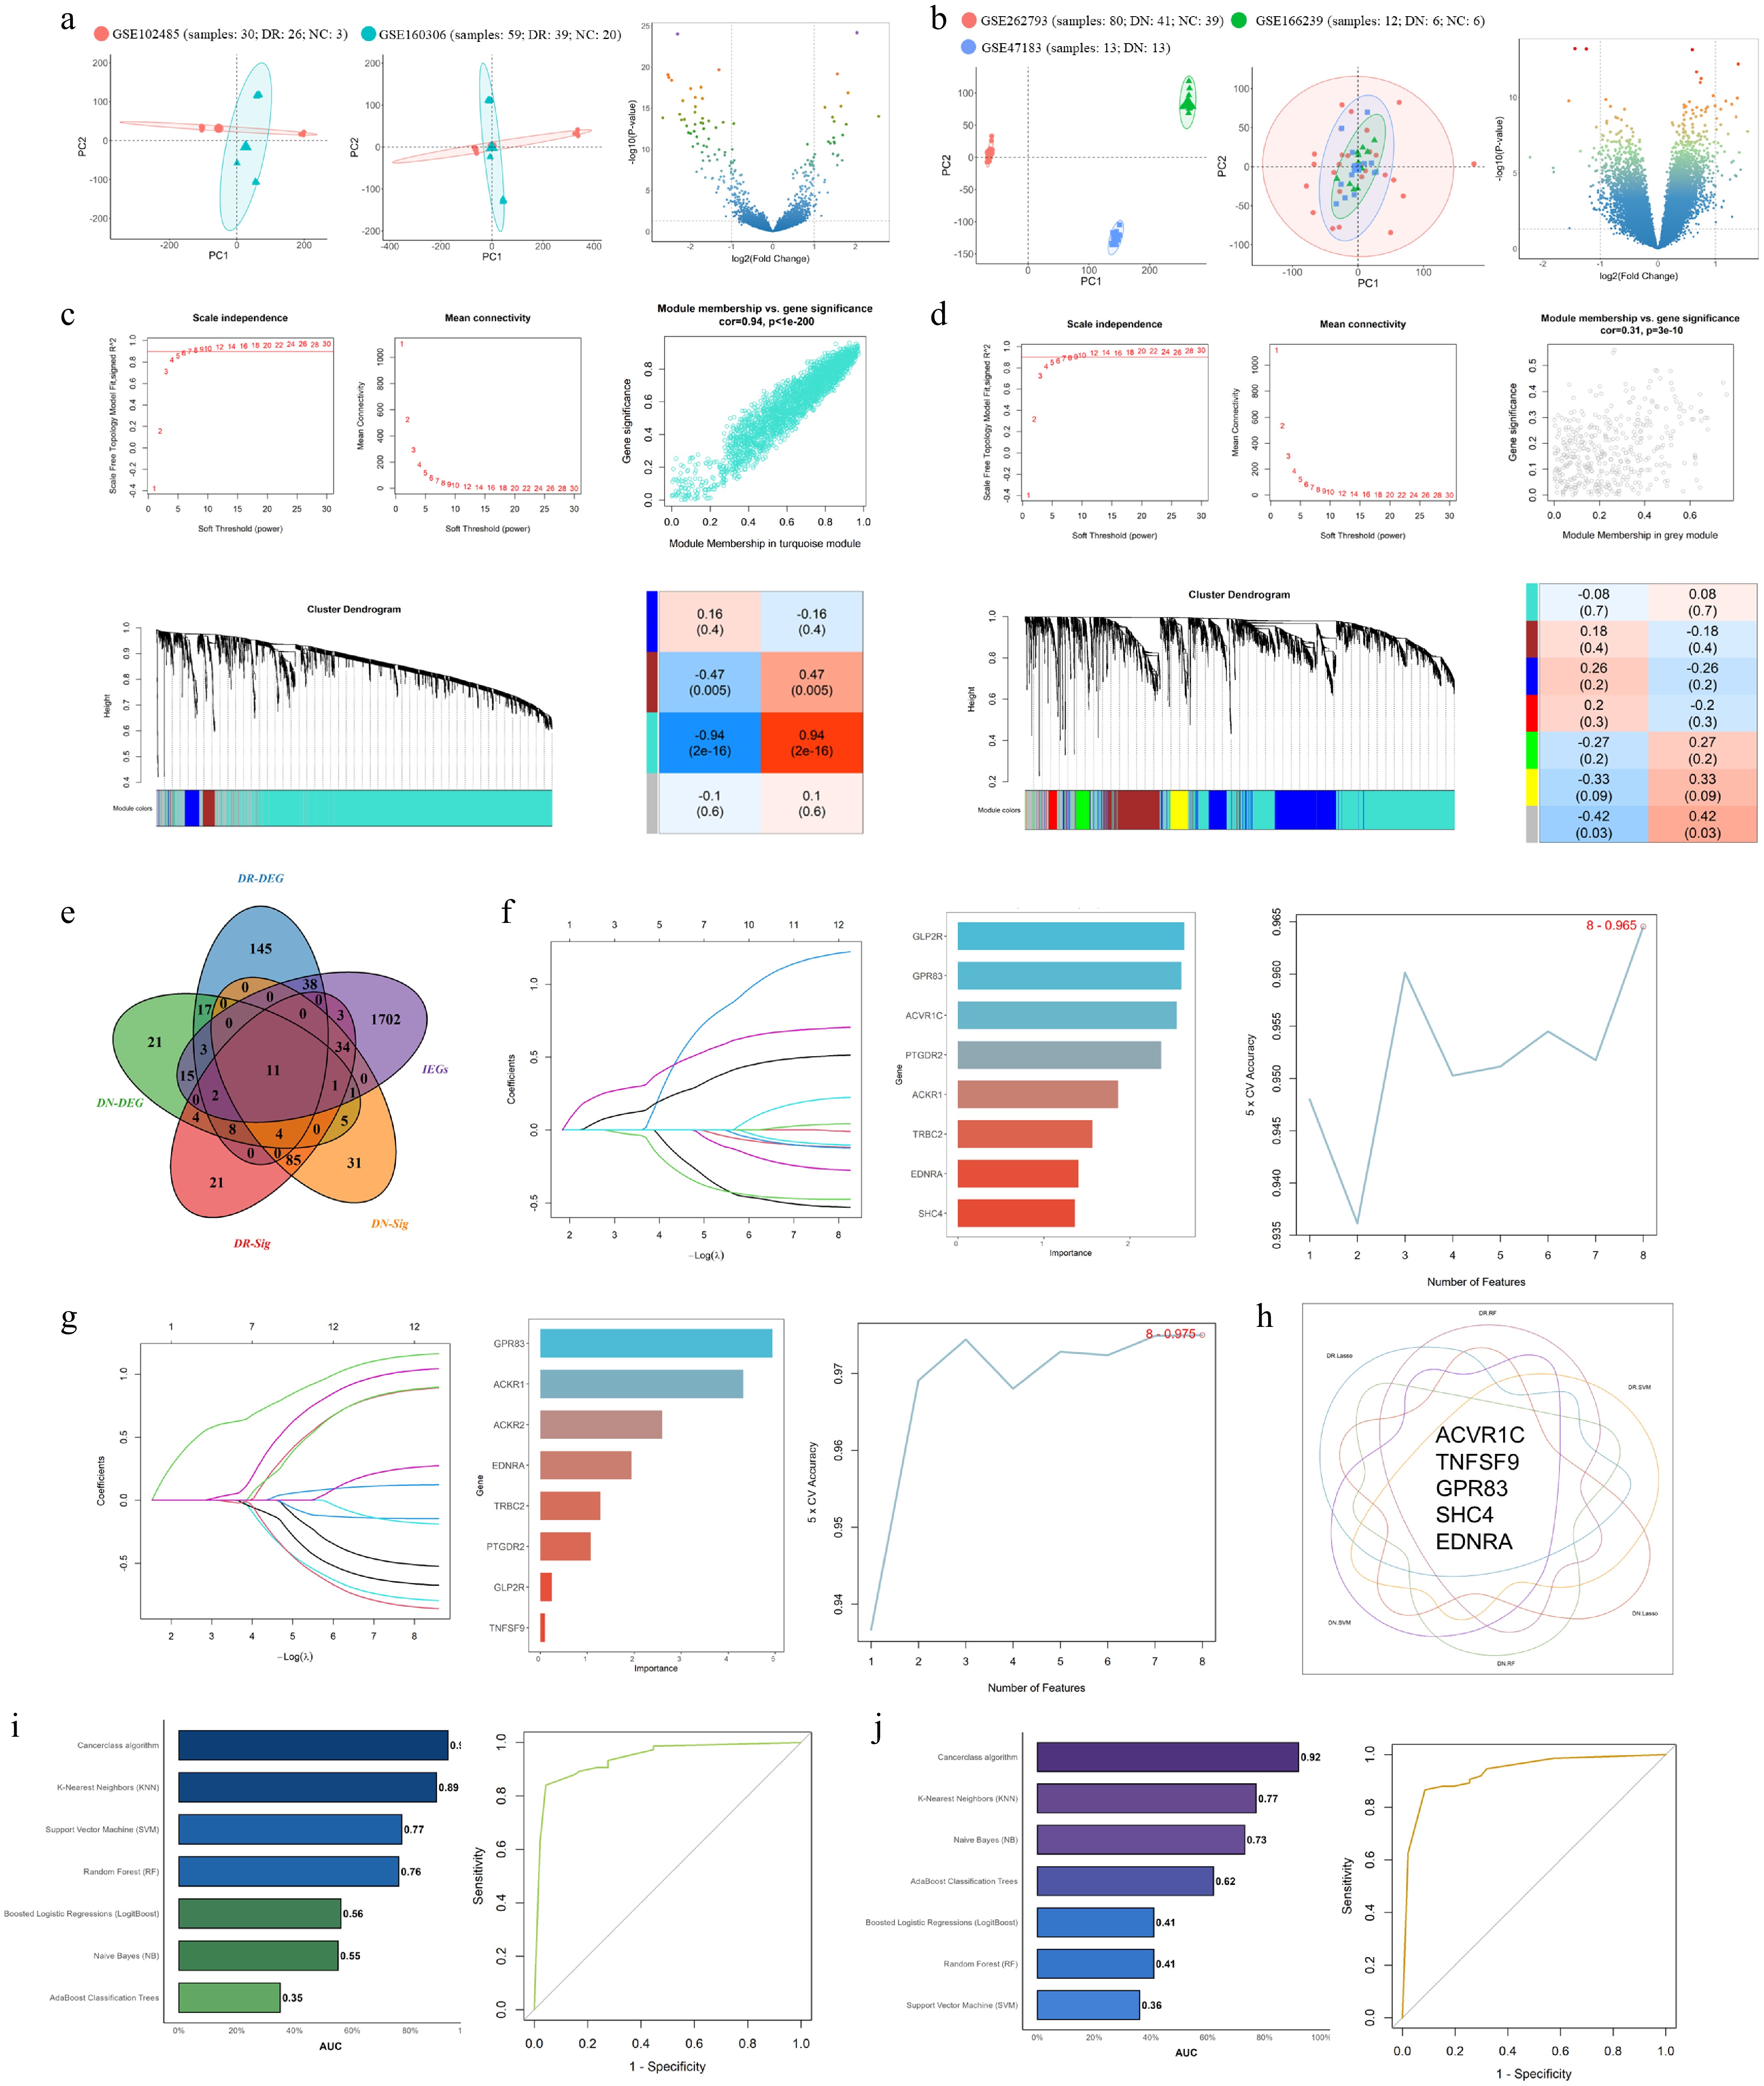
Figure 8.
A five-gene immune signature predicts diabetic retinopathy (DR) and diabetic nephropathy (DN) with high accuracy. (a), (b) Principal component analysis (PCA) plots demonstrating the integration of multiple transcriptomic datasets from patients with (a) diabetic retinopathy (DR), and (b) diabetic nephropathy (DN) after batch effect correction, and a Volcano plot displaying the differentially expressed genes. (c), (d) Weighted Gene Co-expression Network Analysis (WGCNA) showing module-trait relationships for DR and DN (|r| > 0.3). (e) Venn diagram illustrating the intersection of DR-DEGs, DN-DEGs, DR-Sig (hub genes from WGCNA), DN-Sig (hub genes from WGCNA), and immune-related genes (IRGs from ImmPort database) to identify 11 candidate genes. (f)–(h) Feature selection results from seven ML algorithms, including Naive Bayes (NB), Random Forest (RF), Support Vector Machine (SVM), AdaBoost Classification Trees (AdaBoost), Boosted Logistic Regression (Logit Boost), K-Nearest Neighbors (KNN), and the Cancerclass algorithm. (i), (j) Receiver Operating Characteristic (ROC) curves of seven machine learning models for DR (left, training: GSE160306; validation: GSE102485) and DN (right, training: GSE262793; validation: GSE47183). The Cancer class algorithm achieved the highest AUC (0.93 for DR, 0.92 for DN).
Figures
(8)
Tables
(0)