-
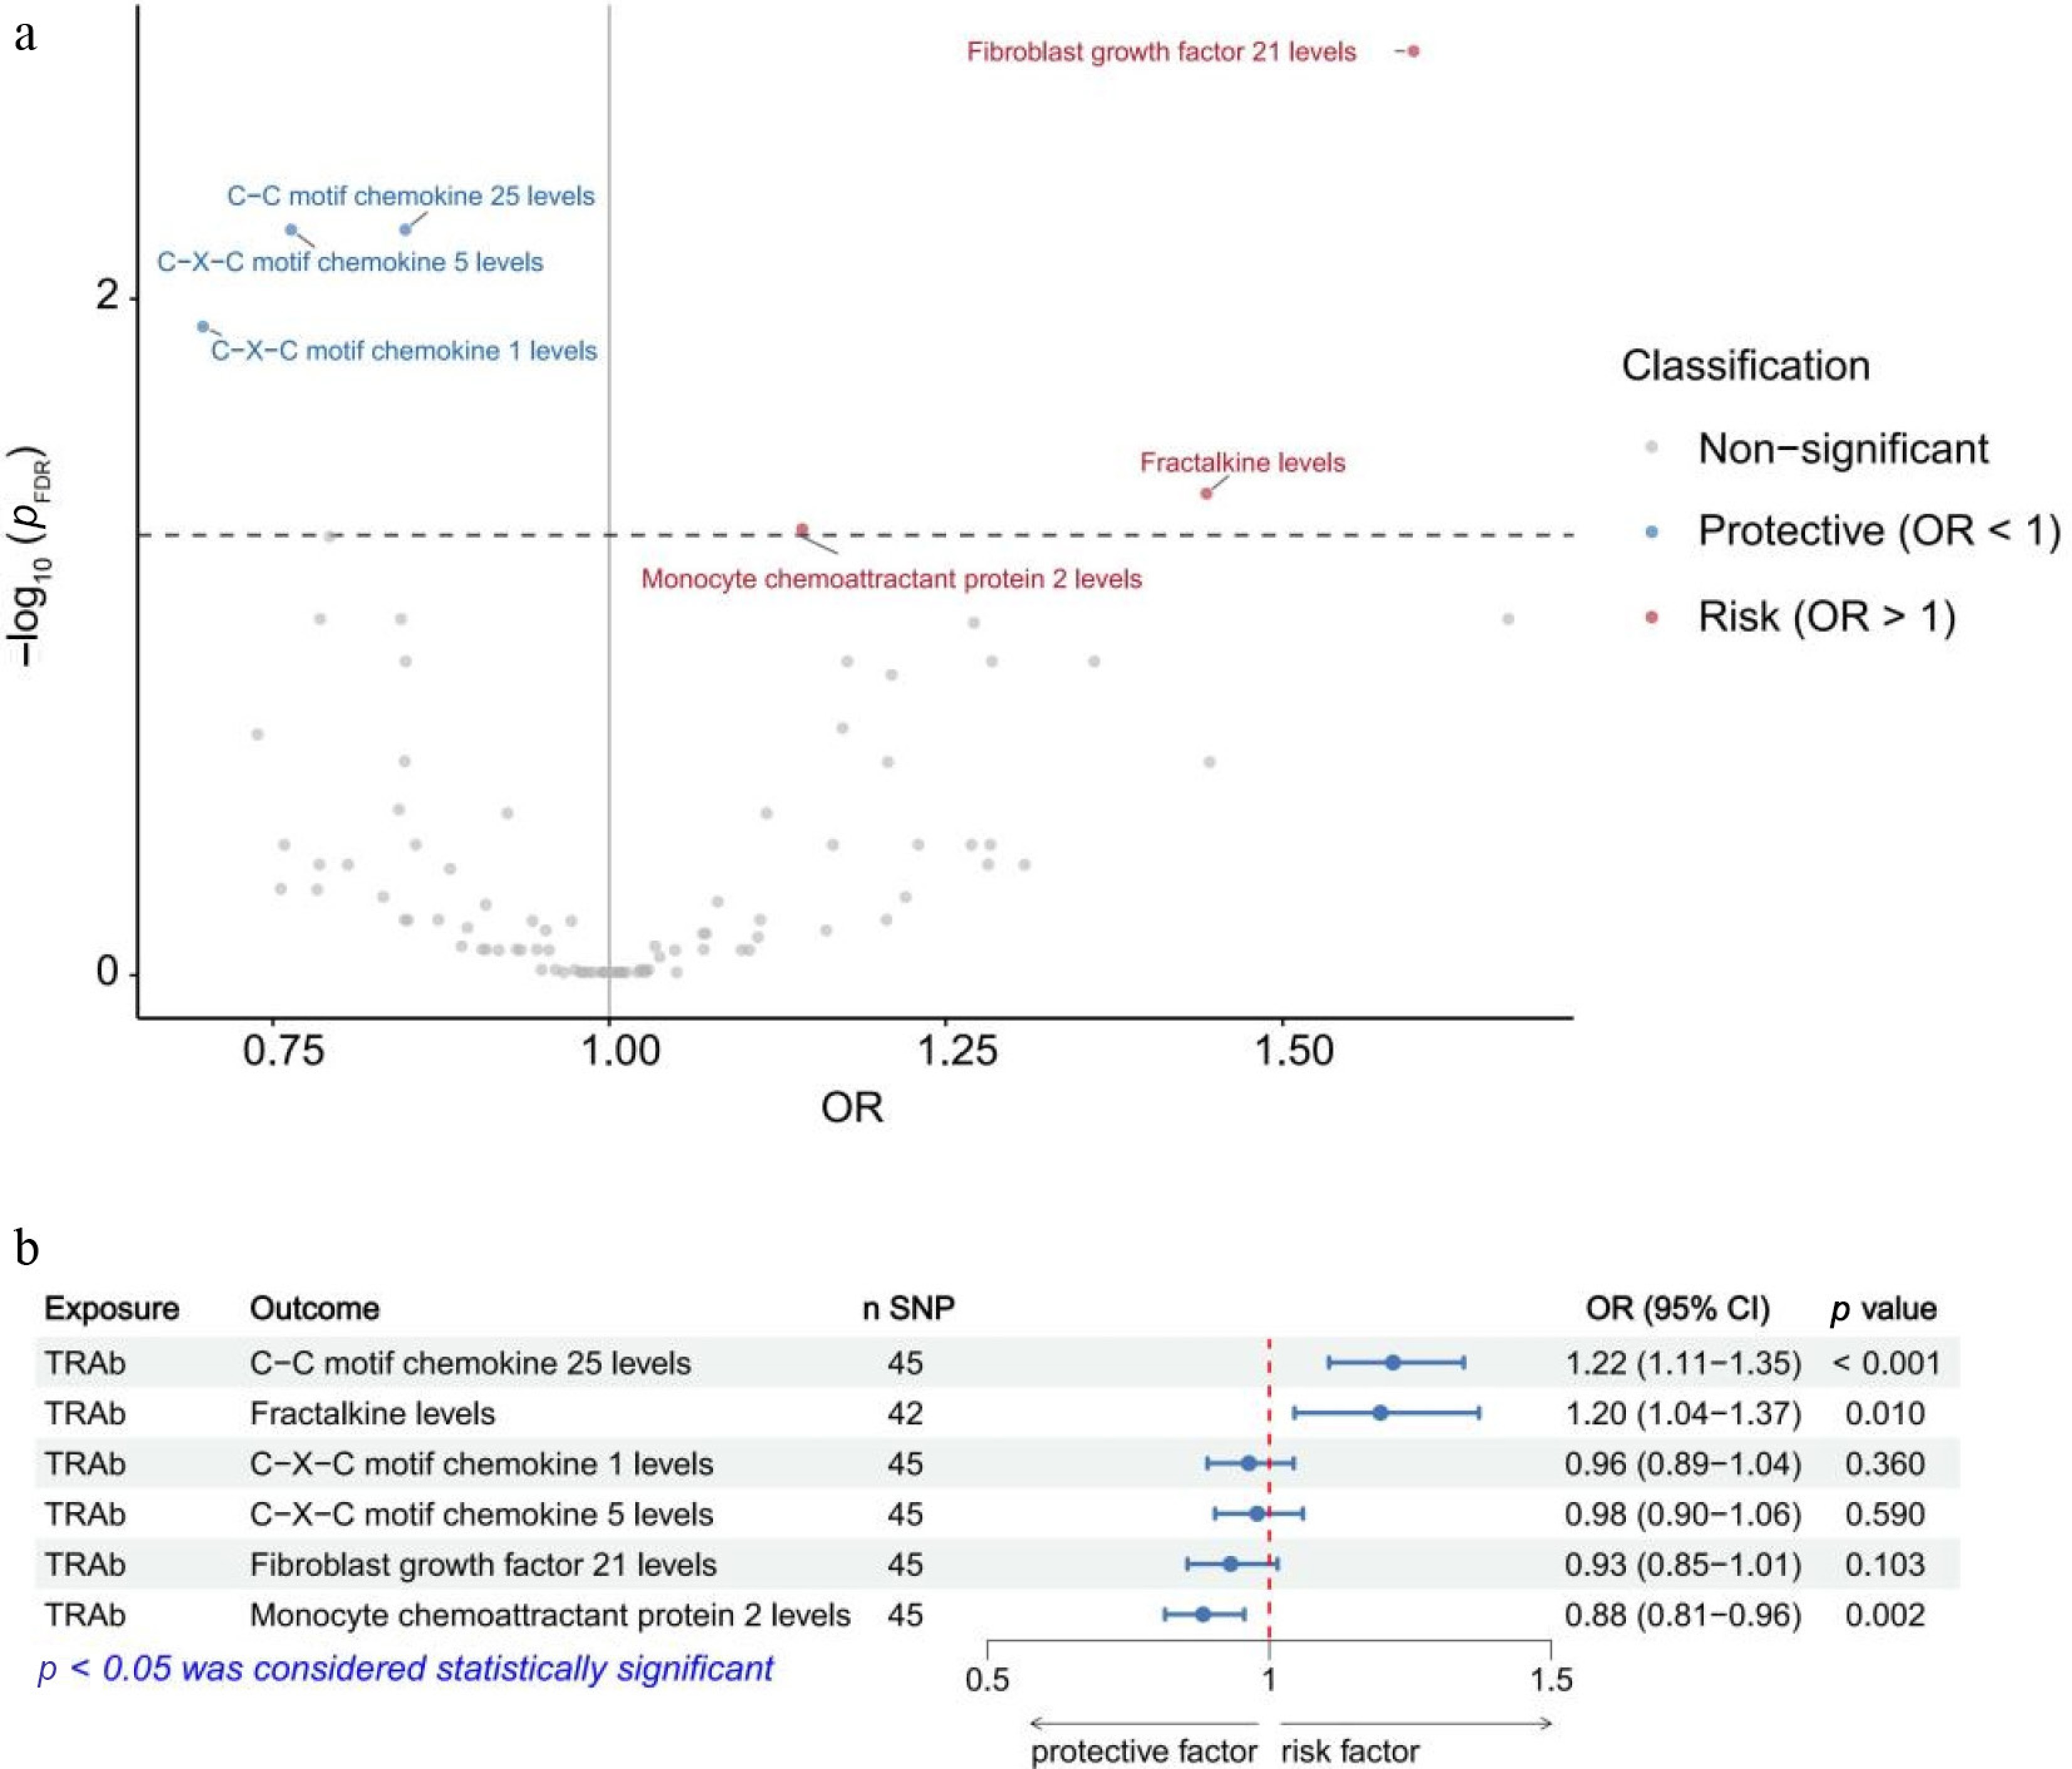
Figure 1.
Mendelian randomization analyses of inflammatory proteins on Graves' ophthalmopathy (a) and of thyrotropin receptor antibodies on inflammatory proteins (b) identified in the VA Million Veteran Program. FDR, false discovery rate; OR, odds ratio; CI, confidence interval; TRAb, thyrotropin receptor antibody; SNP, single-nucleotide polymorphism.
-
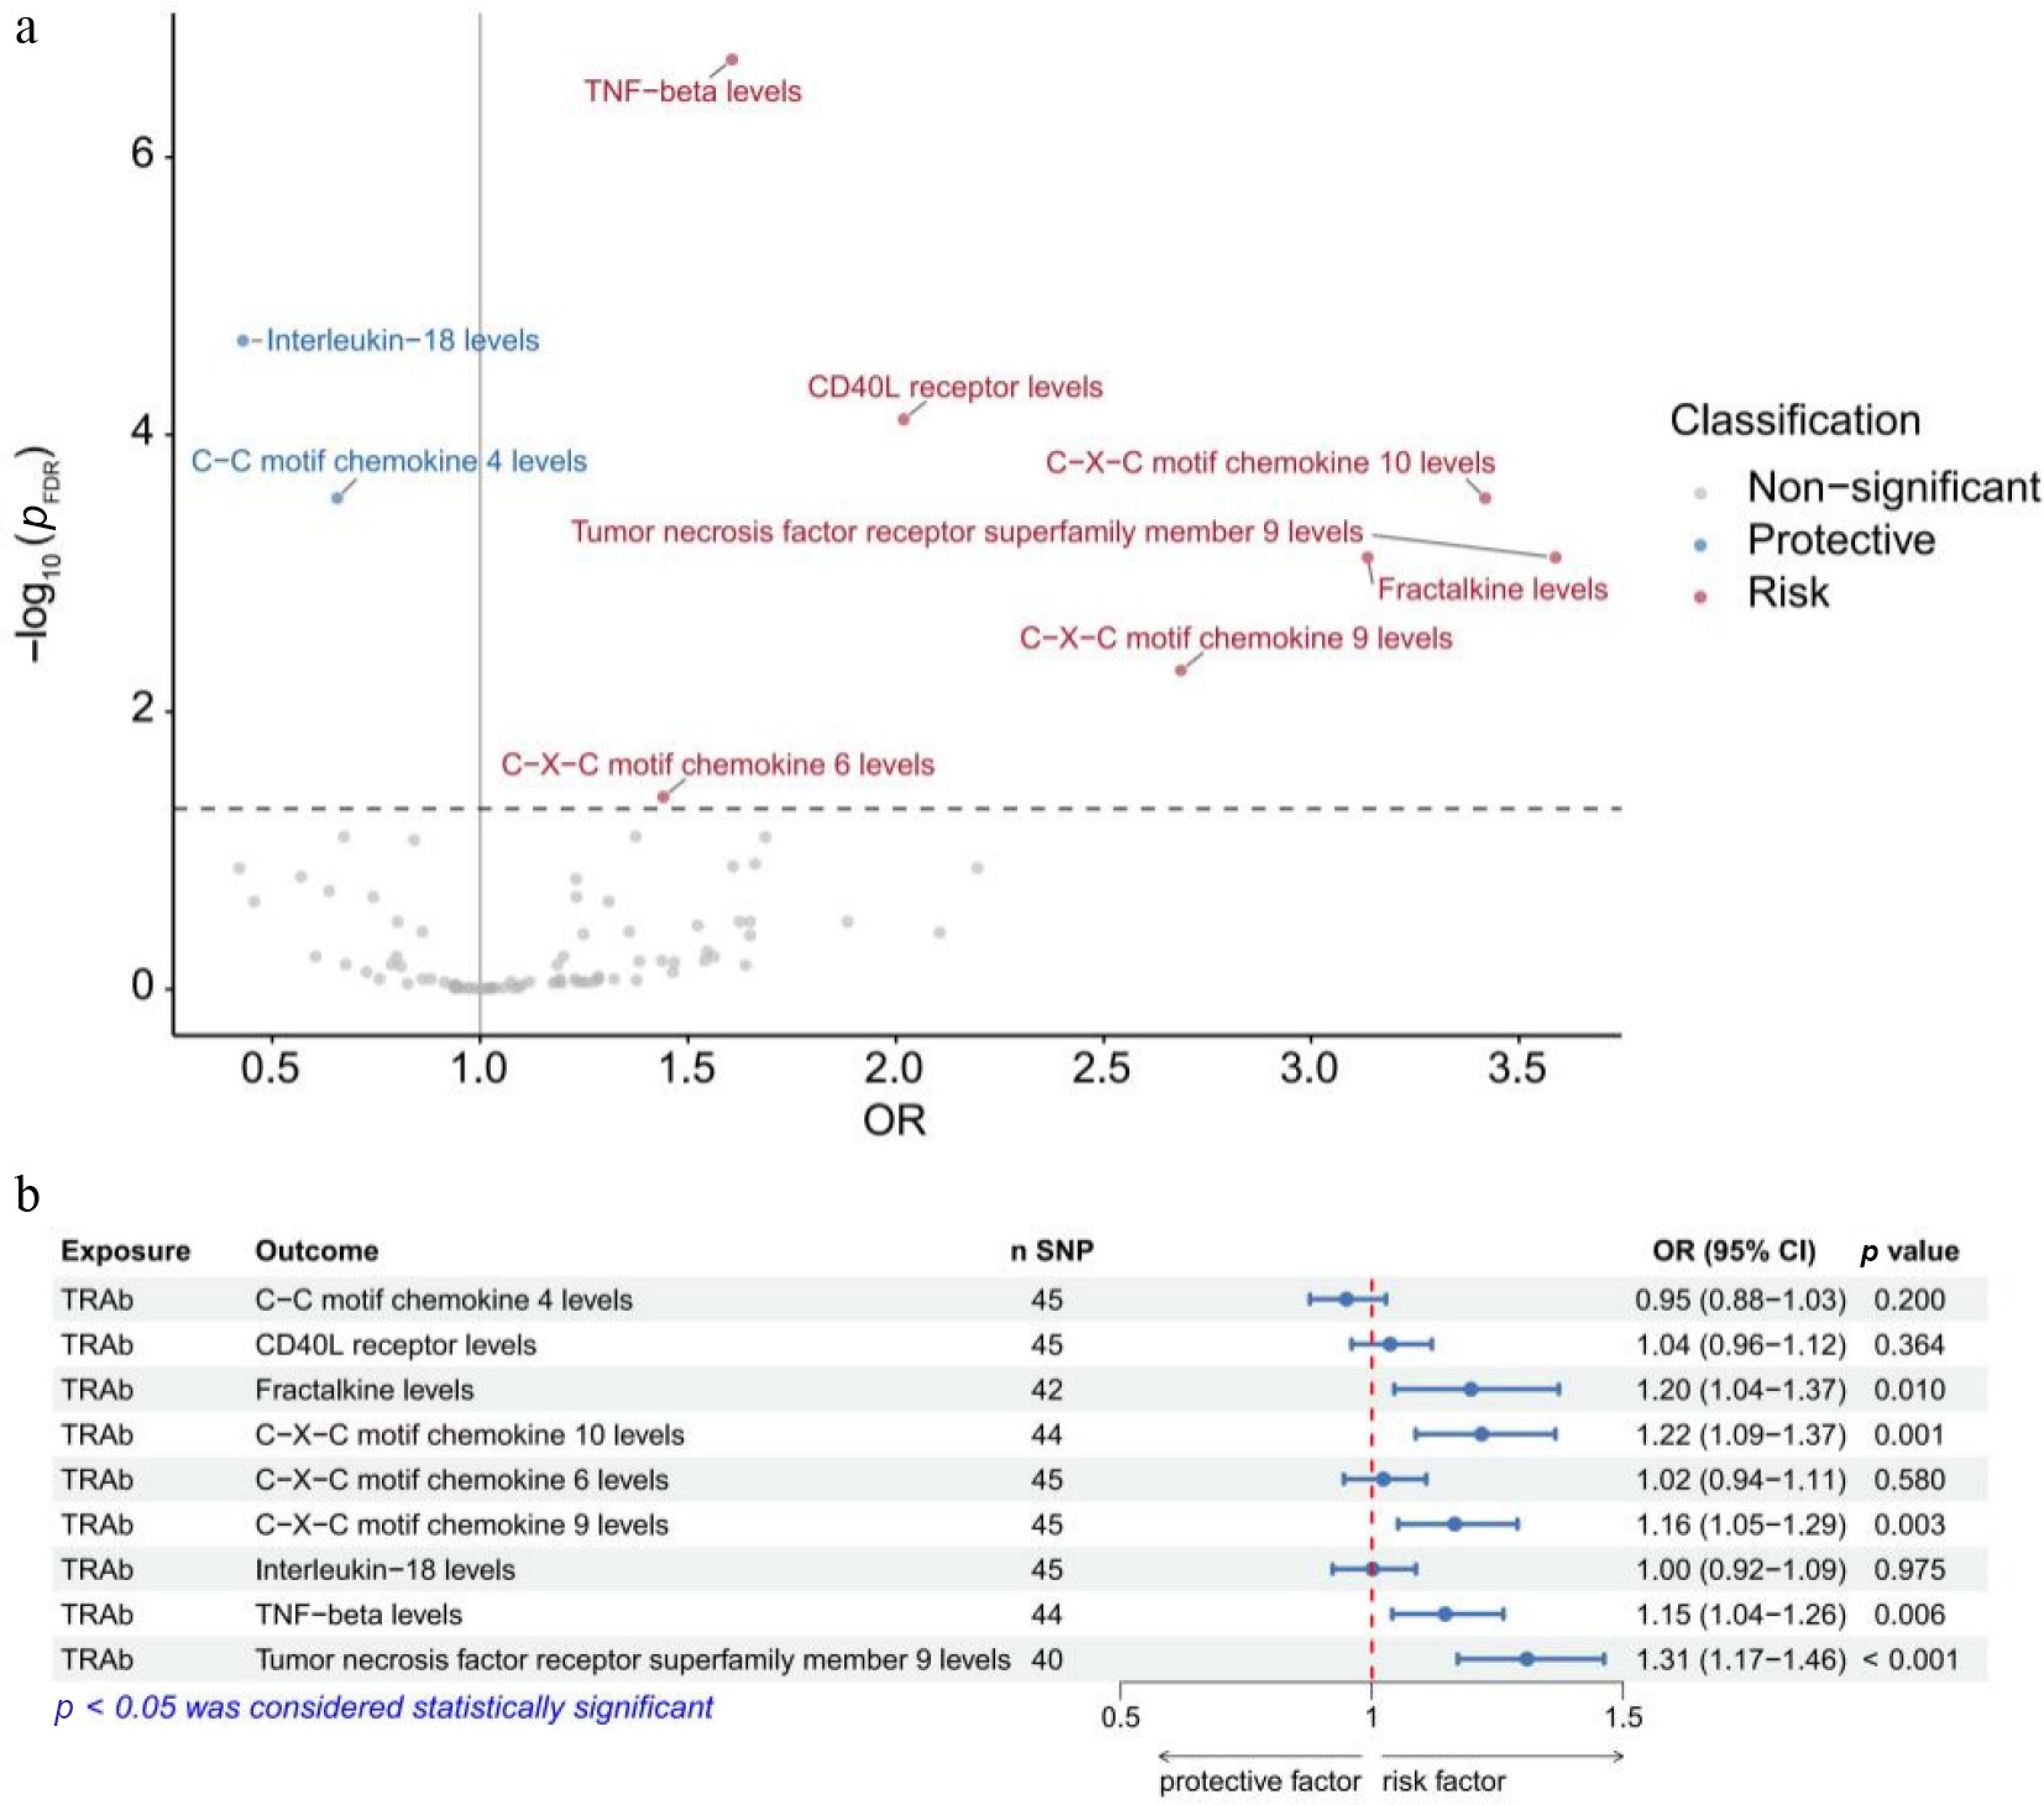
Figure 2.
Mendelian randomization analyses of inflammatory proteins on Graves' ophthalmopathy (a) and of thyrotropin receptor antibodies on inflammatory proteins (b) identified in the UK Biobank. FDR, false discovery rate; OR, odds ratio; CI, confidence interval; TRAb, thyrotropin receptor antibody; SNP, single-nucleotide polymorphism.
-
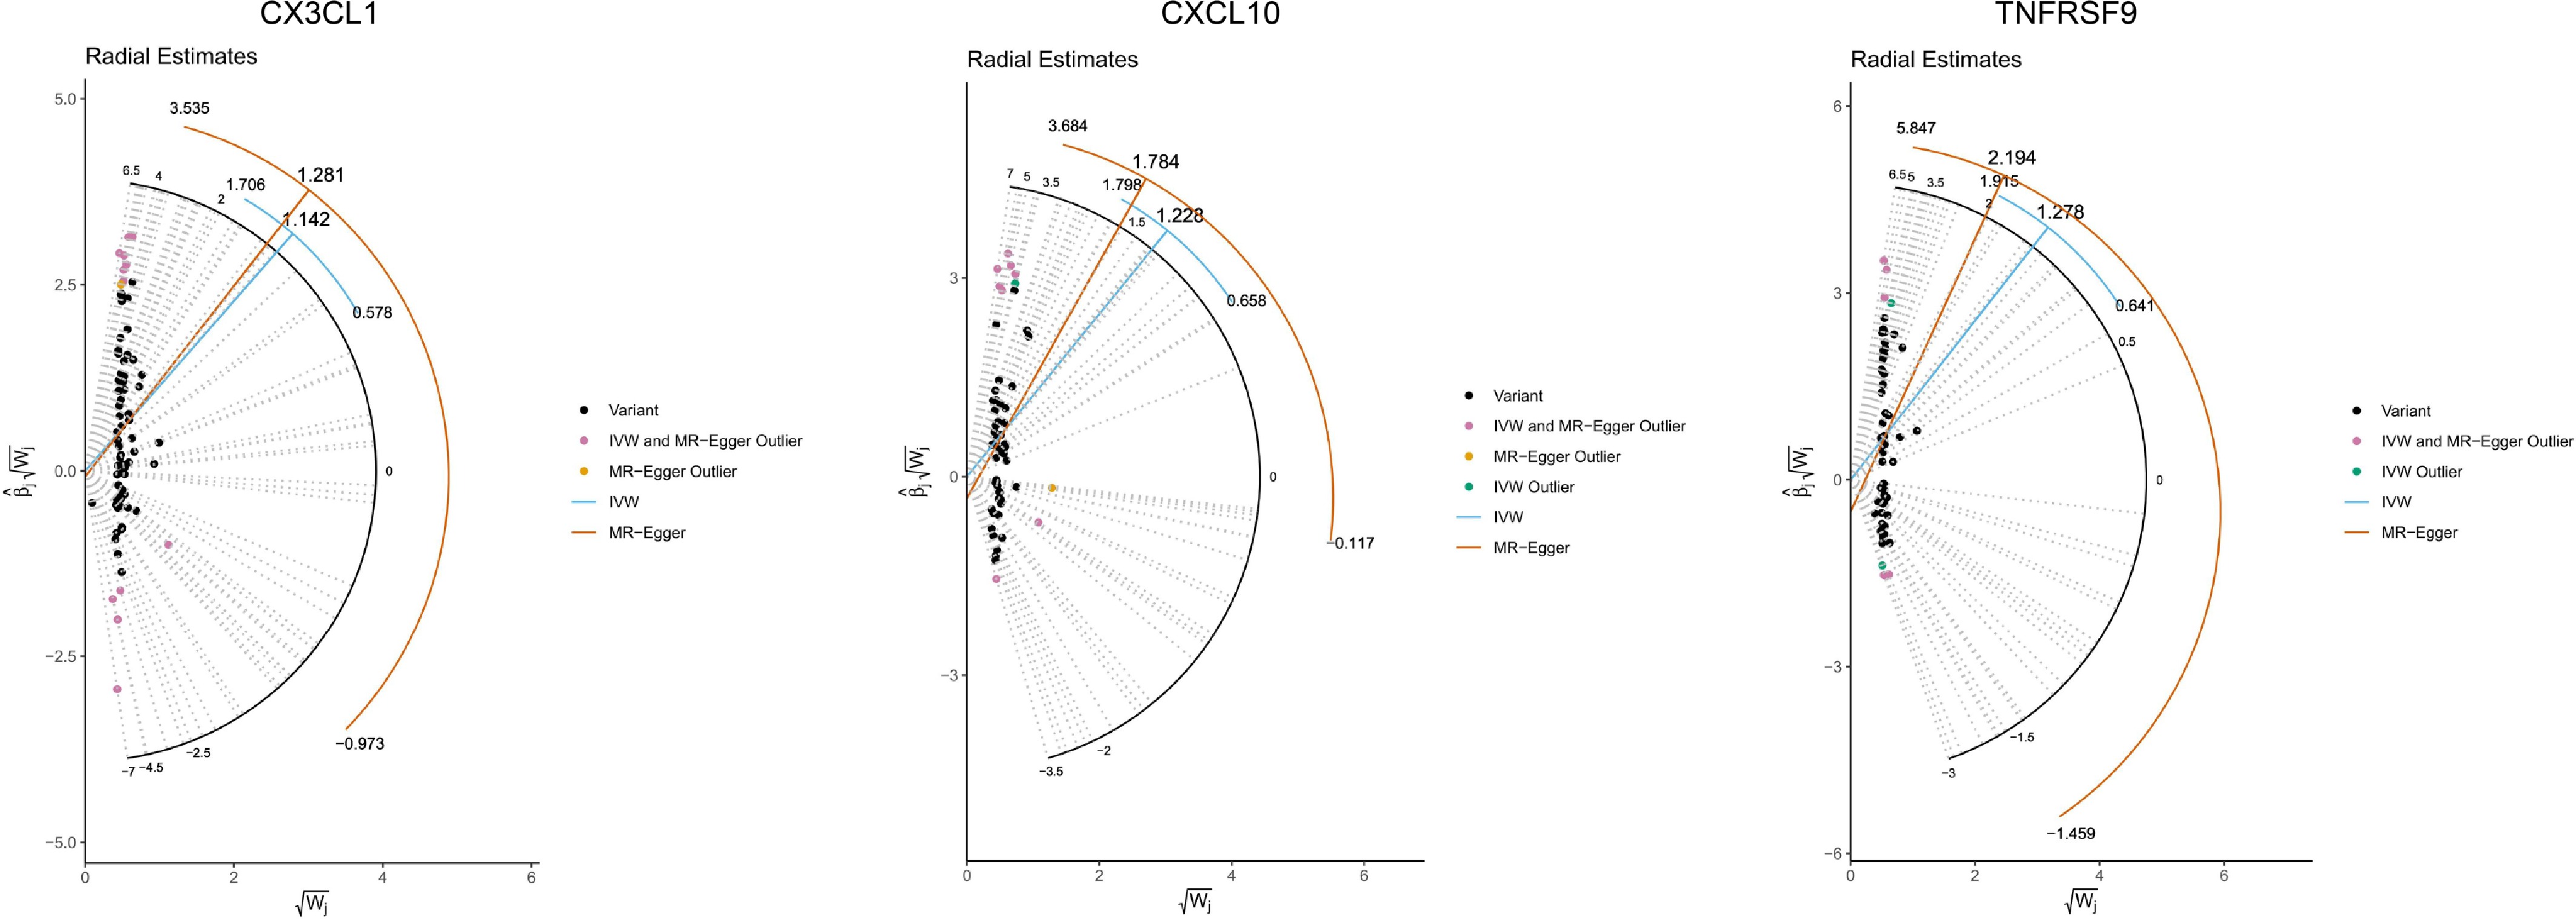
Figure 3.
Radial plots and corresponding radial regression analyses for CX3CL1, CXCL10, and TNFRSF9.
-
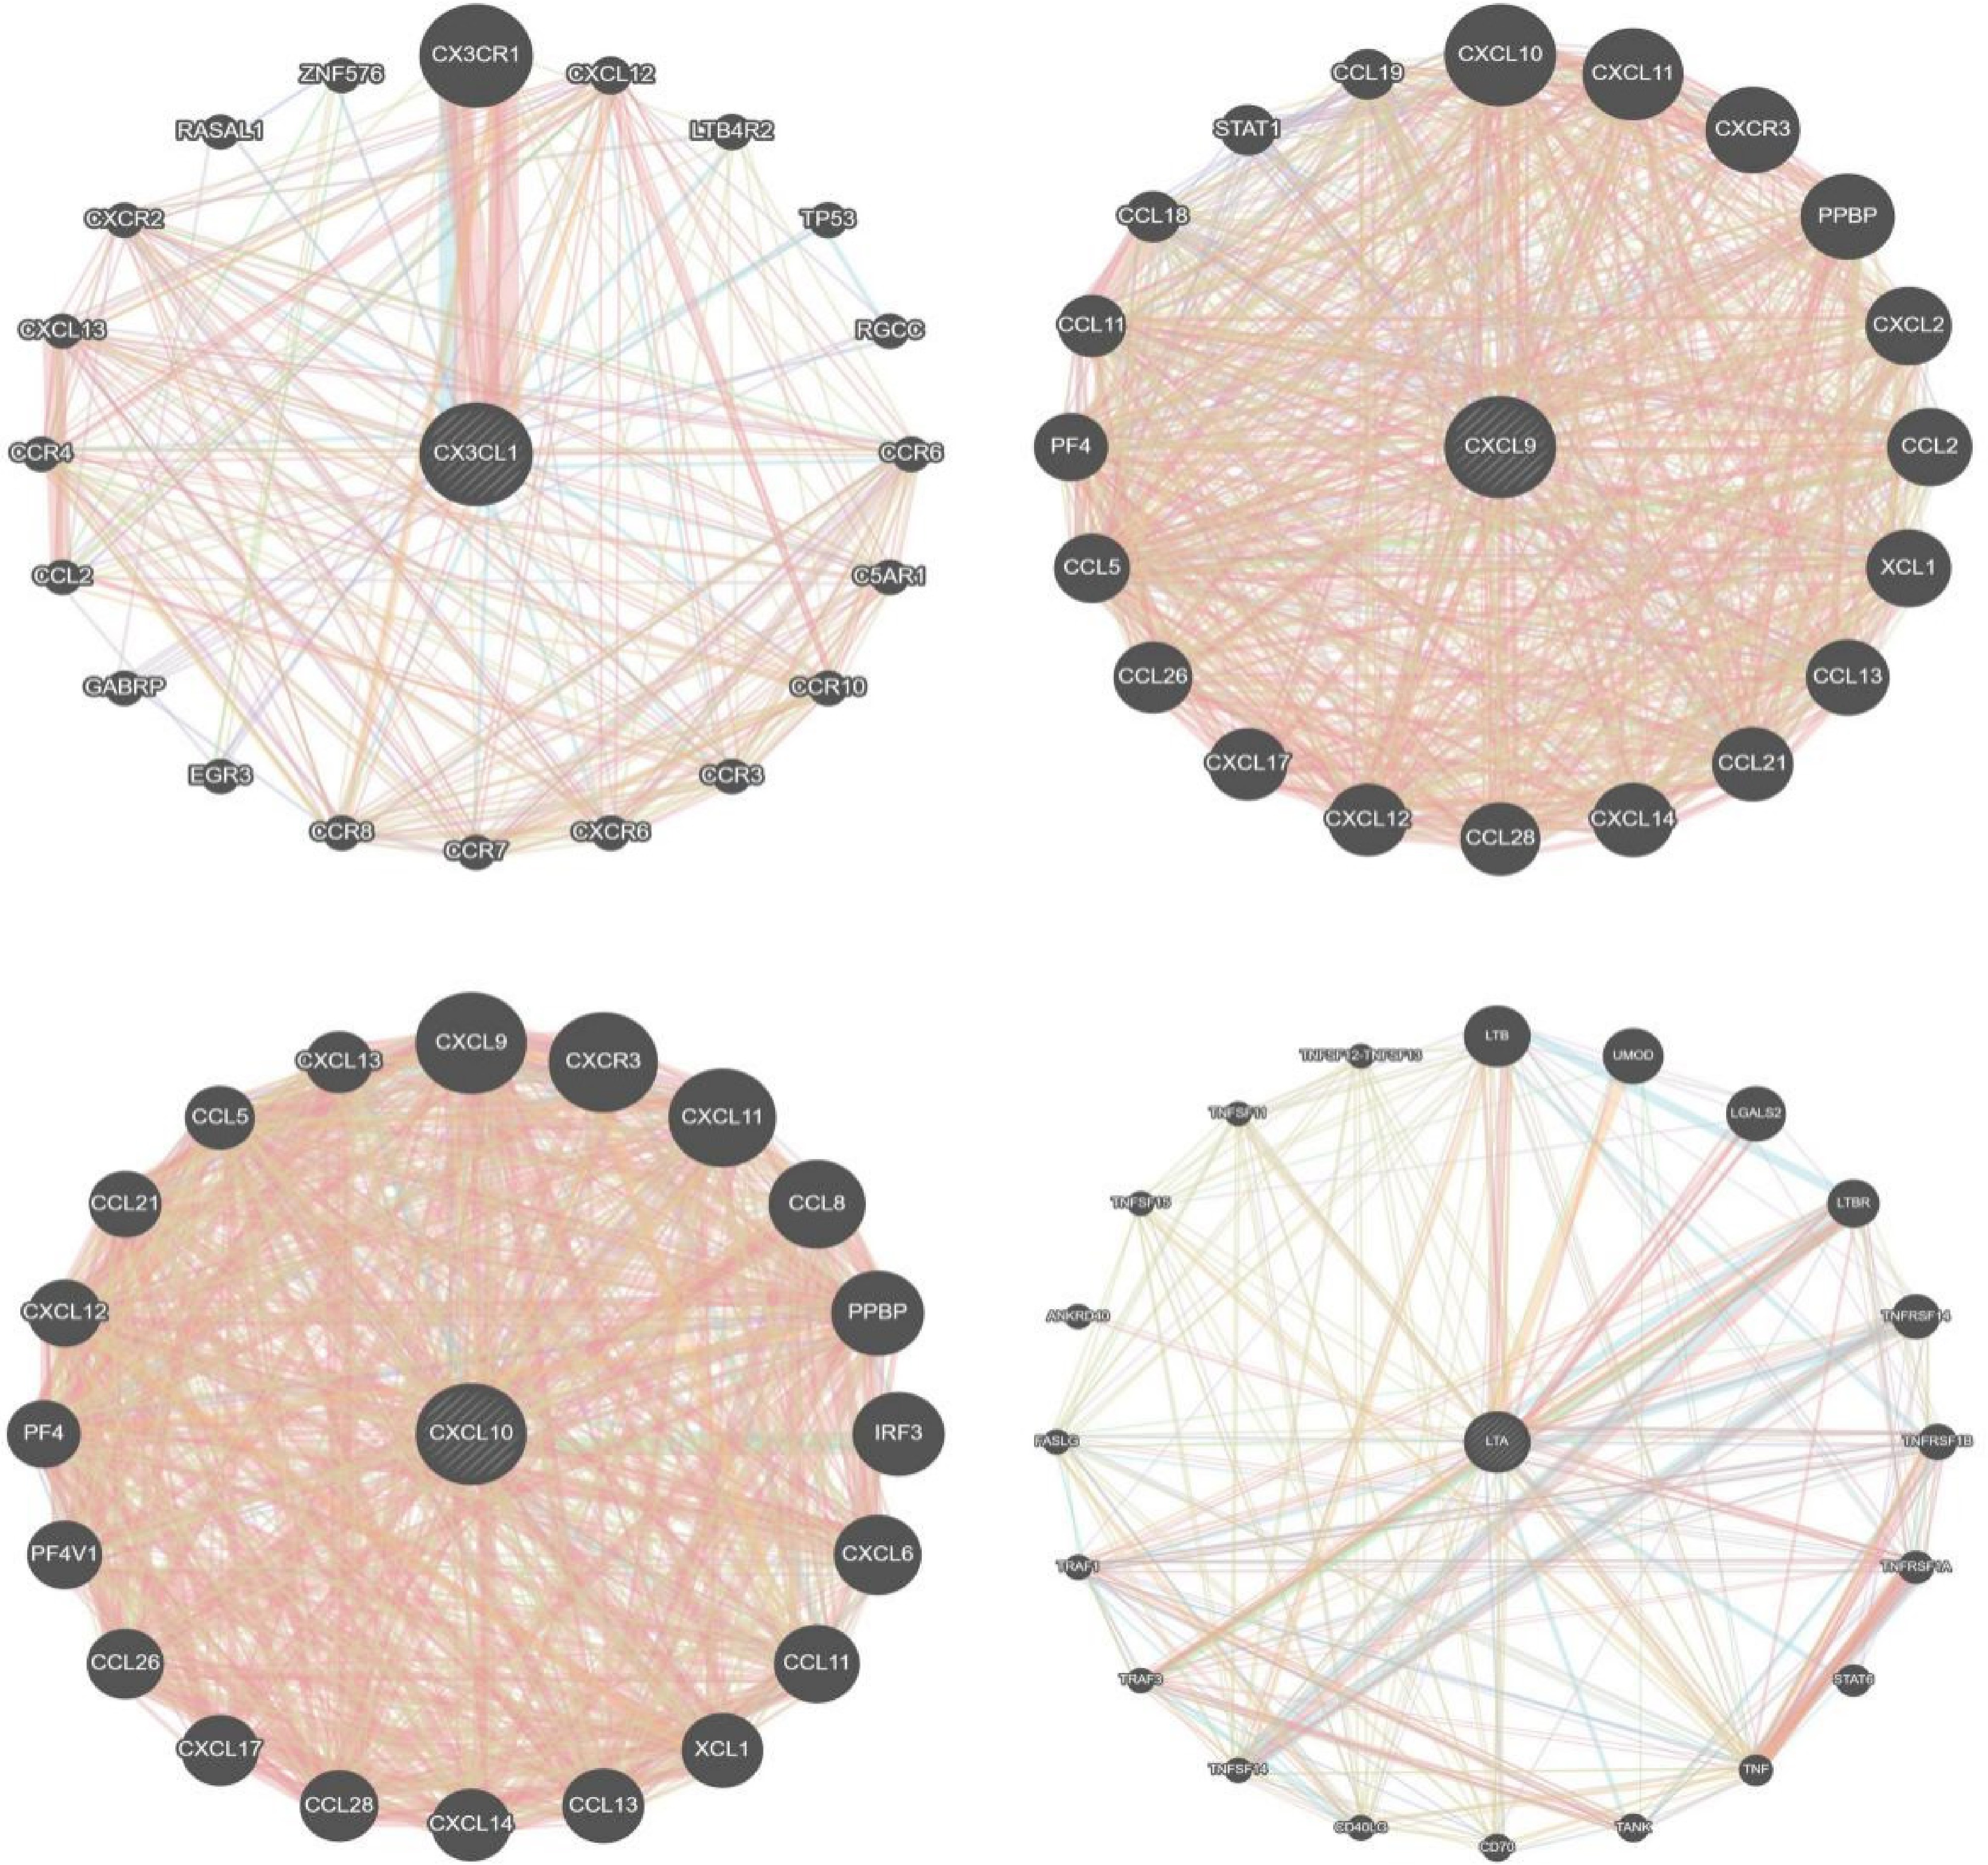
Figure 4.
Interaction network analysis of the identified inflammatory proteins.
-
Exposure Outcome study Method Number of SNPs OR (95% CI) p-Value Thyrotropin receptor antibody VA Million Veteran Program Inverse variance weighted 43 2.42 (1.26–4.66) 0.008 Thyrotropin receptor antibody UK Biobank Inverse variance weighted 33 7.96 (1.85–34.28) 0.005 SNP, single-nucleotide polymorphism; OR, odds ratio; CI, confidence interval. Table 1.
Association between genetically predicted thyrotropin receptor antibody and the risk of Graves' ophthalmopathy.
-
Dataset Mediator β overall β1 β2 Mediation proportion p-Value Exposure-outcome pleiotropy test Exposure-mediator pleiotropy test Mediator-outcome pleiotropy test VA Million Veteran Program CX3CL1 0.88 (0.23–1.54) 0.18 (0.04–0.32) 0.37 (0.13–0.60) 0.07 (0–0.15) 0.048 0.212 0.430 0.102 UK Biobank CX3CL1 2.07 (0.61–3.53) 0.18 (0.04–0.32) 1.14 (0.59–1.70) 0.10 (0.01–0.19) 0.029 0.230 0.430 0.012 CXCL10 0.20 (0.08–0.31) 1.23 (0.67–1.79) 0.12 (0.03–0.20) 0.008 0.230 0.205 0.030 CXCL9 0.15 (0.05–0.25) 0.99 (0.44–1.54) 0.07 (0.01–0.14) 0.024 0.230 0.610 0.178 TNF-β 0.14 (0.04–0.23) 0.47 (0.32–0.63) 0.03 (0.01–0.06) 0.012 0.230 0.291 0.093 TNFRSF9 0.27 (0.16–0.38) 1.28 (0.65–1.90) 0.17 (0.06–0.27) 0.002 0.230 0.782 < 0.001 The values of β overall, β1, and β2 represent the overall causal effect of TRAb on GO, the effect of TRAb on inflammatory proteins, and the effect of inflammatory proteins on GO, respectively. The indirect (mediated) effect is calculated as the product of β1 and β2, quantifying the portion of the TRAb–GO association mediated by inflammatory proteins. Table 2.
Mediation analysis of inflammatory proteins in the causal pathway linking thyrotropin receptor antibody to Graves' ophthalmopathy.
Figures
(4)
Tables
(2)