-
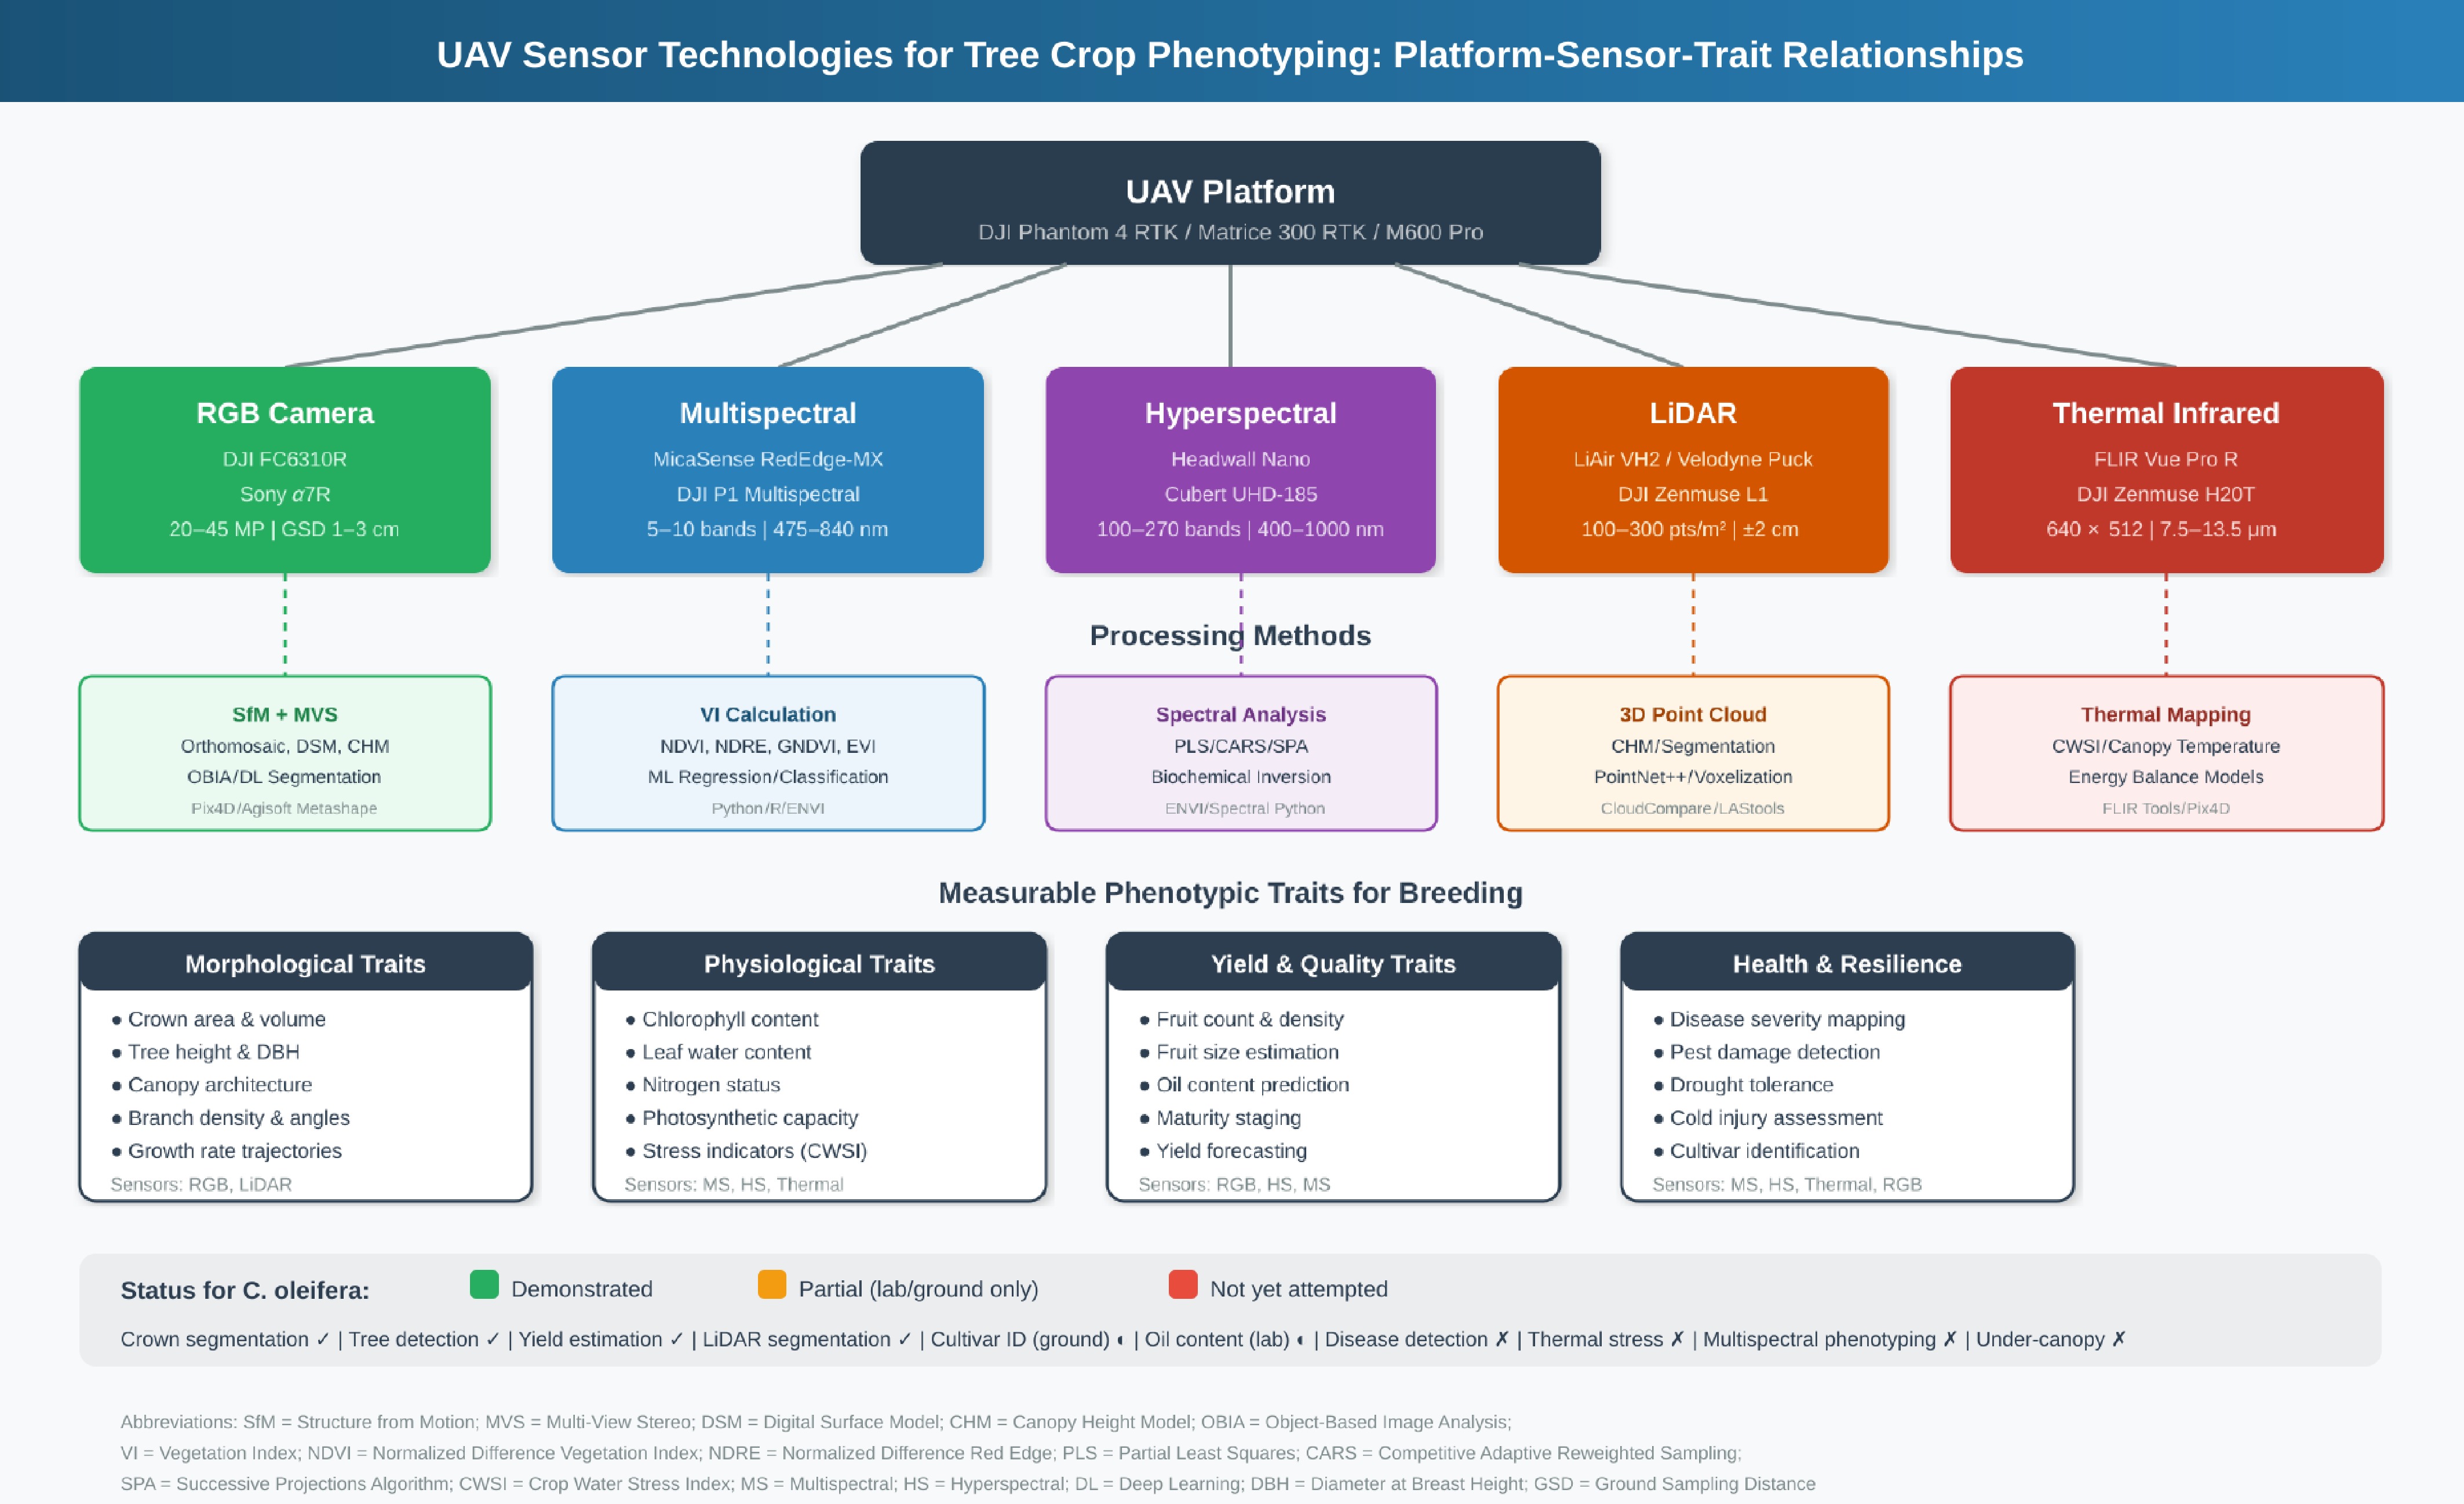
Figure 1.
Overview of UAV sensor technologies, processing methods, and measurable phenotypic traits for phenotyping in tree crop breeding. Status indicators reflect the current state of application specifically to Camellia oleifera as of early 2026.
-
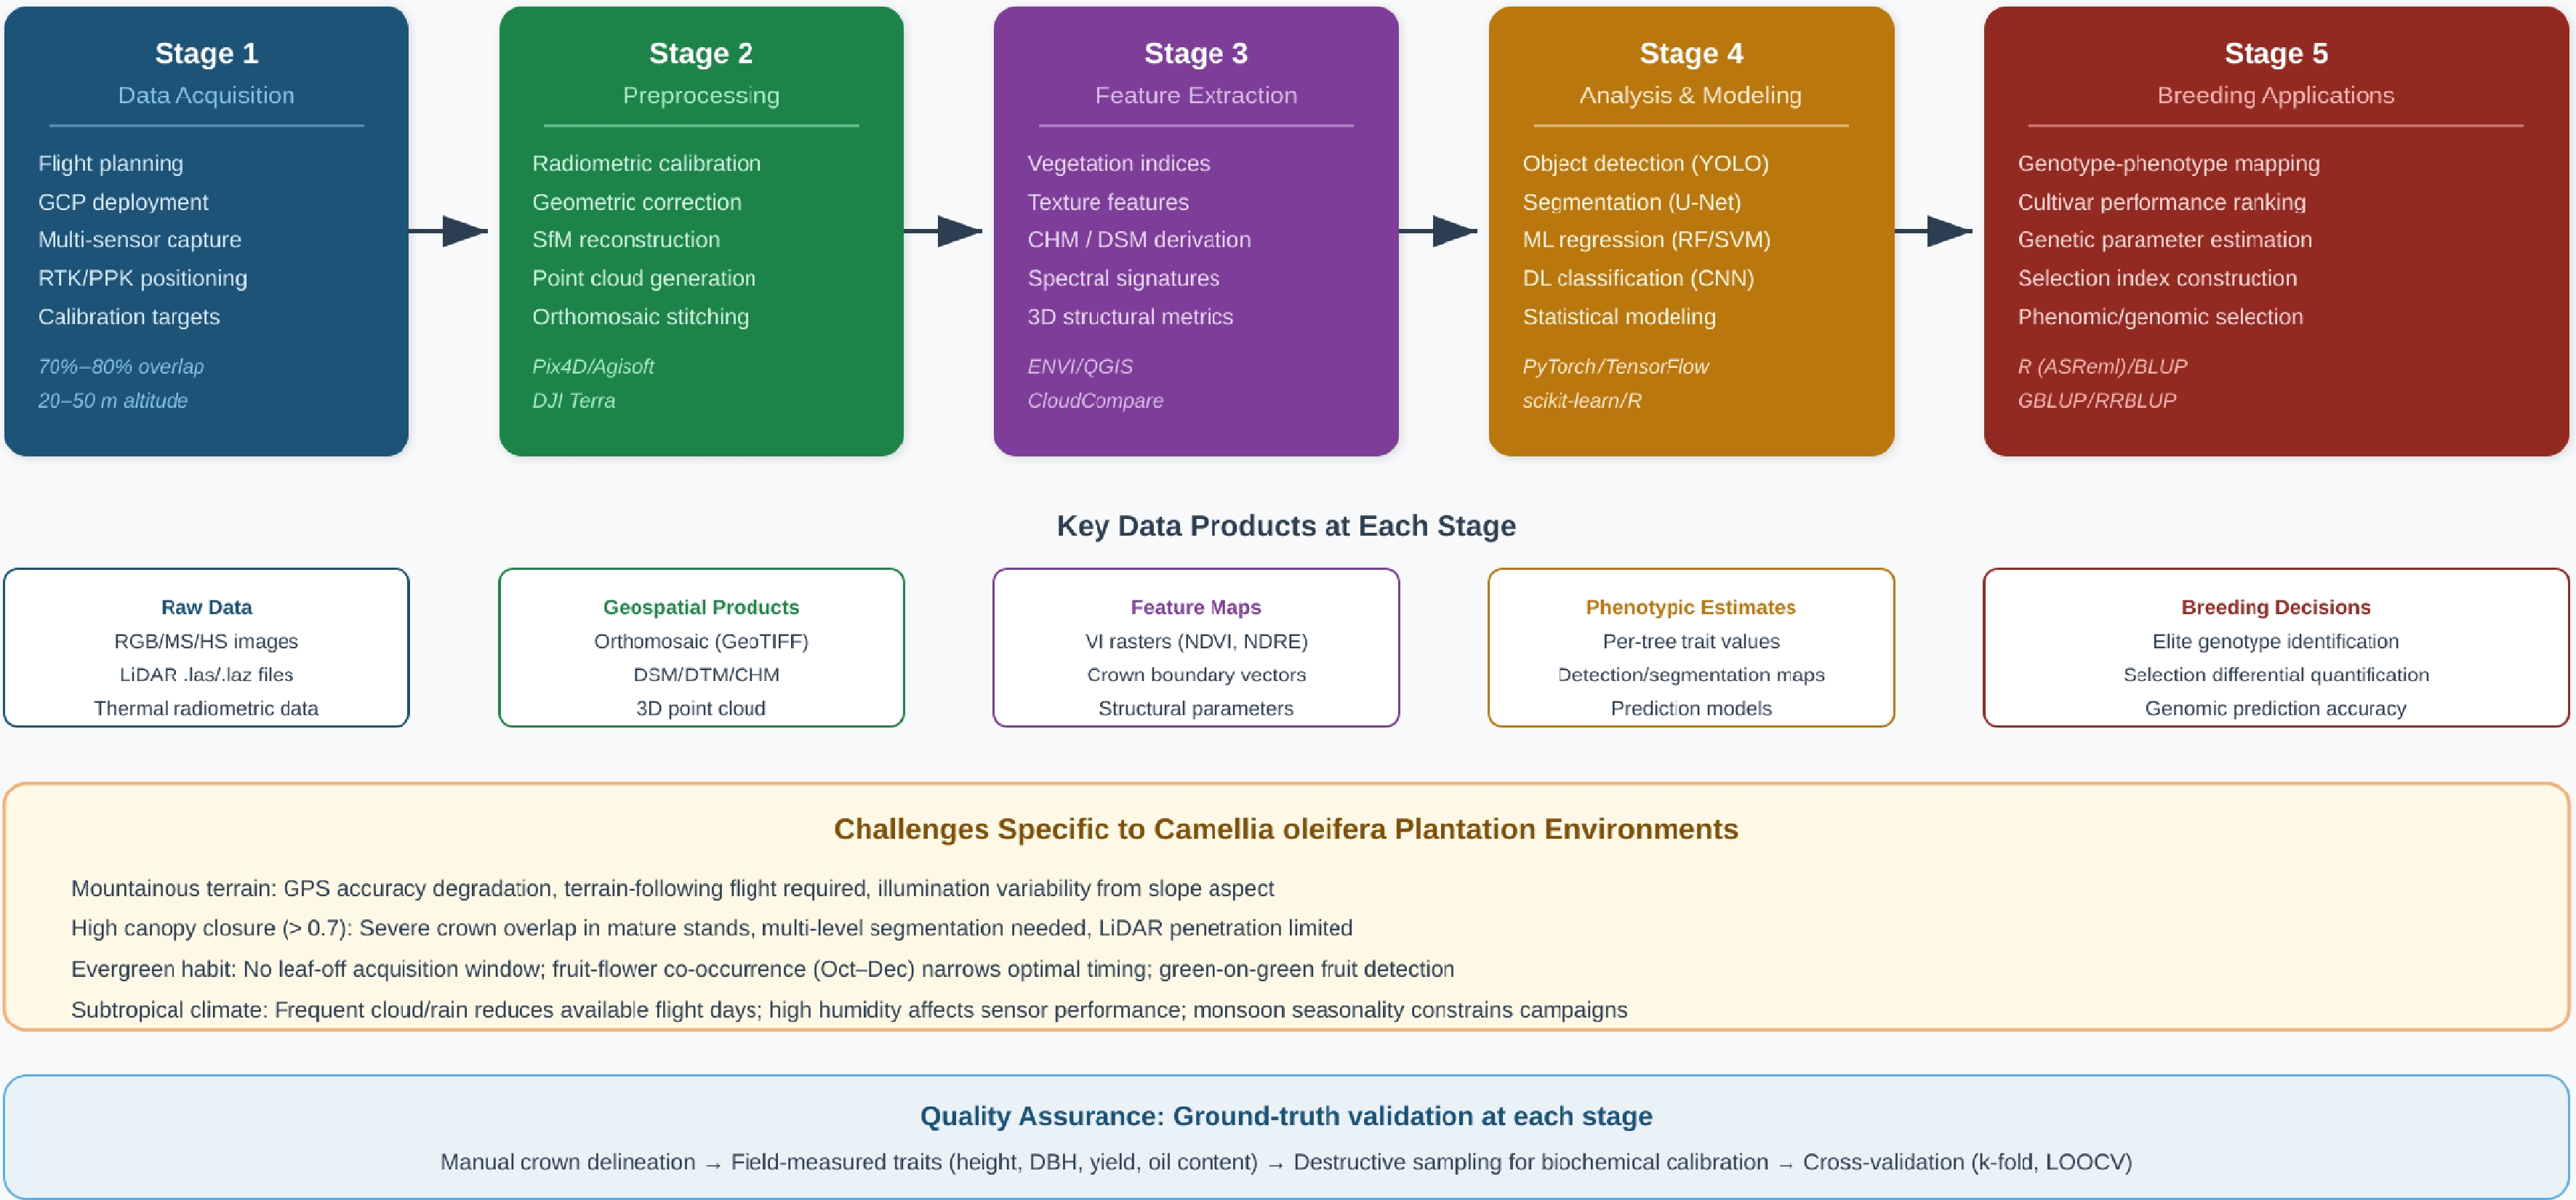
Figure 2.
Standard data processing pipeline for UAV-based tree crop phenotyping, illustrating the five processing stages from data acquisition through to breeding applications, with challenges specific to C. oleifera plantation environments.
-
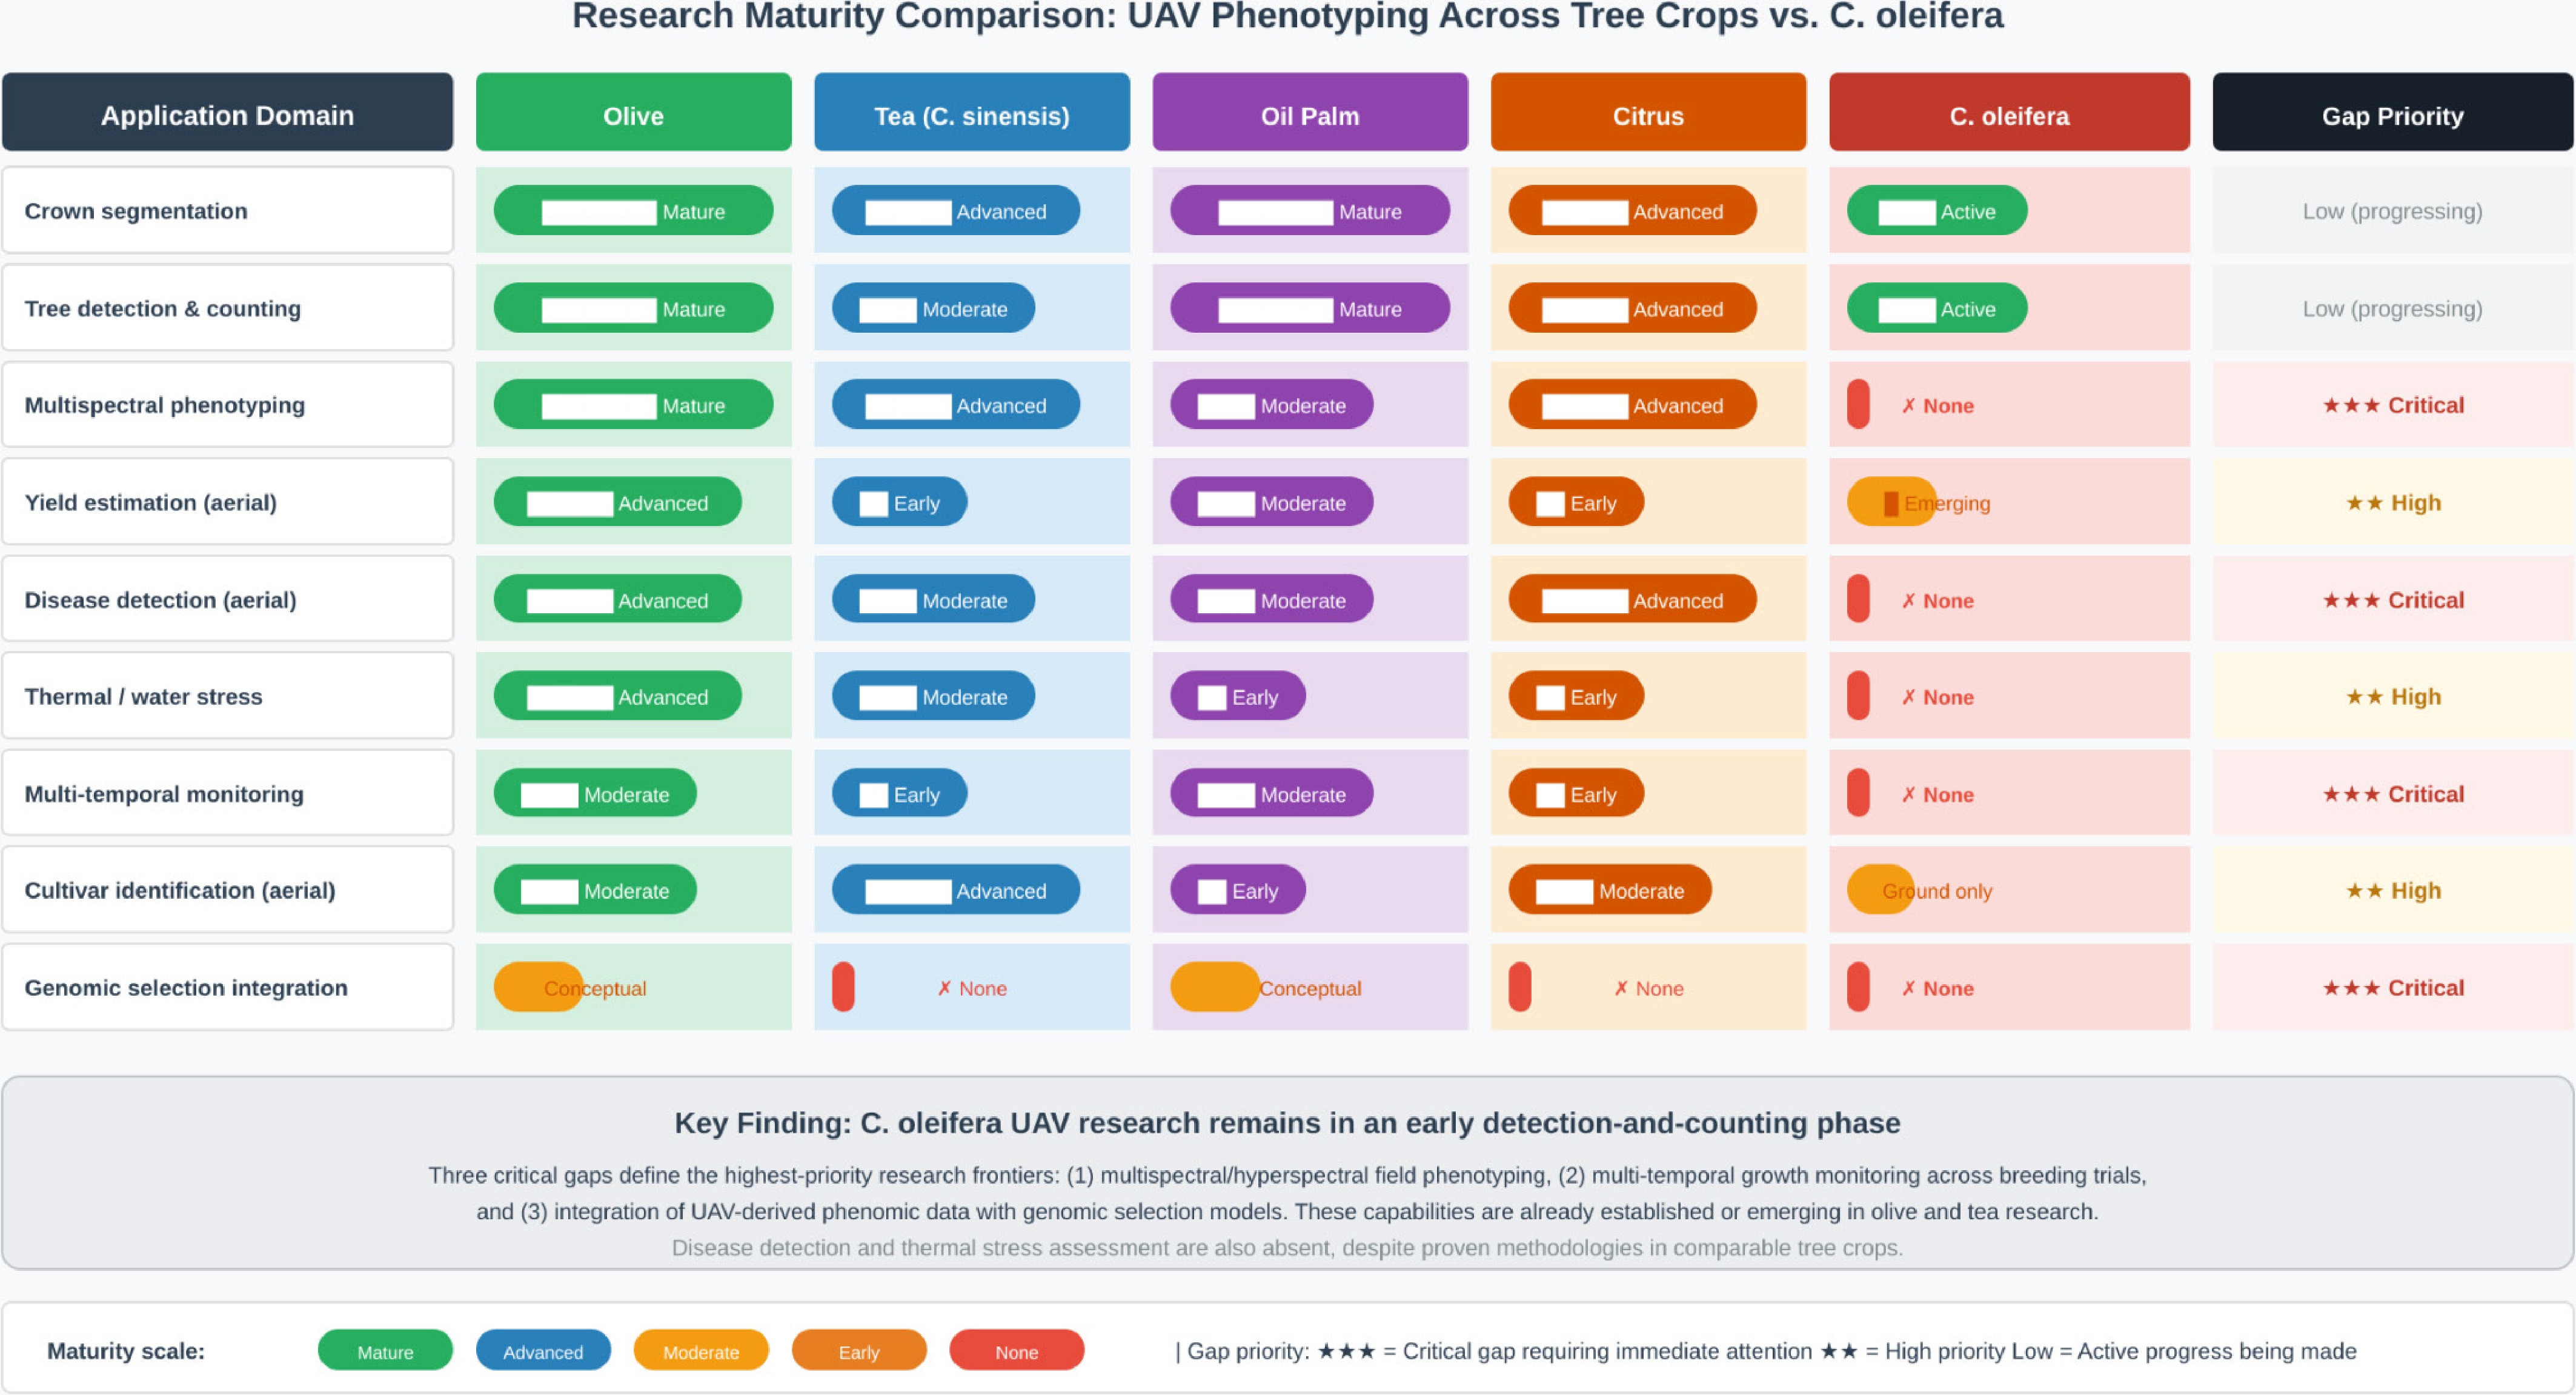
Figure 3.
Comparison of the research maturity of UAV-based phenotyping across five tree crops, highlighting critical gaps for C. oleifera. This assessment is based on published literature through to early 2026.
-
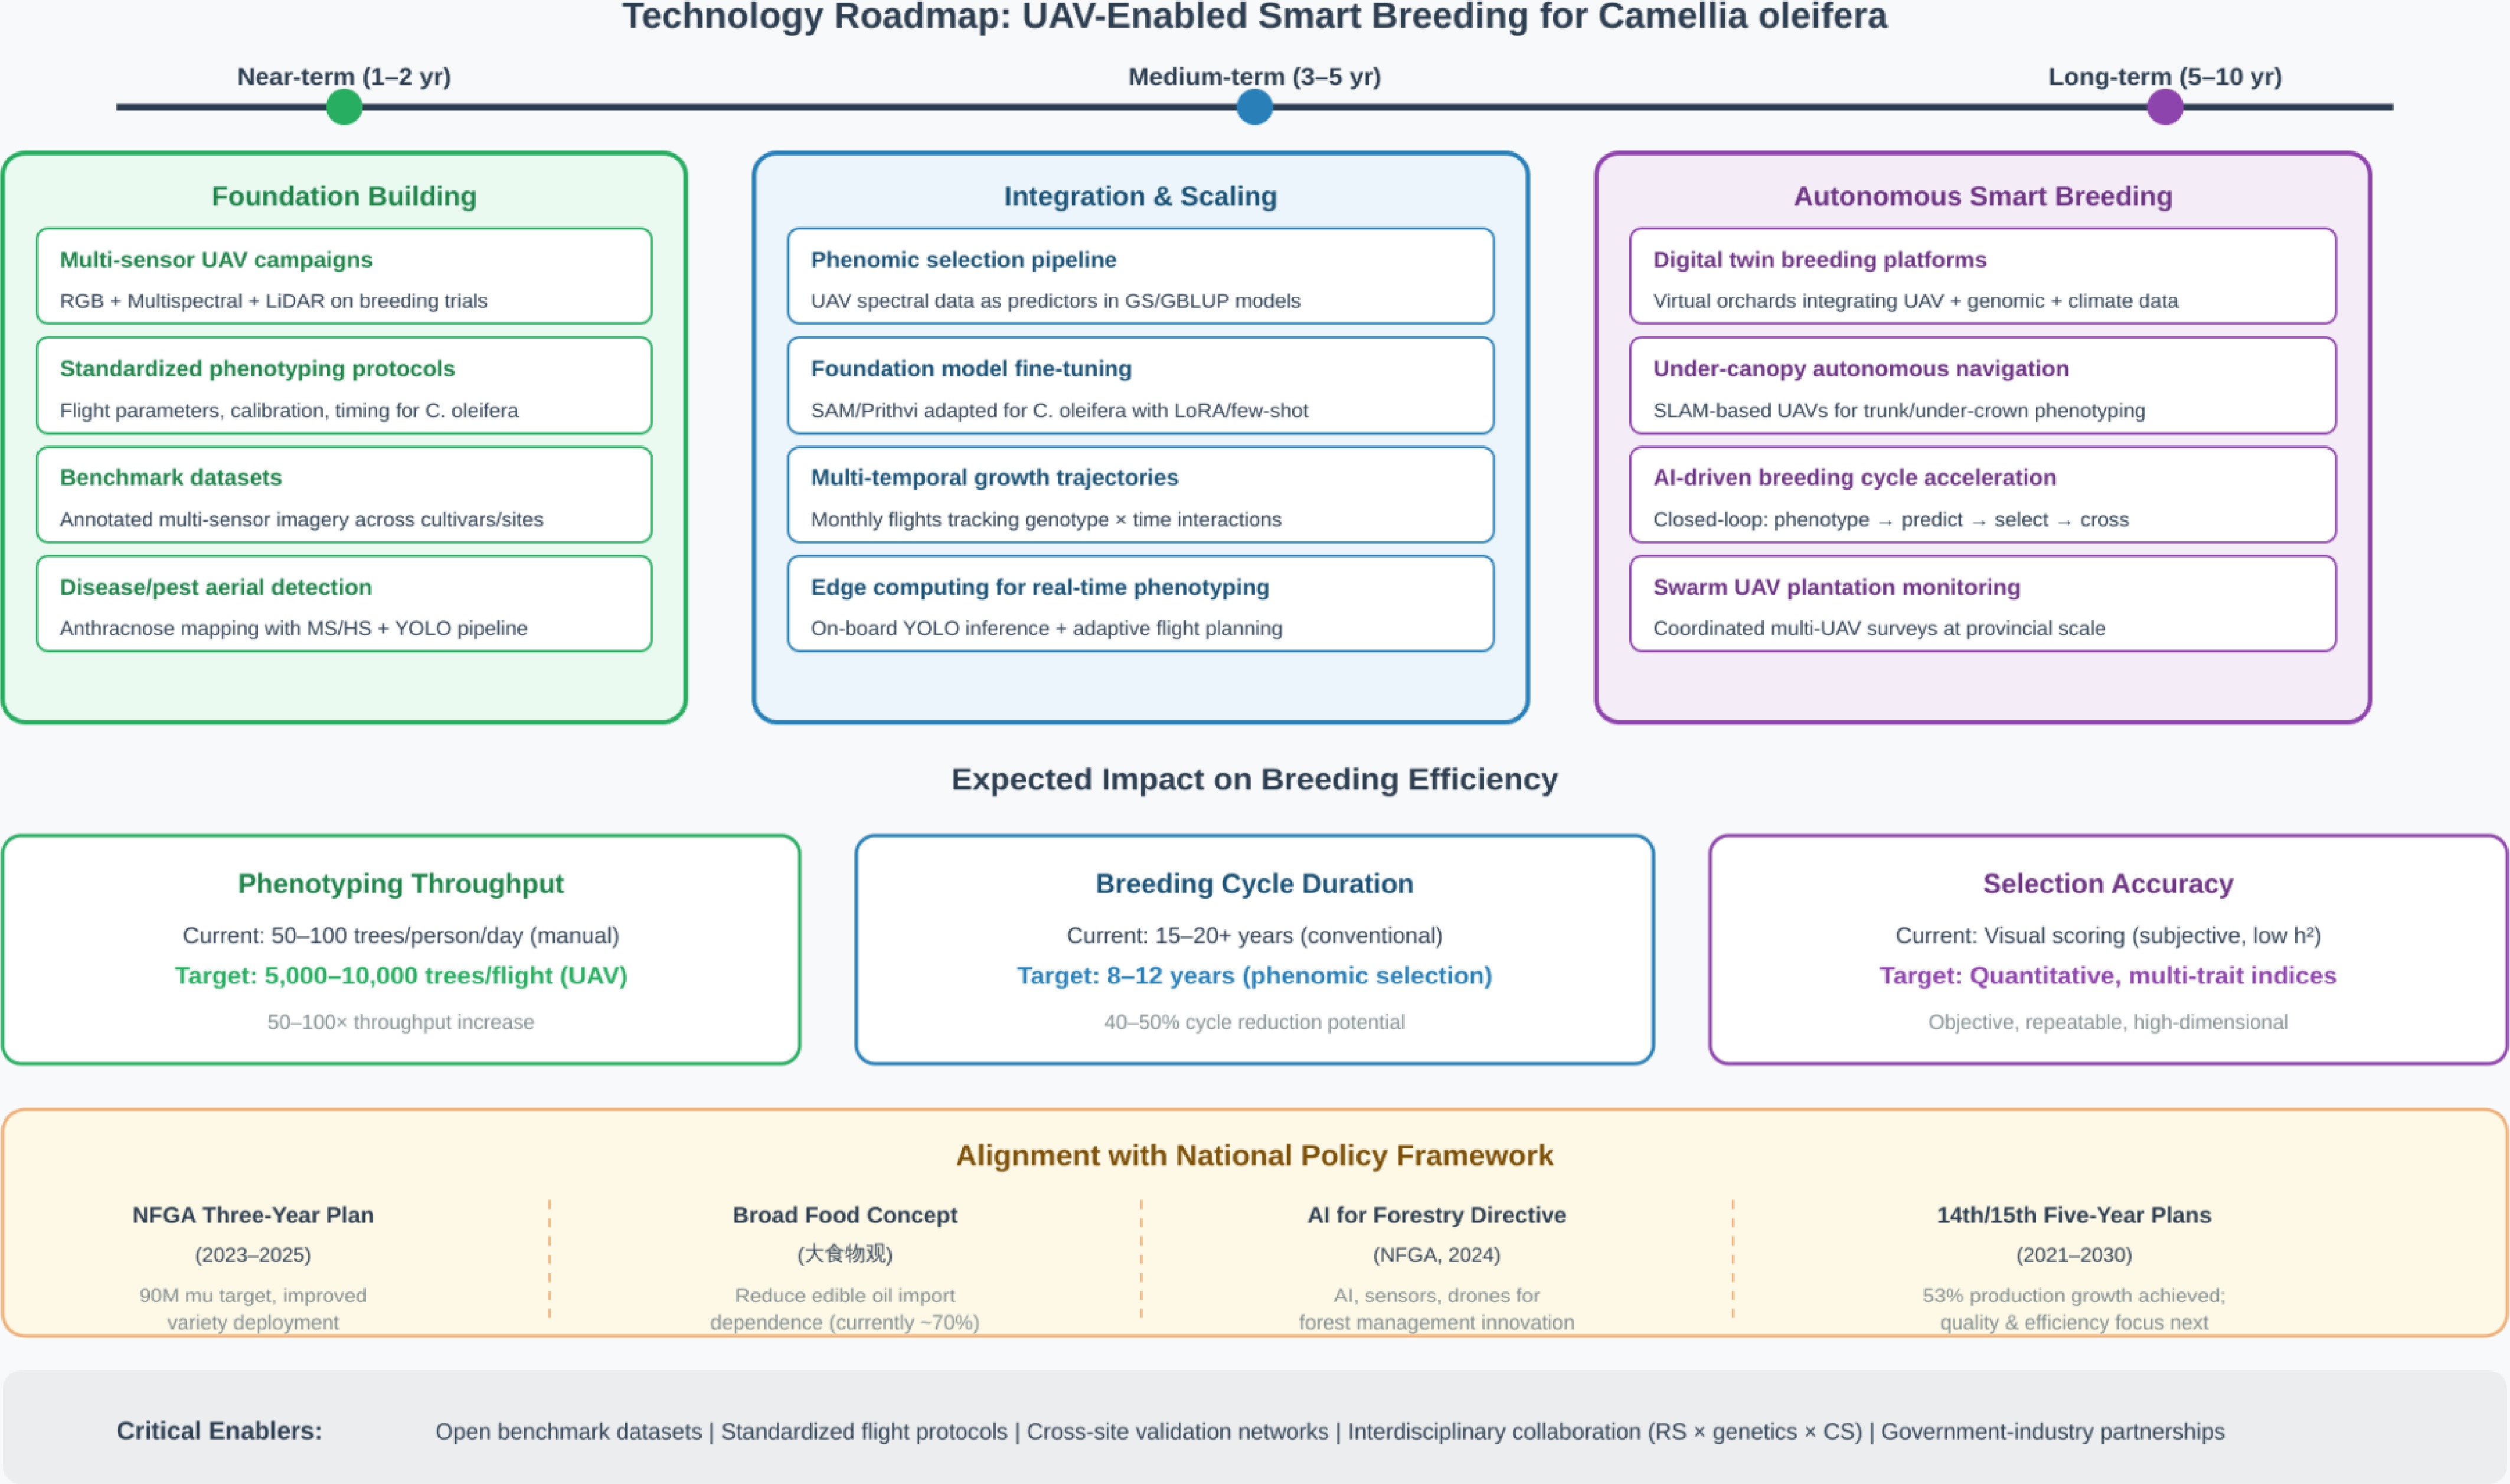
Figure 4.
Technology roadmap for UAV-enabled smart breeding of C. oleifera, showing near-, medium-, and long-term priorities aligned with China's national policy framework.
-
Sensor Spectral range Typical GSD Key outputs Phenotypic traits C. oleifera status RGB 400–700 nm (3 bands) 1–3 cm Orthomosaic, DSM, CHM, 3D model Crown area, tree count, fruit detection, canopy volume Active (F1 = 0.85 crown; mAP = 0.82 count) Multispectral 475–840 nm (5–10 bands) 3–8 cm VI maps (NDVI, NDRE), reflectance Chlorophyll, vigor, N status, water content Not attempted Hyperspectral 400–2,500 nm (100–270 bands; VNIR: 400–1,000 nm; SWIR: 1,000–2,500 nm) 5–15 cm Continuous spectral signatures, reflectance cubes Oil content, pigments, moisture, disease markers Lab only (R2 = 0.94 oil content) LiDAR 905/1,550 nm (single pulse) 2–5 cm
vertical3D point cloud, CHM, DTM Height, DBH, crown architecture, branch density Active (F-score = 0.93 segm.) Thermal IR 7.5–13.5 μm 5–15 cm Surface temperature map CWSI, drought stress, stomatal conductance Not attempted GSD, ground sampling distance; CHM, canopy height model; DSM, digital surface model; DTM, digital terrain model; VI, vegetation index; NDVI, normalized difference vegetation index; NDRE, normalized difference red edge; CWSI, crop water stress index; DBH, diameter at breast height; 3D, three-dimensional. Biochemical trait maps (e.g., oil content, pigment concentrations) are derived products requiring chemometric modeling (e.g., partial least squares [PLS] regression), not direct sensor outputs. Both hyperspectral and multispectral data can serve as inputs for biochemical proxy estimation, with hyperspectral sensors offering a finer spectral resolution for resolving overlapping absorption features. Table 1.
Comparison of UAV sensor modalities for tree crop phenotyping, with representative specifications and demonstrated applications.
-
Study Year Platform/sensor Method Target task Key accuracy [34] 2022 Phantom 4 RTK/RGB ResU-Net + CHM Crown segmentation F1 = 84.68%; crown width R² = 0.93 [41] 2024 M300 RTK/LiAir VH2 Point cloud clustering Individual tree segm. F-score = 93%; fiameter RMSE = 0.42 m [42] 2025 LiDAR + RGB fusion Multi-level segmentation Crown extraction F-score = 97.5% (canopy); 91.7% (tree) [35] 2024 Phantom 4 Pro/RGB YOLOv8m Tree detection/counting mAP@0.5 = 82.3%; count R² = 0.94 [36] 2021 Mavic 2 PRO/RGB Mask R-CNN Fruit detection/yield Fruit F1 = 89.91%; yield R² = 0.89–0.91 [50] 2022 Ground camera/RGB YOLOv7 + augmentation Fruit detection Improved detection under occlusion [51] 2024 Ground camera/RGB YOLO-CFruit (YOLOv8) Fruit detection AP@0.5 = 98.2% [49] 2022 Terrestrial LiDAR Mean shift clustering Yield estimation Automated color-space detection [53] 2024 Ground camera RegNetY + CBAM Cultivar identification 93.7% accuracy (118 varieties) [39] 2024 Lab hyperspectral CARS + PLS Oil content prediction R² = 0.94 (kernel samples) [52] 2025 Smartphone/RGB video YOLOv8 + RepViT + ByteTrack Fruit detection/yield mAP = 86.21%; yield R² = 0.905 Studies using ground-based sensors are included where they demonstrate methodological capabilities transferable to UAV platforms. YOLO, you only look once; PLS, partial least squares; CBAM, convolutional block attention module; AP, average precision; mAP@0.5, mean average precision at an intersection-over-union (IoU) threshold of 0.5. Table 2.
Summary of remote sensing and computer vision studies on Camellia oleifera phenotyping (2019–2026), ordered by application domain. Studies using ground-based platforms are included where the methodologies are directly transferable to UAV deployment.
-
Research gap Current status Impact on breeding Priority Multispectral field phenotyping Not attempted for C. oleifera Prevents nondestructive screening of vigor/chlorophyll across genotypes High (1–2 yr) Aerial disease detection Not attempted; lab spectroscopy only Cannot screen for anthracnose resistance at scale High (1–2 yr) Multitemporal growth monitoring Absent; all studies used a single time point Blocks genetic parameter estimation (heritability, breeding values) High (2–3 yr) Phenomic–genomic integration Unexplored for C. oleifera Cannot leverage UAV data for accelerating genomic
selectionTransformative
(3–5 yr)Cross-site model generalization Not evaluated Limits deployment across multienvironment breeding trials Medium (2–3 yr) Under-canopy phenotyping No capability exists Invisible lower-branch fruit and trunk traits excluded from evaluations Long-term (5–7 yr) Table 3.
Summary of critical research gaps and priority tasks for UAV-based C. oleifera phenotyping.
-
Technology TRL Timeline Impact Key barrier Required infrastructure Multisensor fusion TRL 6–7 1–2 years High Cost (US ${\$} $ Multipayload UAV, calibration protocols Foundation model fine-tuning TRL 4–5 2–3 years High GPU computer Annotated benchmarks (500+ trees), GPU cluster Edge computing phenotyping TRL 5–6 2–4 years Medium Model compression Jetson hardware, lightweight models Under-canopy SLAM-UAV TRL 3–4 5–7 years High Safety Custom UAV, LiDAR-SLAM, obstacle avoidance Digital twin platforms TRL 3–4 5–10 years Very high System integration Cloud platform, multisource data APIs Phenomic selection TRL 4–5 3–5 years Transformative Multiyear data Multitemporal UAV, genotyping, quantitative genetics TRL, Technology readiness level (1–9 scale). TRL 3–4 = experimental proof of concept; TRL 5–6 = validated in a relevant environment; TRL 7+ = demonstrated in an operational environment. SLAM, simultaneous localization and mapping; GPU, graphics processing unit; APIs, application programming interfaces. Table 4.
Emerging technologies for C. oleifera UAV phenotyping: readiness, impact potential, and implementation requirements.
Figures
(4)
Tables
(4)