-
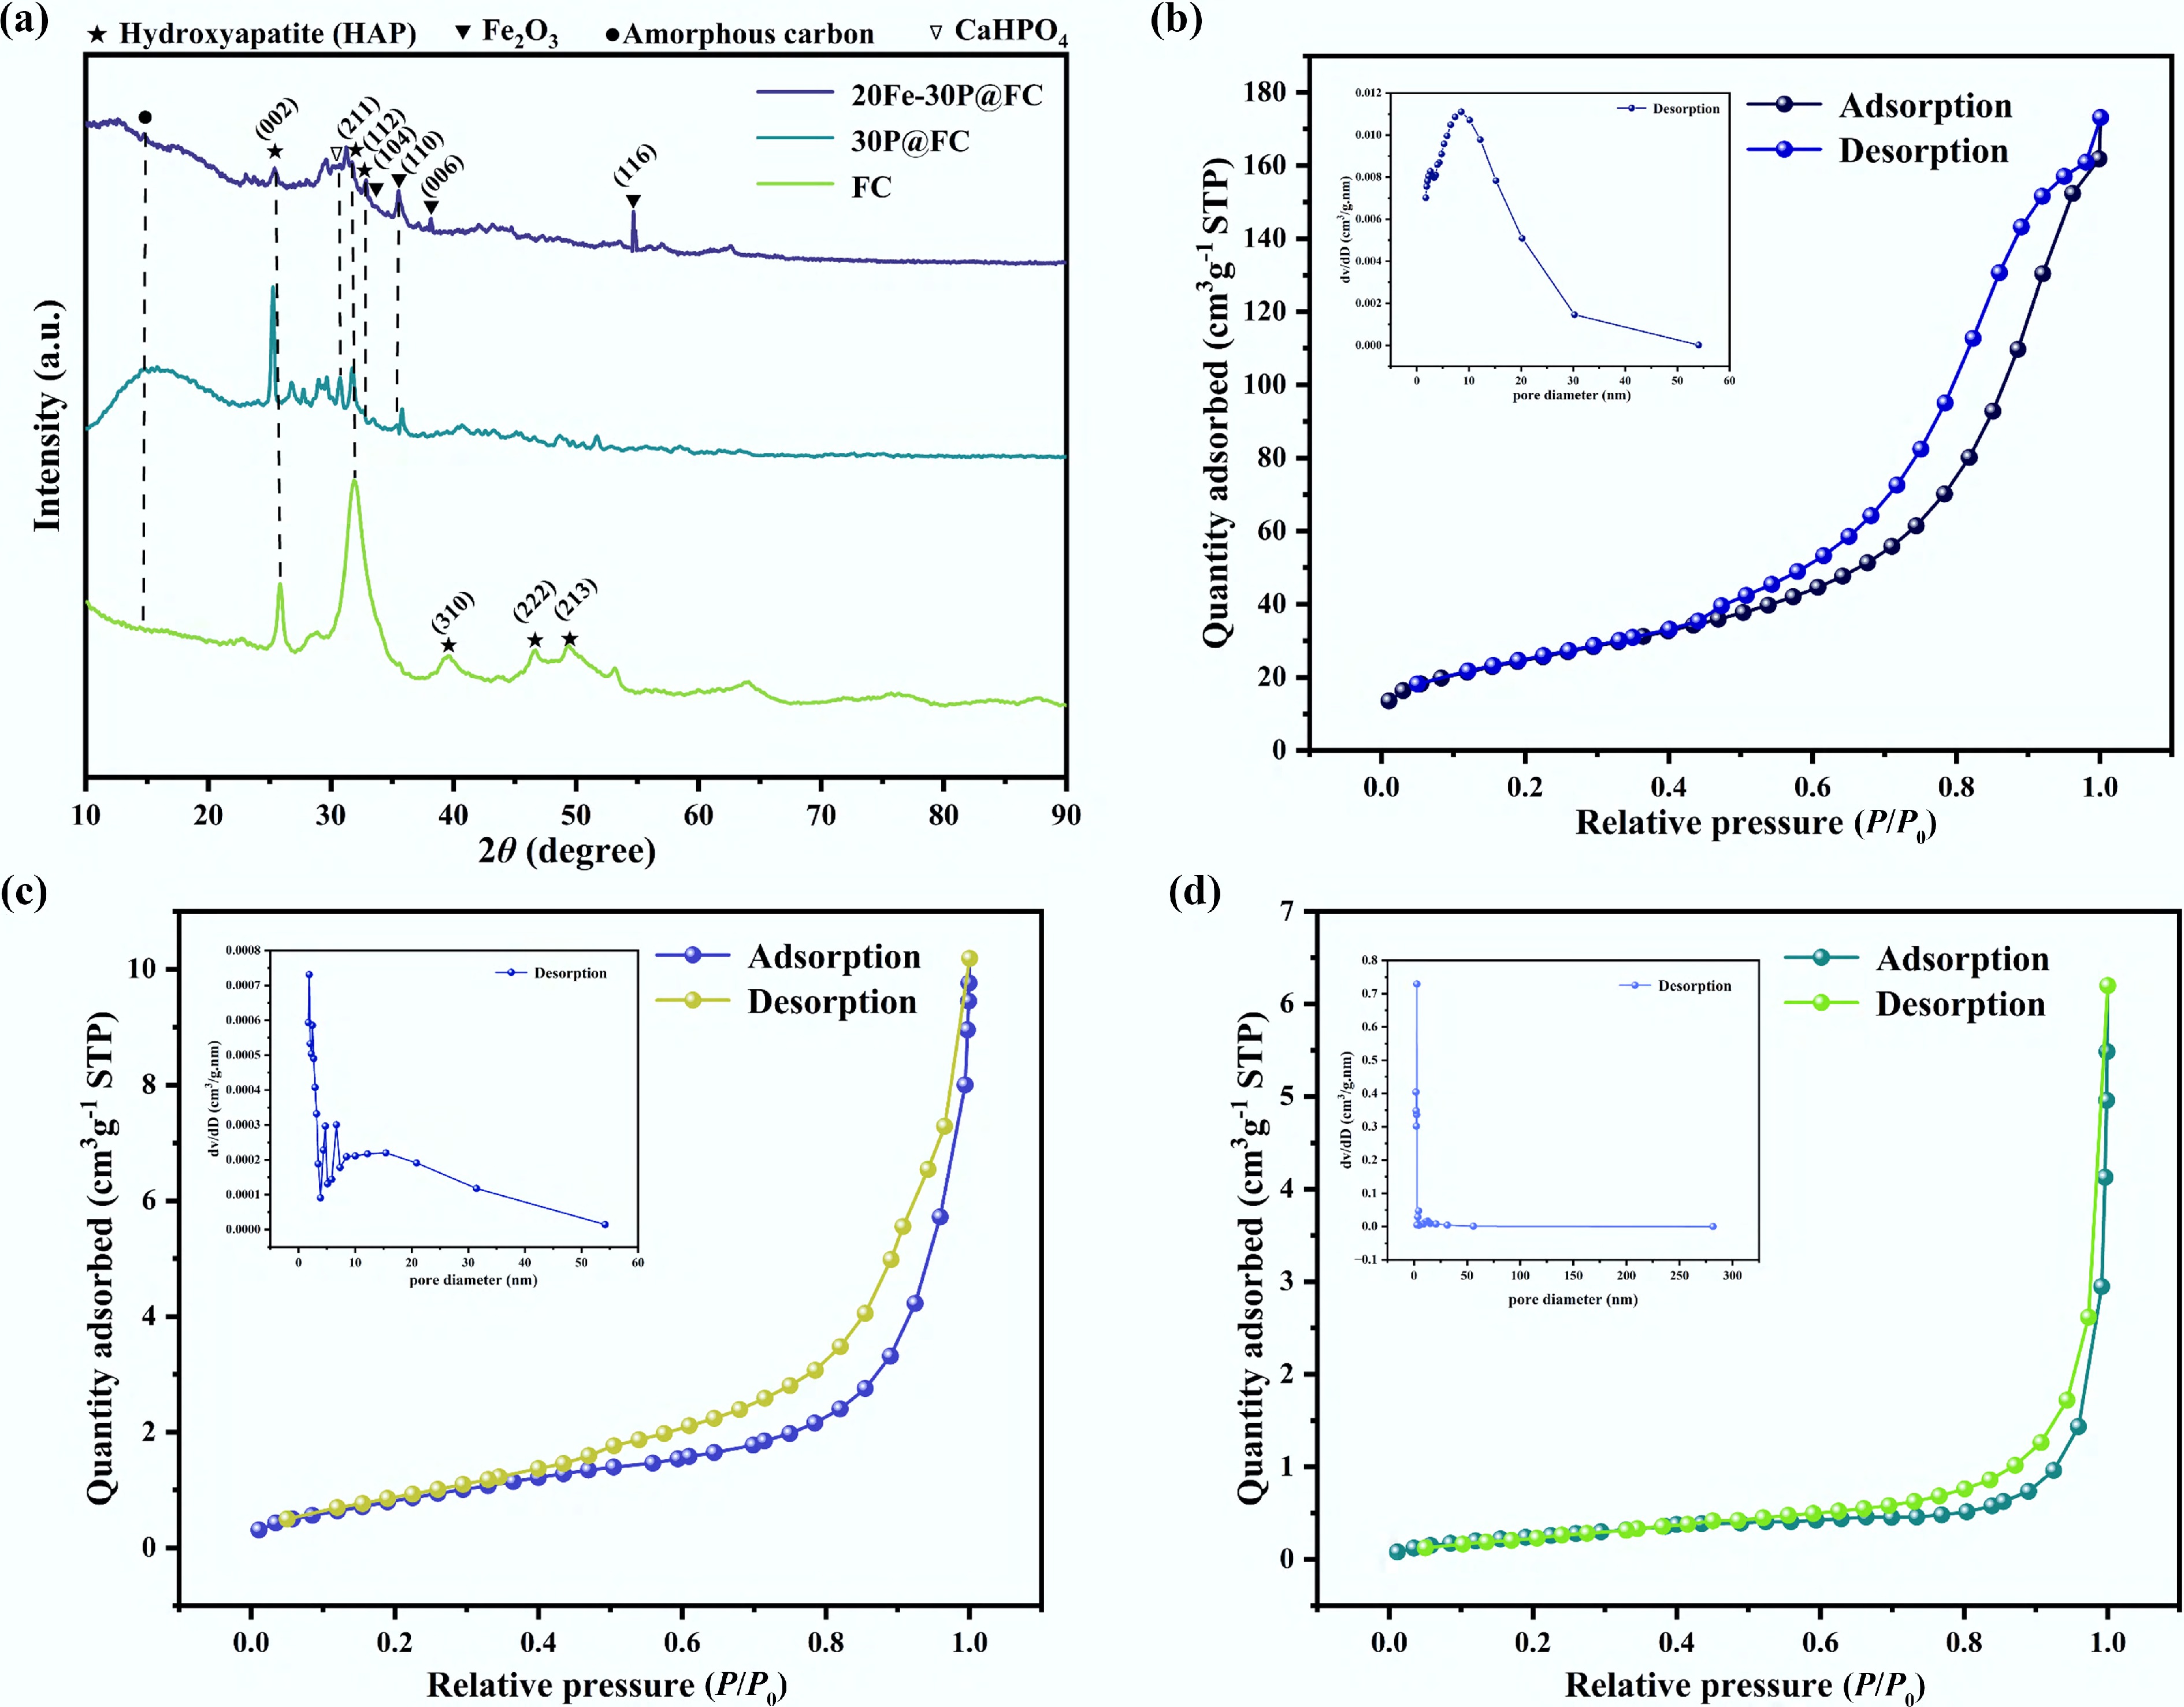
Figure 1.
(a) X-ray diffraction patterns of FC, 30P@FC, and 20Fe-30P@FC catalysts. (b)–(d) N2-TPD curves of FC, 30P@FC, and 20Fe-30P@FC catalysts, respectively.
-
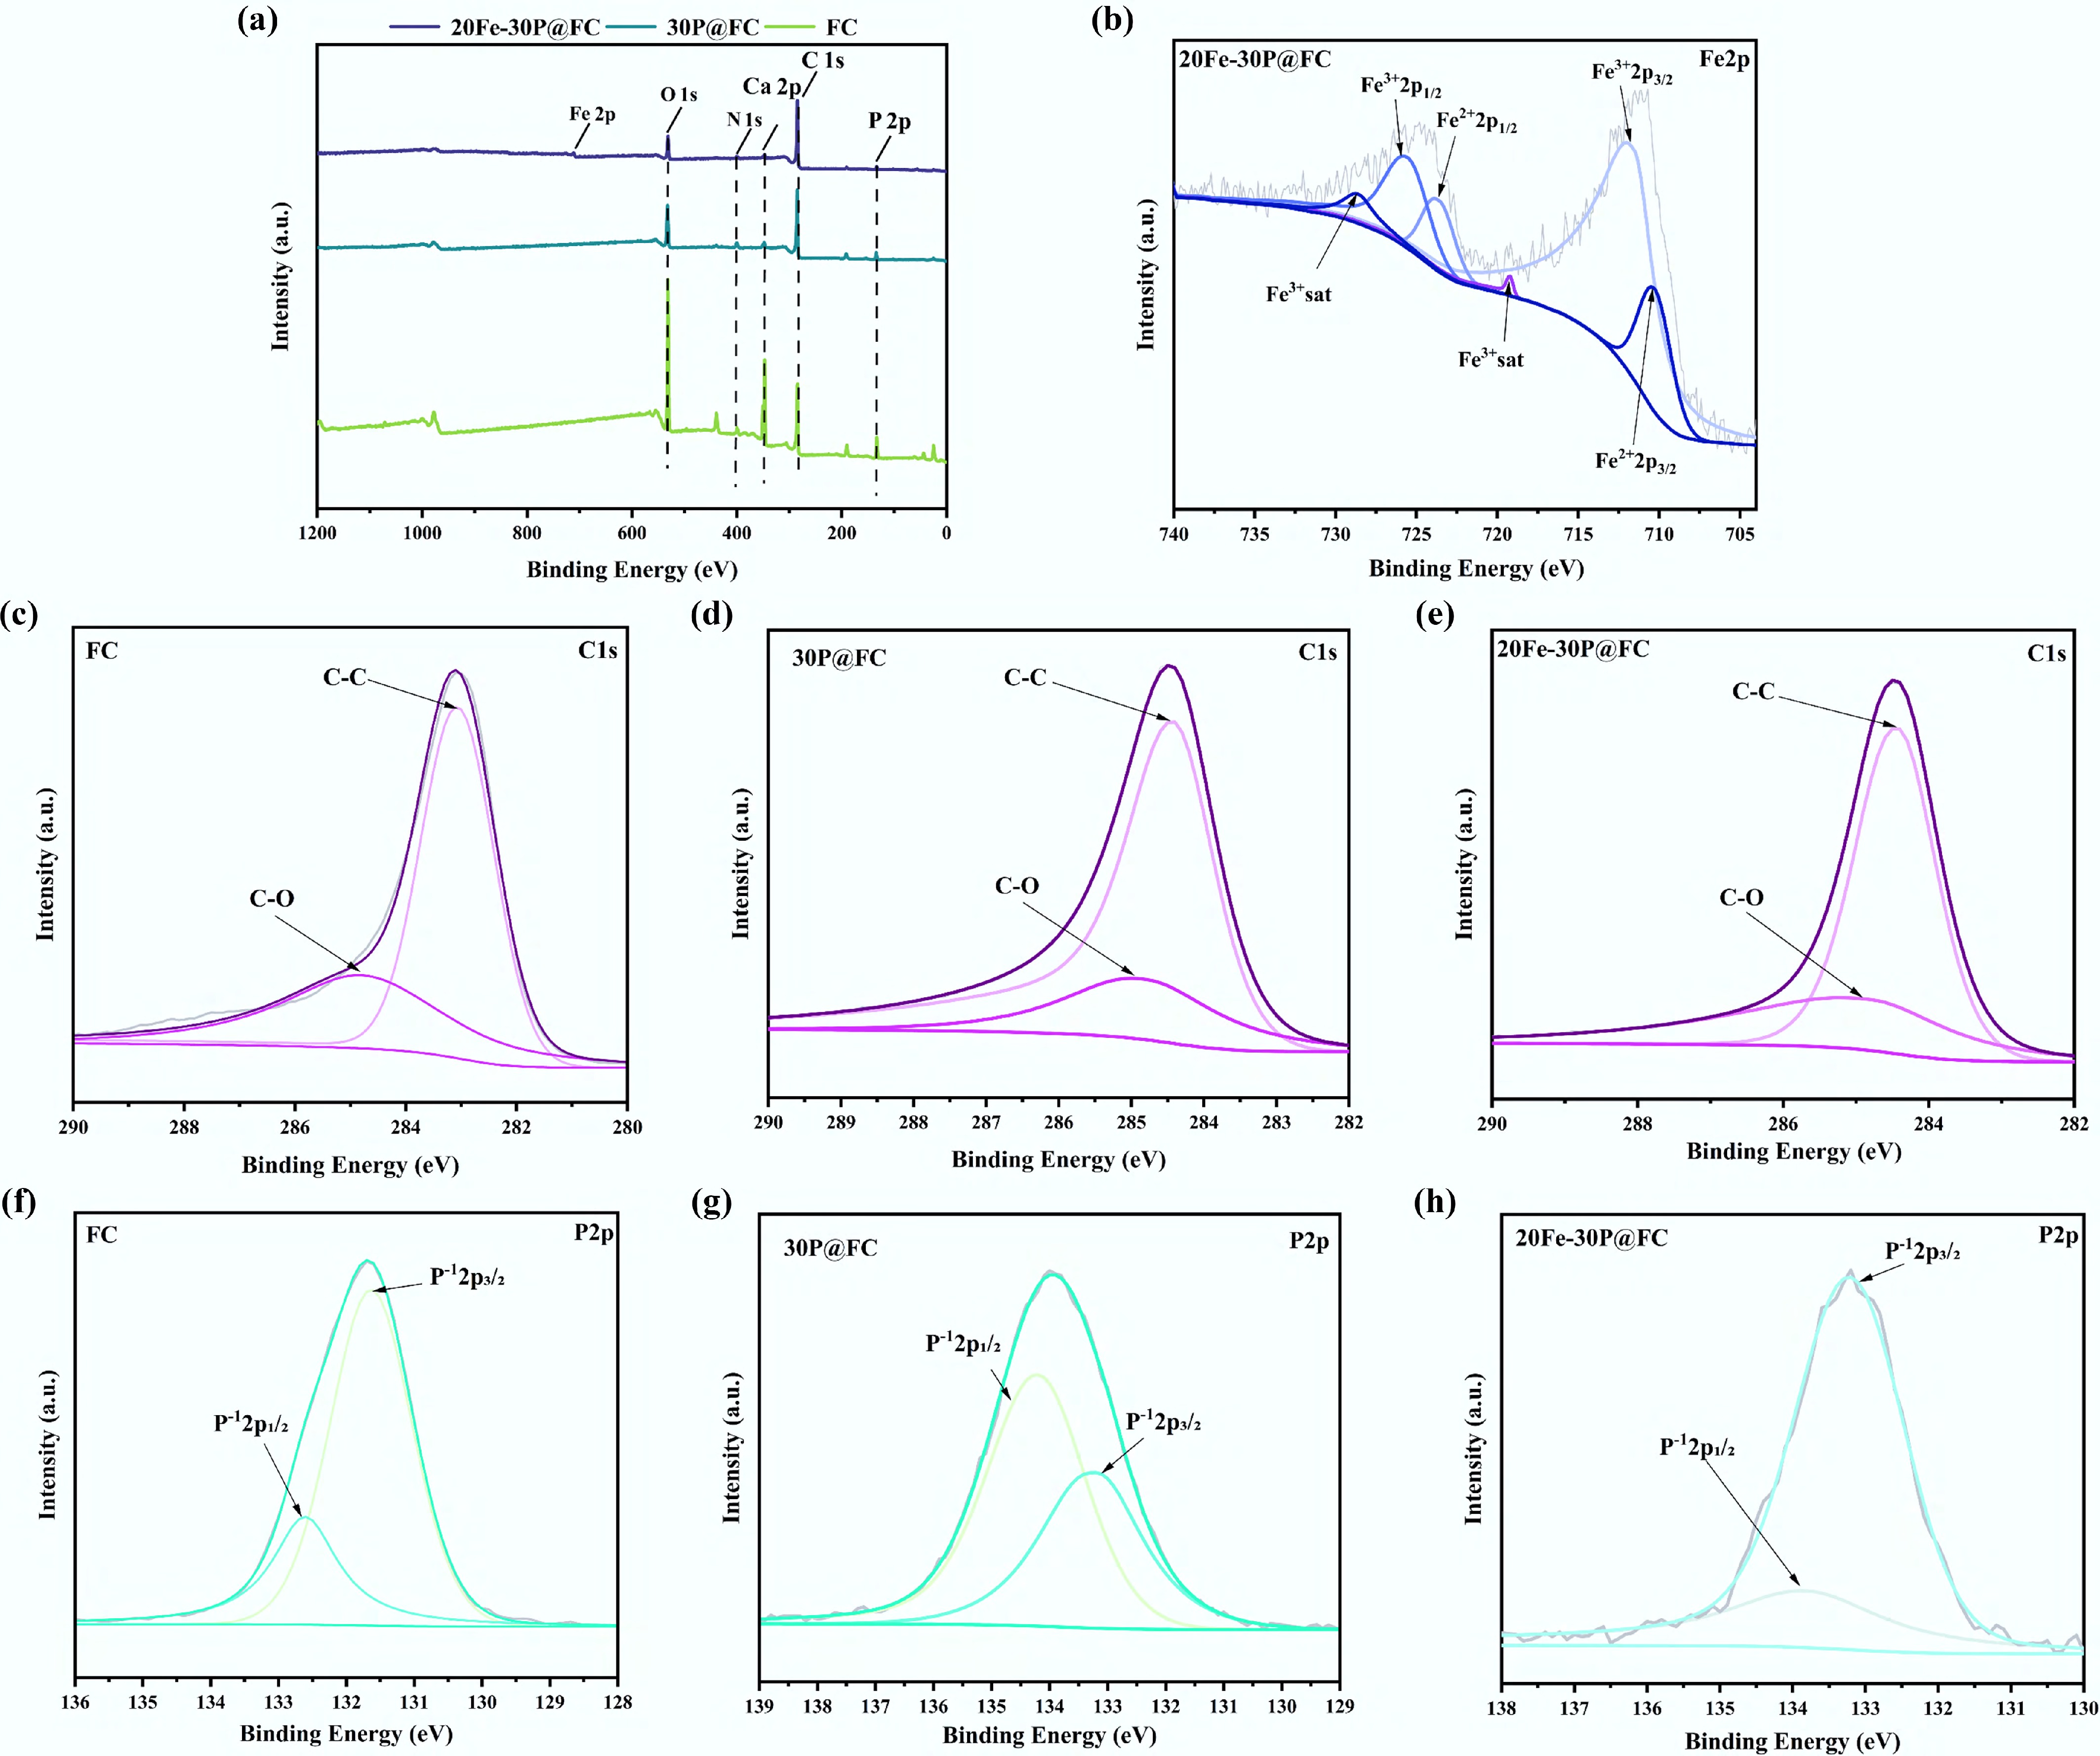
Figure 2.
(a) XPS results for FC, 30P@FC, 20Fe-30P@FC XPS measurements. (b) Fe2p of 20Fe-30P@FC. (c) C1s of FC. (d) C1s of 30P@FC. (e) C1s of 20Fe-30P@FC. (f) P2p of FC. (g) P2p of 30P@FC. (h) P2p of 20Fe-30P@FC catalysts.
-
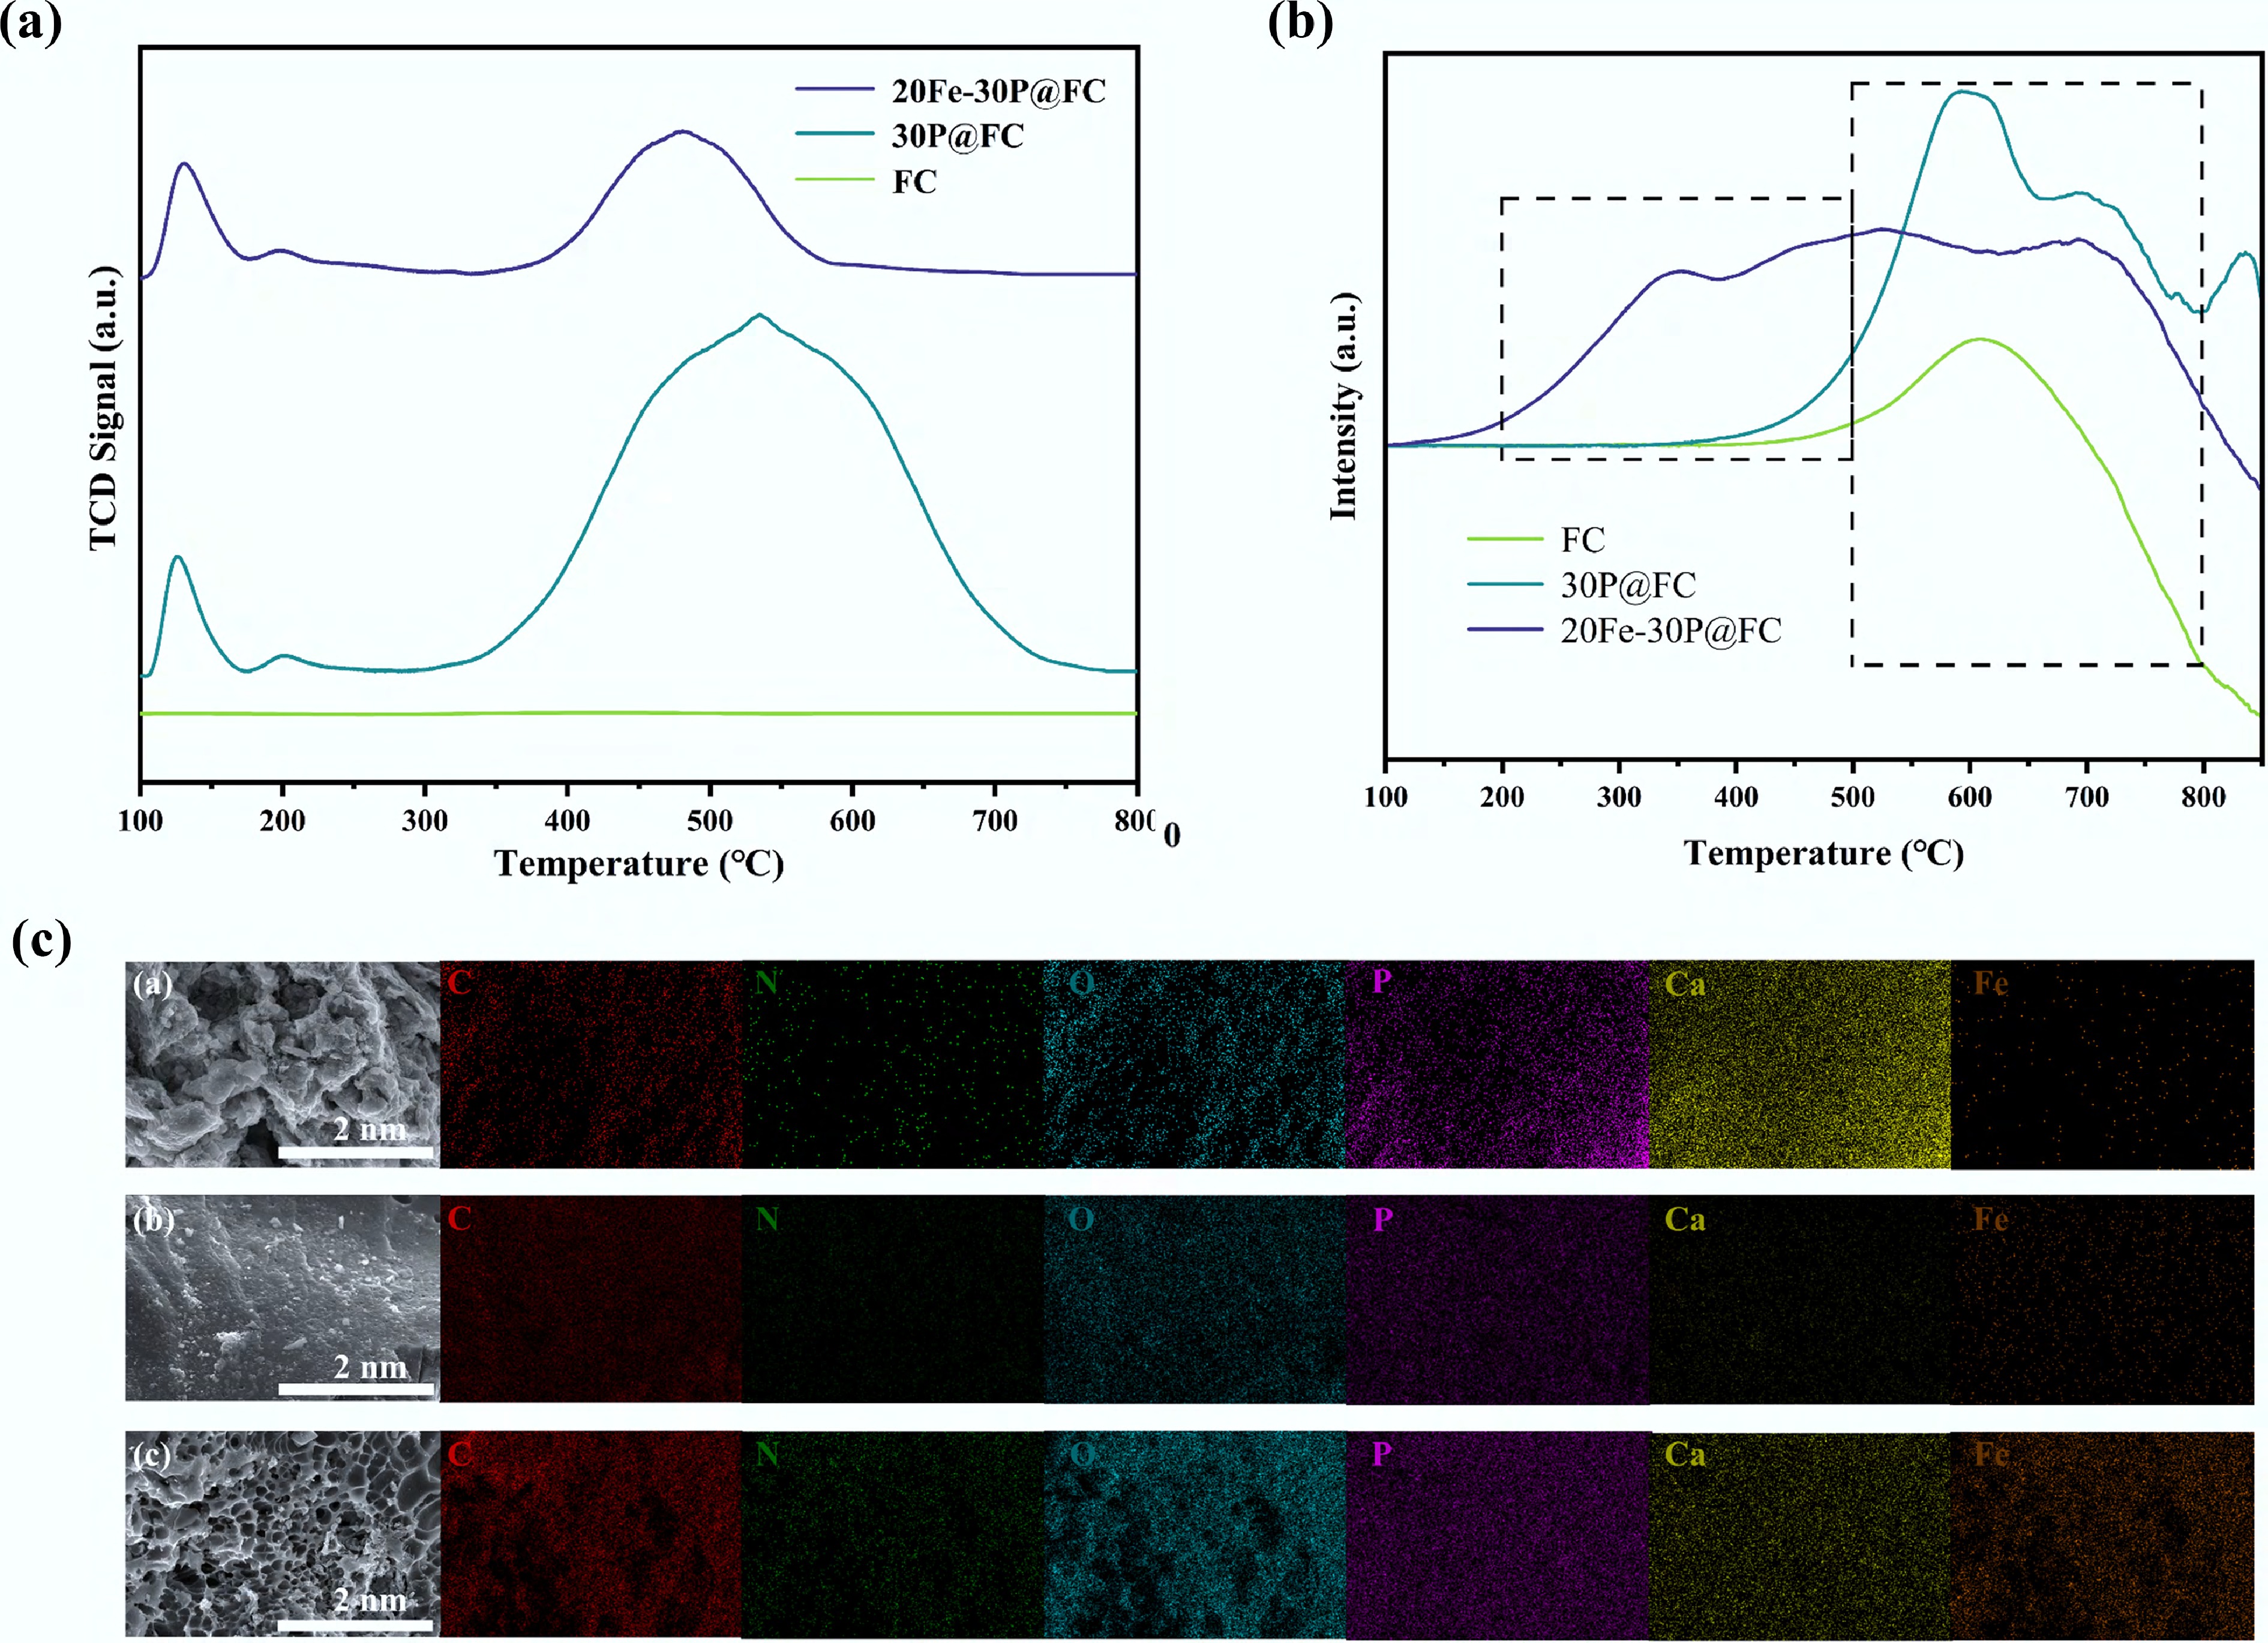
Figure 3.
(a) NH3-TPD spectra of prepared catalysts. (b) H2-TPR spectra of prepared catalysts. (c) SEM-EDS spectra of prepared catalysts.
-
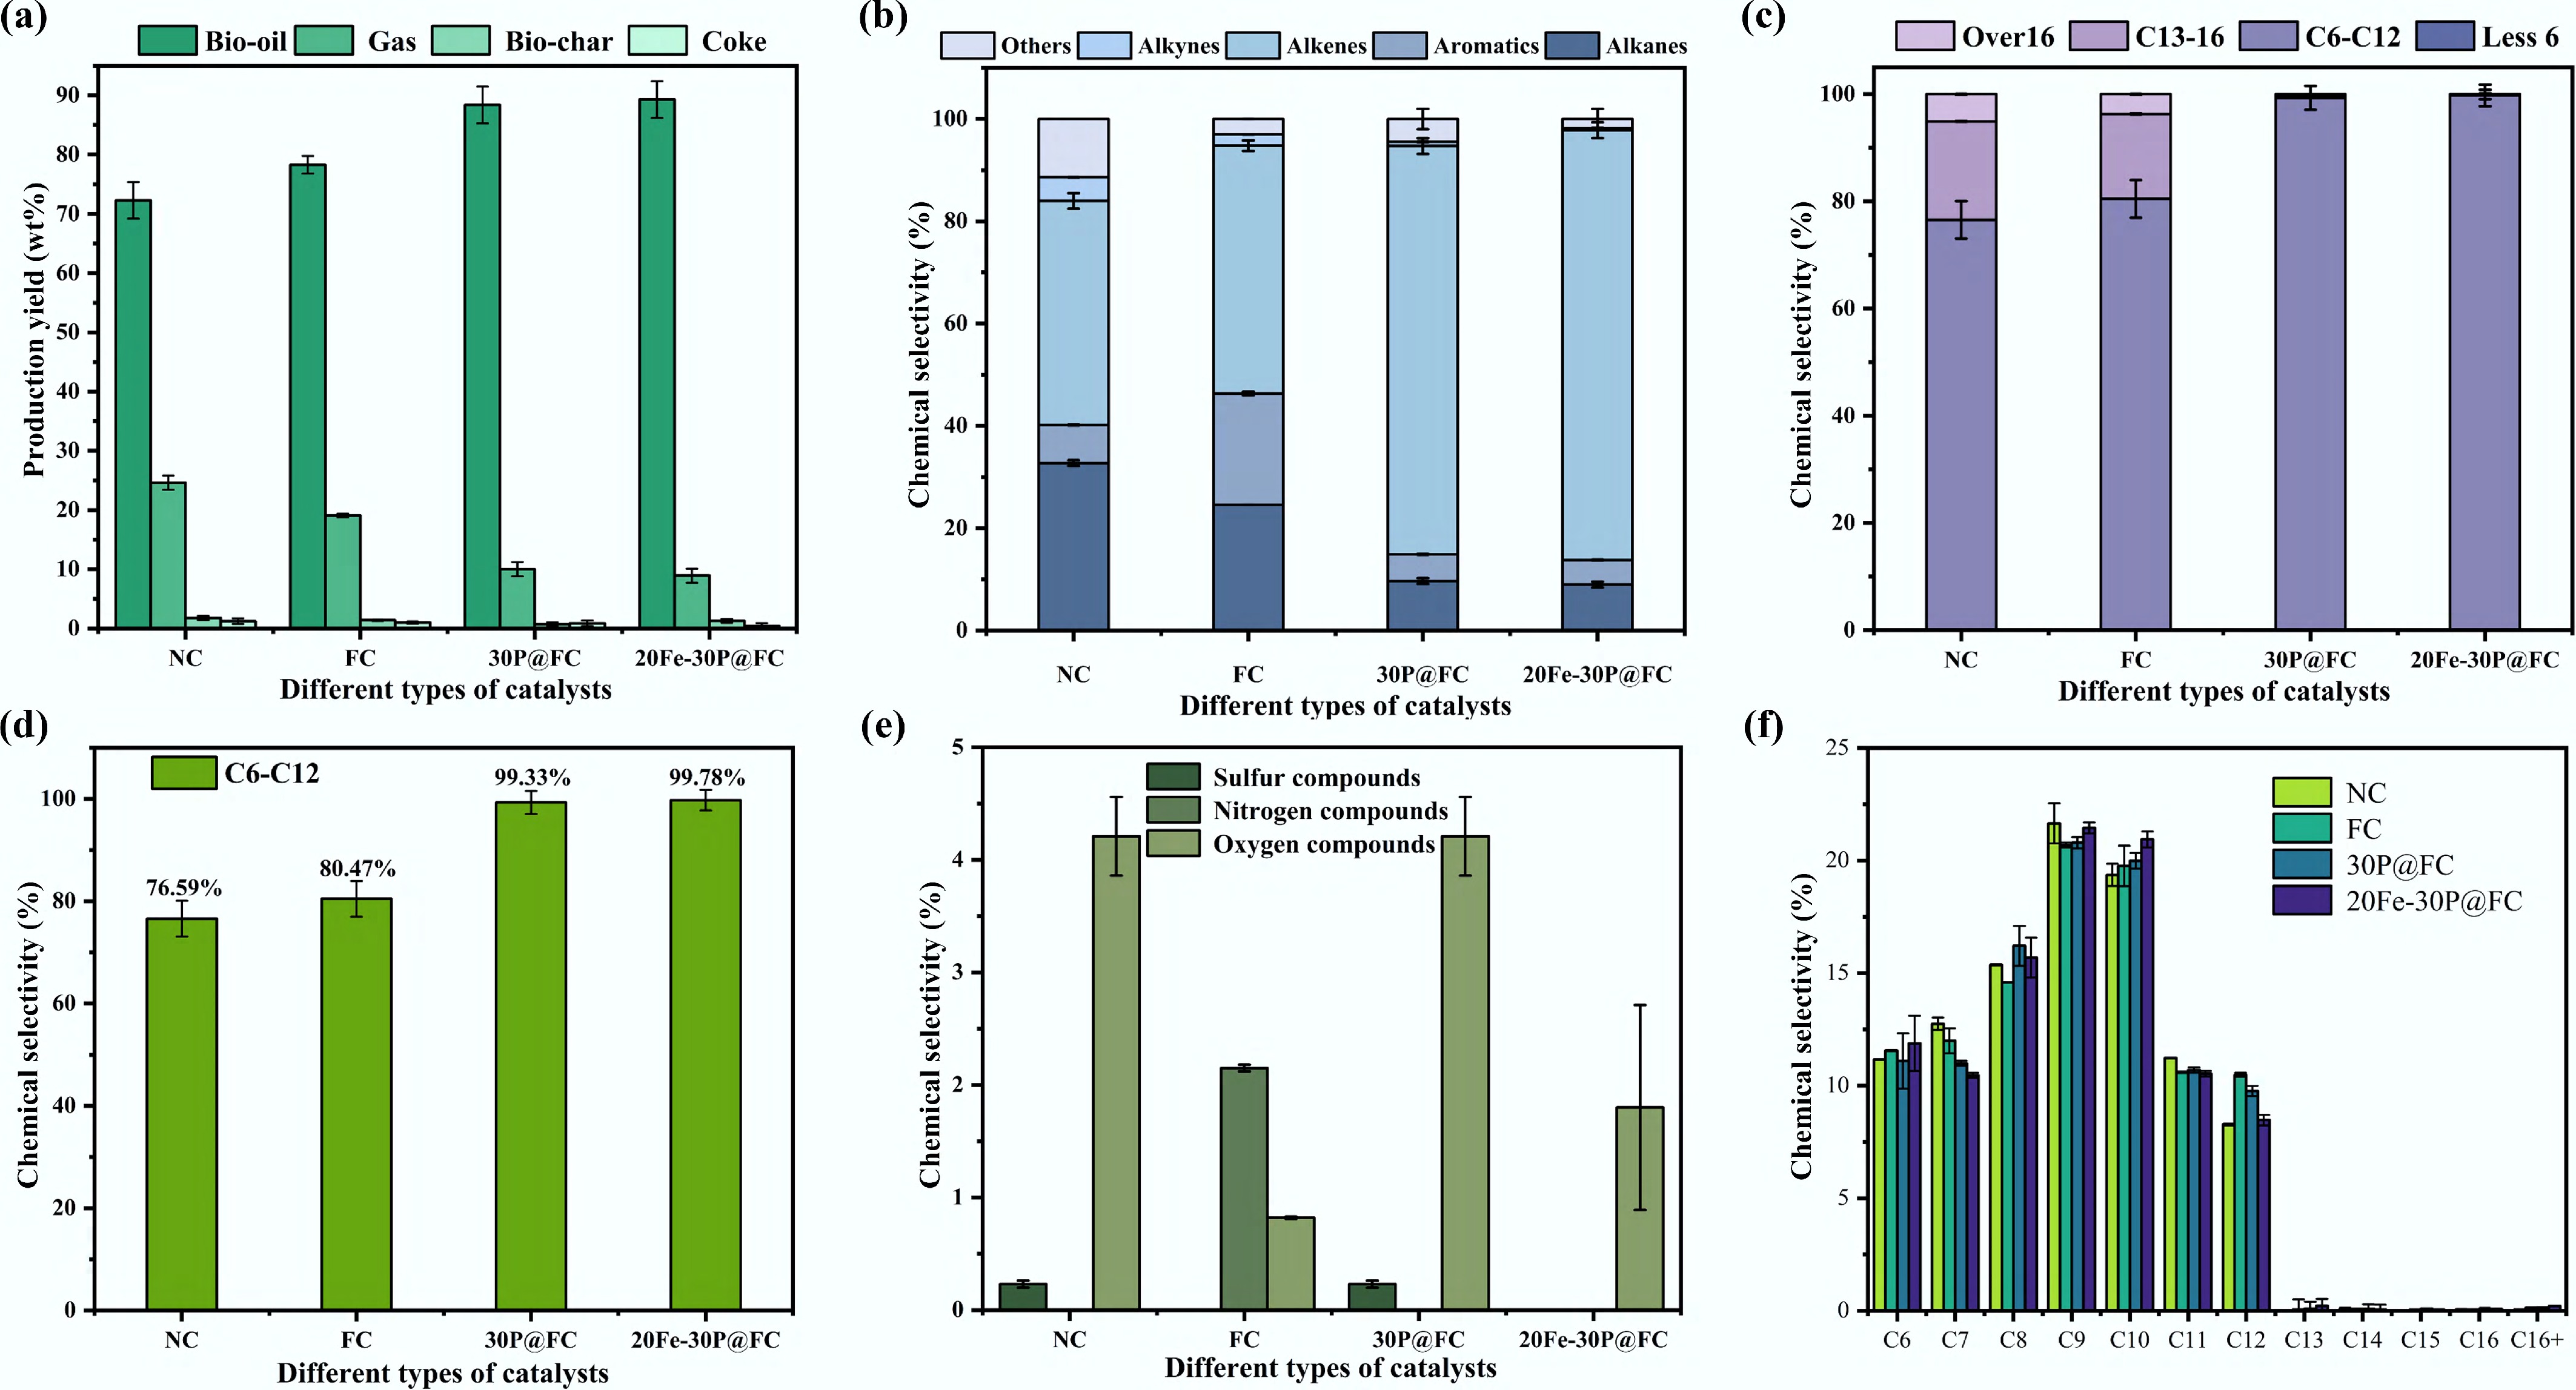
Figure 4.
Yield and composition of bio-oil under different conditions. (a) Pyrolysis products. (b) Bio-oil composition. (c) Distribution of carbon numbers in bio-oil. (d) Content of C6–C12 compounds in bio-oil. (e) Distribution of other substances in bio-oil. (f) Distribution of carbon numbers at optimal acidity.
-
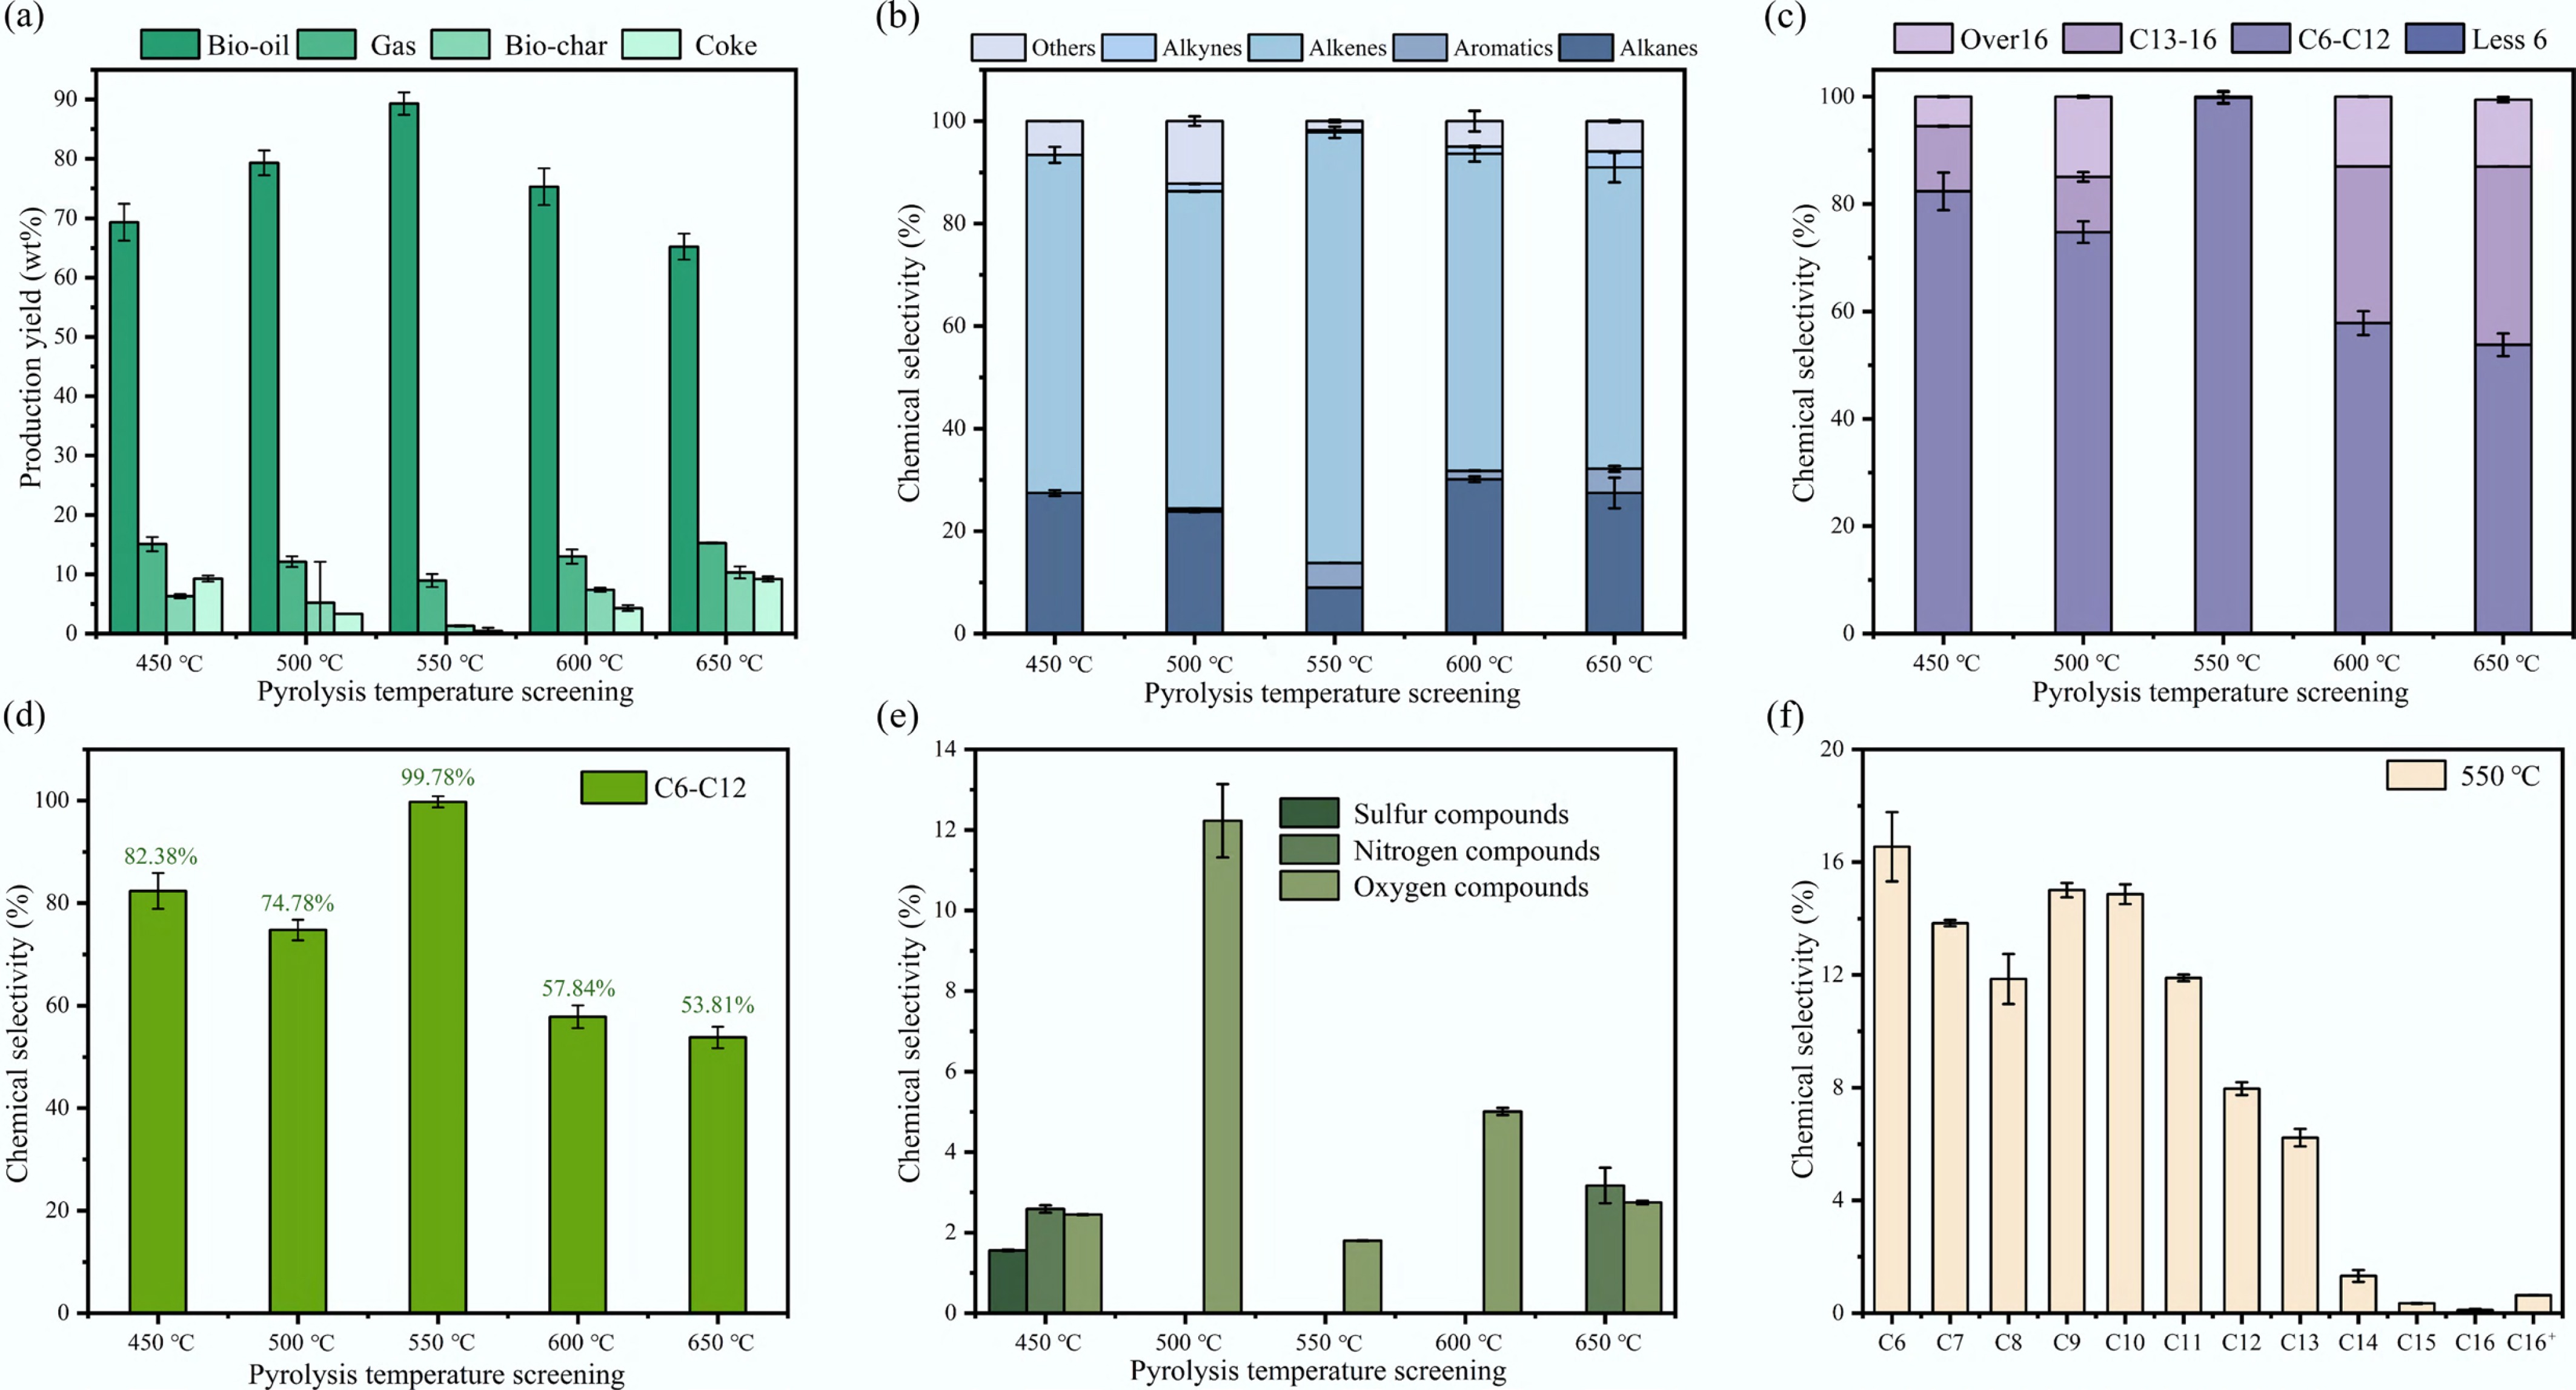
Figure 5.
Effect of pyrolysis temperature on the yield and composition of bio-oil products. (a) Pyrolysis products. (b) Bio-oil composition. (c) Distribution of carbon numbers in bio-oil. (d) Content of C6–C12 compounds in bio-oil. (e) Distribution of other substances in bio-oil. (f) Distribution of carbon numbers at optimal acidity.
-
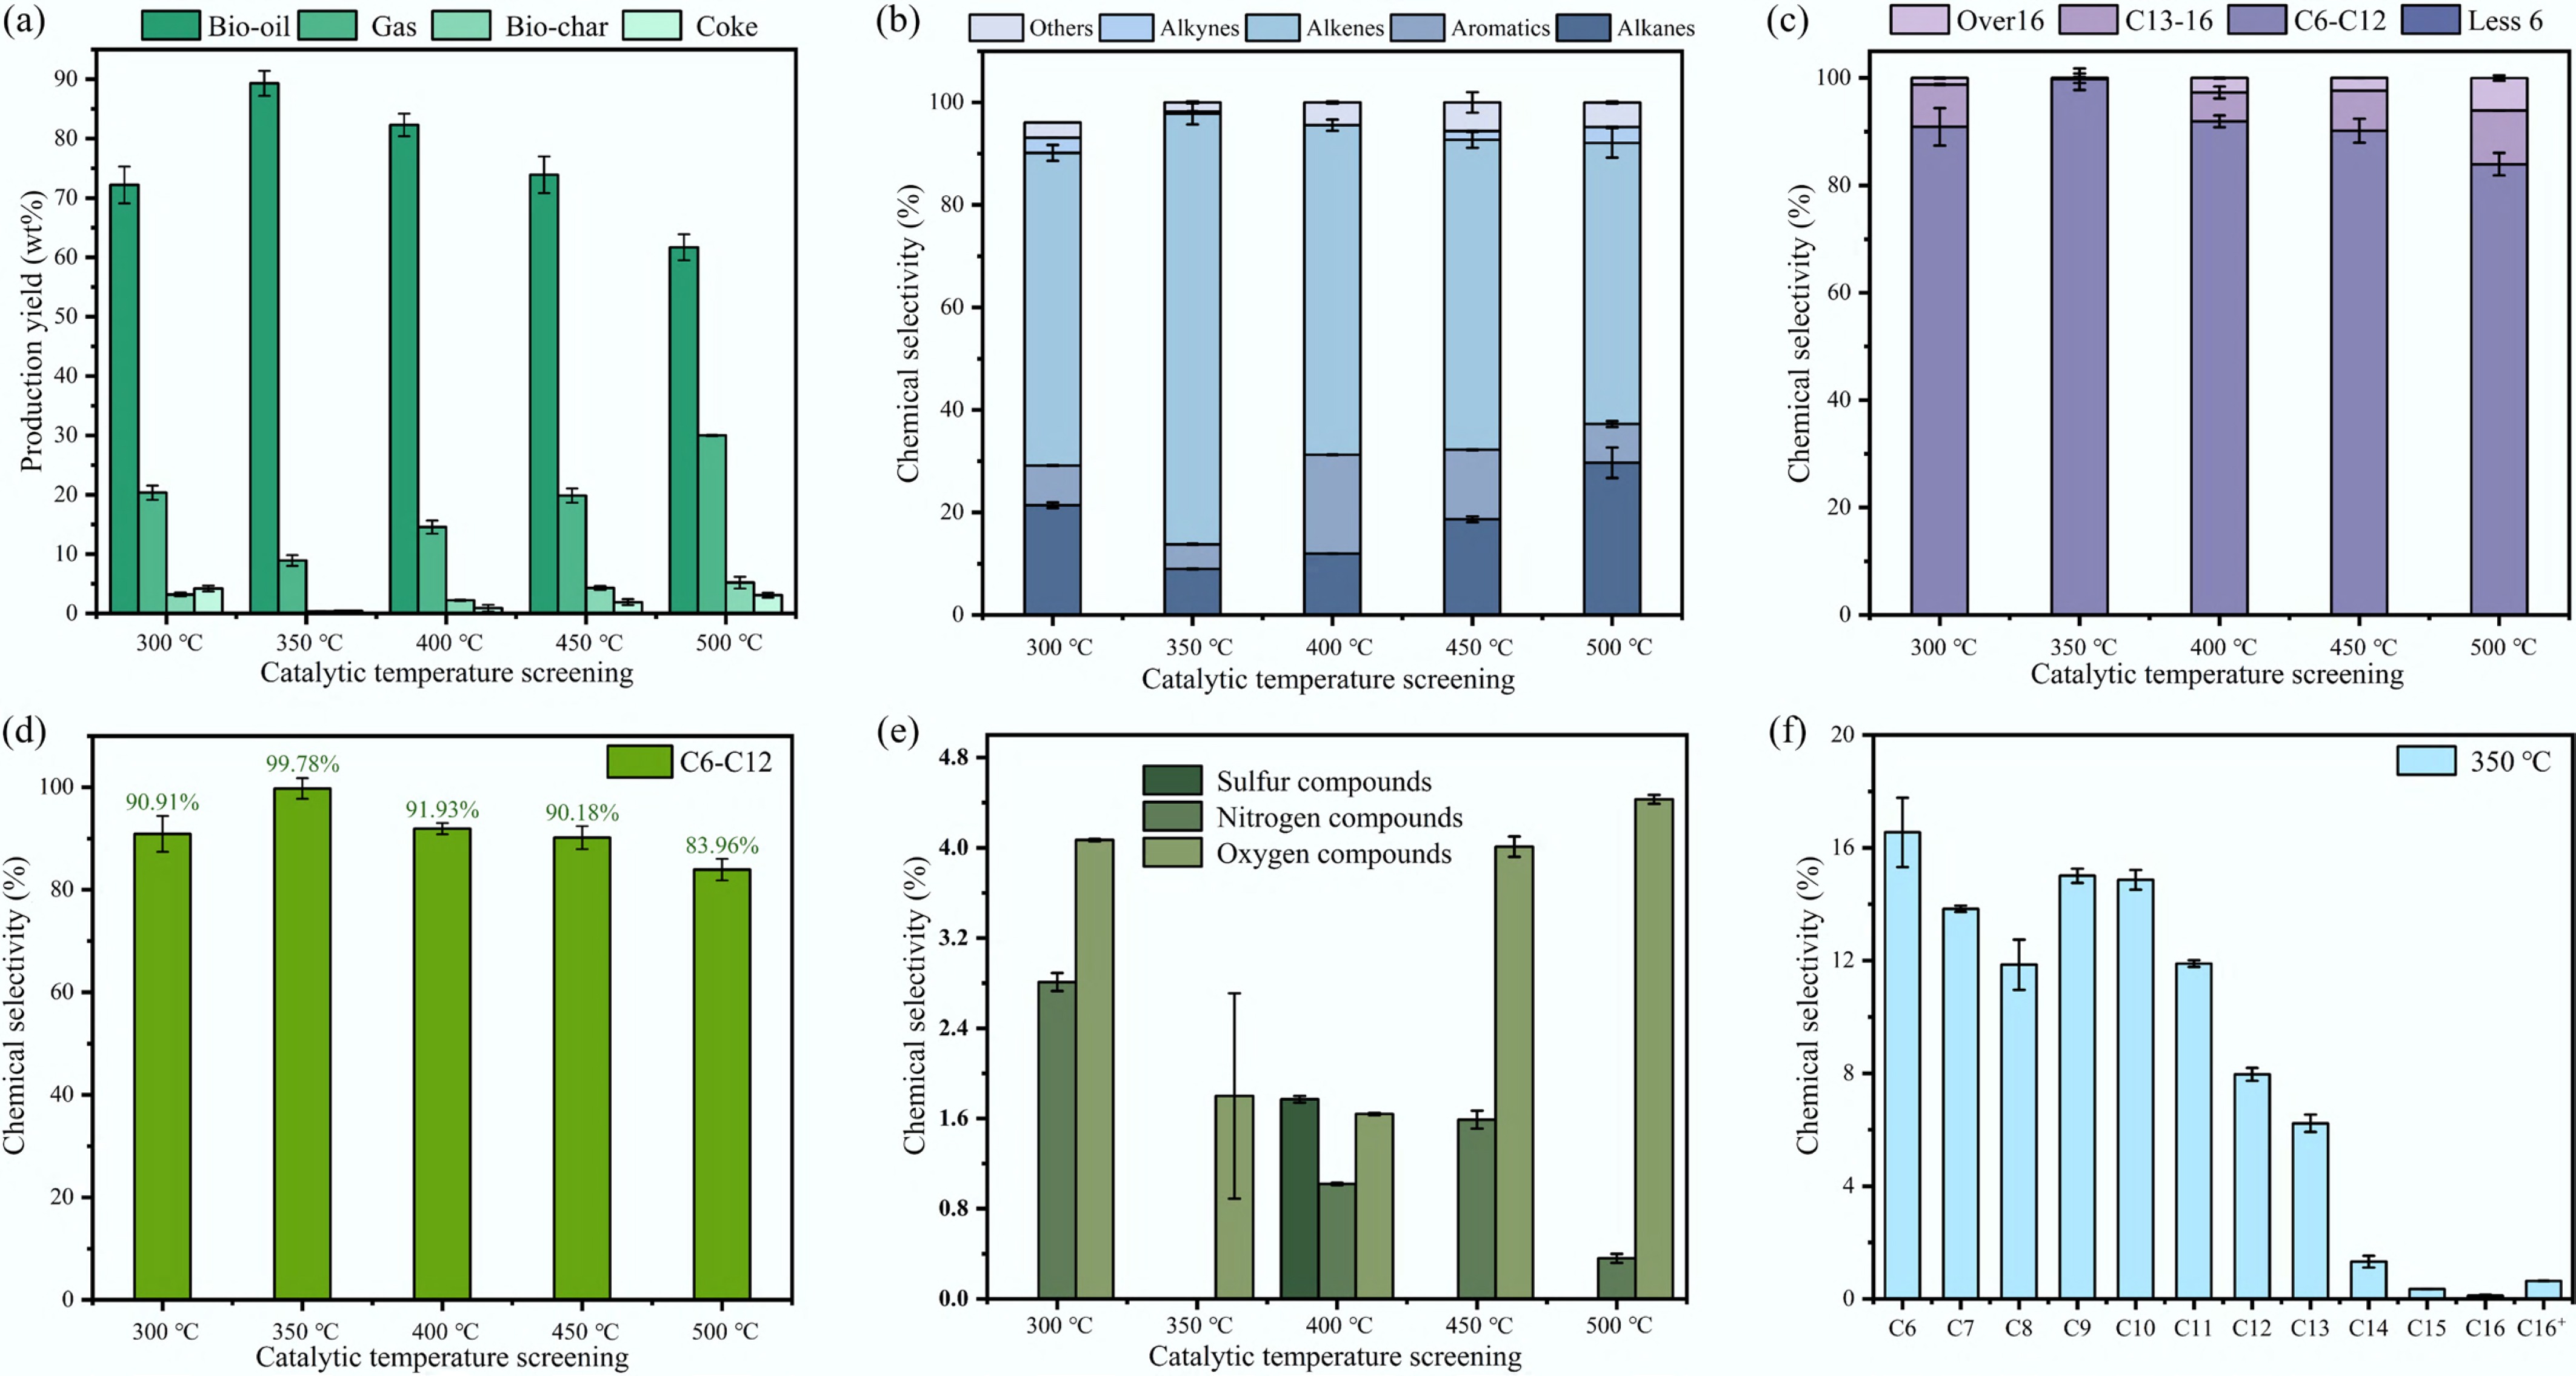
Figure 6.
Effect of catalytic temperature on the yields and composition of bio-oil products. (a) Pyrolysis products. (b) Bio-oil composition. (c) Distribution of carbon numbers in bio-oil. (d) Content of C6−C12 compounds in bio-oil. (e) Distribution of other substances in bio-oil. (f) Distribution of carbon numbers at optimal acidity.
-
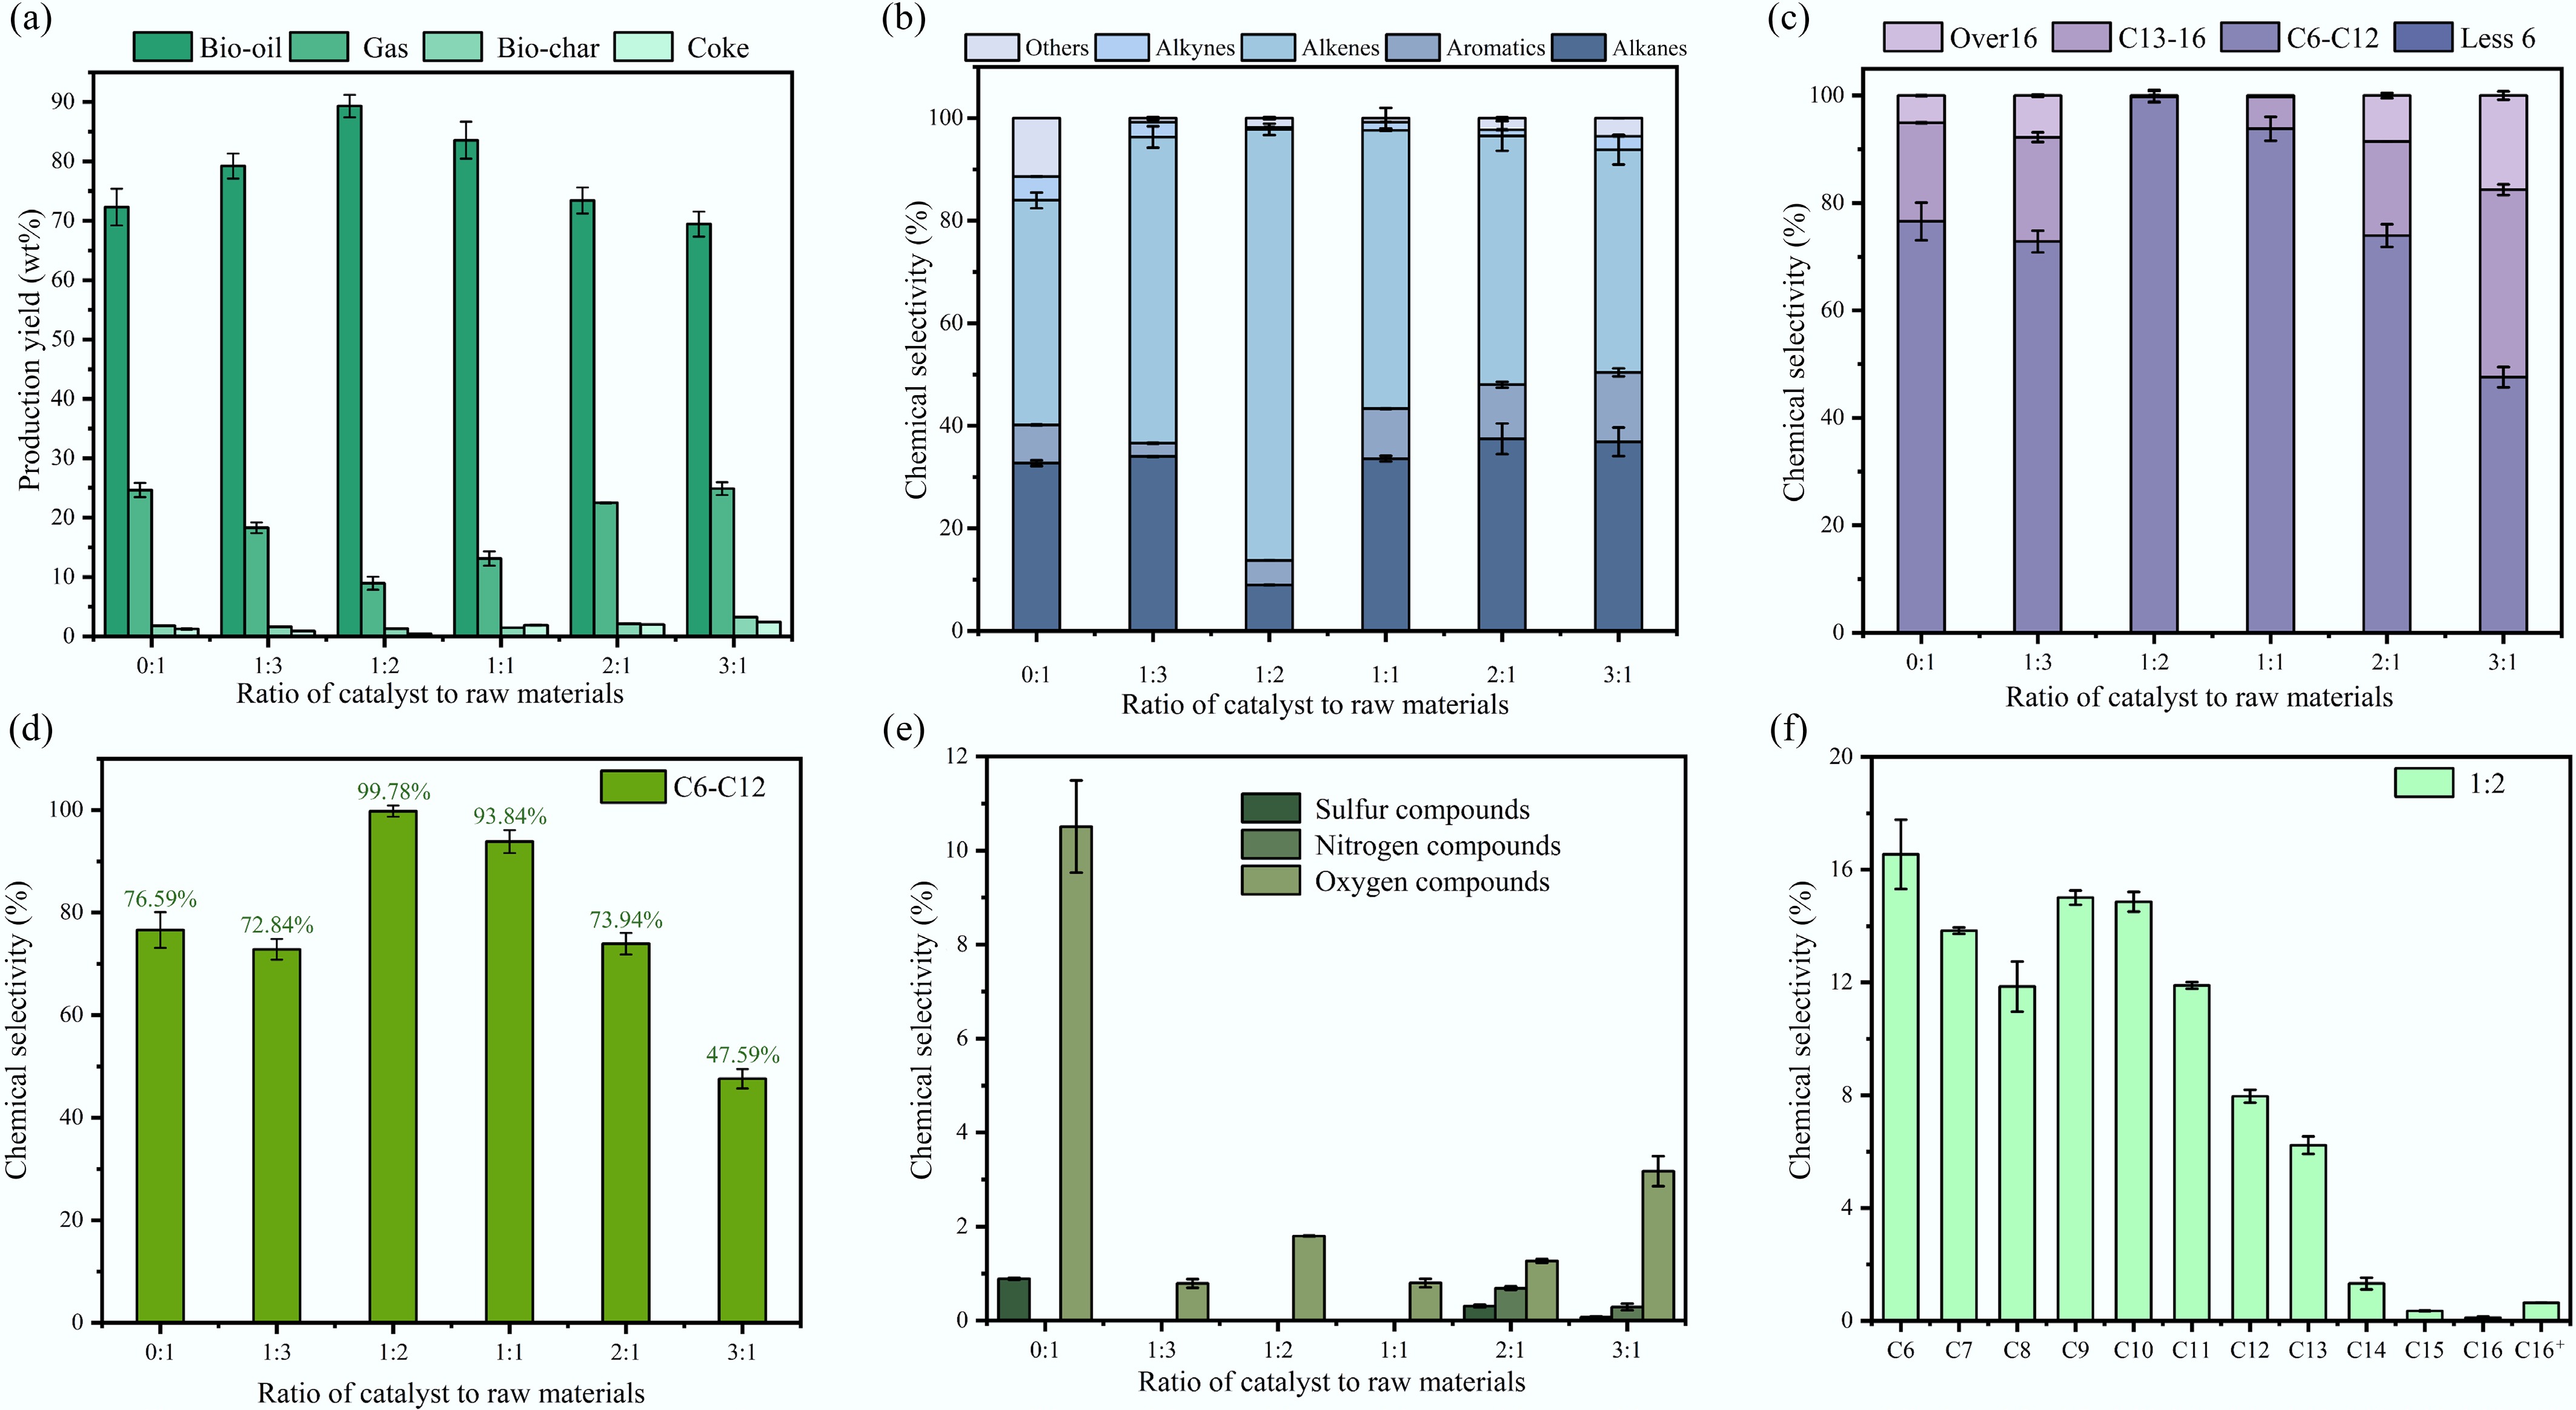
Figure 7.
Effect of catalyst-to-feedstock ratio on the yield and composition of bio-oil products. (a) Pyrolysis products. (b) Bio-oil composition. (c) Distribution of carbon numbers in bio-oil. (d) Content of C6−C12 compounds in bio-oil. (e) Distribution of other substances in bio-oil. (f) Distribution of carbon numbers at optimal acidity.
-
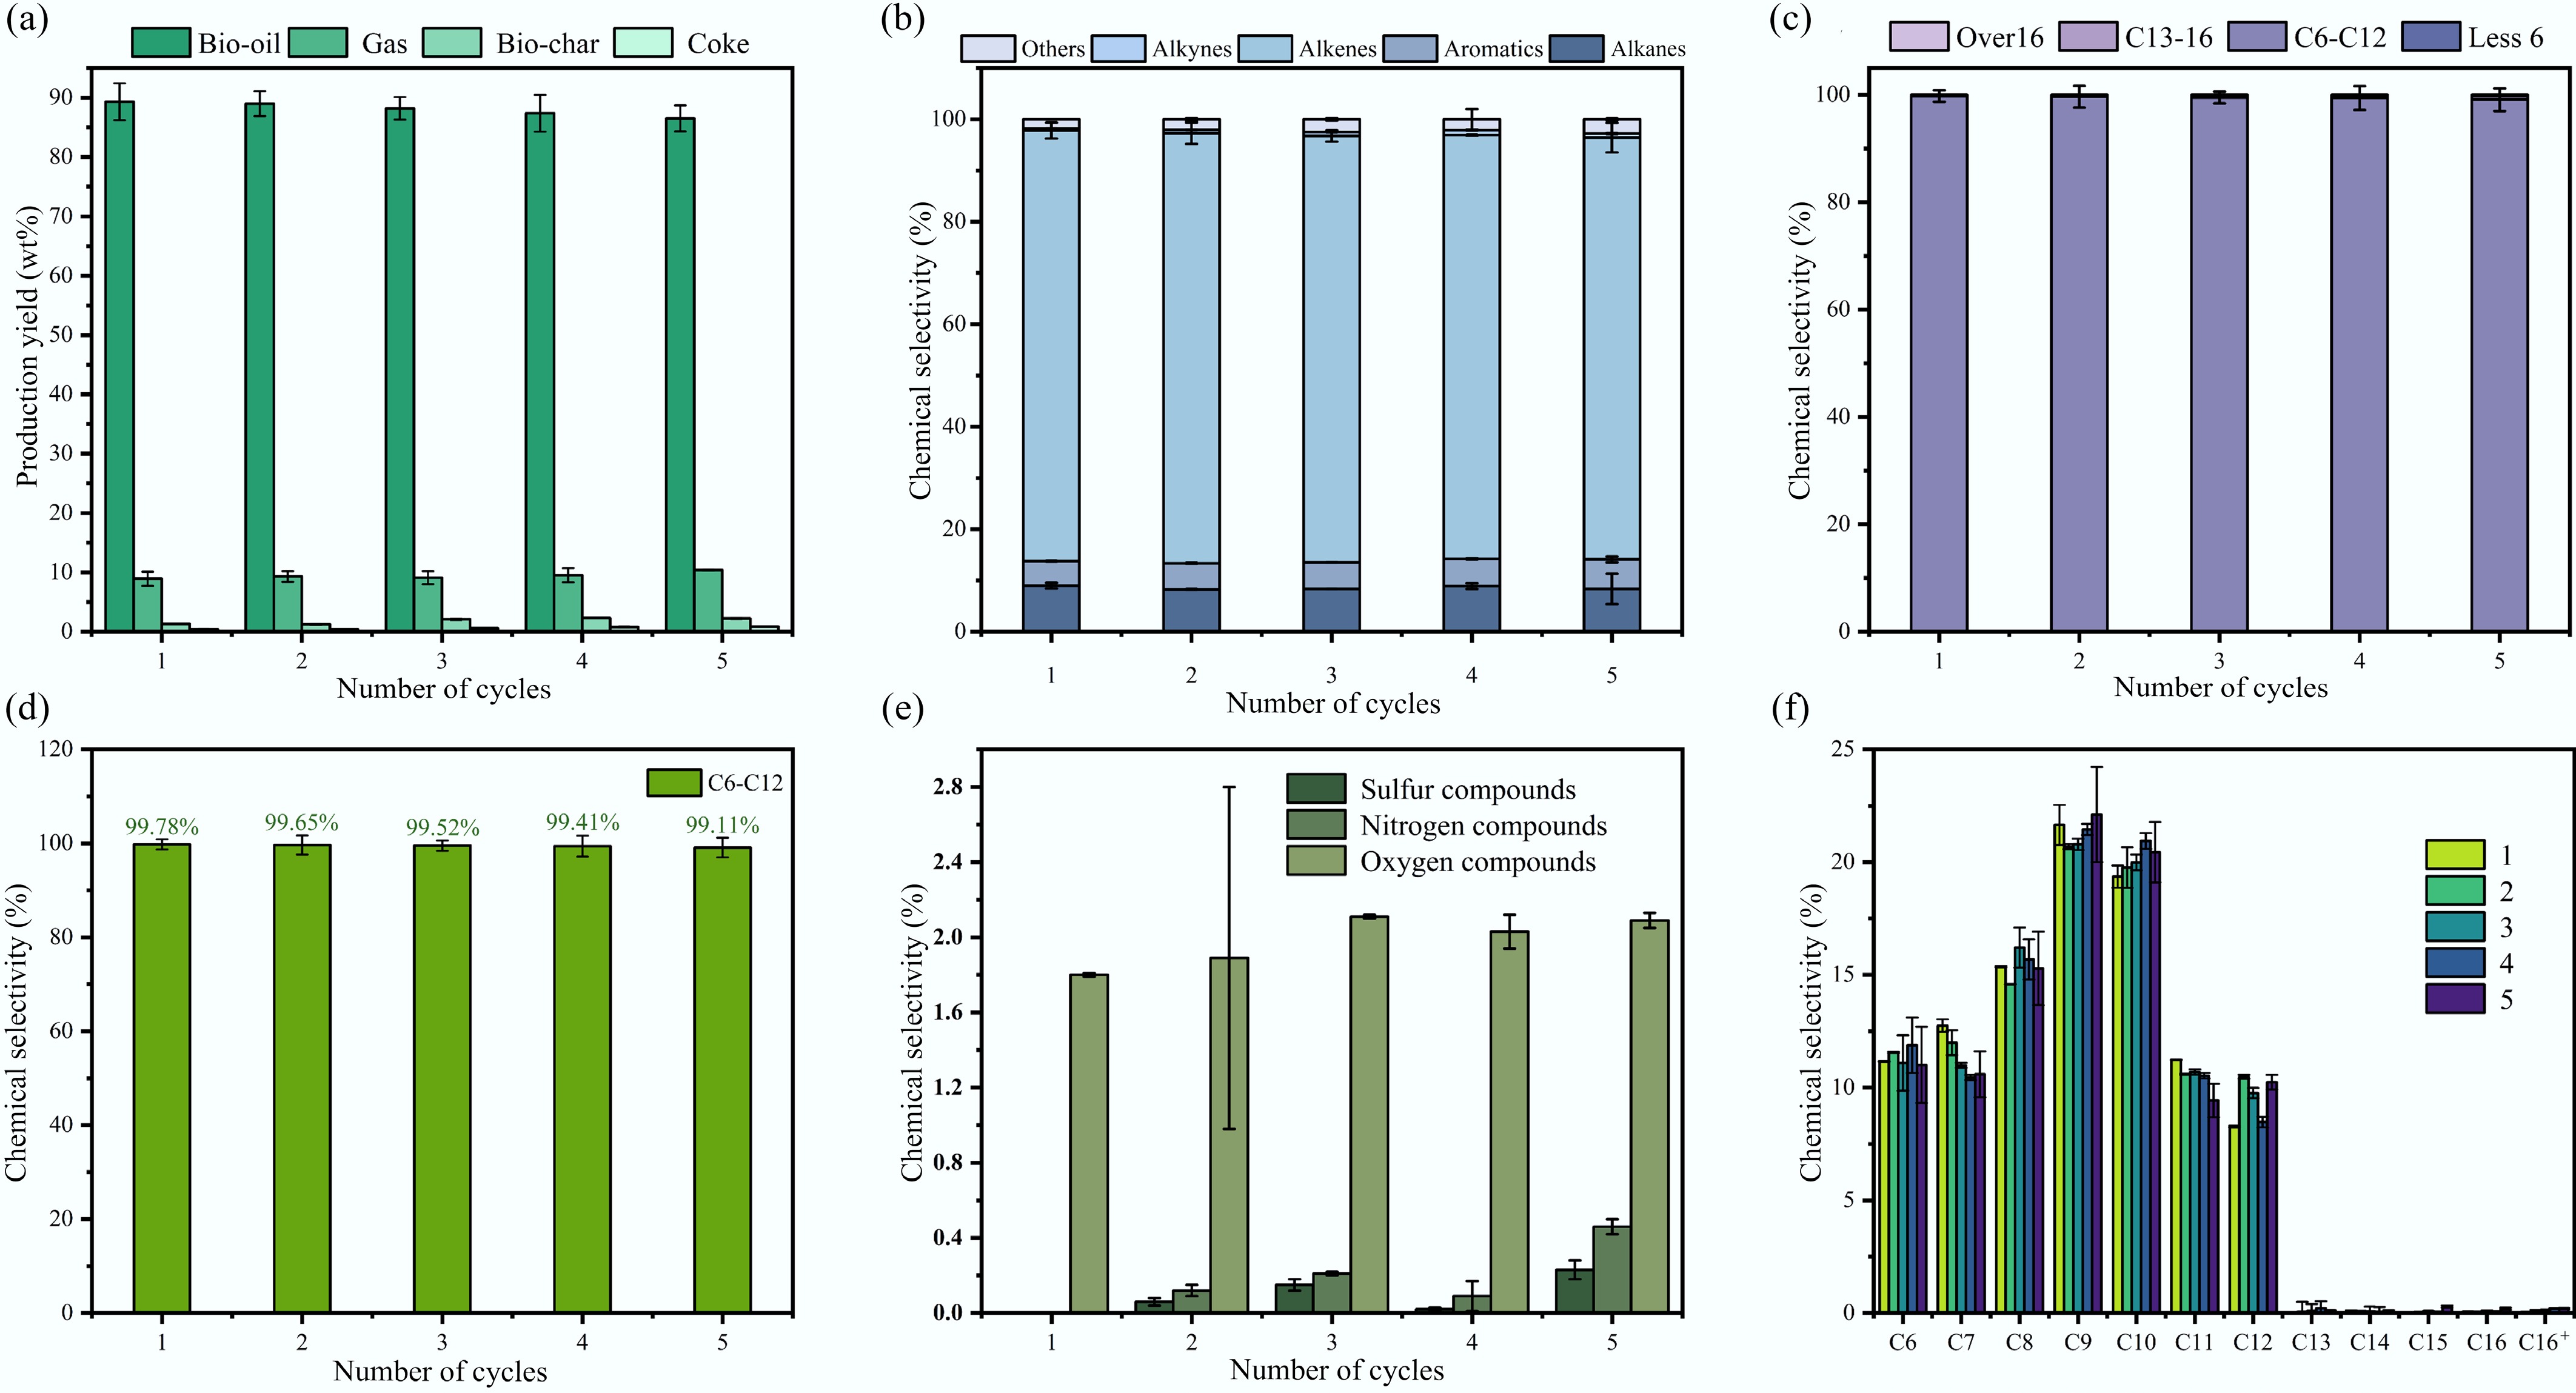
Figure 8.
Yield and composition of fifth-cycle bio-oil. (a) Pyrolysis products. (b) Bio-oil composition. (c) Distribution of carbon numbers in bio-oil. (d) Content of C6−C12 compounds in bio-oil. (e) Distribution of other substances in bio-oil. (f) Distribution of carbon numbers at optimal acidity.
-
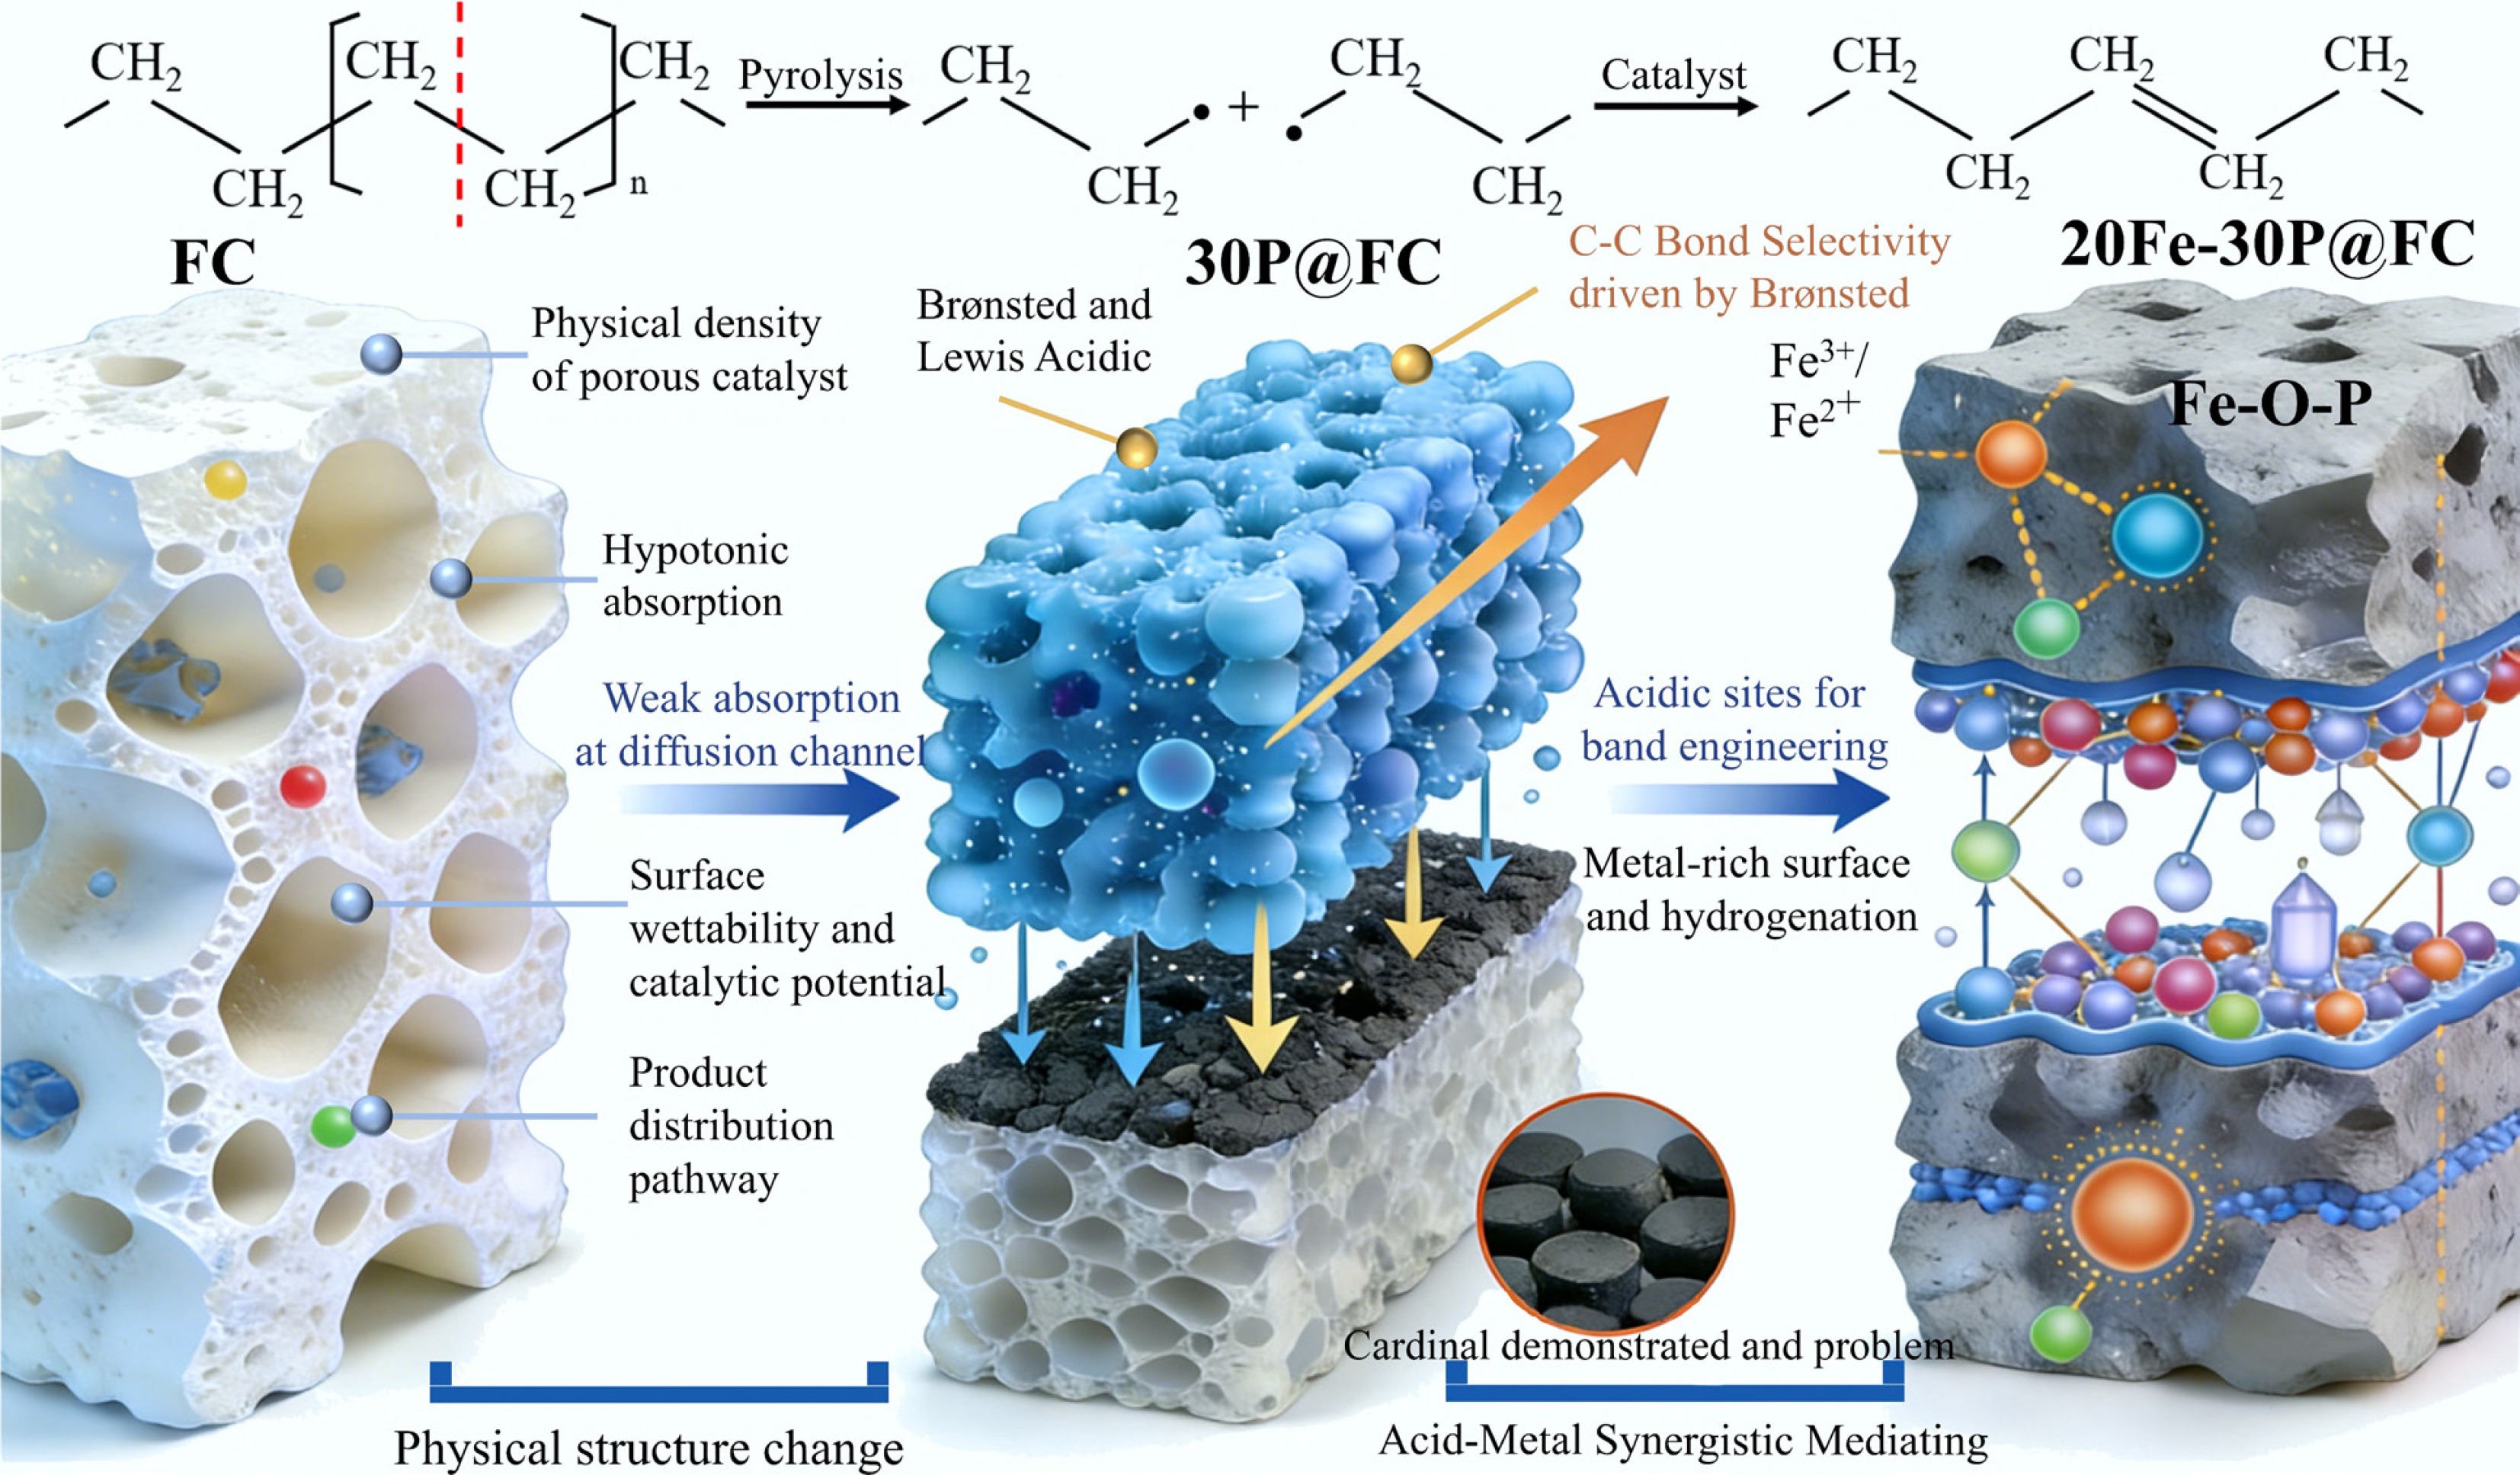
Figure 9.
Catalytic pyrolysis of ground film plastic mechanisms using fishbone-based catalysts.
-
Sample number FC 30P@FC 20Fe-30P@FC Fe metal content 0.007% 0.012% 17.251% P metal content 11.076% 13.309% 6.499% Ca metal content 24.232% 9.413% 4.800% BET specific area (m2 g−1) 88.733 3.291 0.982 Micropore volume (cm3 g−1) 22.698 0.182 0.212 Micropore area (cm3 g−1) 0.125459 0.000114 0.000071 Average size (nm) 11.283 18.353 34.564 Hole size (nm) 1.165 12.892 0.827 Table 1.
Structural properties of catalysts
Figures
(9)
Tables
(1)