-
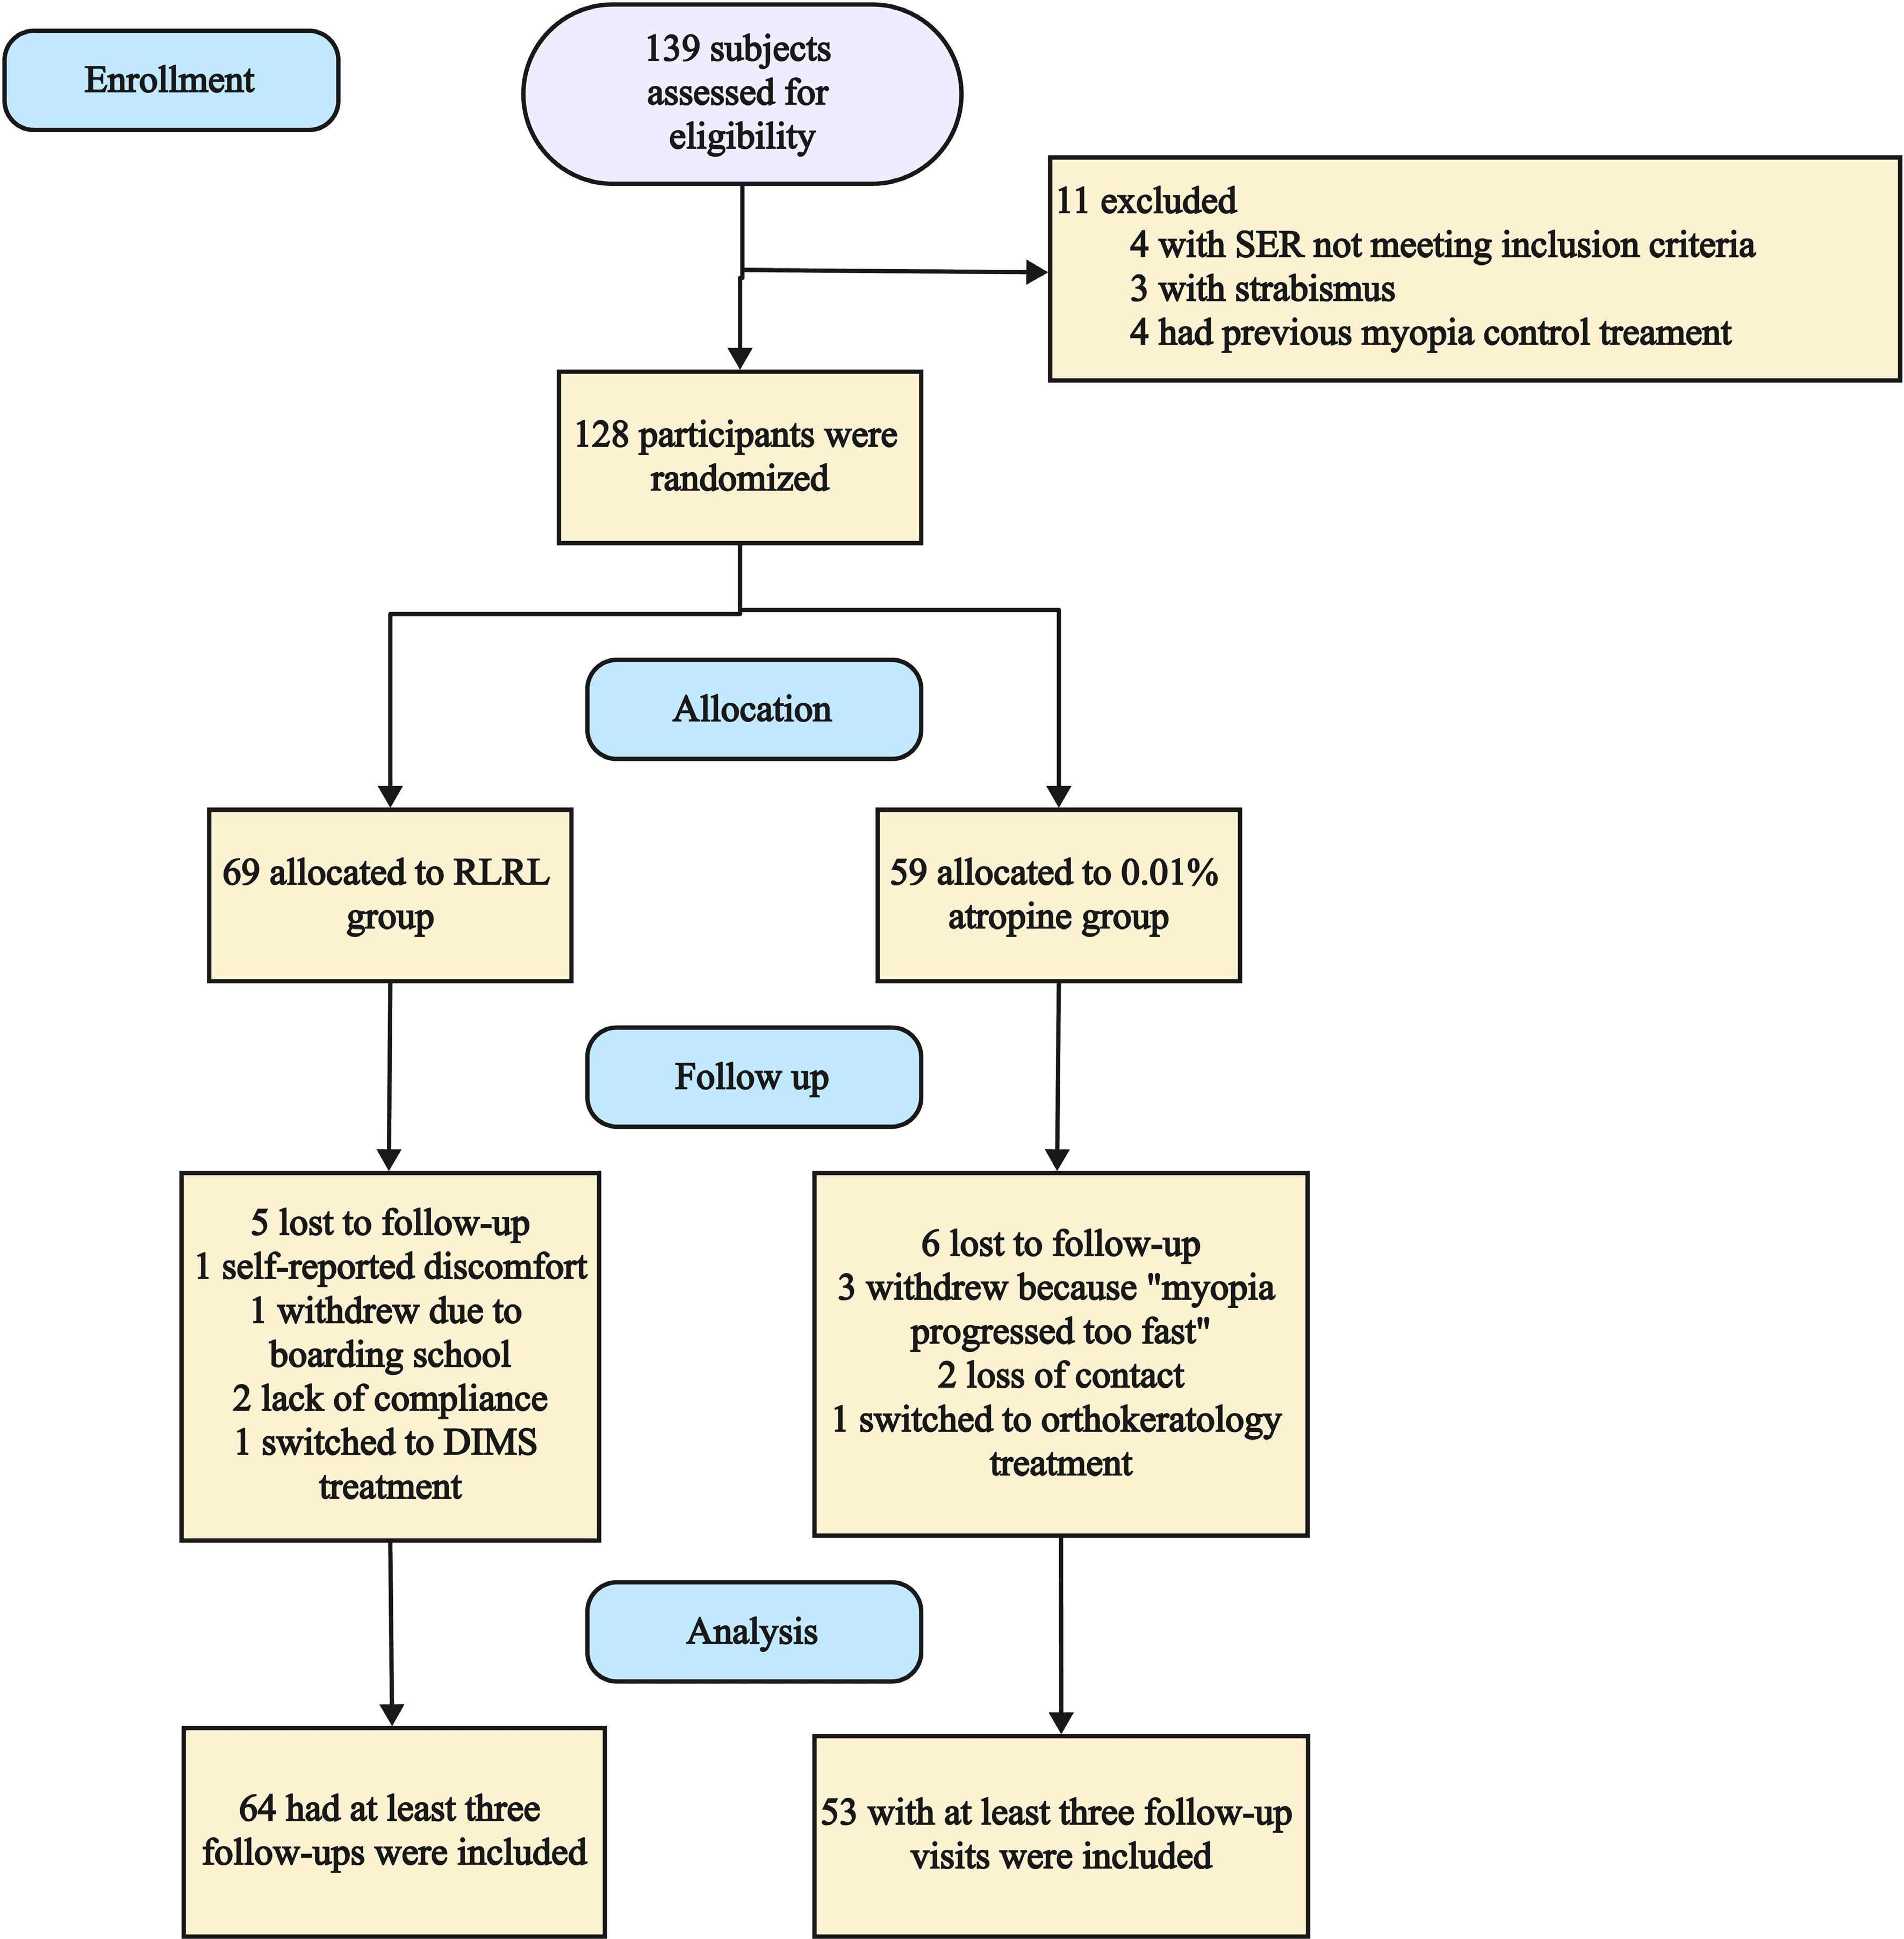
Figure 1.
Study design and flow diagram of the randomized, controlled clinical trial. SER = spherical equivalent refraction; RLRL = repeated low-level red-light; DIMS = defocus-incorporated multiple segments.
-
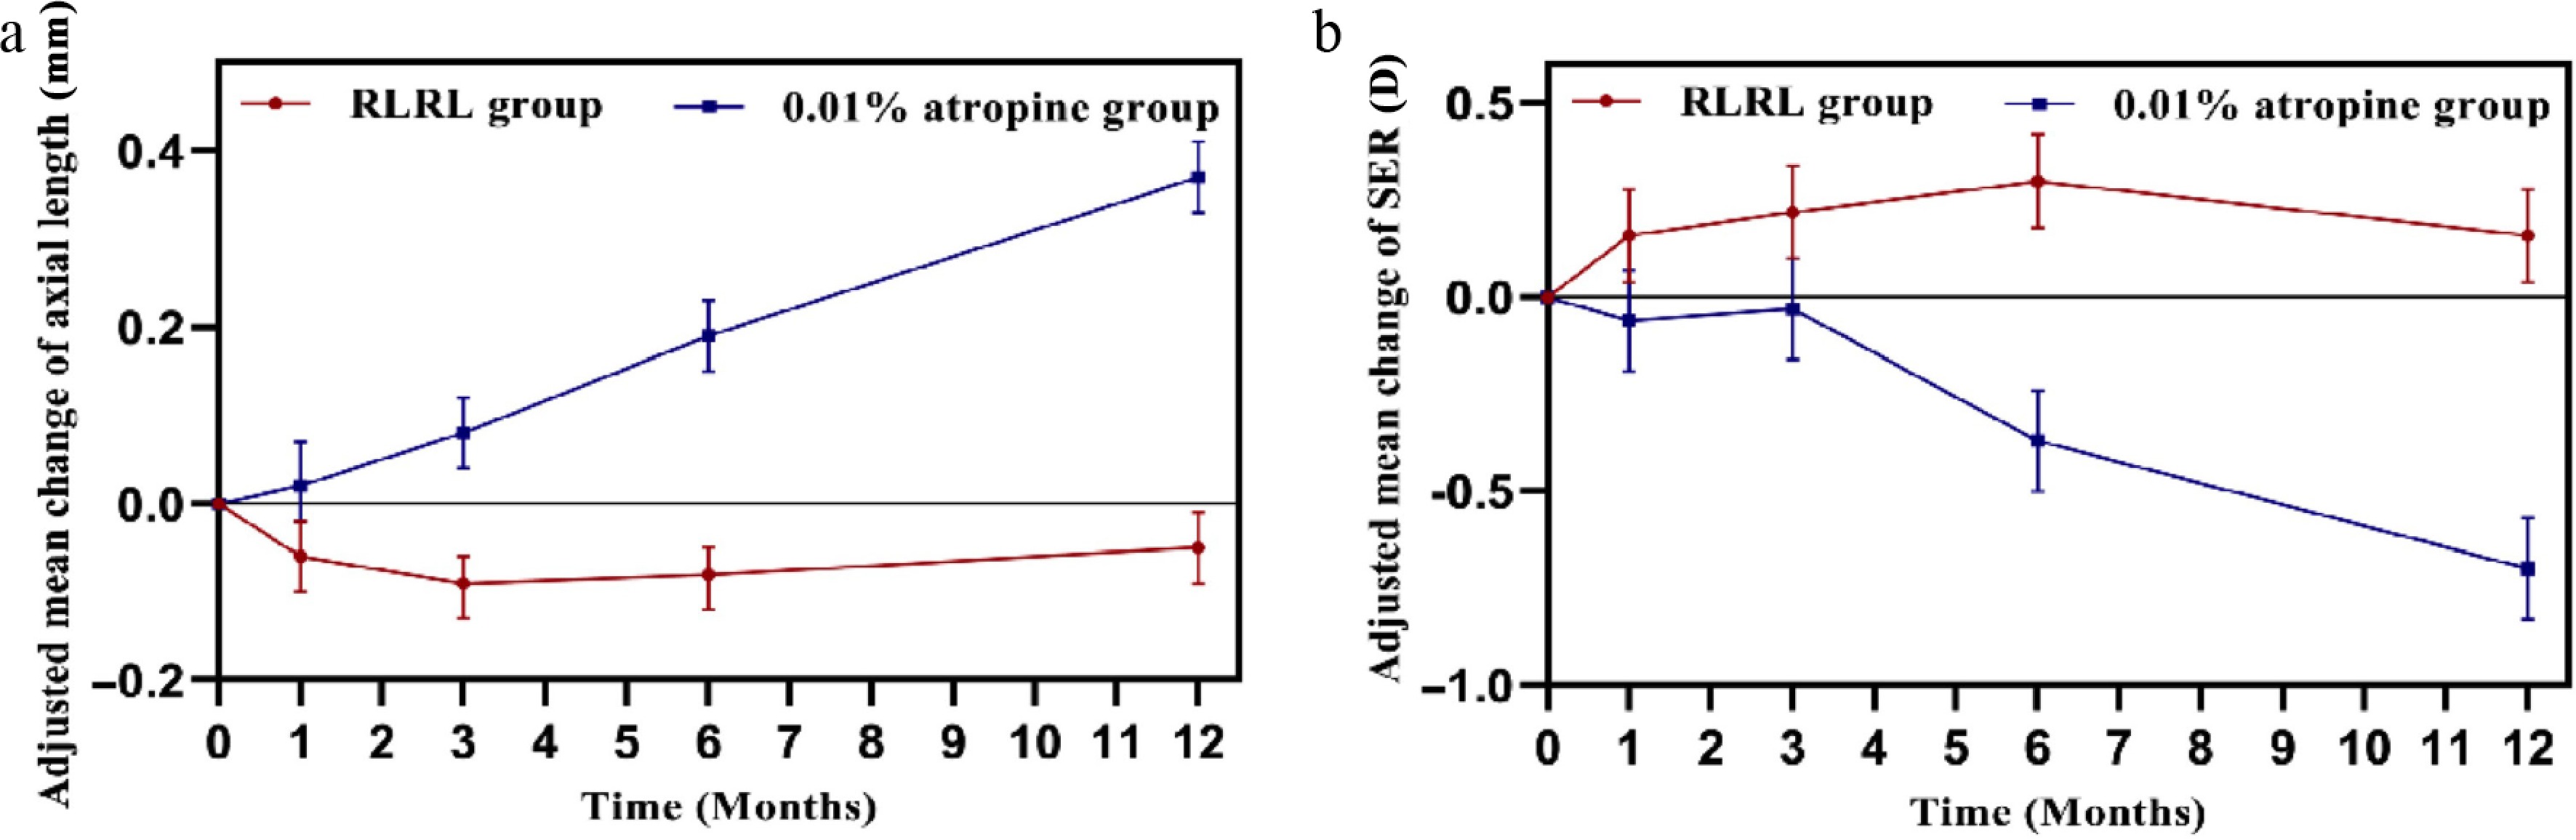
Figure 2.
Line graphs showing the adjusted mean changes in (a) axial length (after adjusting for age, sex, time, treatment group, visit*group, and baseline AL) and (b) cycloplegic spherical equivalent refractions (SERs) (after adjusting for age, sex, time, treatment group, visit*group, and baseline SER) from baseline to 12 months at each time point between the RLRL group and the 0.01% atropine group. Error bars represent standard error. Sample sizes at each time point were n = 64 for the RLRL group and n = 53 for the 0.01% atropine group. D = diopter.
-
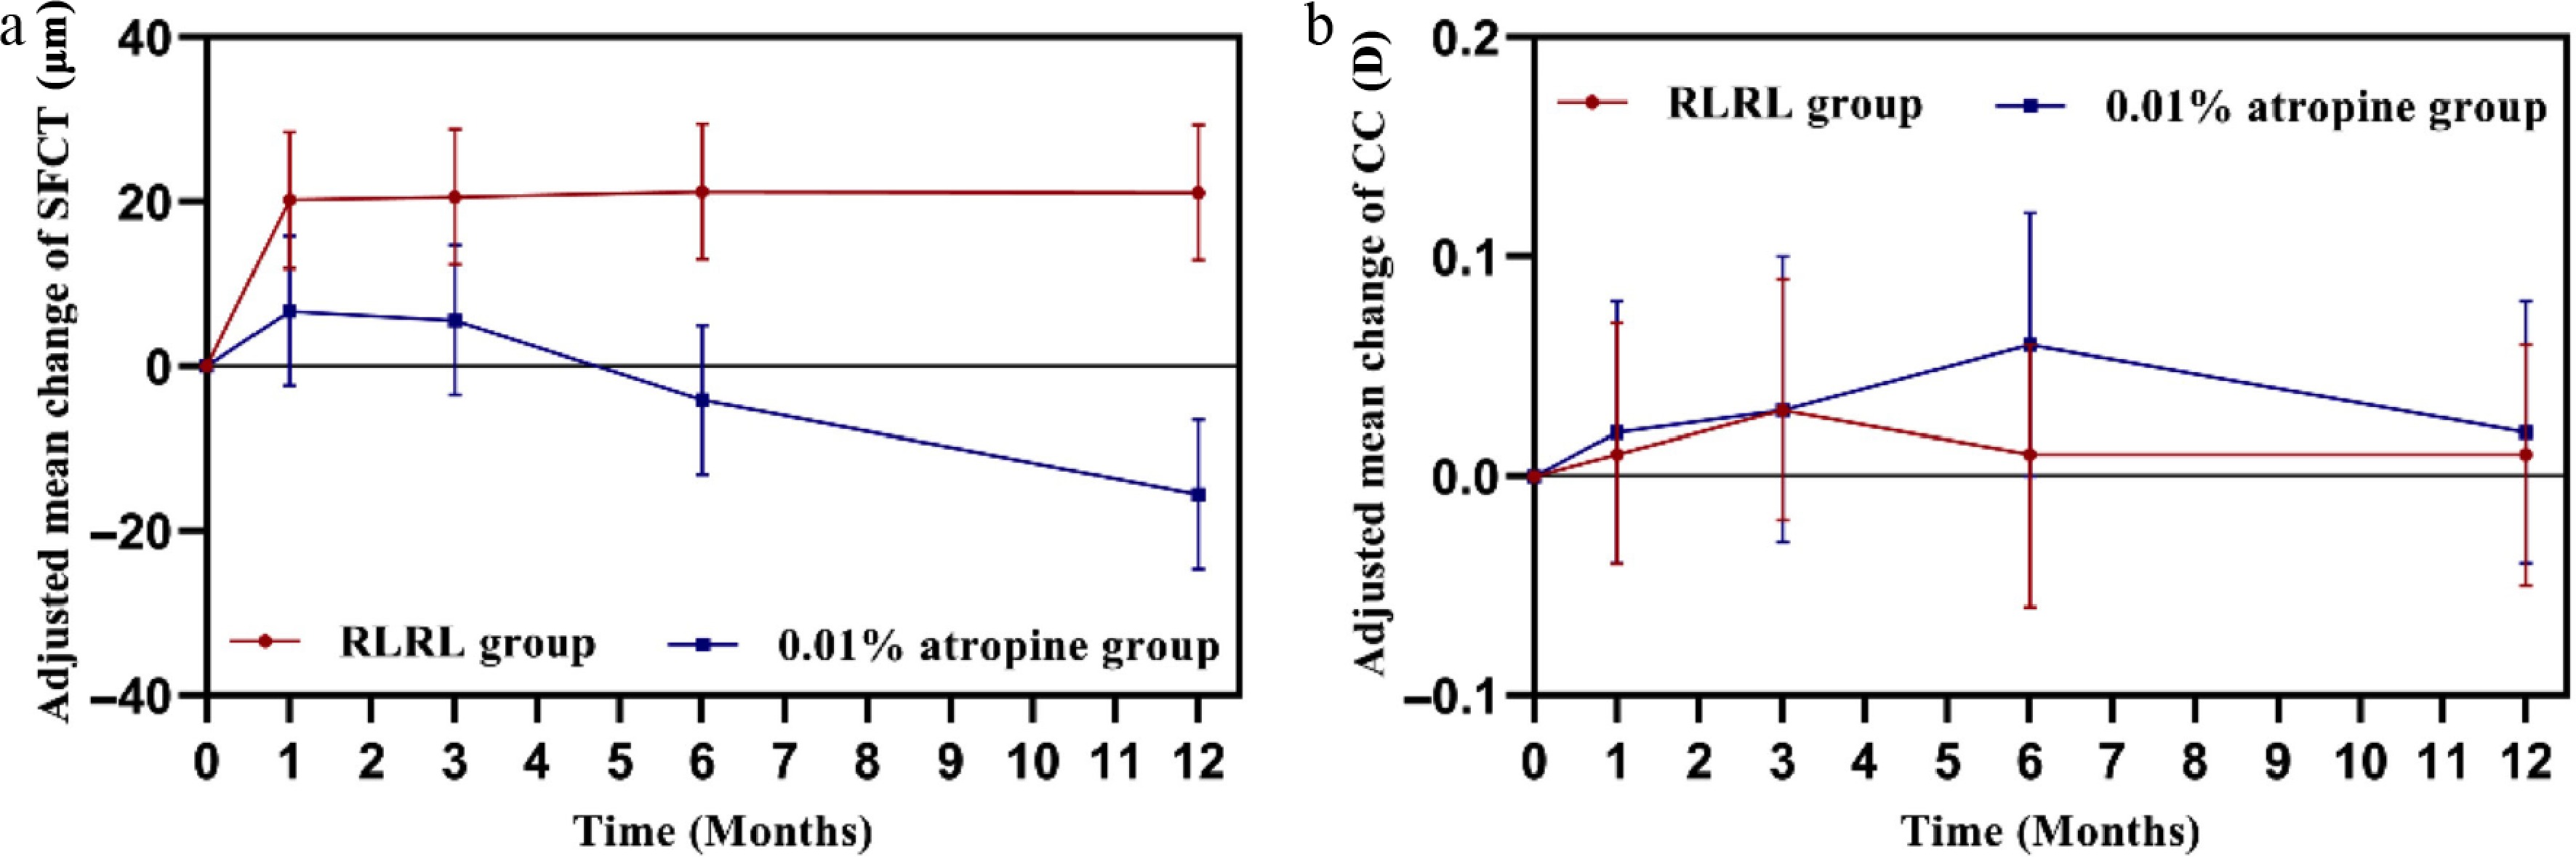
Figure 3.
Line graphs showing the adjusted mean changes in (a) subfoveal choroidal thickness (SFChT) (after adjusting for age, sex, time, treatment group, visit*group, and baseline SFChT). (b) Corneal curvature (CC) (after adjusting for age, sex, time, treatment group, visit*group, and baseline CC) from baseline to 12 months at each time point between the RLRL group and the 0.01% atropine group. Error bars represent standard error. Sample sizes at each time point were n = 64 for the RLRL group and n = 53 for the 0.01% atropine group.
-
Characteristics RLRL group (650 nm) (n = 64) Low-concentration atropine group (0.01%) (n = 53) p-Value Age (y), median (IQR) 9.00 (8.00, 10.00) 9.00 (8.00, 10.00) 0.98 Female, no (%) 32 (50.0) 26 (49.1) 0.99 SER (D), median (IQR) −2.25 (−3.03, −1.38) −2.00 (−2.75, −1.50) 0.81 AL (mm), median (IQR) 24.56 (23.78, 24.97) 24.15 (23.72, 24.66) 0.18 IOP (mmHg), mean ± SD 16.93 ± 2.65 17.21 ± 2.97 0.59 SFChT (μm), mean ± SD 244.84 ± 54.04 253.96 ± 52.98 0.36 UCVA (logMAR), median (IQR) 0.25 (0.15, 0.40) 0.25 (0.15, 0.30) 0.79 AA(D), mean ± SD 15.23 ± 3.76 15.92 ± 3.25 0.49 BMI (kg/m2), mean ± SD 18.15 ± 2.33 17.36 ± 2.47 0.24 Categorical variables are described by the number of subjects (percentage). Continuous variables with a normal distribution are described by mean ± SD. Continuous variables without a normal distribution are described by median (IQR). p-Values were calculated on the basis of unpaired t-tests for continuous data and chi-square tests for categorical data. AL = axial length; D = diopter; IOP = intraocular pressure; logMAR = logarithm of the minimum angle of resolution; SER = spherical equivalent refraction; UCVA = uncorrected visual acuity; AA = accommodation amplitude; BMI = body mass index; SFChT = subfoveal choroidal thickness. Table 1.
Demographics and baseline ocular characteristics between the RLRL group (650 nm) and the low-concentration atropine group (0.01%).
-
Time/visit Cumulative adjusted mean (95% CI) Mean difference (95% CI) p-Value RLRL group 0.01% atropine group Number of subjects 64 53 Change of AL (mm) 1 month −0.06 (−0.10 to −0.02) 0.02 (−0.02 to 0.07) −0.09 (−0.14 to −0.03) < 0.01 3 months −0.09 (−0.13 to −0.06) 0.08 (0.04 to 0.12) −0.18 (−0.23 to −0.12) < 0.01 6 months −0.08 (−0.12 to −0.05) 0.19 (0.15 to 0.23) −0.27 (−0.33 to −0.22) < 0.01 12 months −0.05 (−0.09 to −0.01) 0.37 (0.33 to 0.41) −0.42 (−0.47 to −0.36) <0.01 Change in SER (D) 1 month 0.16 (0.04 to 0.28) −0.06 (−0.19 to 0.07) 0.22 (0.04 to 0.40) 0.02 3 months 0.22 (0.10 to 0.34) −0.03 (−0.16 to 0.10) 0.24 (0.06 to 0.42) 0.01 6 months 0.30 (0.18 to 0.42) −0.37 (−0.50 to −0.24) 0.67 (0.49 to 0.85) < 0.01 12 months 0.16 (0.04 to 0.28) −0.70 (−0.83 to −0.57) 0.86 (0.68 to 1.04) < 0.01 Mean difference = change of variable in the 0.01% atropine group − change of variable in the RLRL group; AL = axial length; D = diopter; SER = spherical equivalent refraction; CI = confidence interval. Two-tailed t-tests were applied to the estimated mean differences at each time point, with degrees of freedom estimated by the Kenward–Roger method and two-tailed p-values computed from the t-distribution. Table 2.
Cumulative adjusted mean changes in axial length and cycloplegic spherical equivalent refraction from baseline to 12 months at each timepoint between RLRL group and 0.01% atropine group.
-
Factors Coefficient (95% CI) p-Value Primary outcome Change in AL, mm Age, year −0.024 (−0.038 to −0.010) 0.002 Gender (M/F) 0.013 (−0.030 to 0.056) 0.566 Baseline AL, mm −0.024 (−0.050 to 0.002) 0.776 Group (RLRL/0.01% atropine) −0.034 (−0.096 to 0.027) 0.274 Time (visits) −0.105 (−0.132 to −0.077) < 0.001 Interaction of group and time 0.109 (0.091 to 0.127) < 0.001 Secondary outcome Change in SER, D Age, year 0.049 (0.008 to 0.091) 0.023 Gender (M/F) −0.039 (−0.163 to 0.085) 0.546 Baseline SER, D −0.072 (−0.127 to −0.018) 0.012 Group (RLRL/0.01% atropine) 0.092 (−0.115 to 0.299) 0.389 Time (visits) 0.245 (0.143 to 0.348) < 0.001 Interaction of group and time −0.236 (−0.303 to −0.169) < 0.001 CI = confidence interval, AL = axial length; D = diopter; SER = spherical equivalent refraction. Adjusted estimates at each time point were calculated on the basis of longitudinal mixed models, adjusted for baseline age, gender, group, group × visit, and the corresponding baseline parameter as fixed factors, and subjects as the random factor. Multiple comparisons with sequential Bonferroni adjustment were performed. Table 3.
Mixed-model analysis of factors and effects on changes of axial length and cycloplegic spherical equivalent refraction.
-
Time/visit Cumulative adjusted mean (95% CI) Mean difference (95% CI) p-Value RLRL group 0.01% atropine group Number of patients analyzed 64 53 Change in subfoveal choroidal thickness (μm) 1 month 20.20 (11.93 to 28.47) 6.73 (−2.36 to 15.82) 13.5 (1.17 to 25.8) 0.032 3 months 20.54 (12.27 to 28.81) 5.59 (−3.50 to 14.68) 14.9 (2.64 to 27.3) 0.018 6 months 21.26 (12.99 to 29.53) −4.11 (−13.20 to 4.98) 25.4 (13.06 to 37.7) < 0.001 12 months 21.09 (12.82 to 29.36) −15.60 (−24.69 to −6.51) 36.7 (24.39 to 49.0) < 0.001 Change in CC (D) 1 month 0.01 (−0.04 to 0.07) 0.02 (−0.04 to 0.08) −0.01 (−0.09 to 0.07) 0.832 3 months 0.03 (−0.02 to 0.09) 0.03 (−0.03 to 0.10) −0.003 (−0.086 to 0.080) 0.944 6 months 0.01 (−0.06 to 0.06) 0.06 (−0.00 to 0.12) −0.054 (−0.137 to 0.029) 0.198 12 months 0.01 (−0.05 to 0.06) 0.02 (−0.04 to 0.08) −0.012 (−0.096 to 0.070) 0.759 CI = confidence interval, D = diopter; CC = corneal curvature. Two-tailed t-tests were applied to estimate the mean differences at each time point, with degrees of freedom estimated by the Kenward–Roger method and two-tailed p-values computed from the t-distribution. Table 4.
Cumulative adjusted mean changes in subfoveal choroidal thickness and corneal curvature from baseline to 12 months at each timepoint between the RLRL group and the 0.01% atropine group.
-
RLRL group (n = 30) 0.01% atropine group (n = 23) Mean difference (95% CI) p-Value Near VA Change at 1 month −0.016 (−0.038 to −0.005) 0.004 (−0.021 to 0.029) −0.020 (−0.054 to 0.013) 0.236 Change at 3 months −0.023 (−0.045 to −0.001) −0.022 (−0.047 to −0.003) −0.001 (−0.034 to 0.033) 0.968 Change at 6 months −0.030 (−0.051 to −0.008) −0.035 (−0.060 to −0.010) 0.006 (−0.028 to 0.039) 0.736 Change at 12 months −0.026 (−0.048 to −0.005) −0.009 (−0.034 to 0.016) −0.017 (−0.050 to 0.016) 0.314 Accommodation amplitude, D Change at 1 month 1.185 (0.037 to 2.334) −1.321 (−2.634 to −0.008) 2.506 (0.751 to 4.260) 0.005 Change at 3 months −0.266 (−1.413 to 0.882) −0.888 (−2.201 to 0.425) 0.622 (−1.133 to 2.380) 0.483 Change at 6 months −0.646 (−1.794 to 0.502) −0.854 (−2.167 to 0.459) 0.208 (−1.547 to 1.960) 0.814 Change at 12 months −1.868 (−3.017 to −0.720) −1.621 (−2.934 to −0.308) −0.247 (−2.002 to 1.510) 0.781 VA = visual acuity; RLRL = repeated low-level red-light; CI = confidence interval. Two-tailed t-tests were applied to estimate the mean differences at each time point, with degrees of freedom estimated by the Kenward–Roger method and two-tailed p-values computed from the t-distribution. Table 5.
Cumulative adjusted mean changes in near VA (logMAR) and accommodation amplitude from baseline to 12 months at each timepoint in the RLRL group and the 0.01% atropine group.
Figures
(3)
Tables
(5)