-
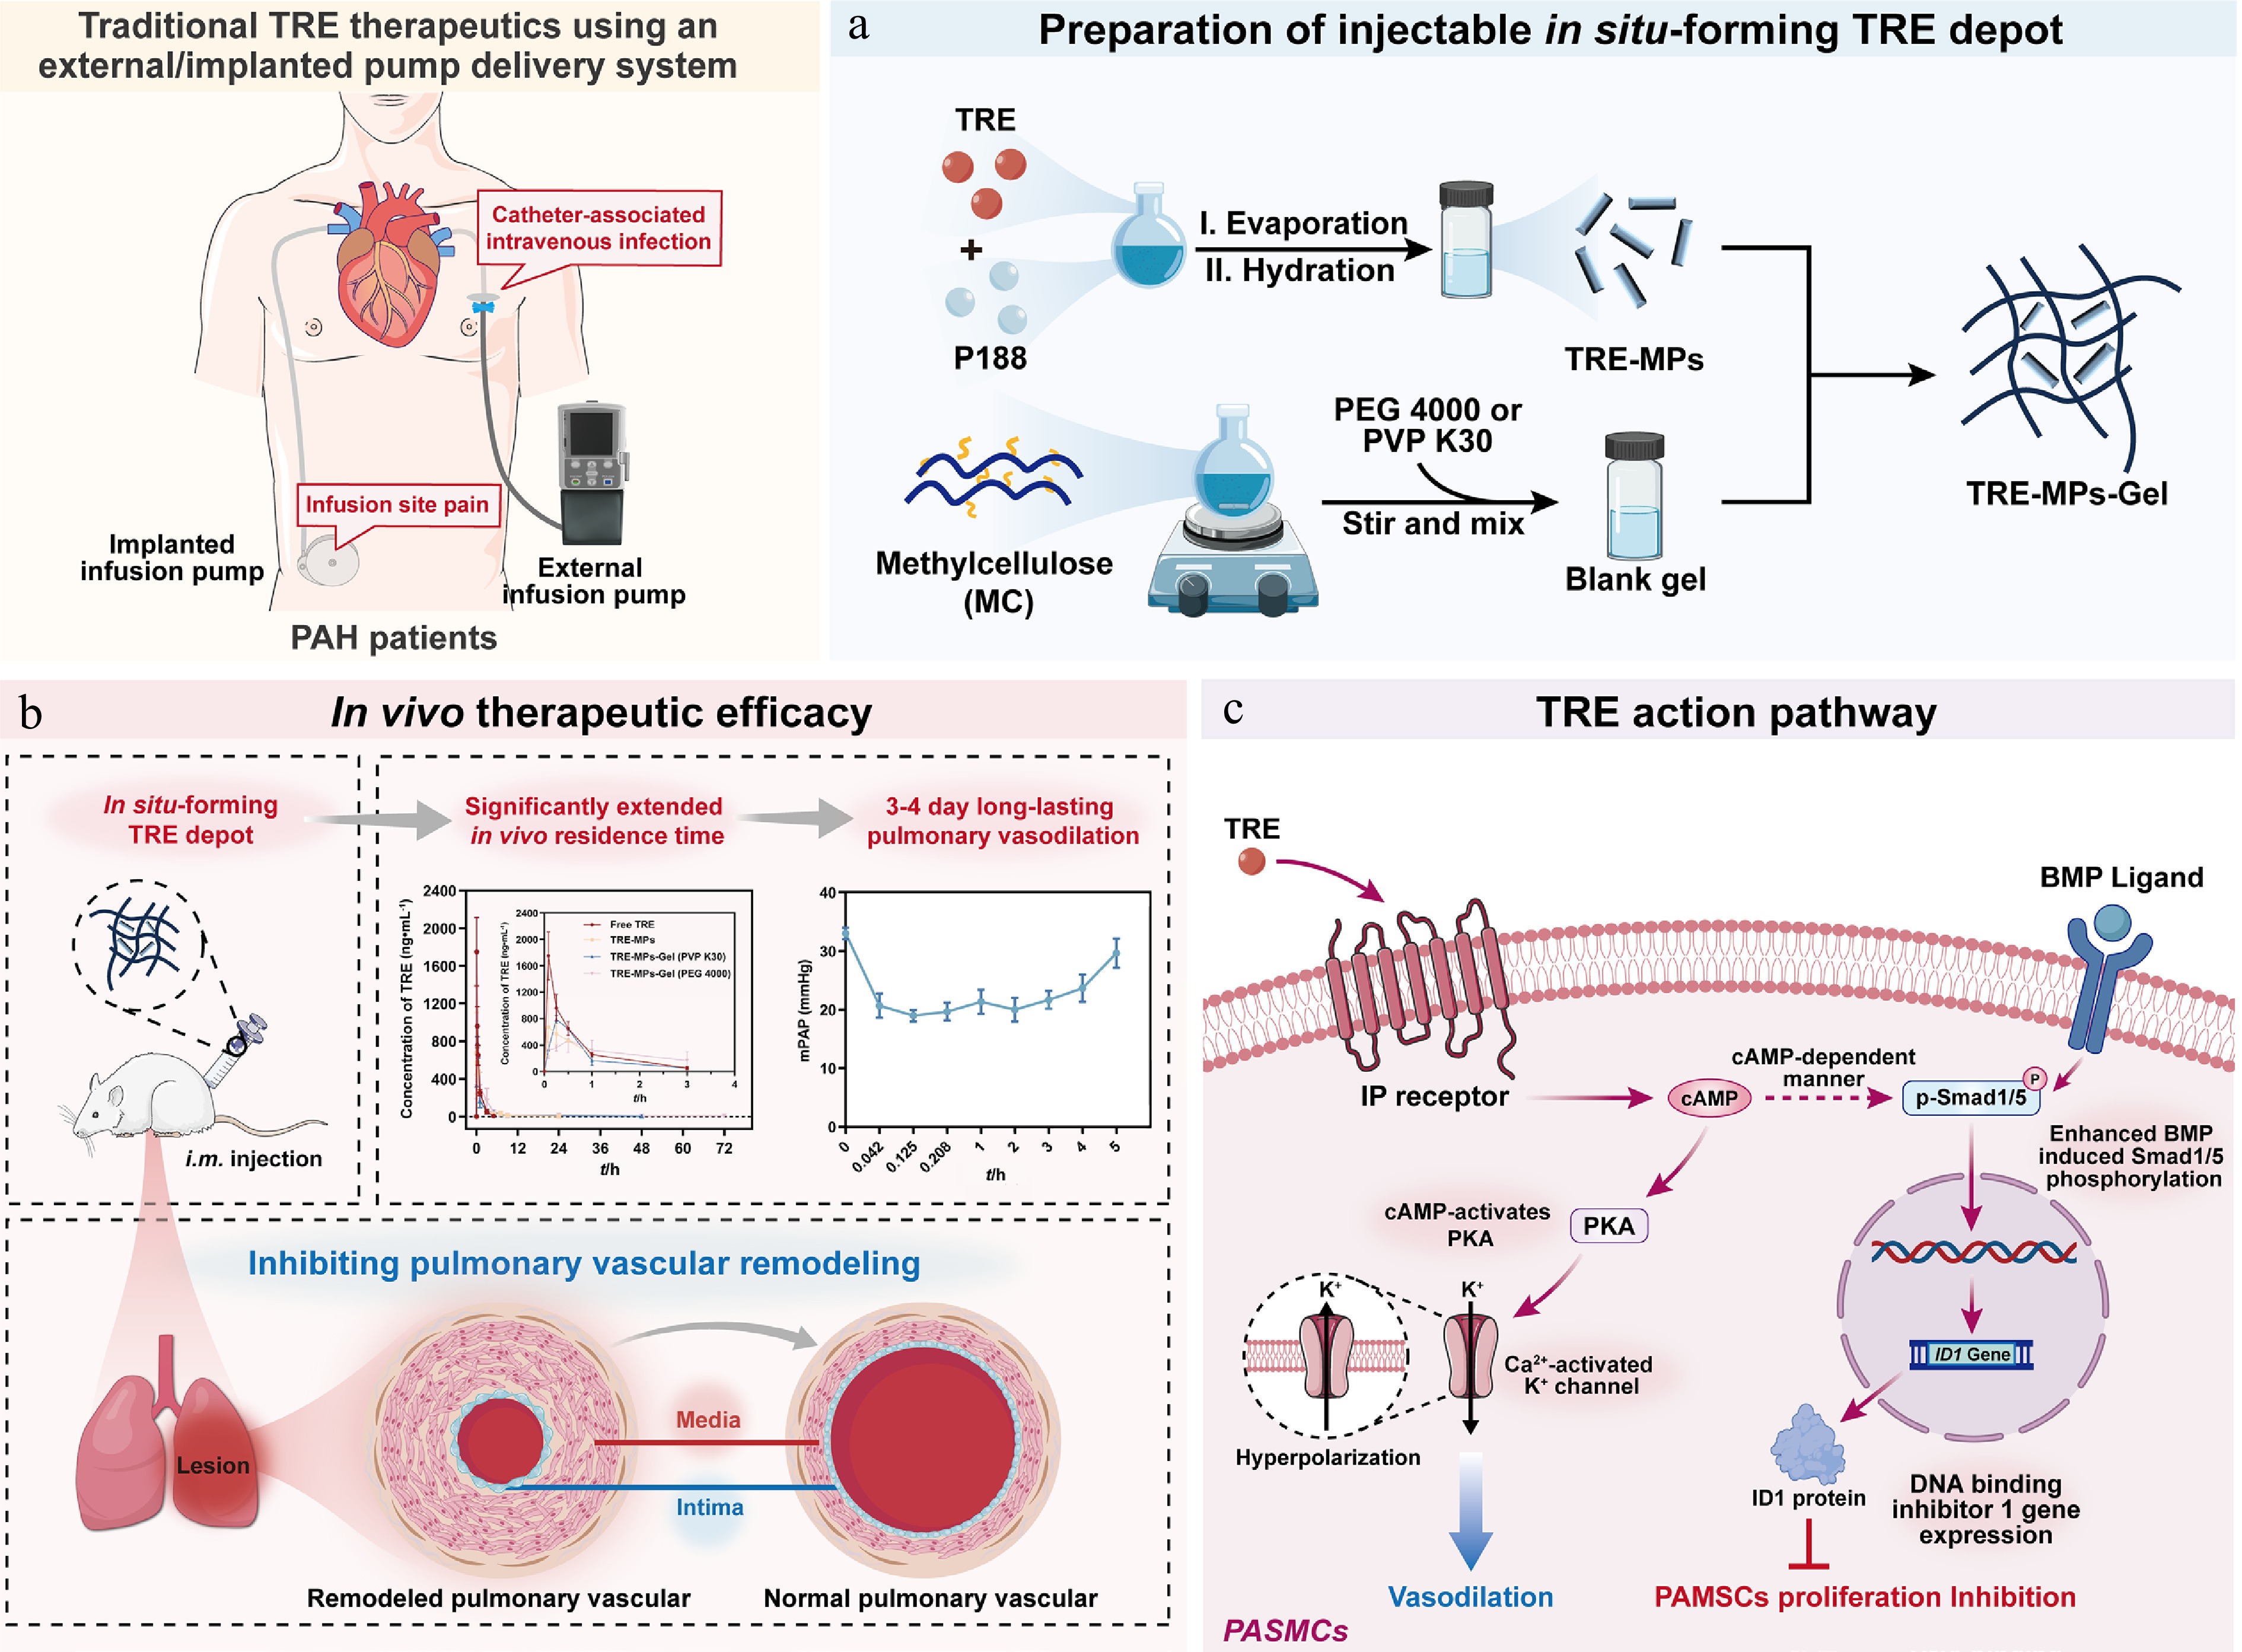
Figure 1.
(a) Preparation of injectable in situ-forming TRE depot. TRE-MPs were prepared using thin-film hydration and TRE-MPs-Gel was prepared using a simple physical mixing method with Methylcellulose as the thermosensitive gel matrix. (b) In vivo therapeutic efficacy. TRE-MPs-Gel, administered via intramuscular injection, forms an in situ gel depot, significantly extending in vivo residence time and enabling 3−4 d long-lasting pulmonary vasodilation for the treatment of pulmonary arterial hypertension. (c) The action pathway of TRE. TRE targets IP receptors on PASMCs, activating PKA and promoting both Smad1/5 phosphorylation and the upregulation of DNA-binding inhibitory protein 1 in a cAMP-dependent manner, via which induces vasodilation and inhibits PASMCs proliferation.
-
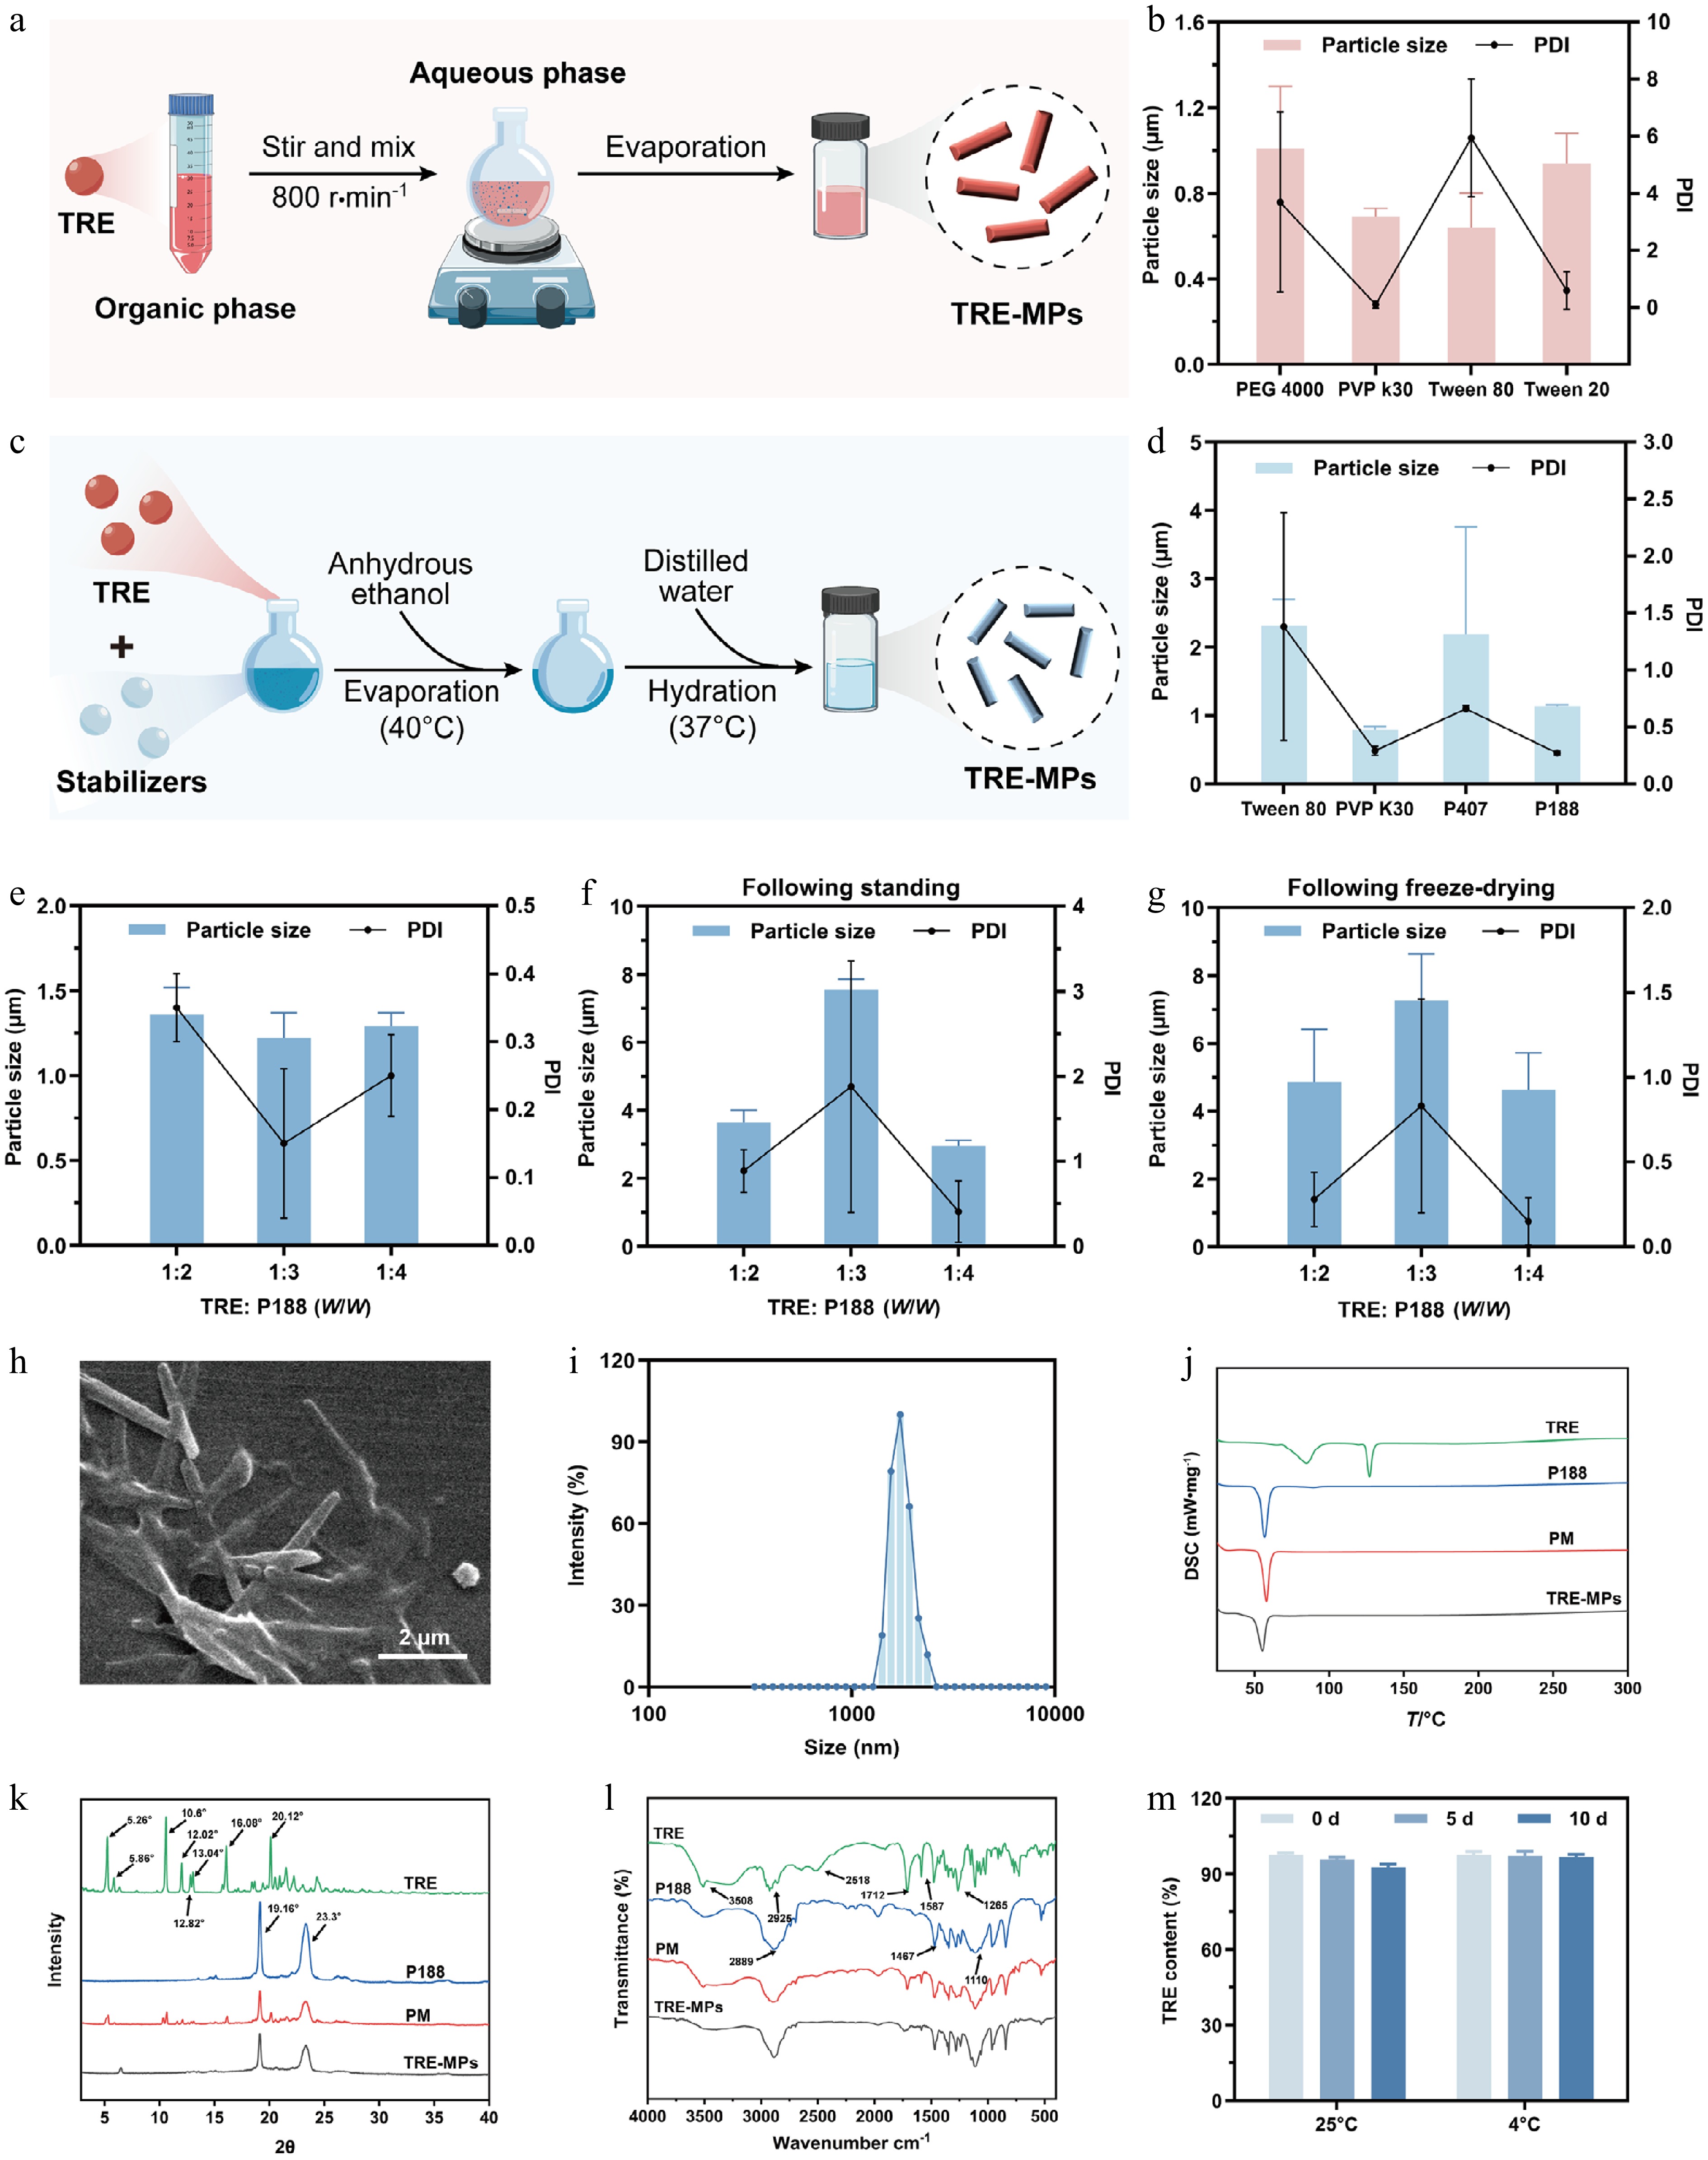
Figure 2.
Preparation and characterization of TRE-MPs. (a) TRE-MPs were prepared by the antisolvent precipitation–ultrasonication method. (b) Particle size and PDI of TRE-MPs prepared by the antisolvent precipitation–ultrasonication method. (c) TRE-MPs were prepared by the thin-film hydration method. (d) Particle size and PDI of TRE-MPs prepared by the thin-film hydration method. (e) Particle size and PDI of TRE-MPs with varying mass ratios of TRE and P188 (1 : 2, 1 : 3, and 1 : 4). (f, g) Particle size stability of TRE-MPs with different TRE: P188 ratios (f) stored at 4 °C and (g) following freeze-drying. (h) SEM image of TRE-MPs. Scale bar: 2 μm. (i) Particle size of TRE-MPs stored at 25 °C. (j) DSC thermograms. (k) PXRD patterns. (l) FTIR spectra of TRE, P188, their physical mixture, and TRE-MPs. (m) The stability of TRE-MPs under different storage conditions. Data are presented as mean ± SD, n = 3.
-
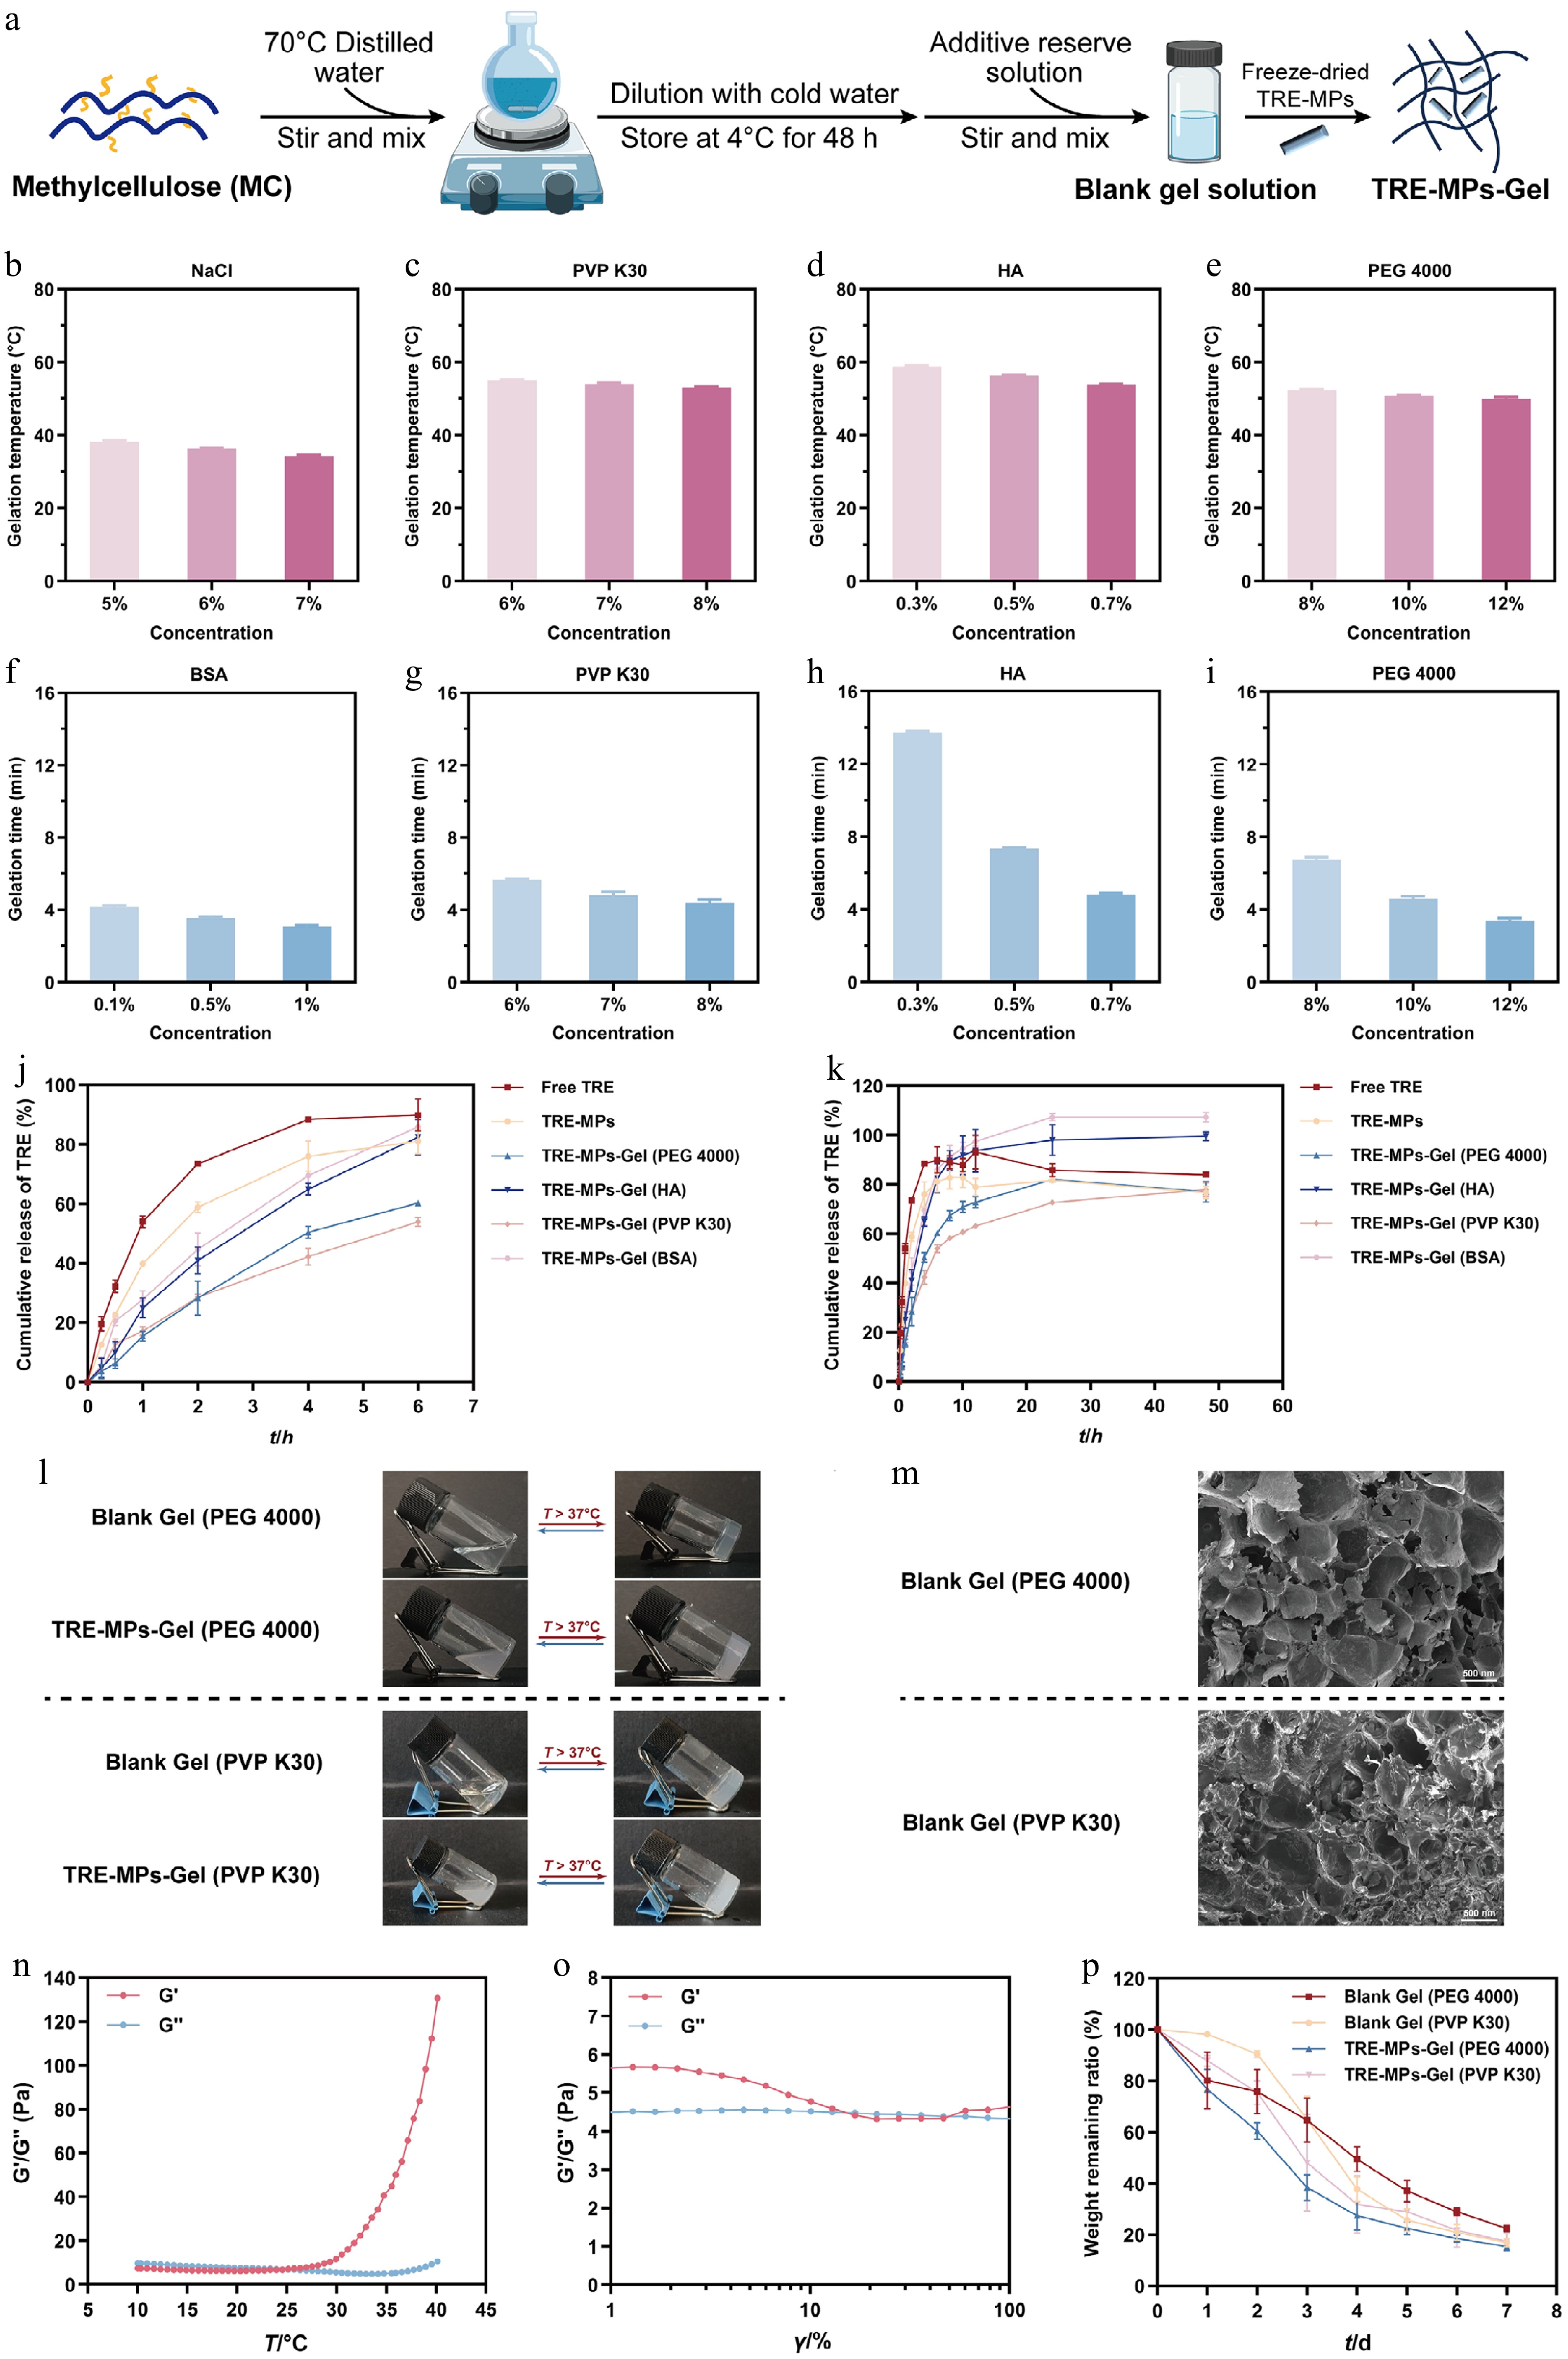
Figure 3.
Optimizing the formulation and characterization of TRE-MPs-Gel. (a) The flowchart for the preparation of TRE-MPs-Gel. (b–e) Gelation temperature of MC hydrogels with varying additive concentrations of (b) NaCl, (c) PVP K30, (d) HA, and (e) PEG 4000. (f–i) Gelation time of MC hydrogels with varying additive concentration of (f) BSA, (g) PVP K30, (h) HA, and (i) PEG 4000. (j, k) In vitro release profiles of free TRE, TRE-MPs, TRE-MPs-Gel (PEG 4000), TRE-MPs-Gel (HA), TRE-MPs-Gel (PVP K30), and TRE-MPs-Gel (BSA) within the (j) first 7 h and (k) 60 h. (l) Sol–gel transition behavior of blank gel and TRE-MPs-Gel. (m) SEM images of blank gel (PEG 4000) and blank gel (PVP K30). Scale bar: 500 μm. (n) Linear viscoelastic region and (o) gelation temperature of blank gel (PEG 4000). (p) In vitro degradation profiles of blank gel and TRE-MPs-Gel. Data are given as the mean ± SD, n = 3.
-
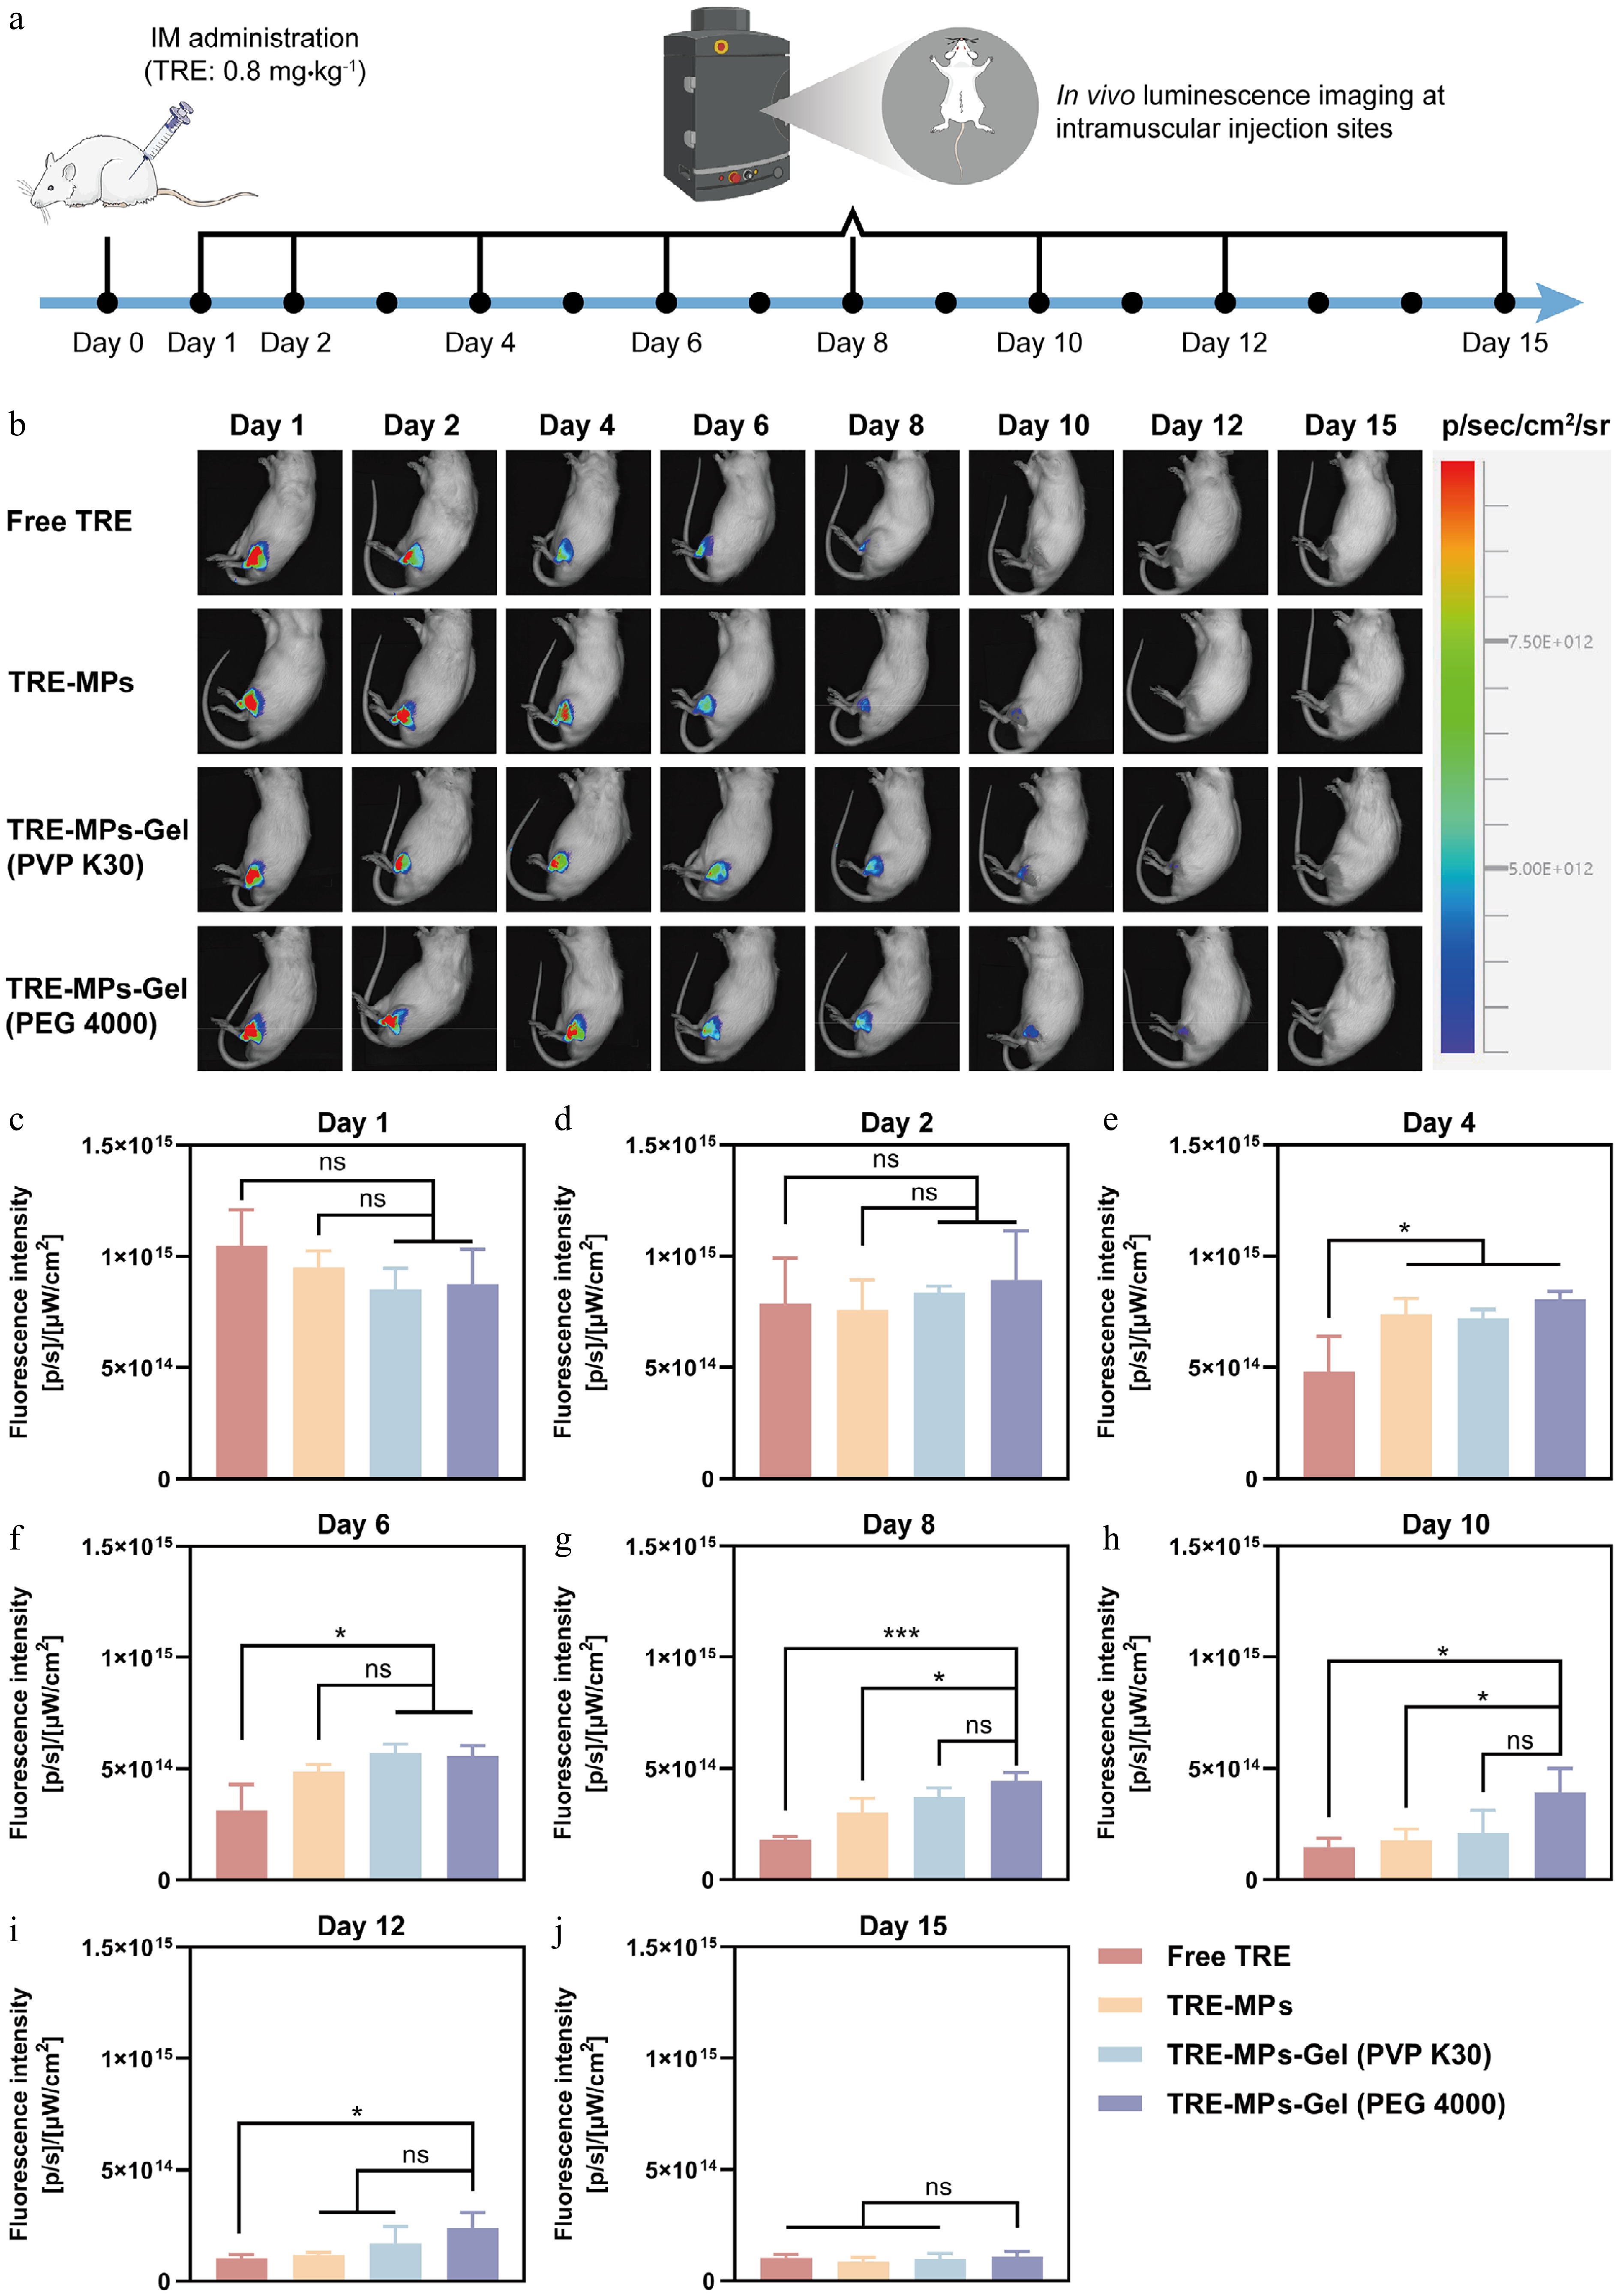
Figure 4.
In vivo residence time study of TRE-MPs-Gel. (a) In vivo residence time study design. The administration site was photographed at predetermined time points after a single dose. (b) Fluorescence intensity at the administration site of TRE-MPs-Gel was measured in the same rat tracked longitudinally at predetermined time points. (c–j) Quantitative fluorescence data at the administration site of TRE-MPs-Gel measured at (c) 1, (d) 2, (e) 4, (f) 6, (g) 8, (h) 10, (i) 12, and (j) 15 d. Data are shown as the mean ± SD, n = 3; * P < 0.05, *** P < 0.001, ns, not significant.
-
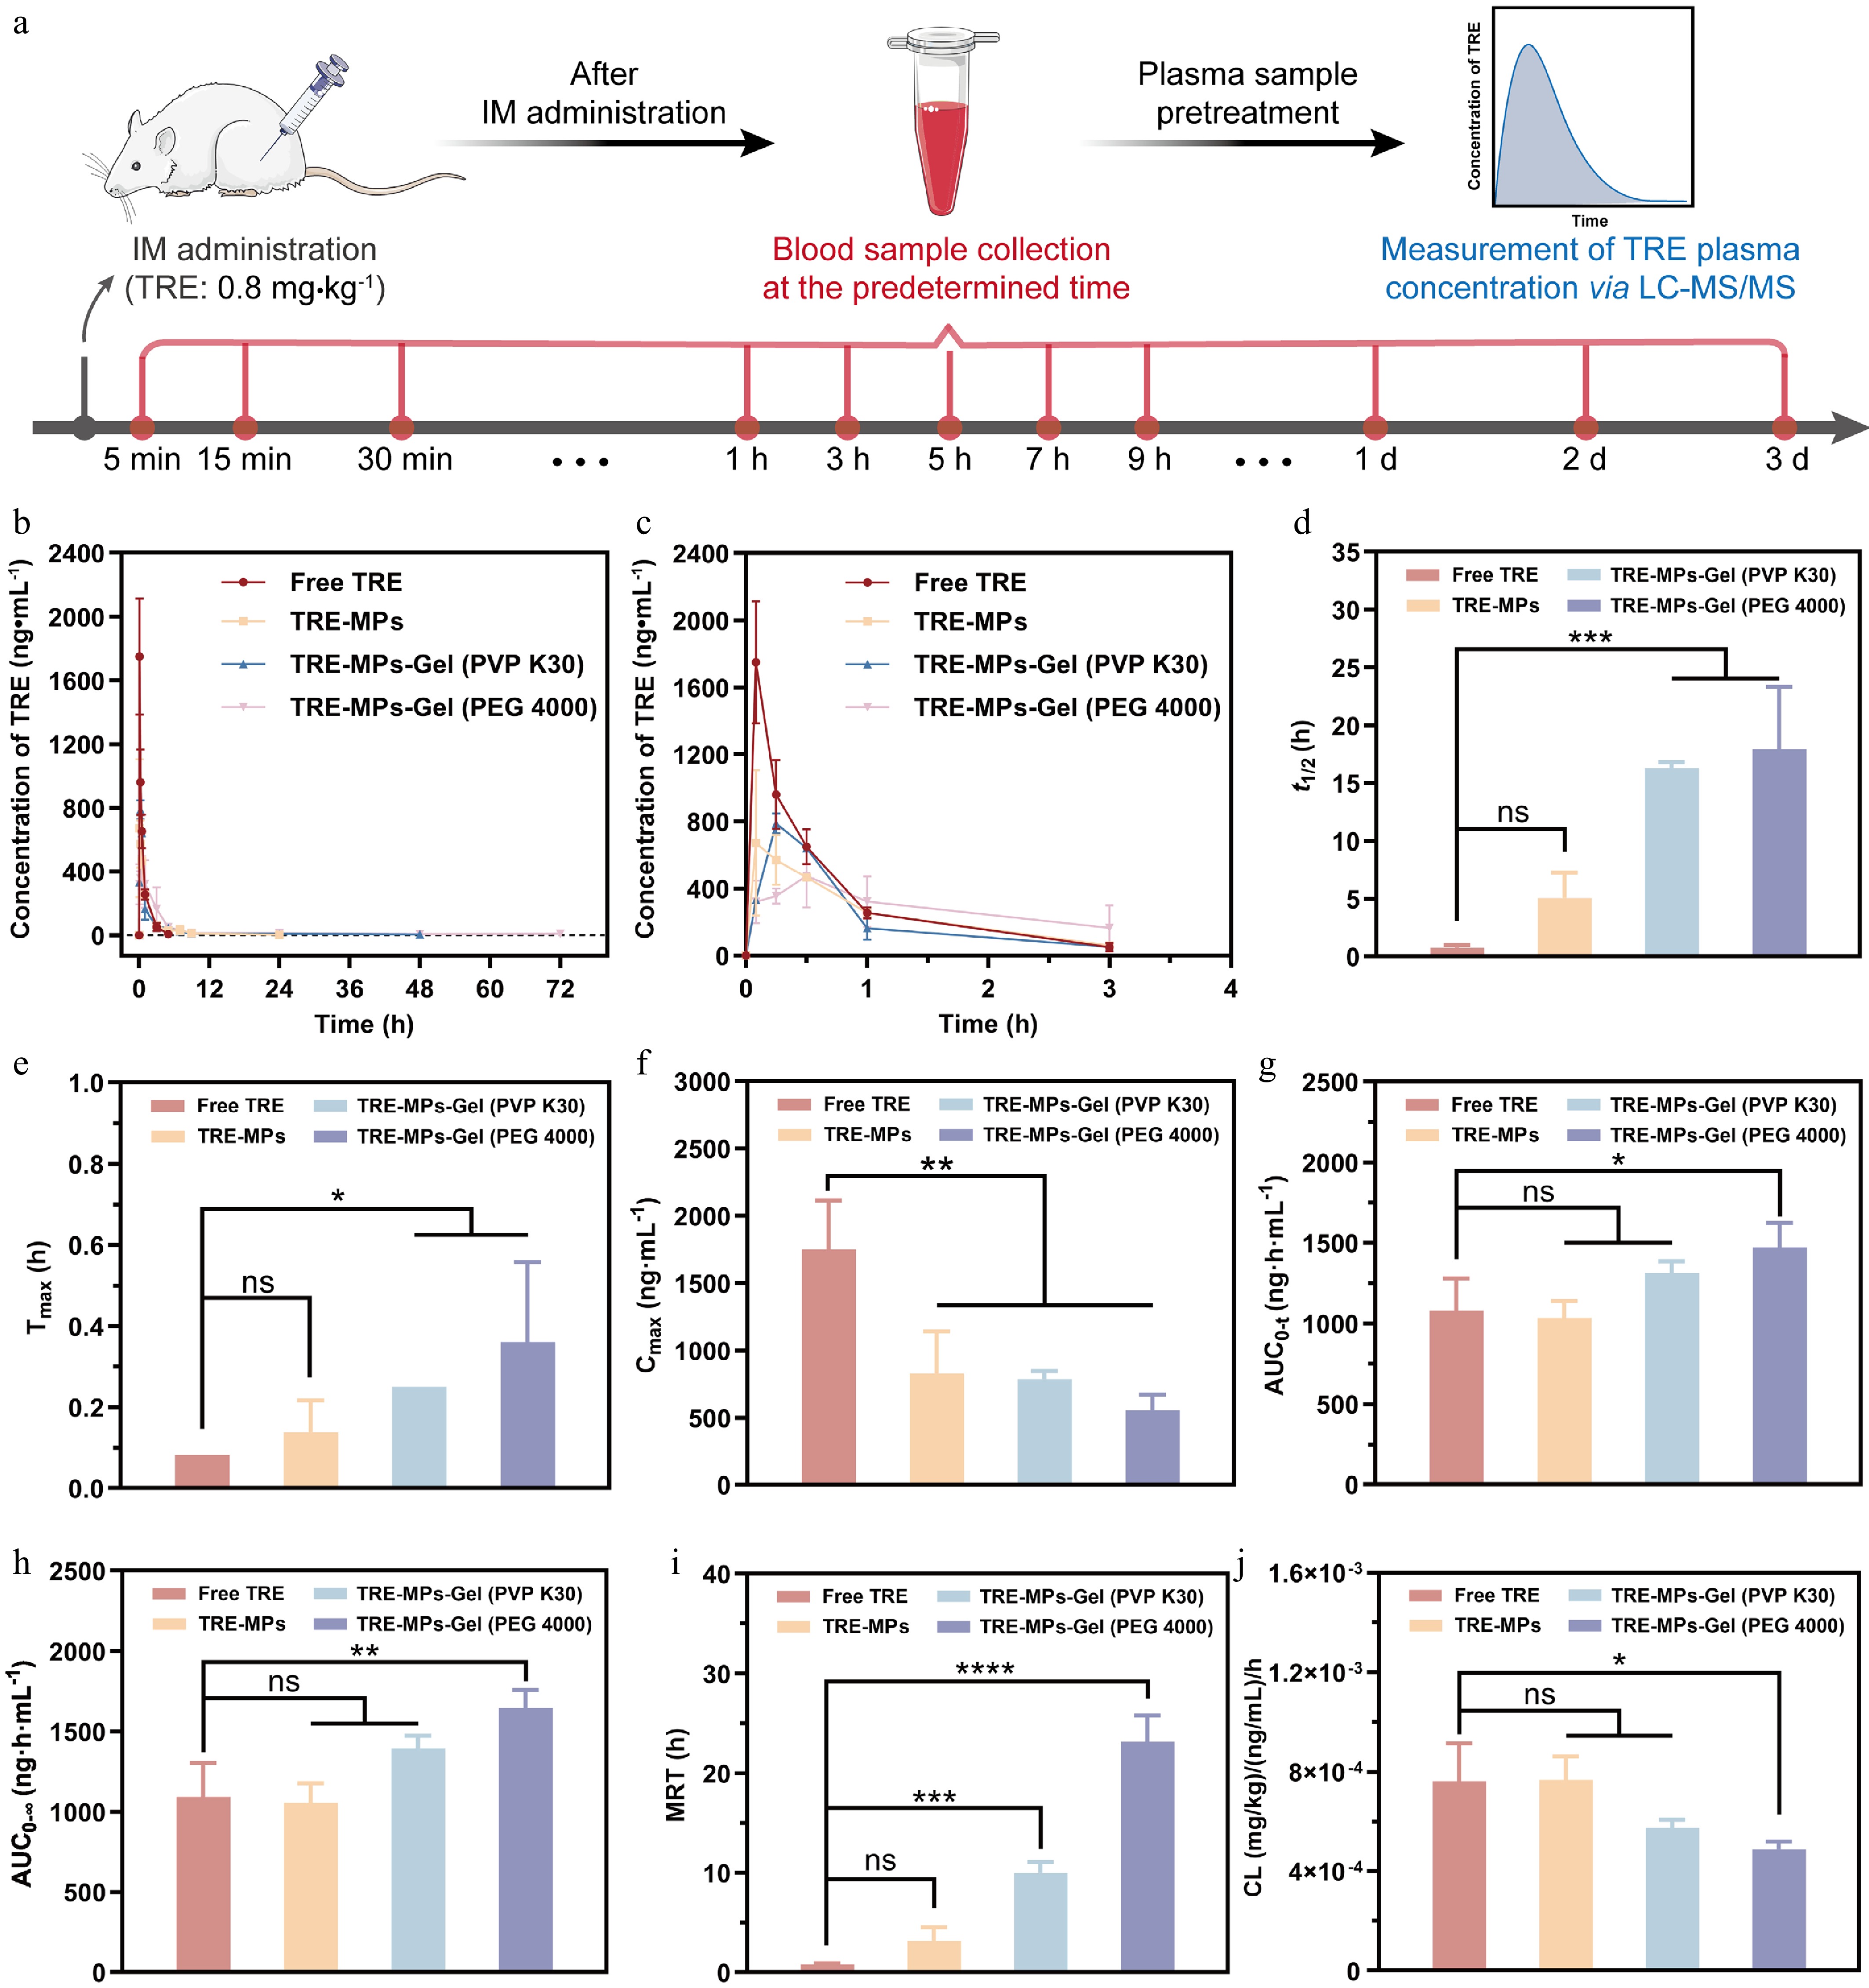
Figure 5.
Pharmacokinetic study. (a) The pharmacokinetic study's design. Blood samples were collected at the predetermined time after a single IM administration, and TRE plasma concentrations were measured by LC-MS/MS. (b, c) Drug concentration–time curve at (b) 72 h and (c) 4 h of TRE-MPs-Gel after a single IM administration at a dose of 0.8 mg·kg–1. (d–j) Main pharmacokinetic parameters of TRE-MPs-Gel including (d) t1/2, (e) time to reach maximum plasma concentration (Tmax), (f) Cmax, (g) AUC0-t, (h), AUC0-∞, (i) MRT, and (j) CL. Data are given as the mean ± SD, n = 3. * P < 0.05, ** P < 0.01, *** P < 0.001, **** P < 0.0001, ns, not significant.
-
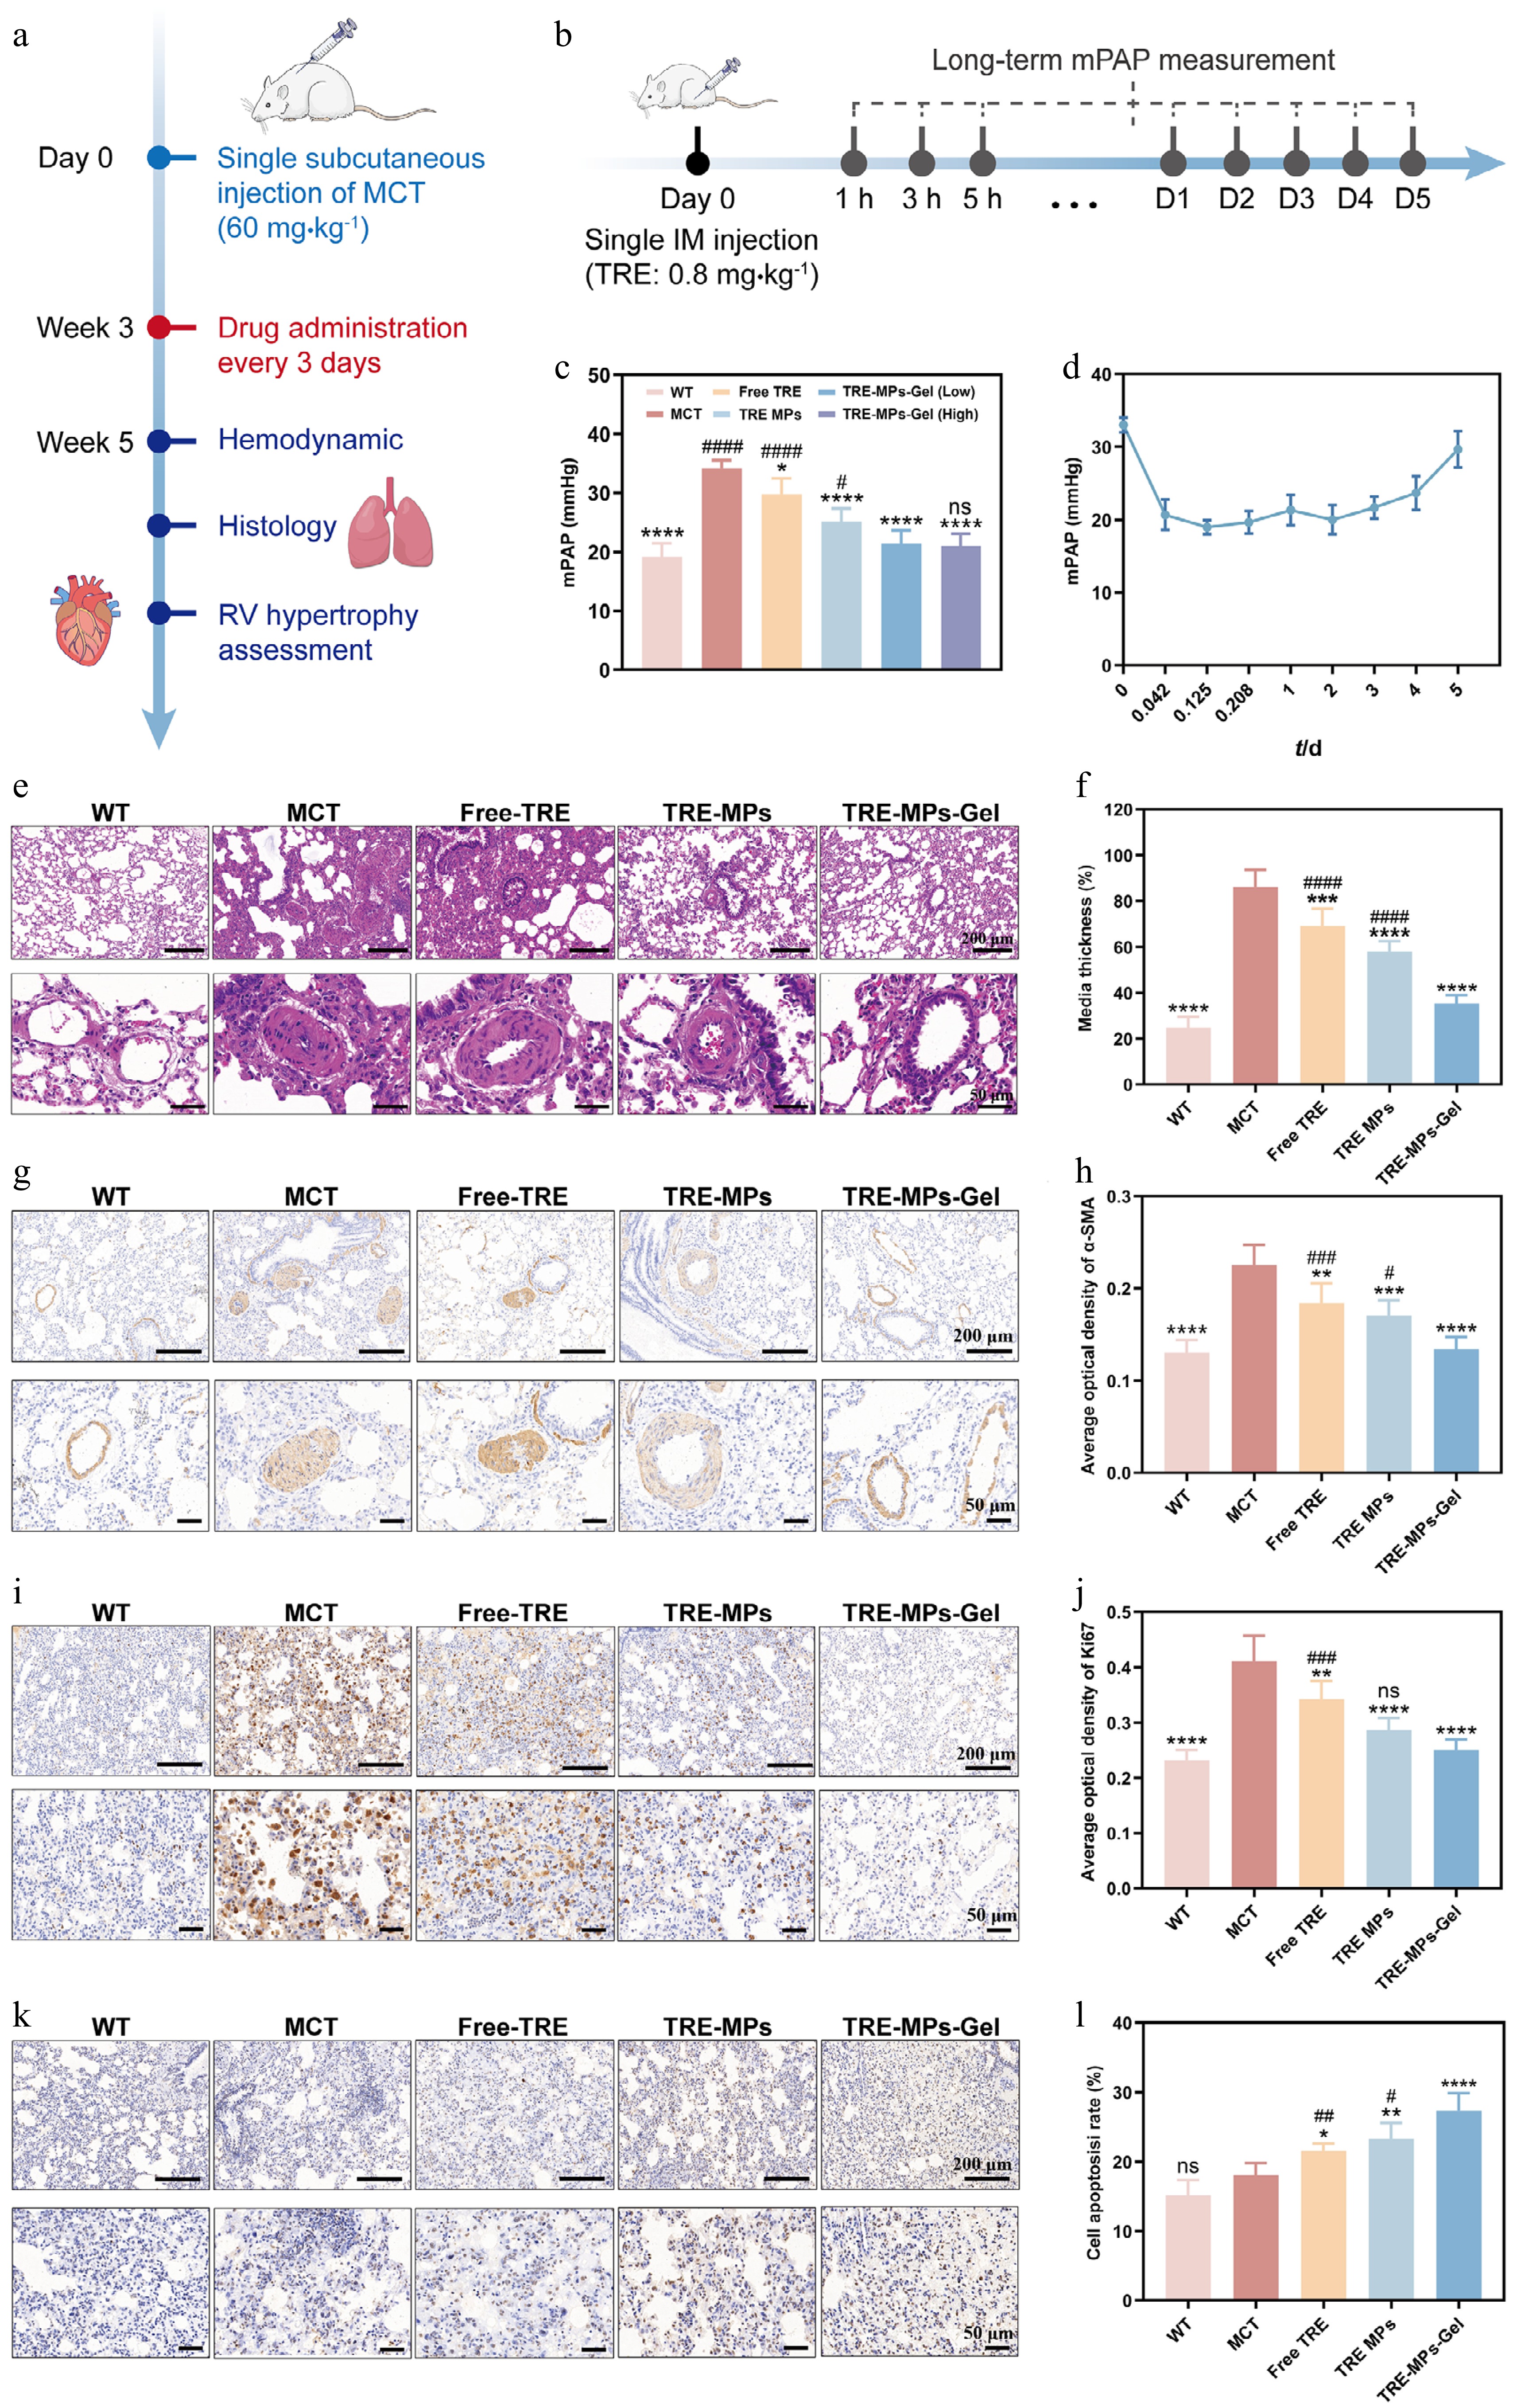
Figure 6.
Therapeutic efficacy in the MCT rat model. TRE-MPs-Gel (PEG 4000) was selected for in vivo pharmacodynamic evaluation. (a) Establishment of the PAH rat model and PAH treatment administration schedule. (b) Long-term mPAP measurement schedule. (c) mPAP in rats after treatment (n = 5). (d) mPAP in rats after a single administration of TRE-MPs-Gel (PEG 4000) at 1, 3, and 5 h and 1, 2, 3, 4, and 5 d (n = 3). (e) H&E staining of lung sections, showing nuclei in blue and cytoplasm/extracellular matrix in red. (f) Semiquantitative analysis of pulmonary medial thickness (n = 5). (g) Representative α-SMA immunohistochemistry (IHC) images and (h) semiquantitative analysis of α-SMA expression in pulmonary vessels (n = 5). (i) Representative Ki67 IHC images and (j) semiquantitative analysis of Ki67's expression in pulmonary vessels (n = 5). (k) TUNEL staining images and (l) semiquantitative analysis of TUNEL-positive cells (n = 5). Brown staining indicates positive areas. Scale bars: 200 and 50 μm. Rats received IM injections of free TRE (0.286 mg·kg–1 once daily), TRE-MPs (0.8 mg·kg–1 once every 3 d), and TRE-MPs-Gel (normal: 0.8 mg·kg–1; high: 1.2 mg·kg–1, once every 3 d) for 2 weeks. Data are presented as the means ± SD. * P < 0.05, ** P < 0.01, *** P < 0.001, **** P < 0.0001 vs. MCT group; # P < 0.05, ## P < 0.01, ### P < 0.001, #### P < 0.0001 vs. TRE-MP-Gel group; ns, not significant.
-
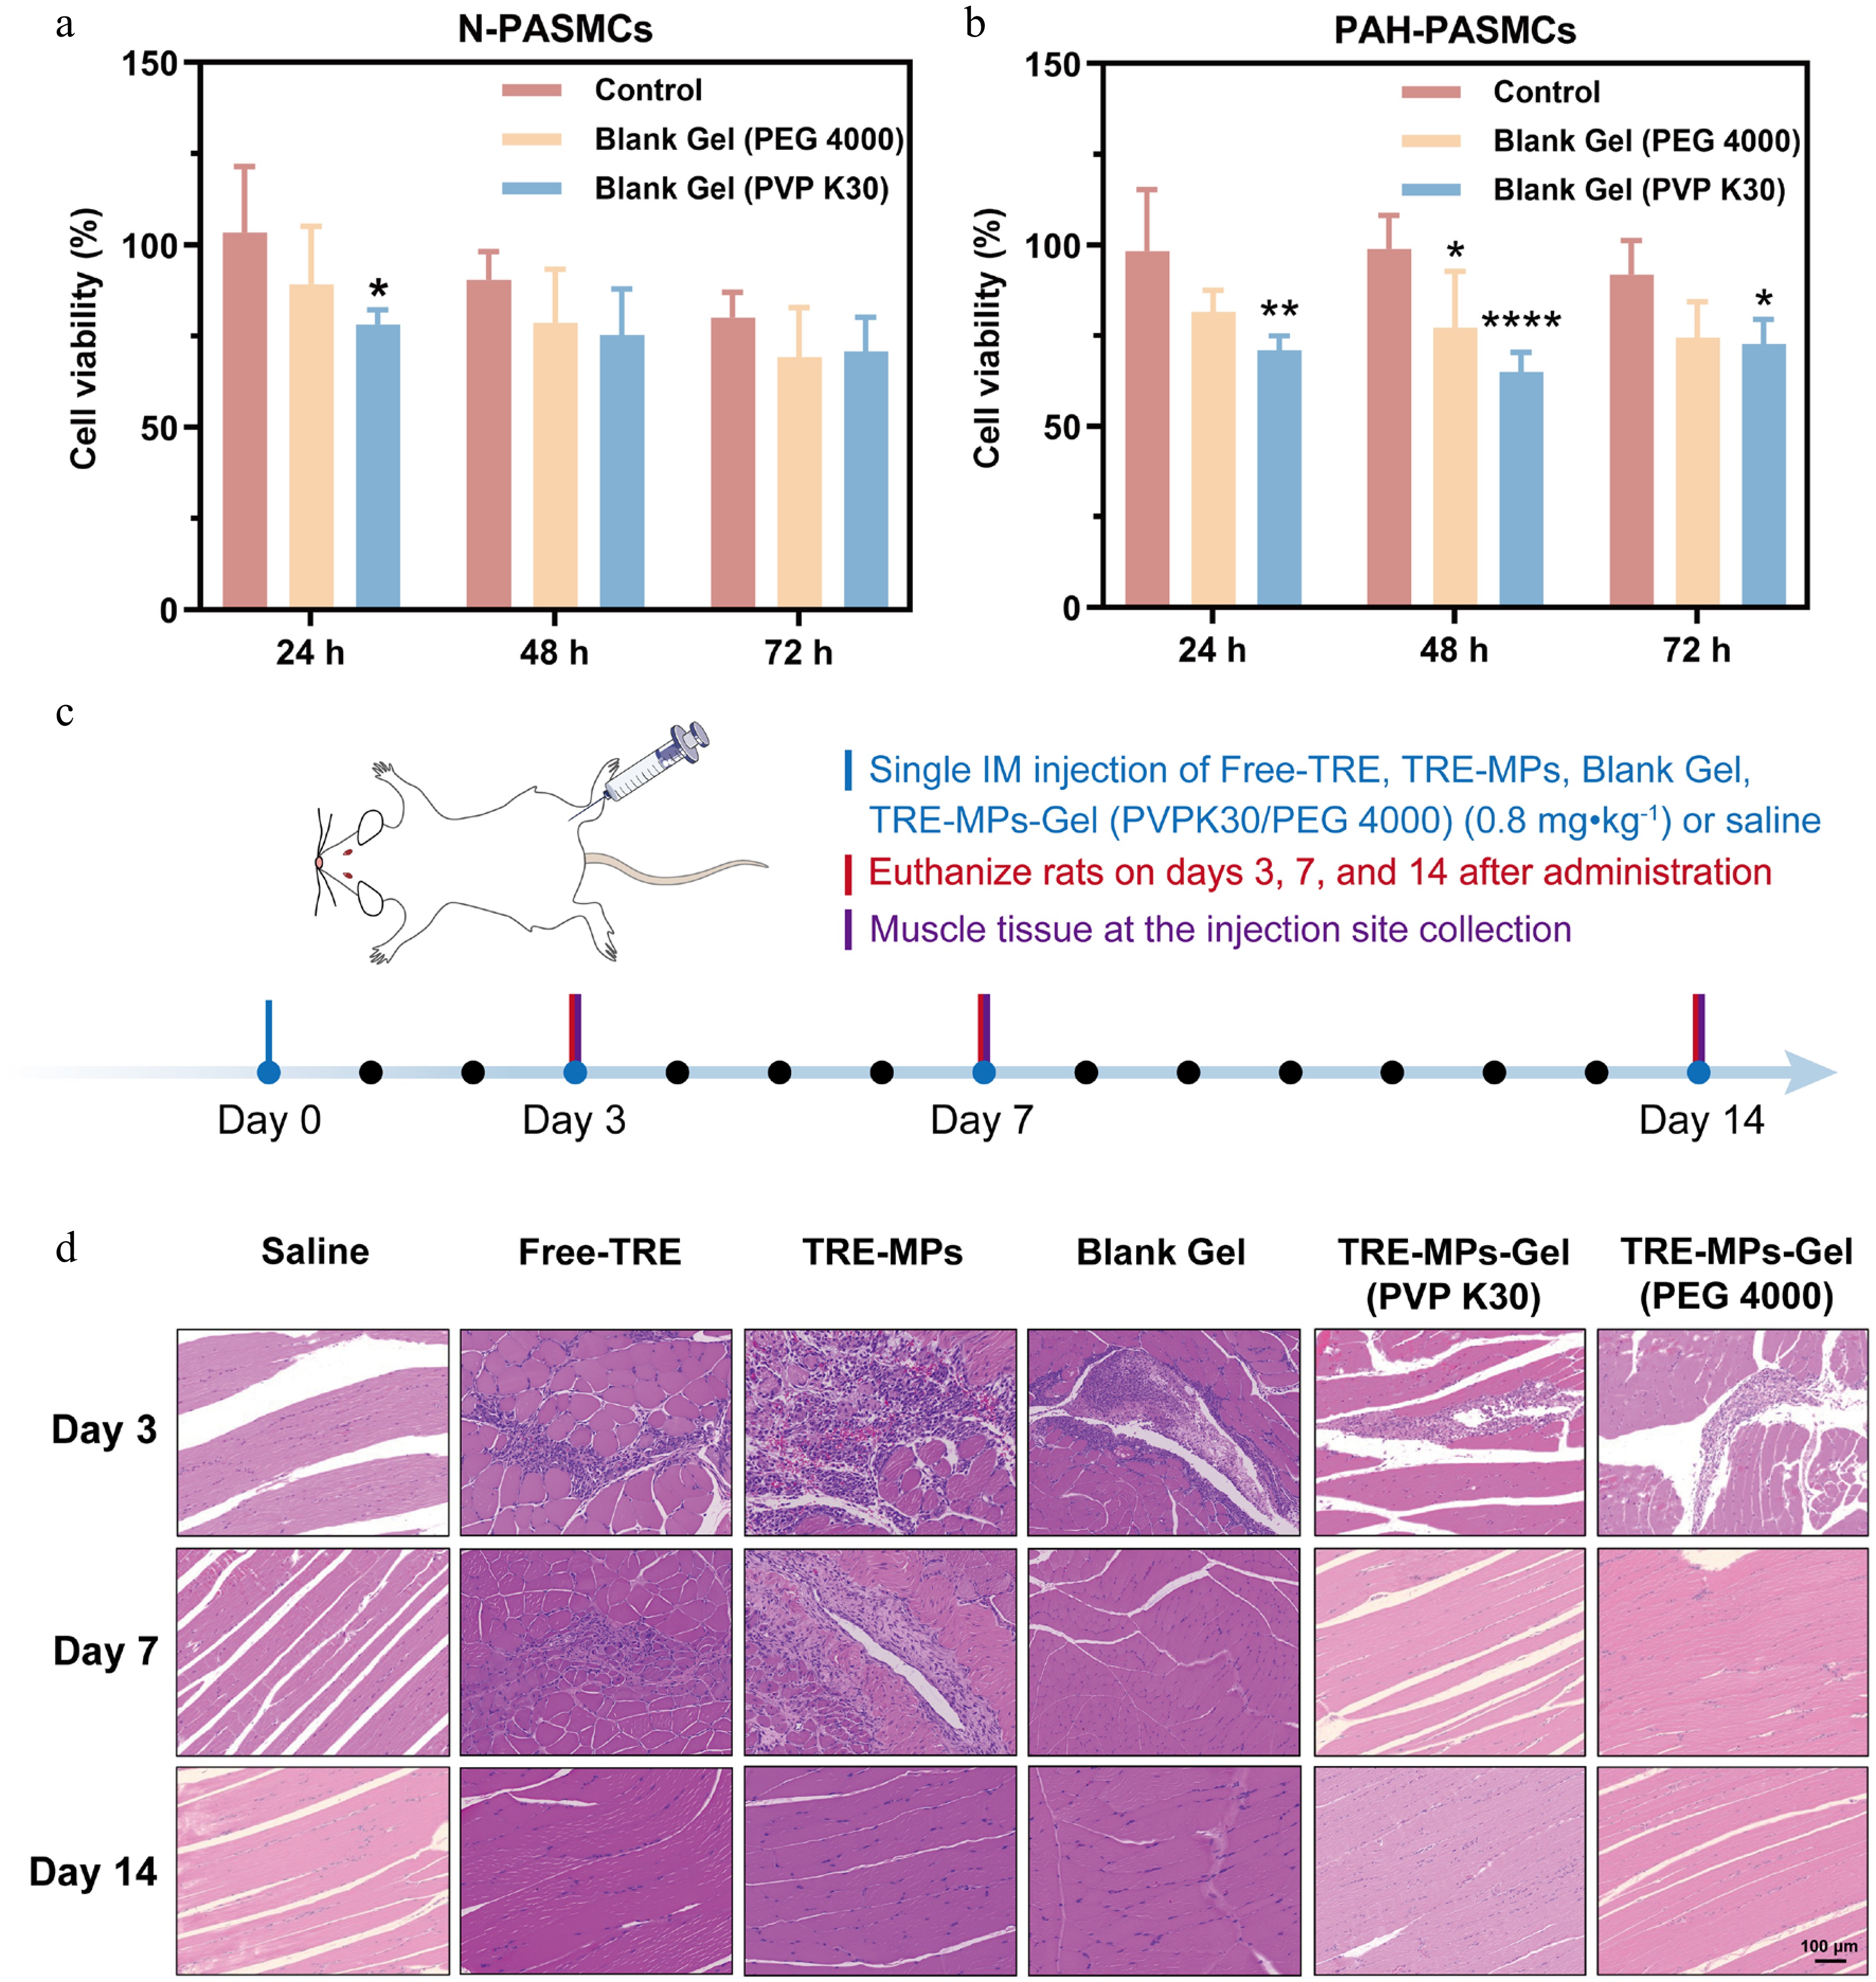
Figure 7.
Safety evaluation of TRE-MPs-Gel (a, b) Cytotoxicity evaluation of blank gel (PEG 4000) and blank gel (PVP K30) on (a) N-PASMCs and (b) PAH-PASMCs (n = 6). (c) Safety evaluation at the injection sites. Muscle tissue was collected on Days 3, 7, and 14 after a single IM administration of free TRE, TRE-MPs, blank gel, TRE-MPs-Gel (PEG 4000), TRE-MPs-Gel (PVP K30) or saline. (d) H&E staining of paraffin-embedded rat muscle sections. Scale bars: 200 μm. Data are given as the mean ± SD. * P < 0.05, ** P < 0.01, **** P < 0.0001 vs. control group.
-
Formulations t1/2a (h) Tmaxb (h) Cmaxc (ng·mL–1) AUC0-td (ng·h·mL–1) AUC0-∞e (ng·h·mL–1) MRTf (h) CLg (mg·kg–1)·(ng·mL–1)–1·h–1 Free TRE 0.75 ± 0.24 0.083 1,749.57 ± 364.52 1,079.85 ± 200.68 1,092.67 ± 213.17 0.81 ± 0.12 0.0008 ± 0.0002 TRE-MPs 5.04 ± 2.20ns 0.14 ± 0.08ns 825.67 ± 317.14** 1,033.93 ± 105.57ns 1,058.06 ± 120.73ns 3.18 ± 1.33ns 0.0008 ± 0.0001ns TRE-MPs-Gel (PVP K30) 16.29 ± 0.48** 0.25ns 787.19 ± 59.97** 1,313.92 ± 71.23ns 1,393.70 ± 79.55ns 9.97 ± 1.13*** 0.0006 ± 0.00003ns TRE-MPs-Gel (PEG 4000) 17.96 ± 5.38*** 0.36 ± 0.20* 554.68 ± 117.83** 1,472.62 ± 152.08* 1,646.94 ± 110.08* 23.16 ± 2.64**** 0.0005 ± 0.00003* Data are given as the mean ± SD, n = 3. * P < 0.05, ** P < 0.01, *** P < 0.001, compared with the free TRE. ns, not significant. a Elimination half-life of the drug. b Time to reach the maximum plasma concentration. c Maximum plasma concentration. d Area under the concentration–time curve from 0 to t h. e Area under the concentration–time curve from 0 to ∞ h f Mean residence time. g Clearance rate. Table 1.
Pharmacokinetic parameters of TRE-MPs-Gel after a single IM injection in rats at a TRE dose of 0.8 mg·kg–1.
Figures
(7)
Tables
(1)