-
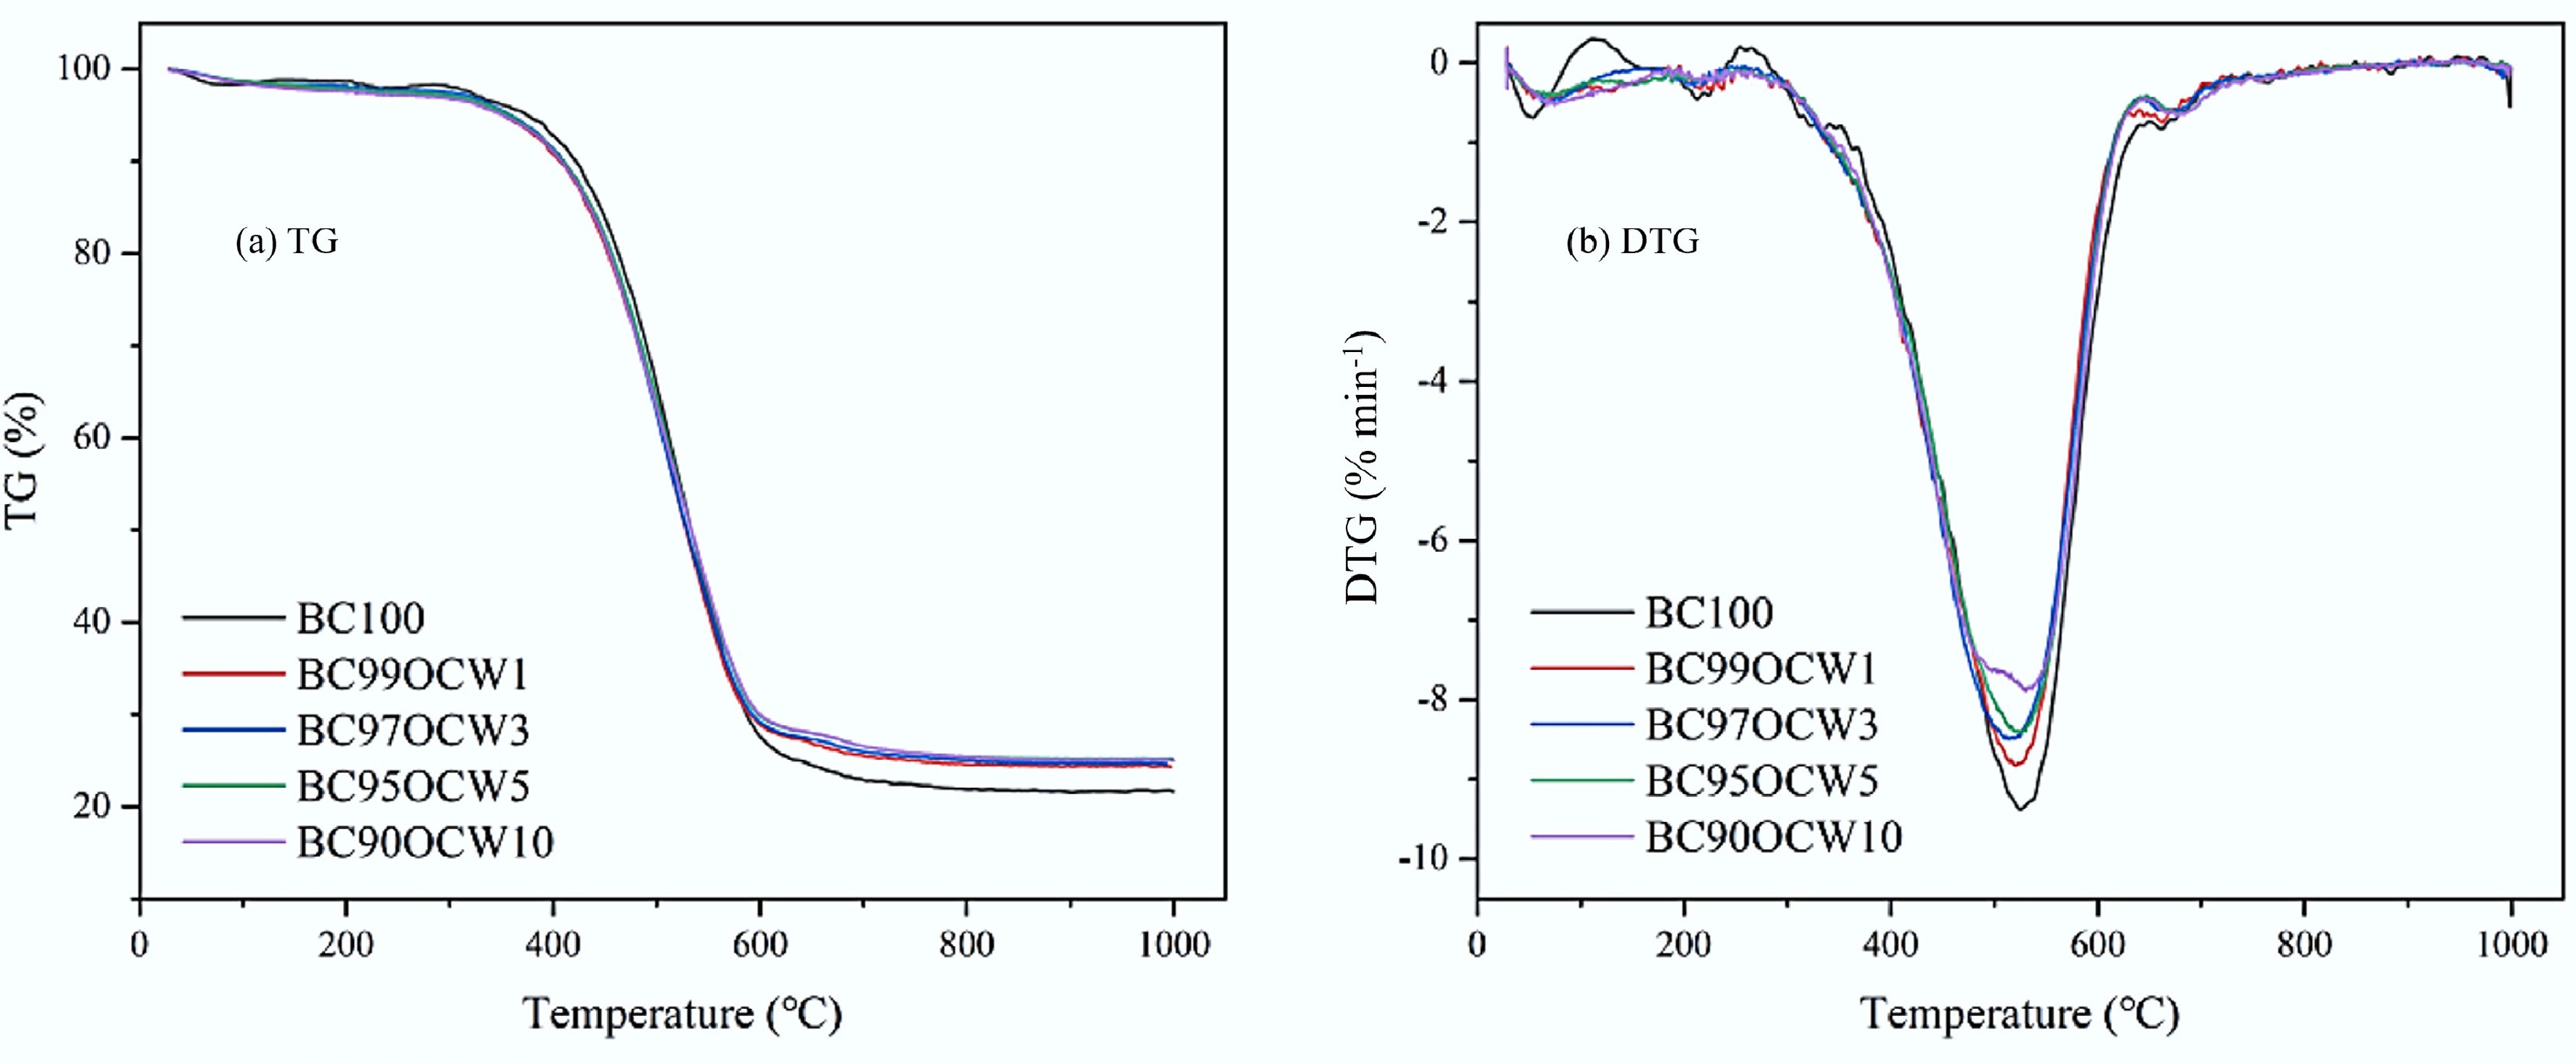
Figure 1.
TG and DTG curves of BC and OCW/BC blends during the combustion at 20 °C·min−1: (a) TG, (b) DTG.
-
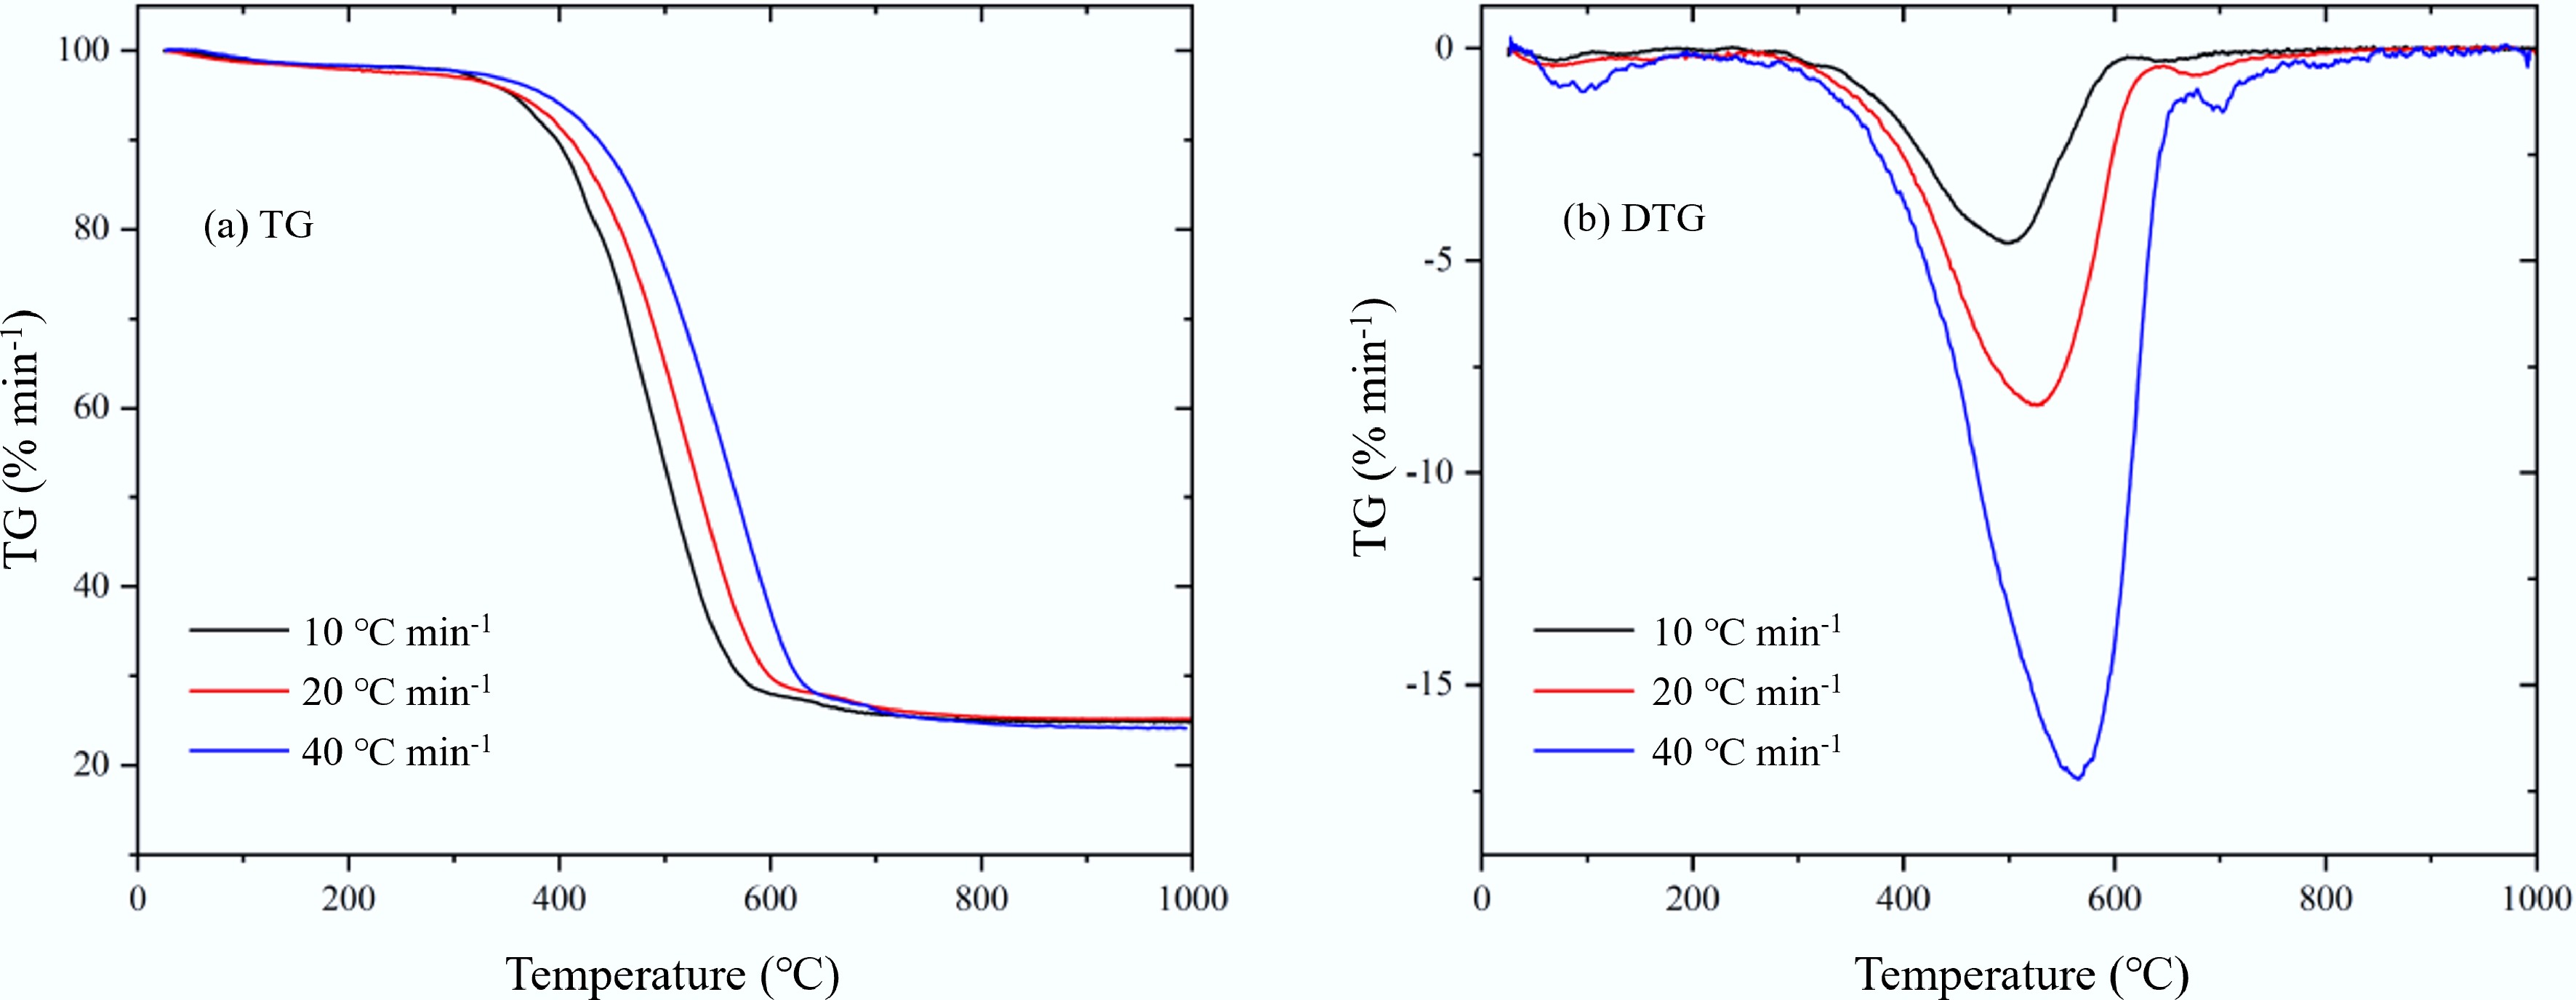
Figure 2.
TG and DTG curves of BC95OCW5 blends at different heating rates (10, 20, and 40 °C·min−1): (a) TG, (b) DTG.
-
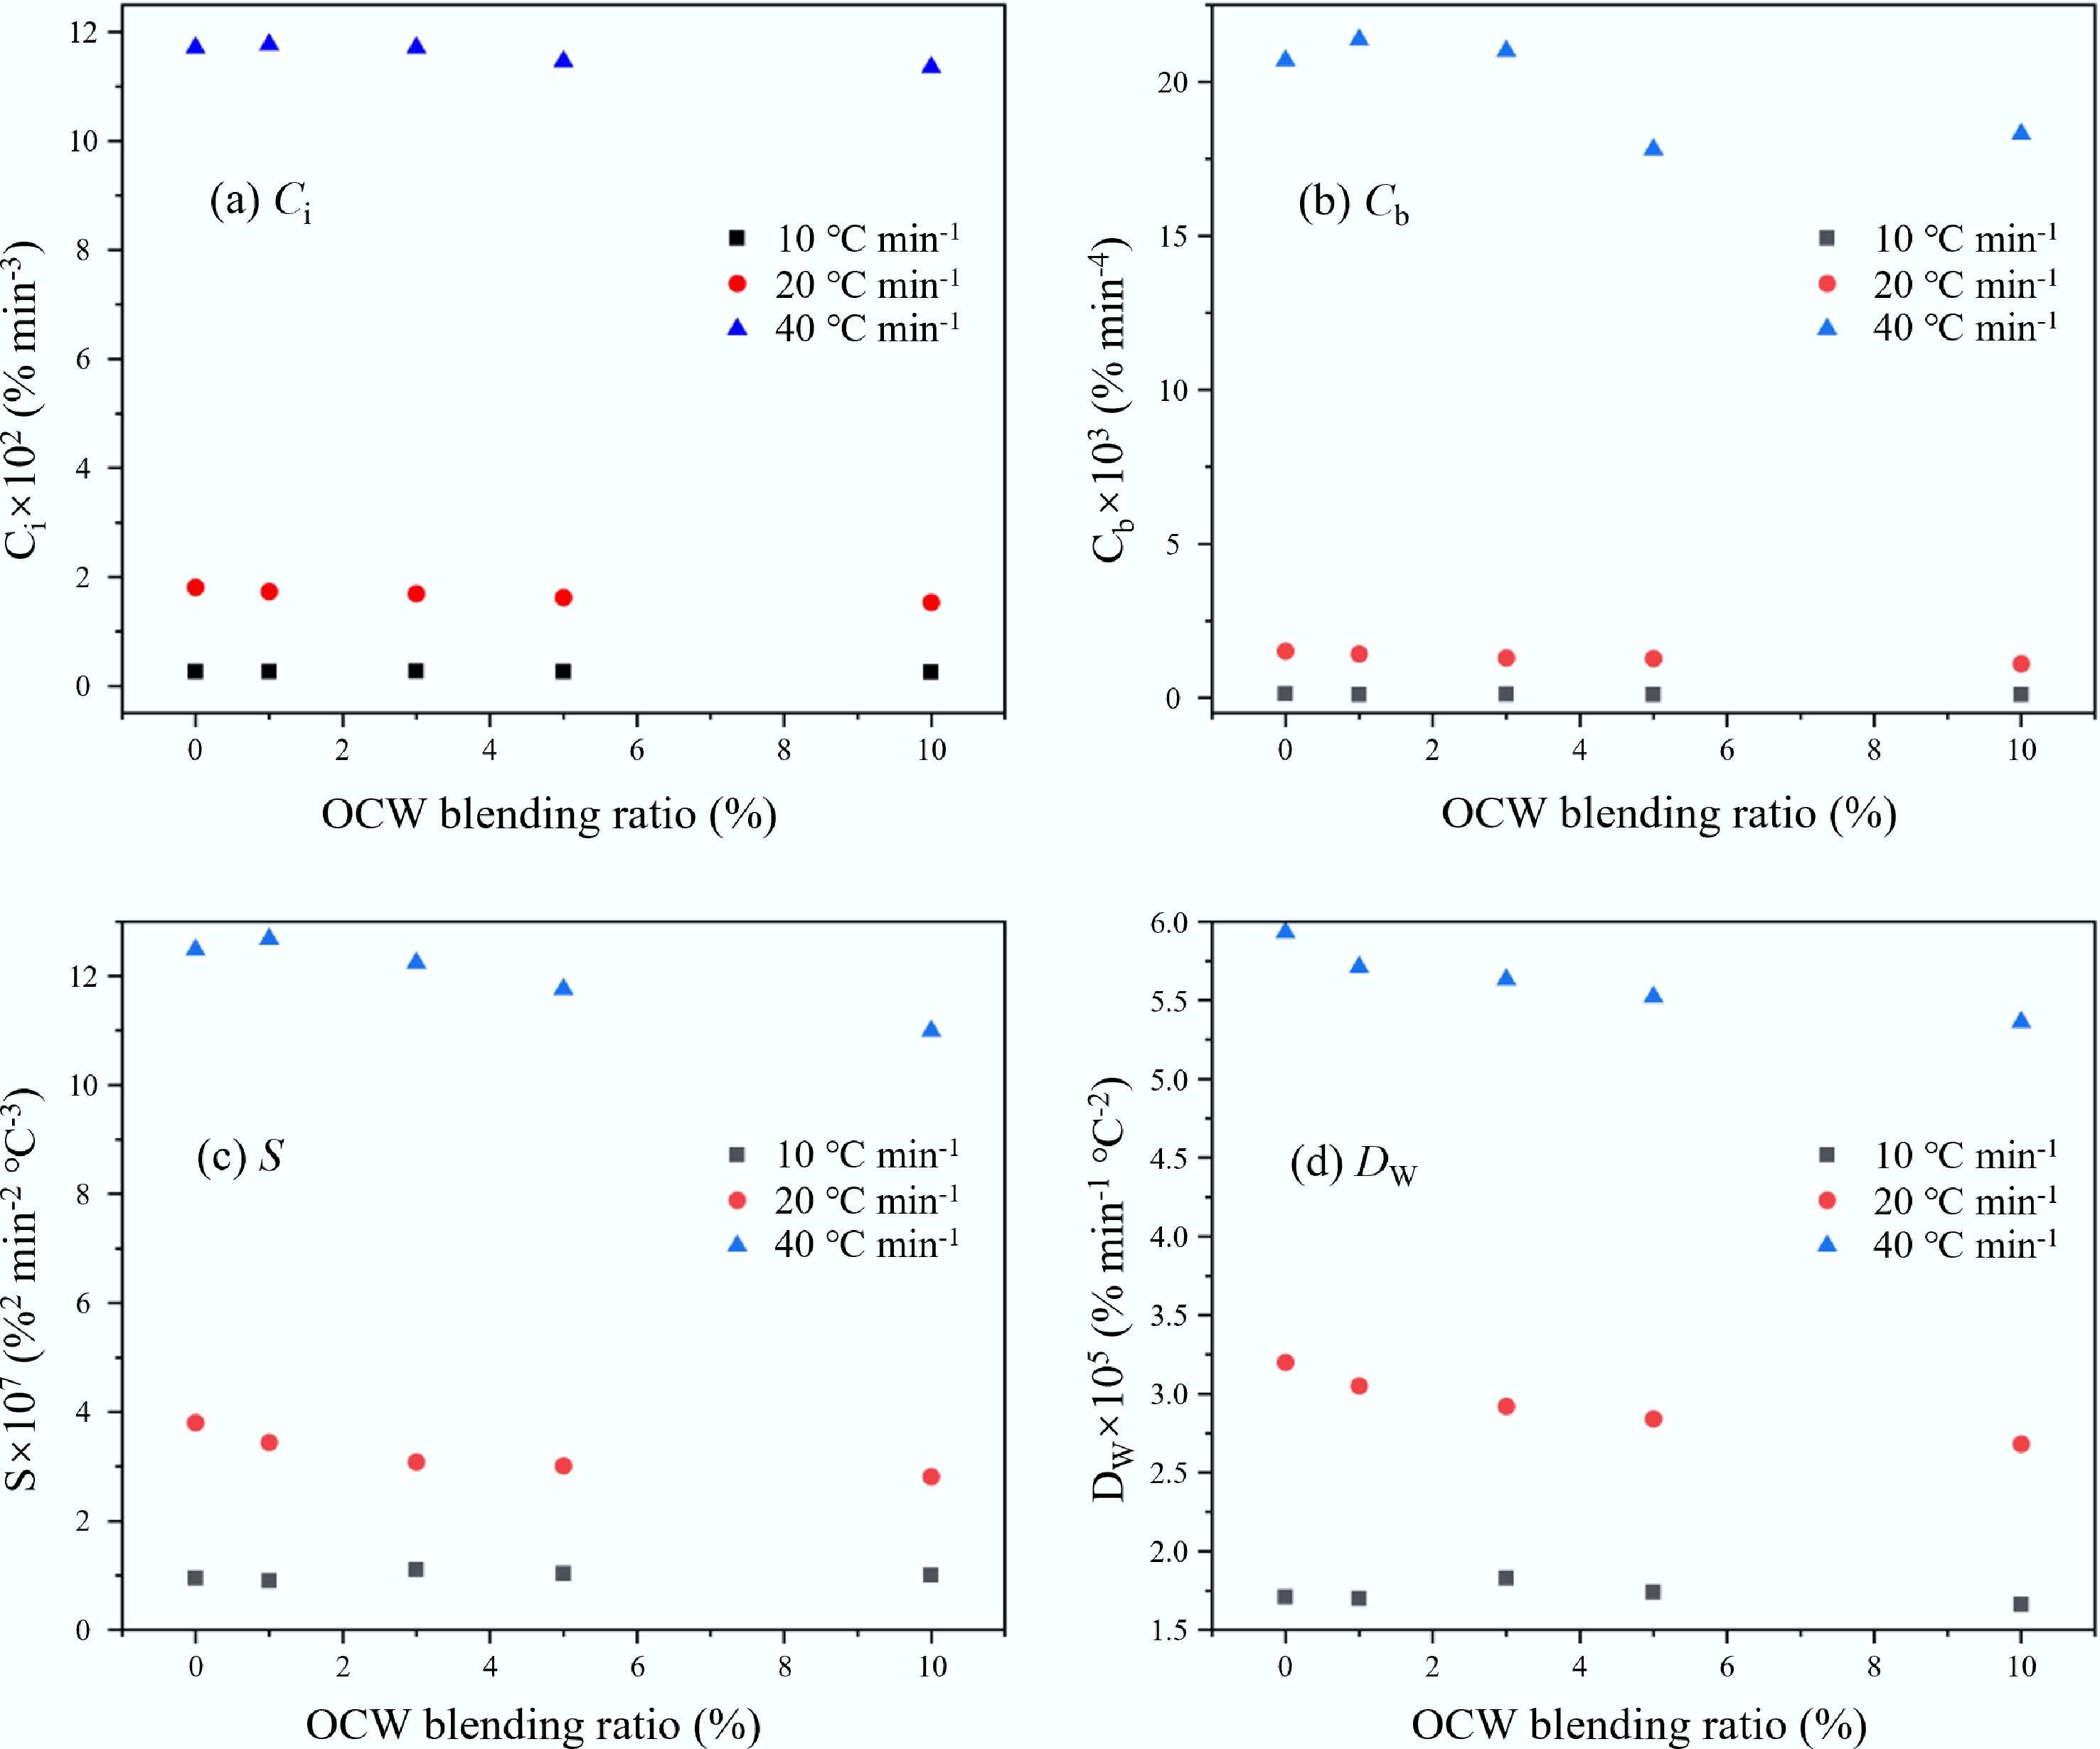
Figure 3.
Combustion characteristic indices for coal–OCW blends: (a) Ci, (b) Cb, (c) S, and (d) Dw.
-
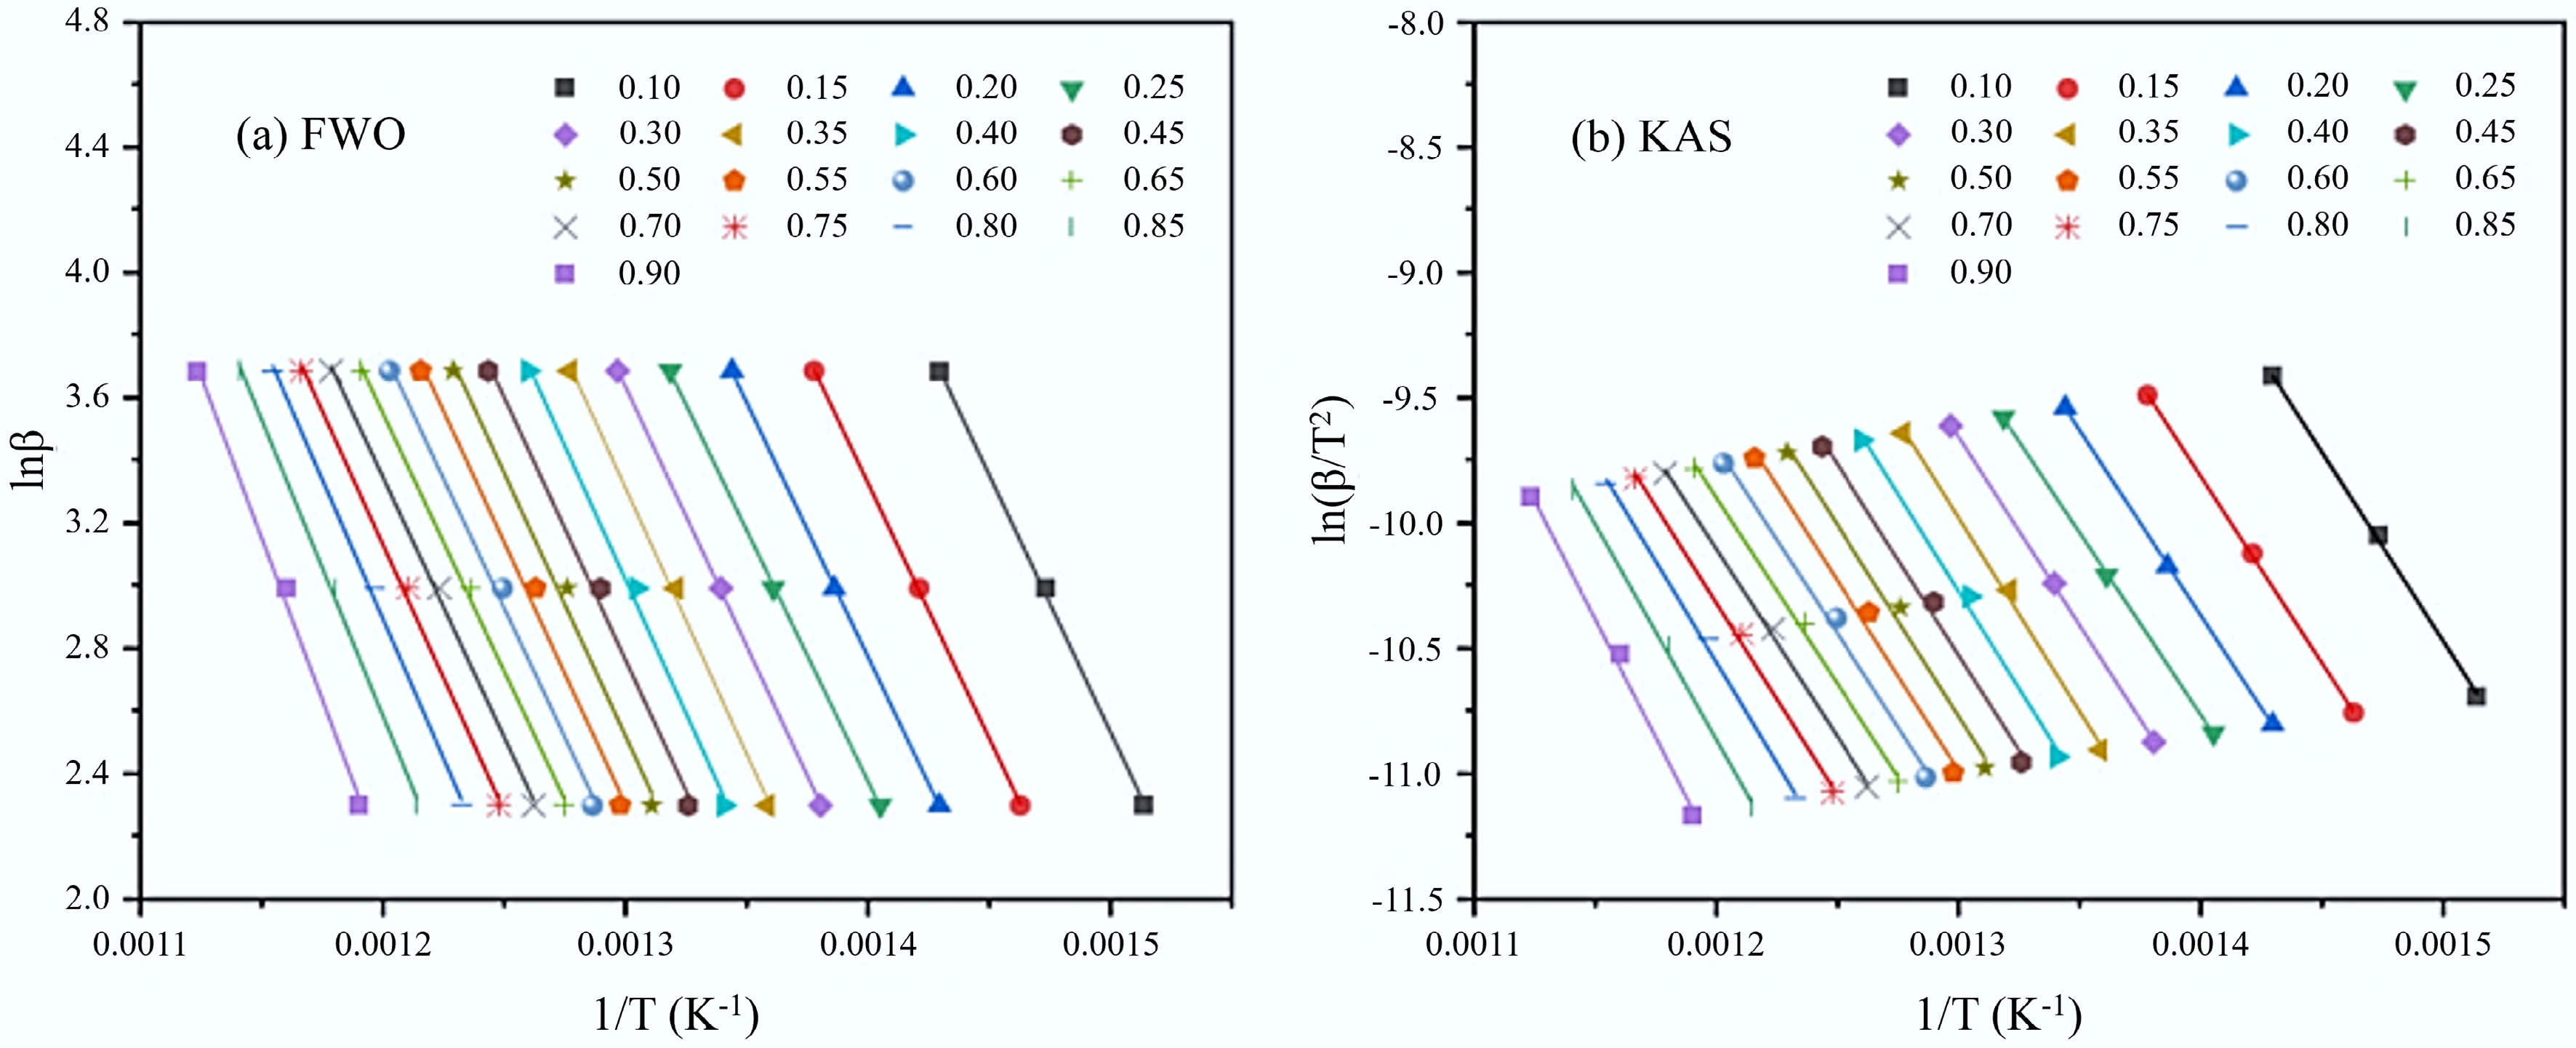
Figure 4.
Activation energy evaluation of BC100: (a) FWO, (b) KAS.
-
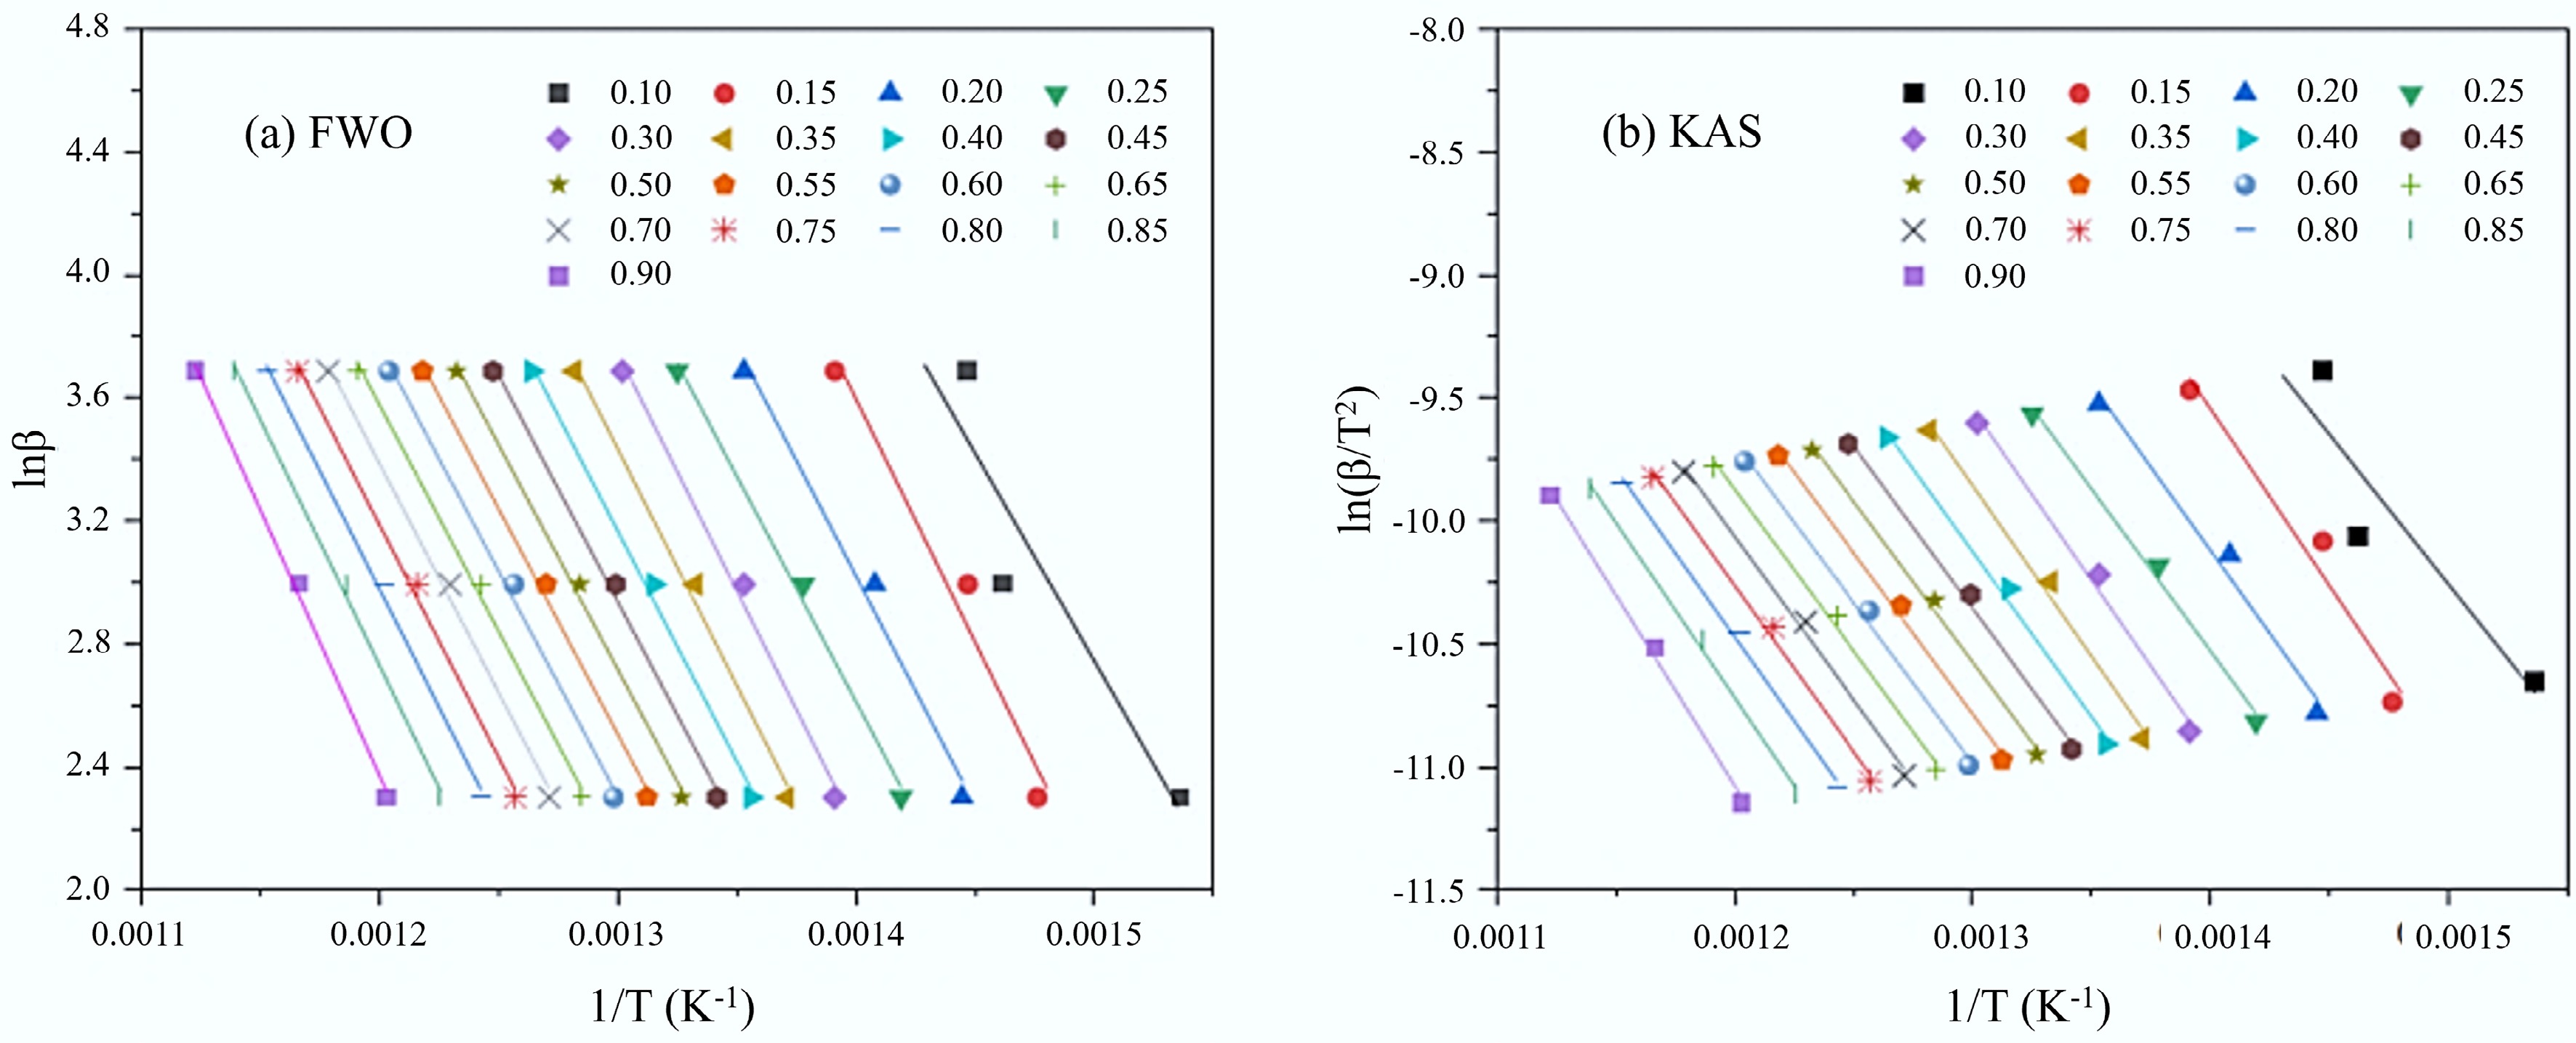
Figure 5.
Activation energy evaluation of BC95OCW5: (a) FWO, (b) KAS.
-
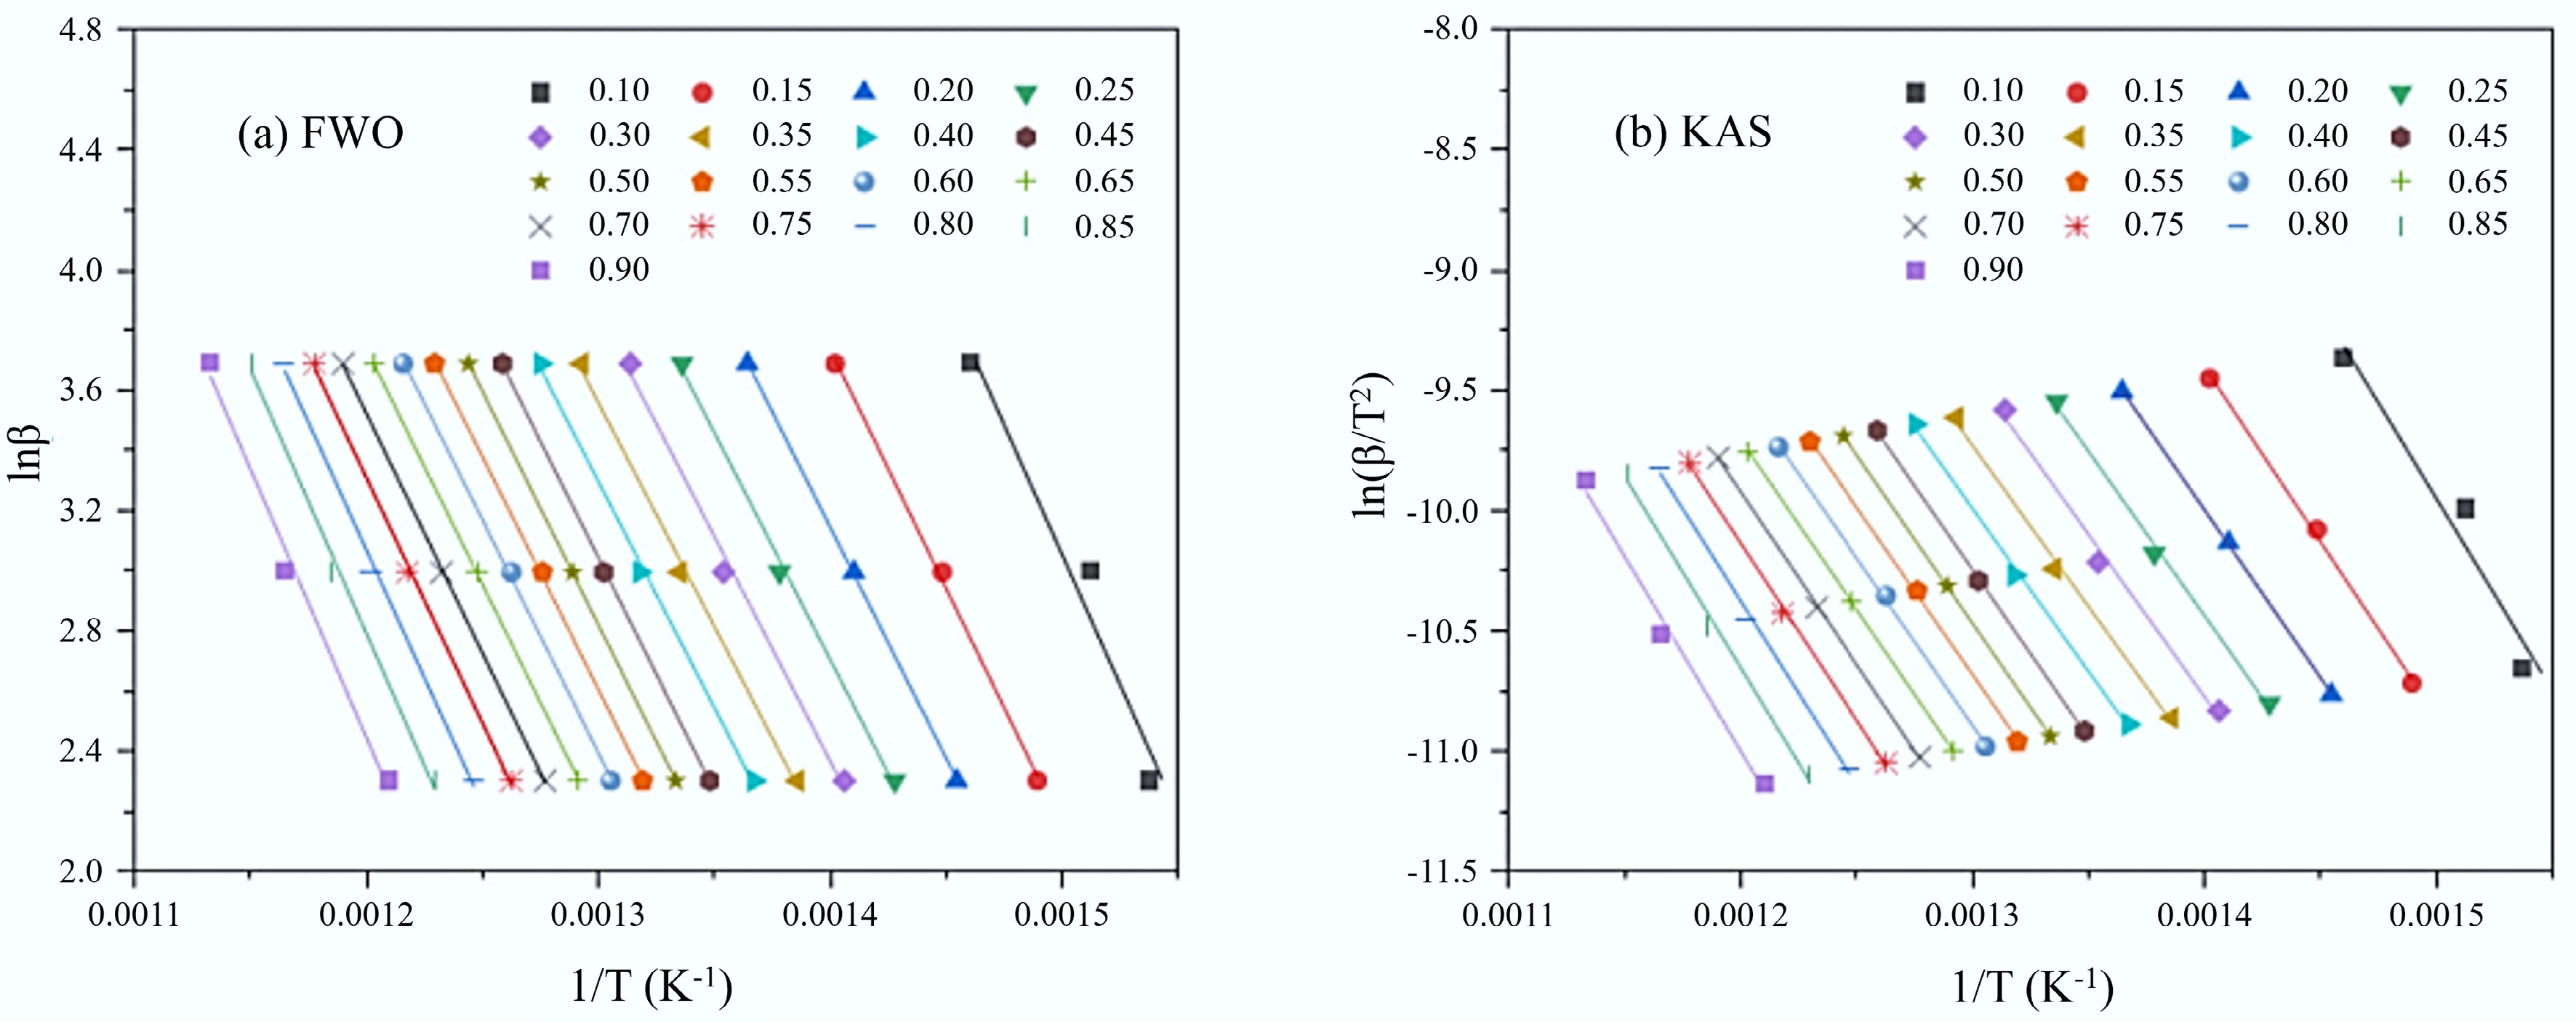
Figure 6.
Activation energy evaluation of BC90OCW10: (a) FWO, (b) KAS.
-
Sample Proximate analysis (Air dry basis, wt%) Ultimate analysis (Air dry basis, wt%) LHV (kJ·kg−1) Mad Aad Vad FCad* Cad Had Oad* Nad Sad BC 5.97 24.42 20.25 49.36 61.34 1.65 5.31 0.67 0.64 24,675 M: moisture; A: ash yield; VM: volatile matter; FC: fixed carbon; LHV: lower heating value; *: calculated by subtraction. Table 1.
Proximate and ultimate analyses and lower heating value of the BC
-
pH COD (Cr) (mg·L−1) Fe (mg·L−1) Na (mg·L−1) Cl (mg·L−1) NH3-N (mg·L−1) TDS (mg·L−1) Color 9.35 55,097 6,783 10,557 12.98 5,068.75 38,380 Aubergine Table 2.
The quality of OCW
-
Sample Β
(°C·min−1)Ti (°C) Tp (°C) Tb (°C) (dw/dt)max
(%·min−1)(dw/dt)mean
(%·min−1)BC100 10 411.58 496.05 674.64 4.74 2.28 BC99
OCW1390.56 483.55 645.80 4.30 2.06 BC97
OCW3398.09 498.41 665.33 4.83 2.43 BC95
OCW5396.76 496.41 664.83 4.60 2.36 BC90
OCW10393.16 485.60 654.25 4.26 2.37 BC100 20 425.75 525.14 688.24 9.38 5.05 BC99
OCW1425.34 521.53 679.54 8.83 4.80 BC97
OCW3419.06 521.59 694.13 8.50 4.42 BC95
OCW5427.91 526.87 691.87 8.41 4.54 BC90
OCW10421.81 528.06 697.42 7.89 4.41 BC100 40 461.54 559.88 708.48 18.43 10.22 BC99
OCW1451.37 556.63 711.08 18.34 10.02 BC97
OCW3453.72 559.60 714.58 18.26 9.86 BC95
OCW5432.33 565.48 721.58 17.21 9.21 BC90
OCW10445.15 558.67 722.45 17.24 9.12 Table 3.
Characteristic temperatures of samples at different heating rates (10, 20, and 40 °C·min−1)
Figures
(6)
Tables
(3)