-
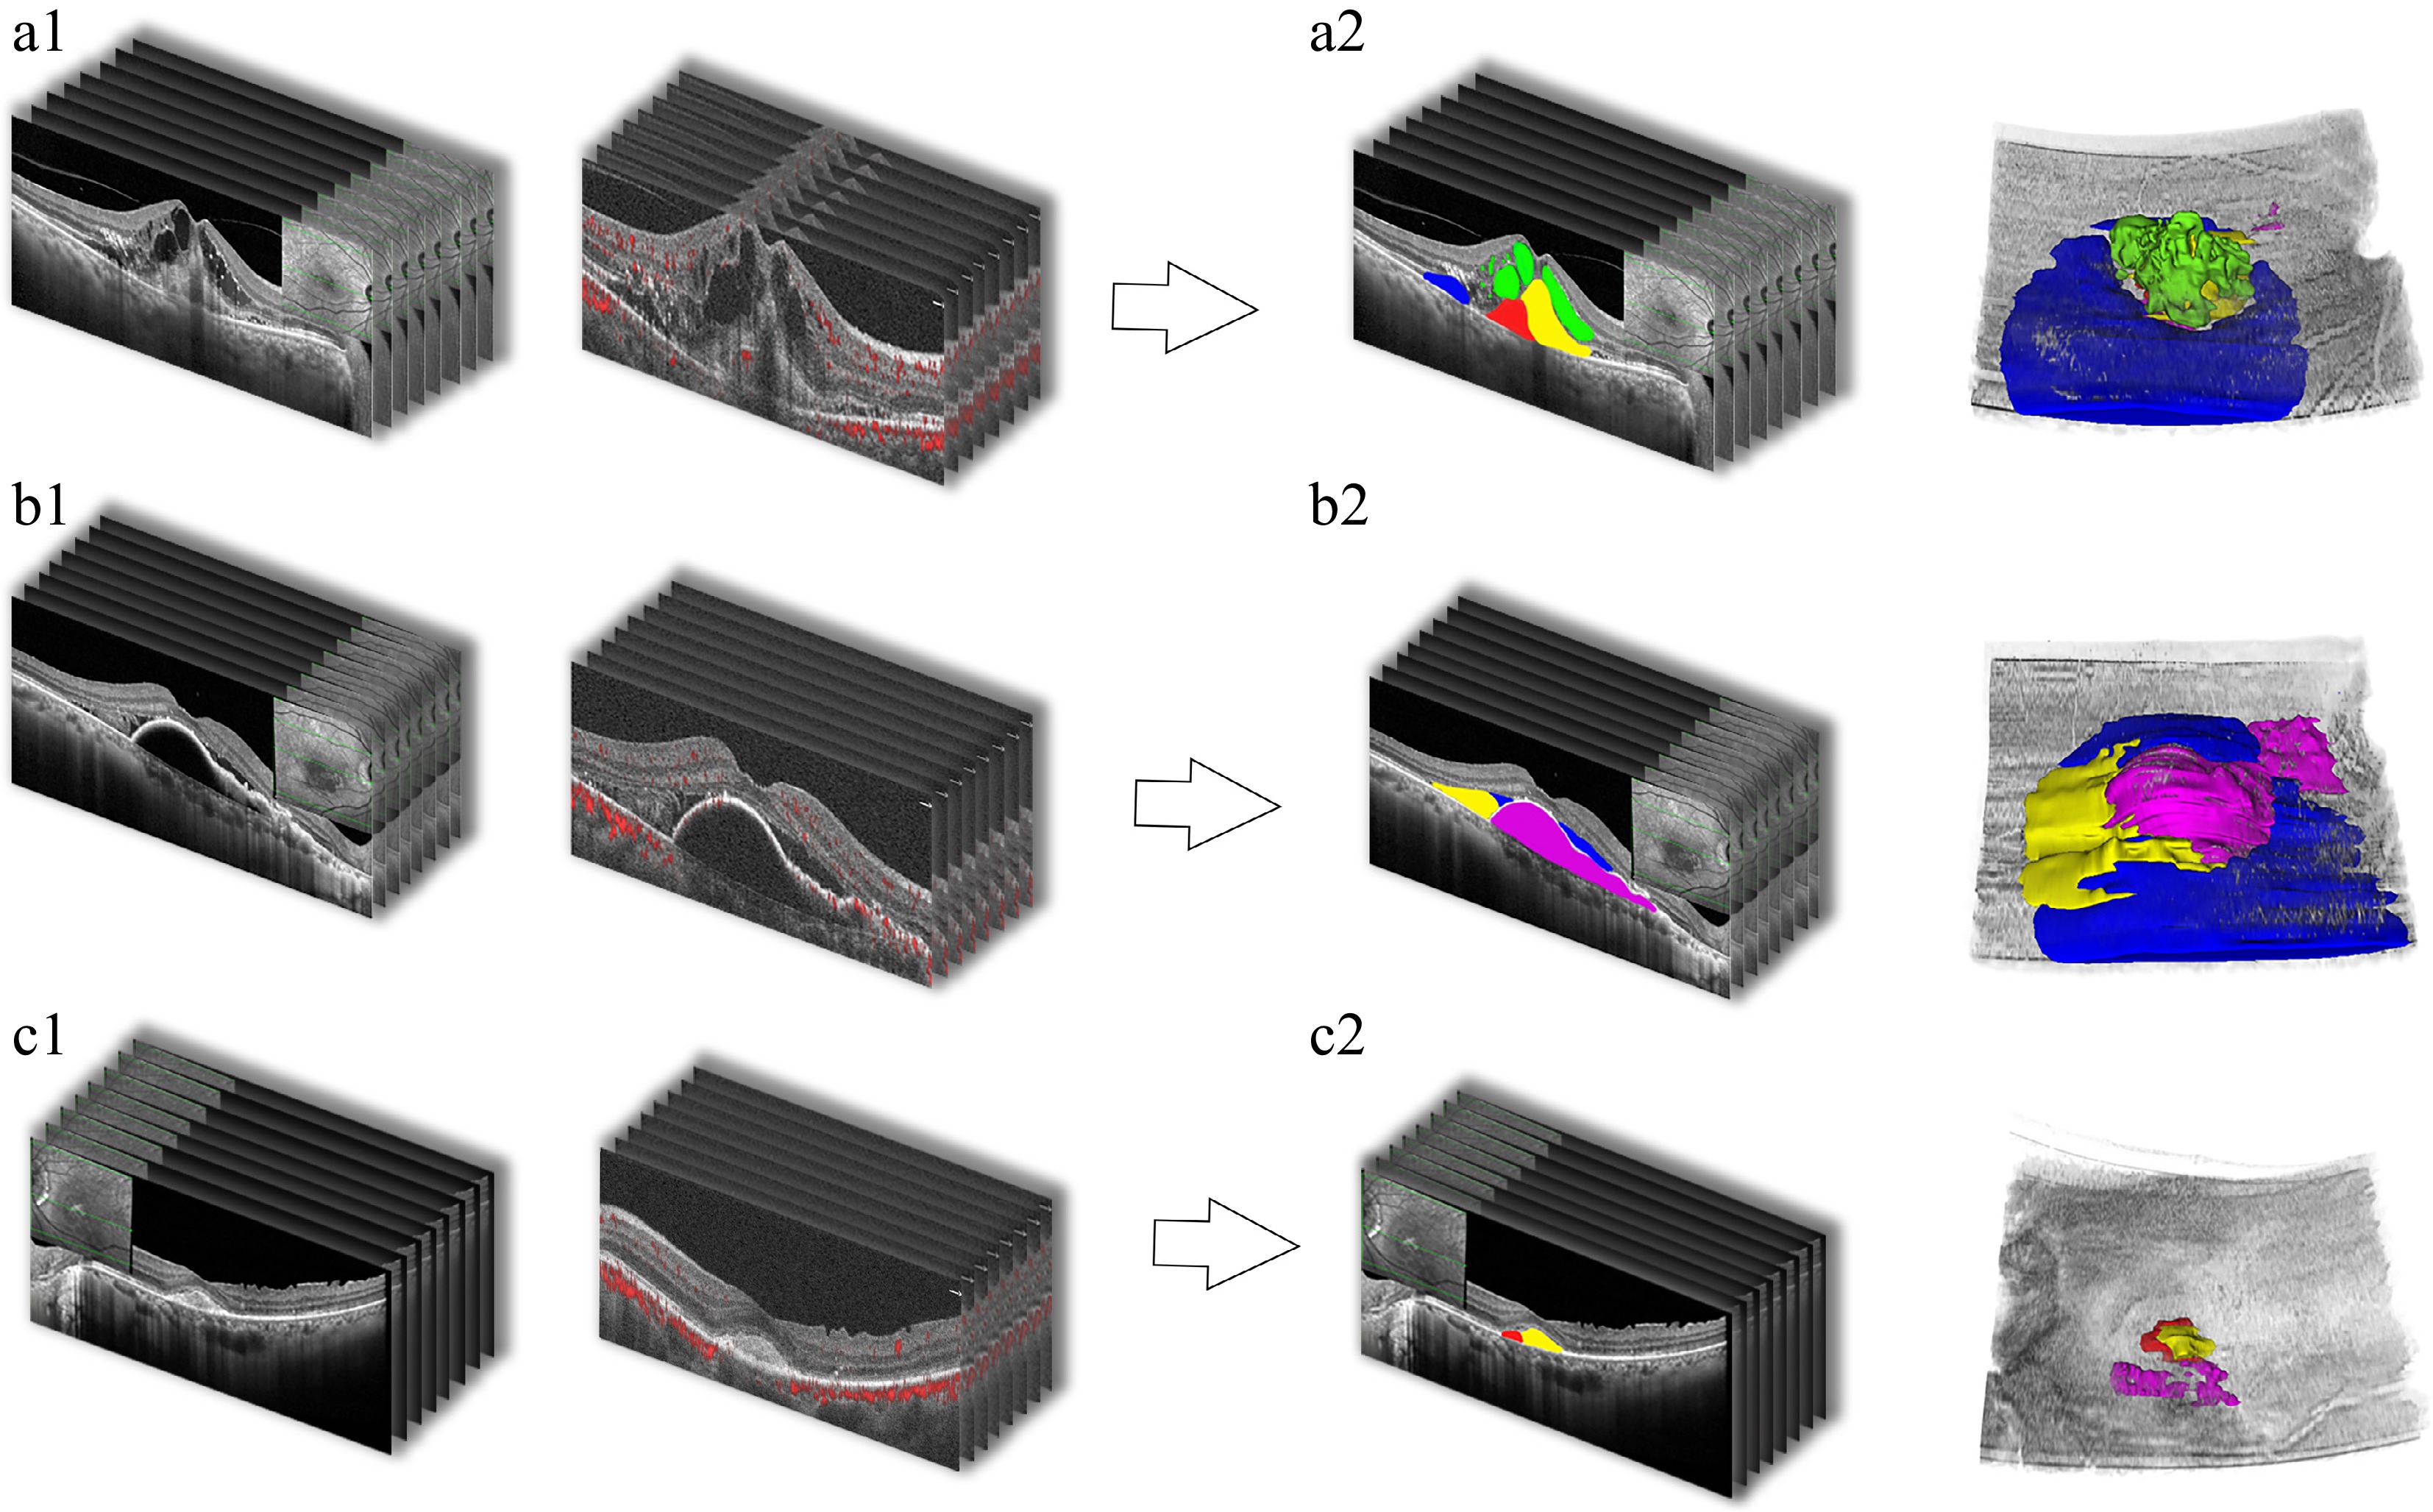
Figure 1.
The 3D baseline OCT/OCTA volumetric reconstruction workflow in three representative nAMD cases (Cases A, B, and C). For each case, subpanels labeled 1 show the raw baseline spectral-domain OCT B-scan stack (left) and the corresponding OCTA B-scan stack with flow signals (right). Subpanels labeled 2 show the color-coded segmentation of lesion components on OCT B-scans (left) and the resulting 3D volumetric reconstruction (right). Color coding: subretinal fluid (SRF, dark blue), intraretinal fluid (IRF, green), vascular subretinal hyperreflective material (vSHRM, red), avascular SHRM (avSHRM, yellow), fibrovascular pigment epithelial detachment (fvPED, brown), and serous PED (sPED, pink).
-
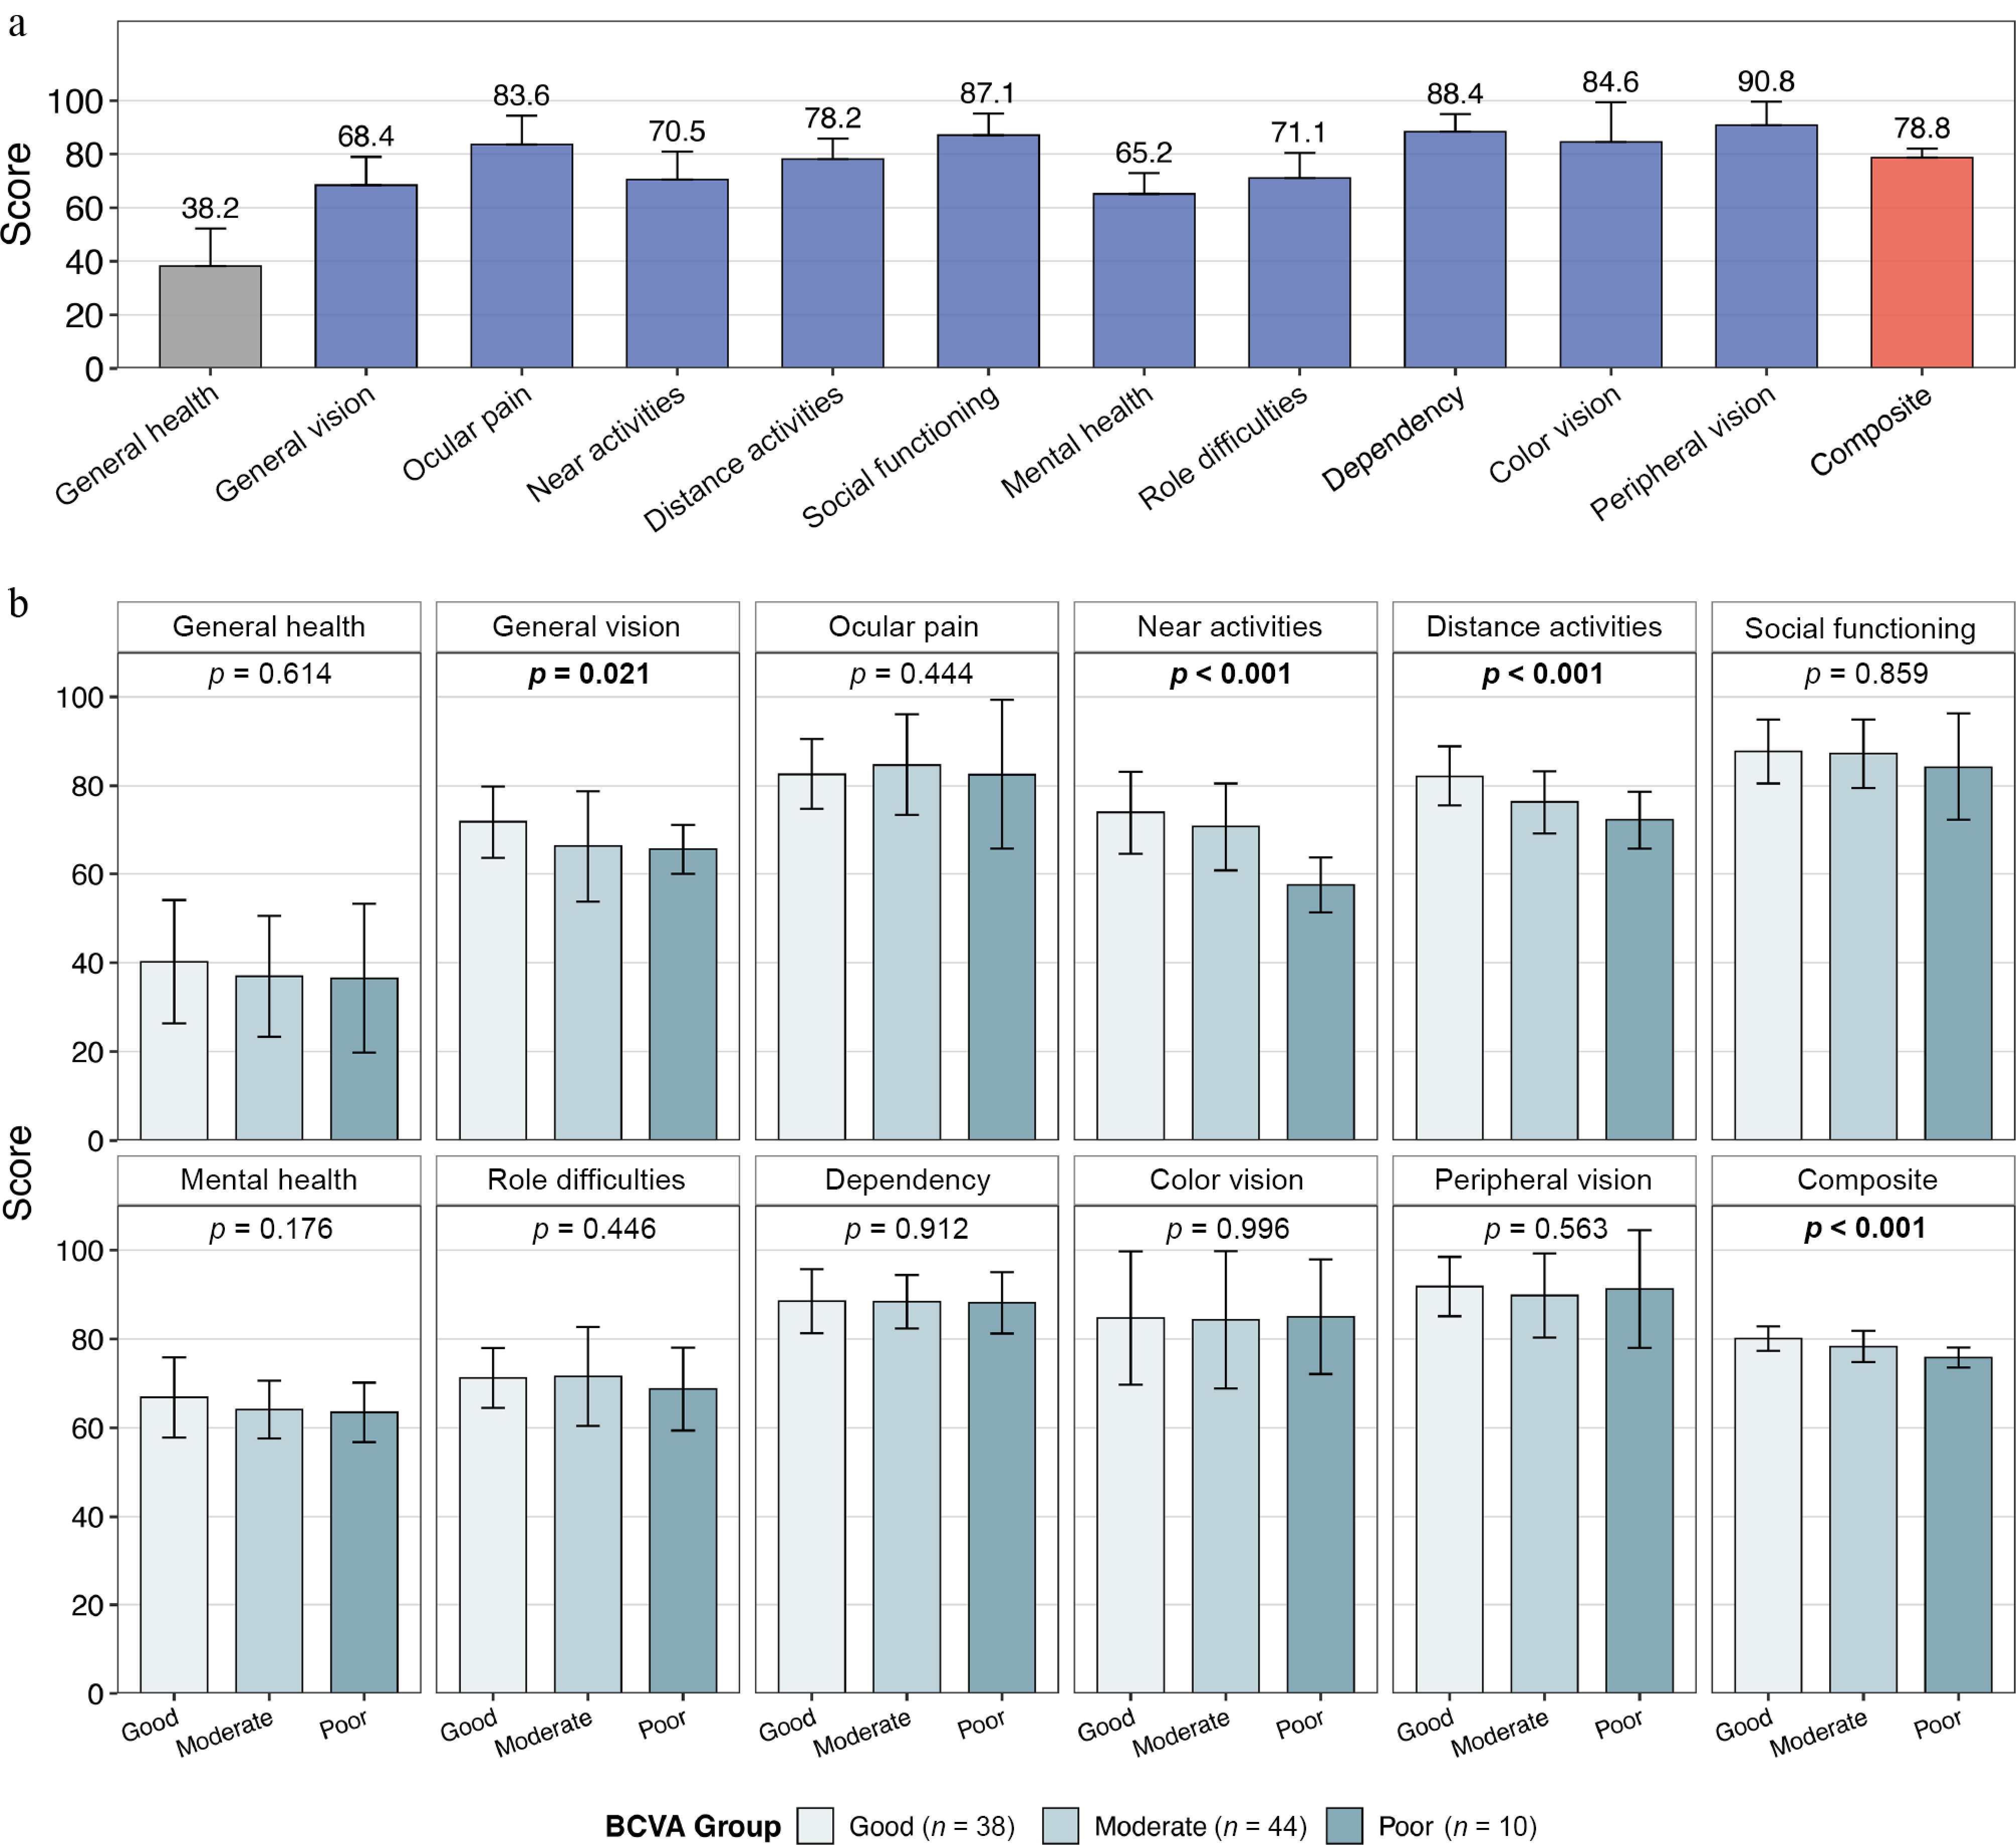
Figure 2.
The NEI VFQ-25 scores in the study cohort. (a) Mean subscale scores for the full cohort (n = 92), ordered by the questionnaire sequence. The composite score is shown on the right. (b) Subscale score distributions across the three 2-year BCVA outcome groups (good, ≤ 0.30 logMAR; moderate, > 0.30 to ≤ 1.00; poor, > 1.00). Bars represent the mean ± SD. The p-values are from Kruskal–Wallis tests; bold indicates p < 0.05.
-
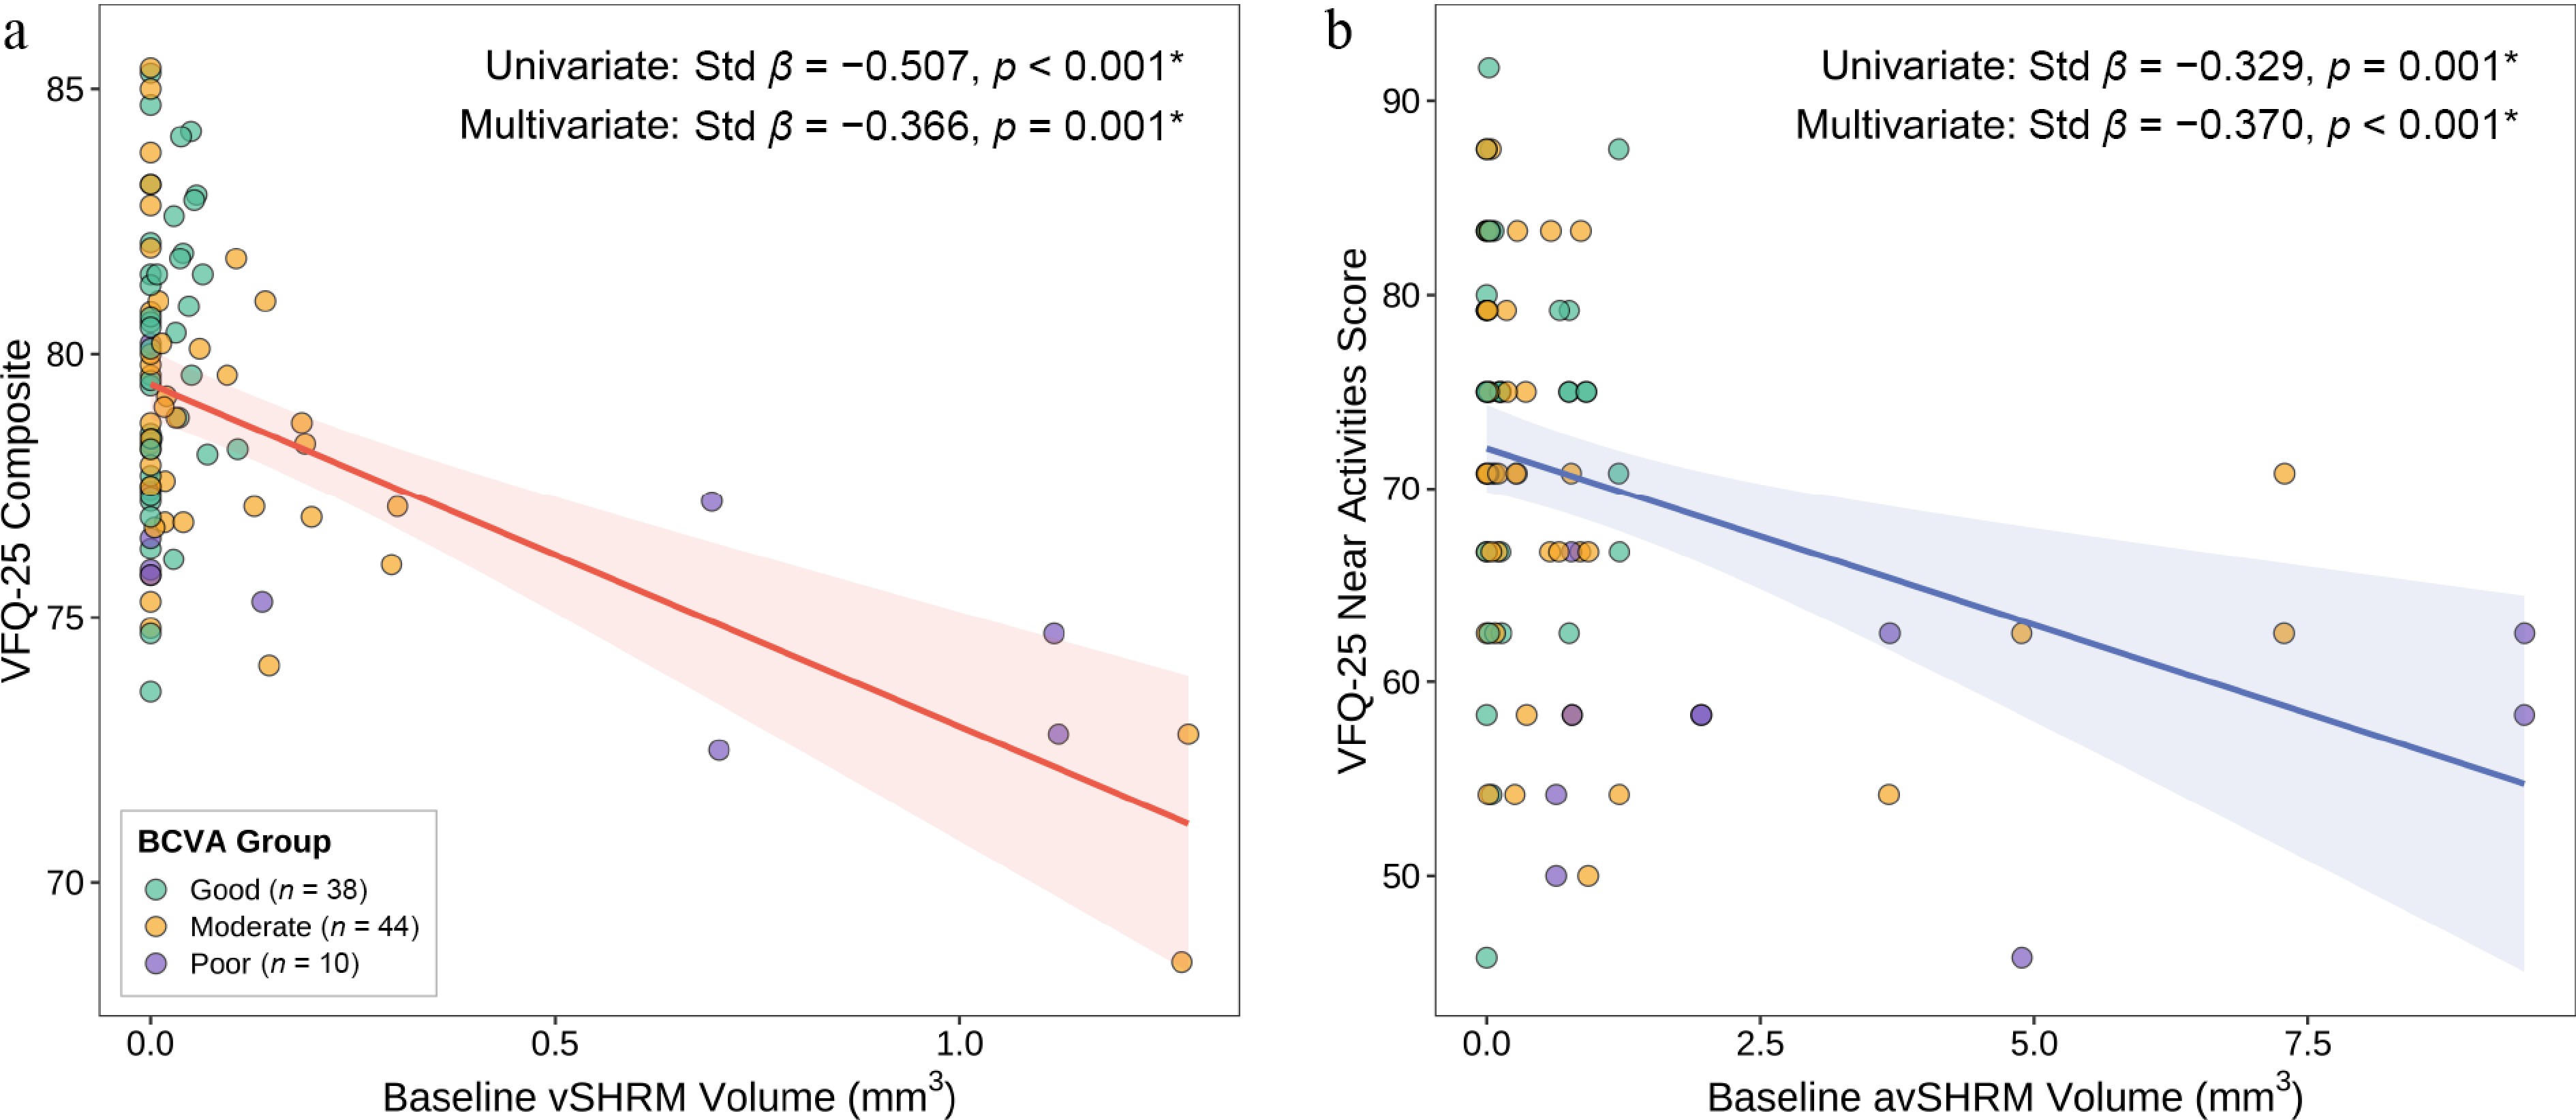
Figure 3.
Scatter plots of the two FDR-surviving baseline biomarker–NEI VFQ-25 associations. (a) Baseline vSHRM volume versus the NEI VFQ-25 composite score. (B) Baseline avSHRM volume versus the NEI VFQ-25 near activities score. Each point represents one eye, color-coded by 2-year BCVA outcome group. Solid lines and shaded bands show the fit of ordinary least squares regression and the 95% confidence intervals. Univariate and multivariate standardized β and p-values are annotated in each panel.
-
Characteristic Value Age, years 65.8 ± 7.3 Male sex, n (%) 70 (76.1%) MNV type, n (%) Type 1 (PCV) 46 (50.0%) Type 1 (non-PCV) 10 (10.9%) Type 2 36 (39.1%) Symptom duration, months 10.3 ± 15.7 2-year injection count 5.9 ± 3.2 Anti-VEGF agent, n (%) Ranibizumab 36 (39.1%) Aflibercept 20 (21.7%) Conbercept 36 (39.1%) Systemic conditions, n (%) Hypertension 36 (39.1%) Diabetes mellitus 8 (8.7%) Visual acuity, logMAR Baseline BCVA, study eye 0.6 ± 0.4 2-year BCVA, study eye 0.5 ± 0.4 2-year BCVA, fellow eye 0.2 ± 0.1 2-year BCVA group, n (%) Good (≤ 0.30) 38 (41.3%) Moderate (0.30–1.00) 44 (47.8%) Poor (> 1.00) 10 (10.9%) Baseline lesion volumes, mm³ IRF 0.06 ± 0.16 SRF 0.38 ± 0.60 vSHRM 0.10 ± 0.27 avSHRM 0.85 ± 1.86 sPED 0.34 ± 1.14 Total lesion volume 2.55 ± 3.34 Values reported as the mean ± SD. BCVA, best-corrected visual acuity; IQR, interquartile range; MNV, macular neovascularization; PCV, polypoidal choroidal vasculopathy; SHRM, subretinal hyperreflective material (av, avascular; v, vascular); SRF, subretinal fluid; IRF, intraretinal fluid; sPED, serous pigment epithelial detachment. Table 1.
Demographic and clinical characteristics of the study cohort.
-
Subscale All (n = 92) Good (n = 38) Moderate (n = 44) Poor (n = 10) p-value Distance activities 78.2 ± 7.7 82.1 ± 6.7 76.2 ± 7.1 72.1 ± 6.5 < 0.001 Near activities 70.5 ± 10.4 73.8 ± 9.3 70.6 ± 9.9 57.5 ± 6.2 < 0.001 Composite 78.8 ± 3.4 80.1 ± 2.8 78.3 ± 3.5 75.8 ± 2.3 < 0.001 General vision 68.4 ± 10.6 71.7 ± 8.2 66.2 ± 12.5 65.5 ± 5.5 0.021 Mental health 65.2 ± 7.7 66.8 ± 9.0 64.1 ± 6.5 63.5 ± 6.7 0.176 Ocular pain 83.6 ± 10.8 82.6 ± 8.0 84.7 ± 11.4 82.5 ± 16.9 0.444 Role difficulties 71.1 ± 9.3 71.2 ± 6.7 71.6 ± 11.1 68.7 ± 9.3 0.446 Peripheral vision 90.8 ± 8.9 91.8 ± 6.7 89.8 ± 9.4 91.2 ± 13.2 0.563 General health 38.2 ± 14.0 40.2 ± 13.9 36.9 ± 13.6 36.5 ± 16.8 0.614 Social functioning 87.1 ± 8.0 87.7 ± 7.2 87.2 ± 7.7 84.2 ± 12.1 0.859 Dependency 88.4 ± 6.5 88.5 ± 7.2 88.4 ± 6.0 88.1 ± 6.9 0.912 Color vision 84.6 ± 14.8 84.7 ± 15.0 84.3 ± 15.5 85.0 ± 12.9 0.996 Values are the mean ± SD. The p-values are from the Kruskal–Wallis test comparing the three BCVA groups. Bold p-values indicate p < 0.05. Subscales are ordered by p-value (most significant first). Composite = unweighted mean of 10 vision-targeted subscales (excluding general health and driving). Good: ≤ 0.30 logMAR; moderate: 0.30–1.00; poor: > 1.00. Table 2.
The NEI VFQ-25 subscale scores for the full cohort and stratified by 2-year BCVA outcome group.
-
Composite Near activities Distance activities General vision Mental health Role difficulties Std β p Std β p Std β p Std β p Std β p Std β p Univariate IRF −0.148 0.158 −0.062 0.558 −0.031 0.770 −0.083 0.434 0.055 0.604 0.192 0.067 SRF −0.242 0.020 −0.063 0.548 −0.074 0.483 −0.036 0.733 −0.145 0.168 −0.031 0.766 vSHRM −0.507 < 0.001 −0.351 < 0.001 −0.220 0.035 −0.189 0.071 −0.103 0.330 −0.124 0.237 avSHRM −0.098 0.352 −0.329 0.001 −0.251 0.016 −0.013 0.904 0.017 0.874 0.048 0.651 sPED 0.088 0.405 0.192 0.066 0.107 0.310 0.052 0.620 −0.083 0.434 0.034 0.746 Total volume −0.208 0.047 −0.253 0.015 −0.235 0.024 −0.072 0.498 −0.057 0.587 −0.006 0.952 Multivariate vSHRM −0.366 0.001 −0.129 0.286 − − − − − − − − avSHRM − − −0.370 < 0.001 − − − − − − − − Model R2 0.373 0.387 − − − − ΔR2 0.080 0.119 − − − − Univariate and multivariate standardized regression of baseline 3D lesion volumes on NEI VFQ-25 subscale scores. The univariate rows report standard β and p-values for all 36 pairs of baseline biomarker volume measures (avSHRM, IRF, vSHRM, SRF, sPED, total lesion volume) × VFQ-25 subscales (composite, near activities, distance activities, general vision, mental health, role difficulties). p-values shown in bold indicate pairs that survived Benjamini–Hochberg FDR correction at q < 0.05 across the 36 univariate tests. FDR-surviving pairs were then entered into multivariate models adjusting for baseline study-eye BCVA, fellow-eye BCVA, age, sex, MNV type, and anti-VEGF agent; multivariate p-values shown in bold also denote pairs surviving a second round of Benjamini–Hochberg correction applied across the multivariate tests. Model R2 refers to the full multivariate model (biomarker plus all covariates), and ΔR2 is the incremental variance explained by the biomarker term beyond the covariates-only model. BCVA, best-corrected visual acuity; FDR, false discovery rate; MNV, macular neovascularization; SHRM, subretinal hyperreflective material (a, avascular; v, vascular); SRF, subretinal fluid; IRF, intraretinal fluid; sPED, serous pigment epithelial detachment; Std β: standardized beta. Table 3.
Univariate and multivariate standardized regression of the baseline lesion volumes on NEI VFQ-25 subscale scores.
Figures
(3)
Tables
(3)