-
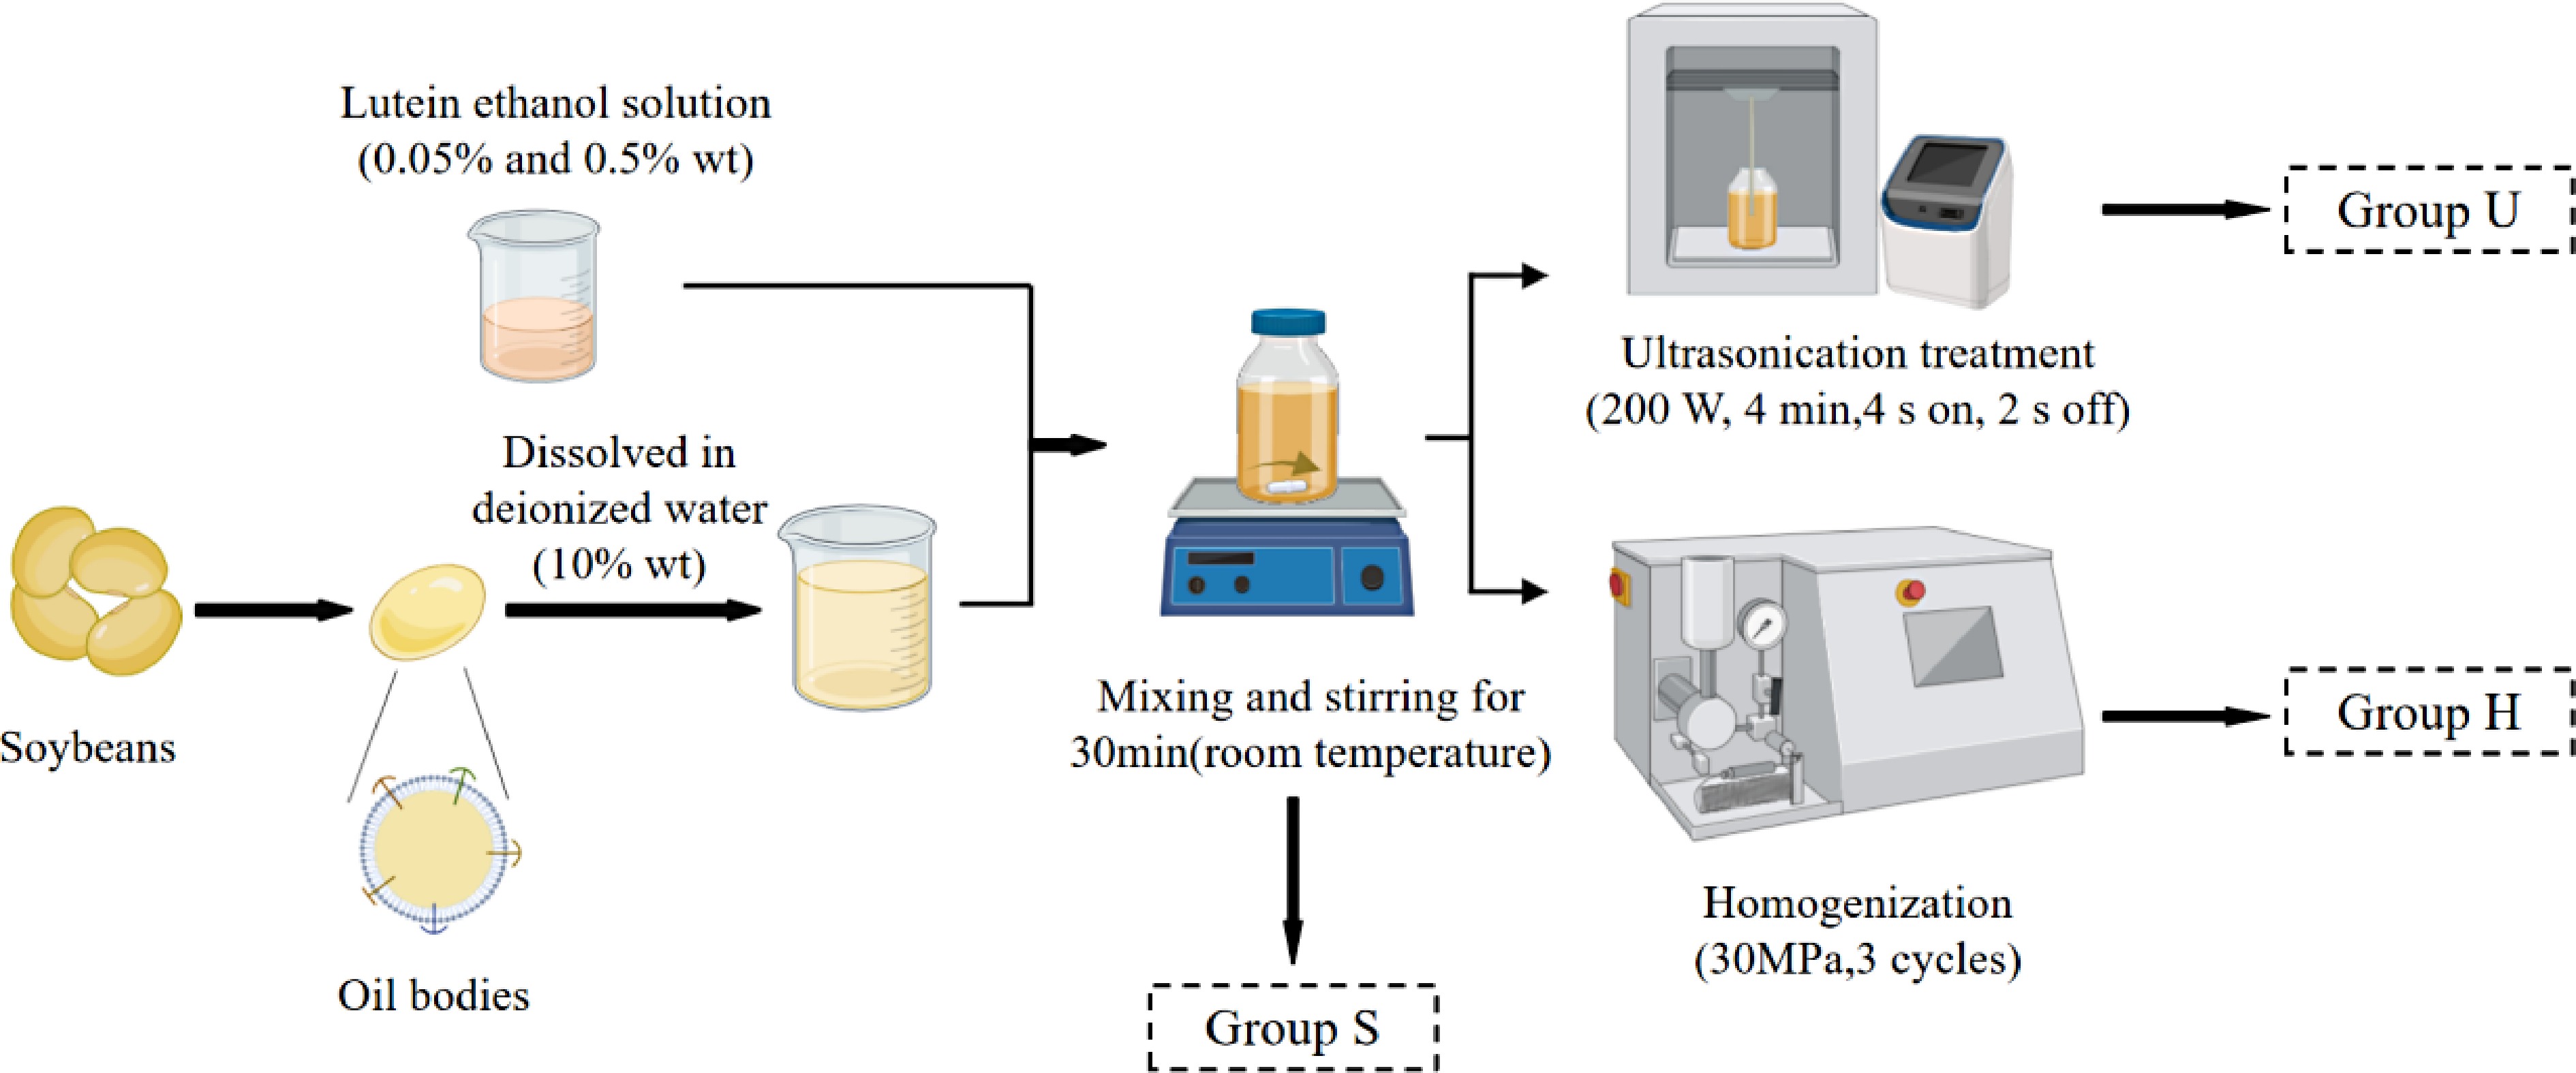
Figure 1.
Flowchart of lutein encapsulation by OB emulsions.
-
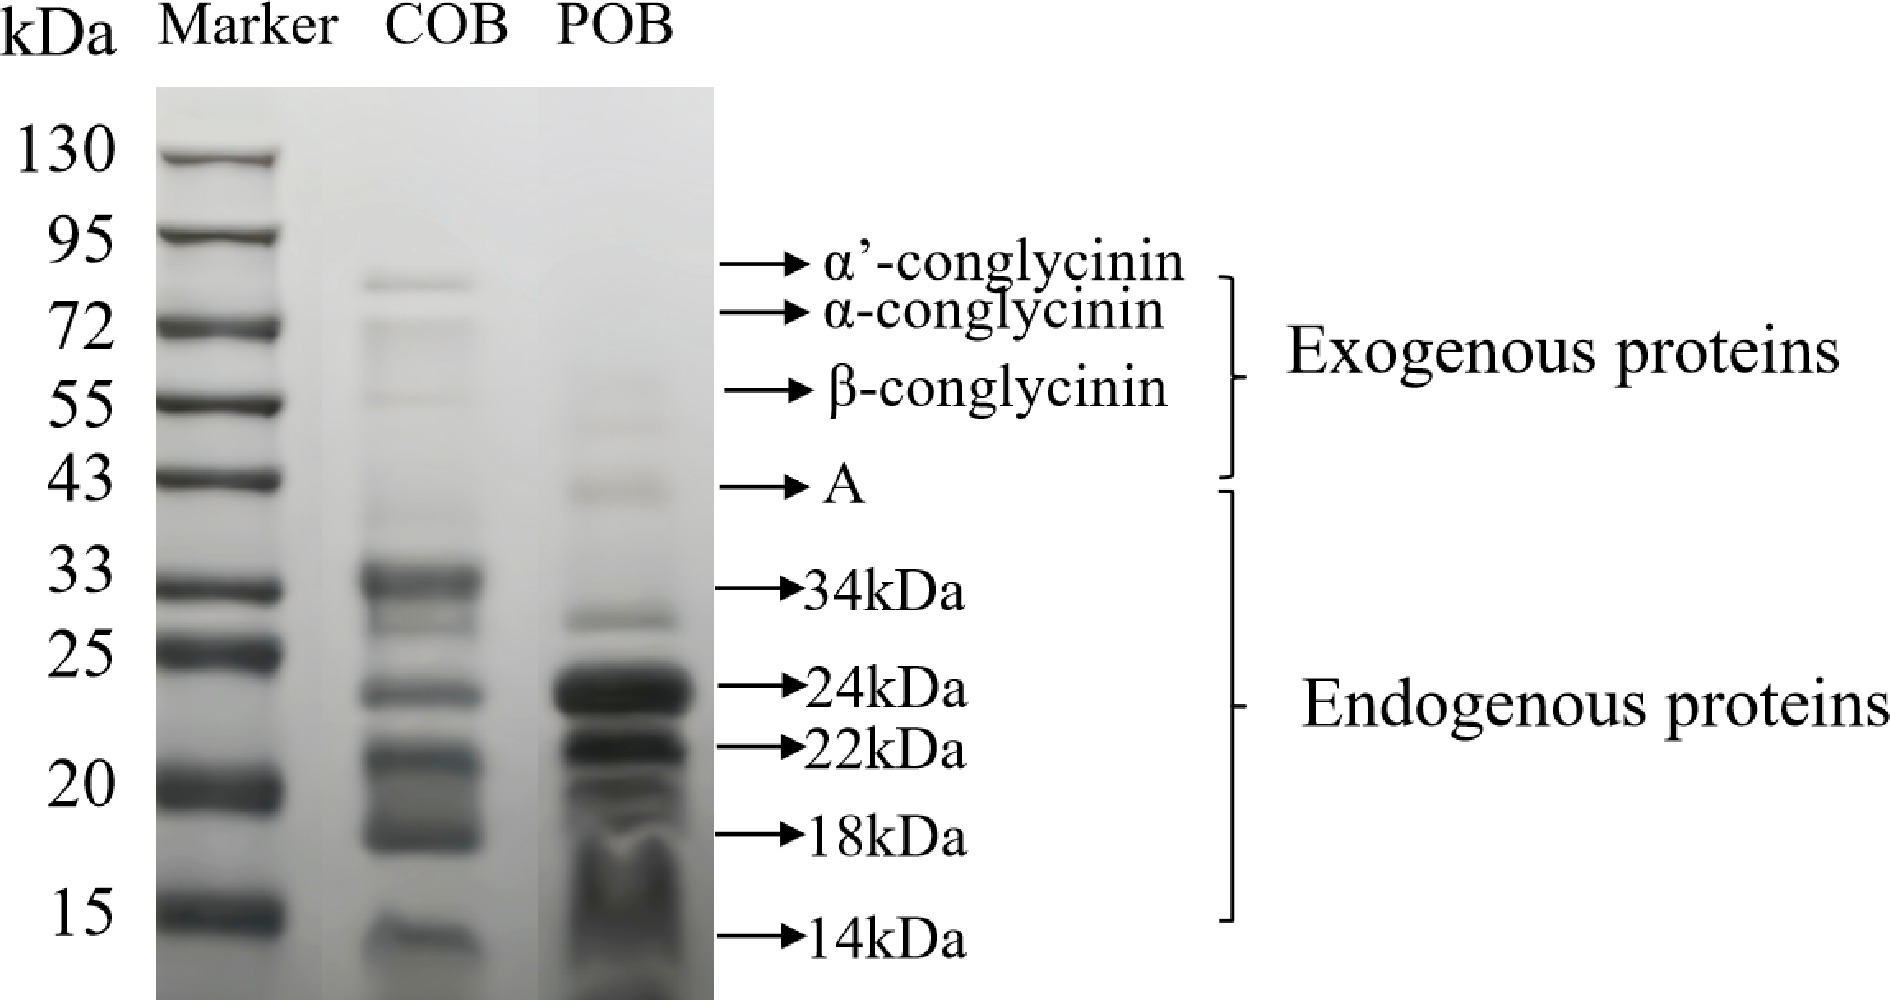
Figure 2.
The protein composition of COBs and POBs determined by SDS-PAGE.
-
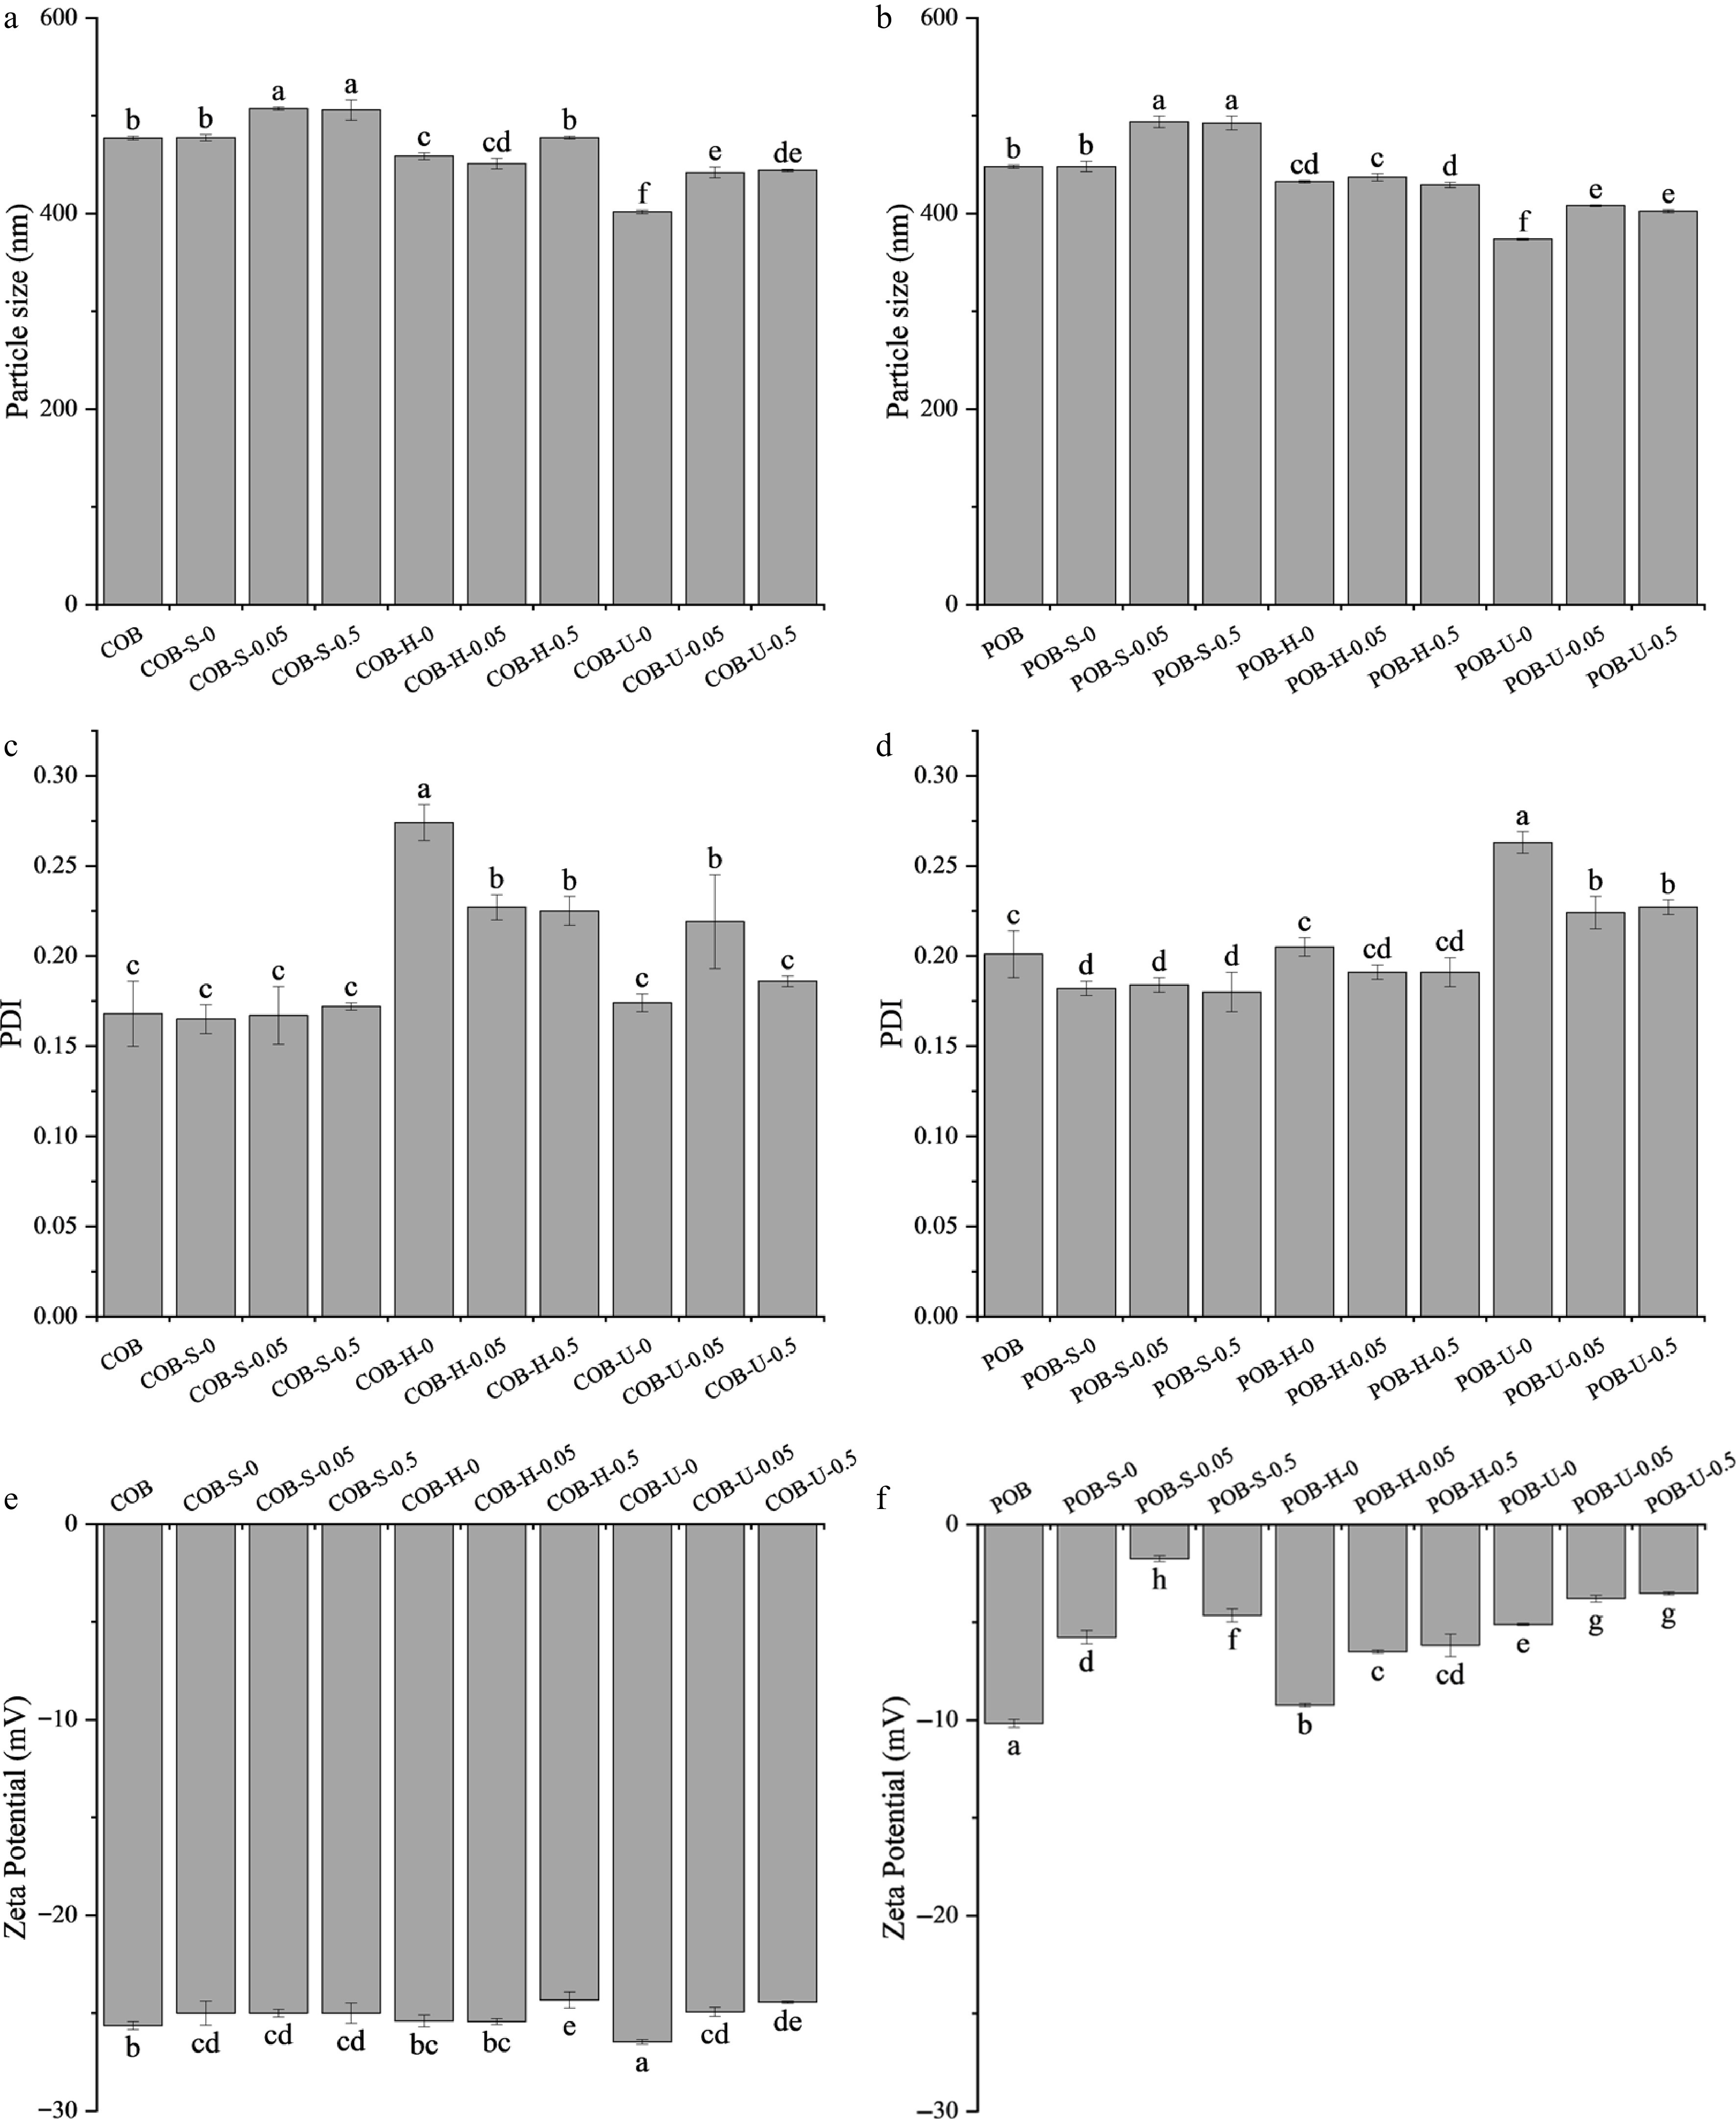
Figure 3.
The zeta potential, particle size, and PDI of emulsions in different treatment groups. (a) The particle size of COB emulsions. (b) The particle size of POB emulsions. (c) The PDI of COB emulsions. (d) The PDI of POB emulsions. (e) The zeta potential of COB emulsions. (f) The zeta potential of POB emulsions.
-
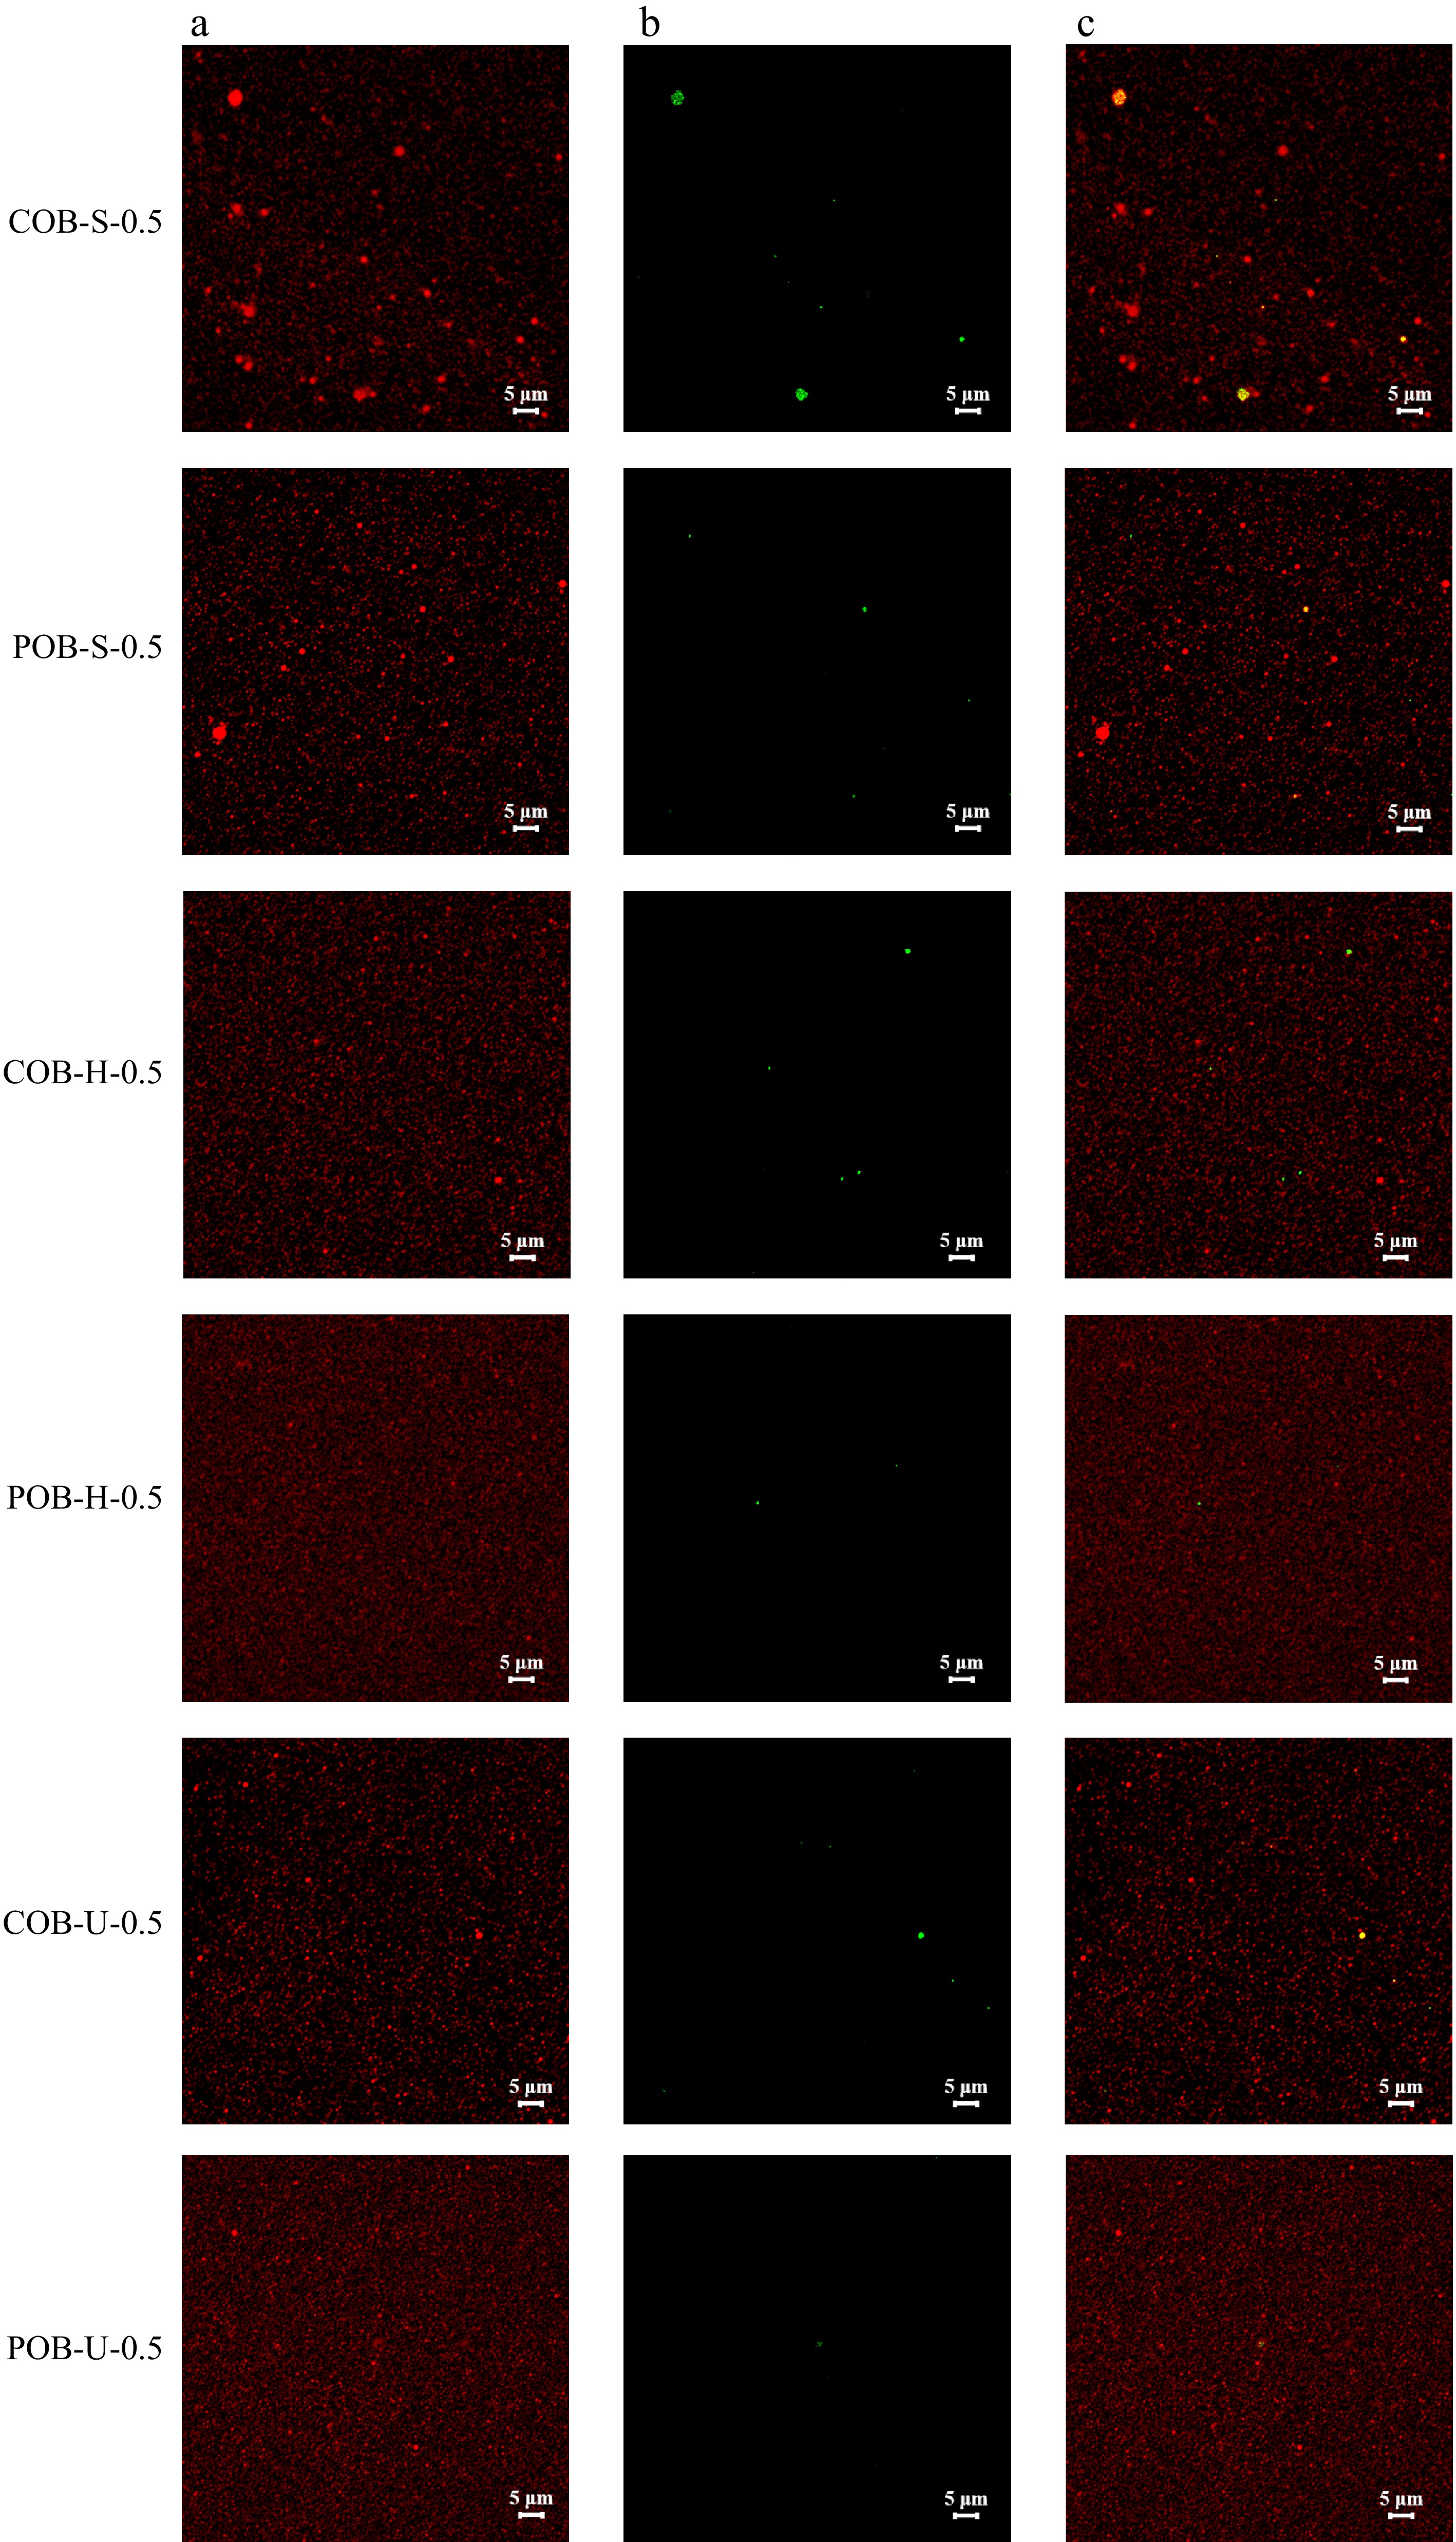
Figure 4.
The CLSM images of COB and POB emulsions stained with (a) Nile red and (b) Rhodamine B, and (c) overlay of Panels (a) and (b). Notes: S: Stirring, H: Homogenization, U: Ultrasonication.
-
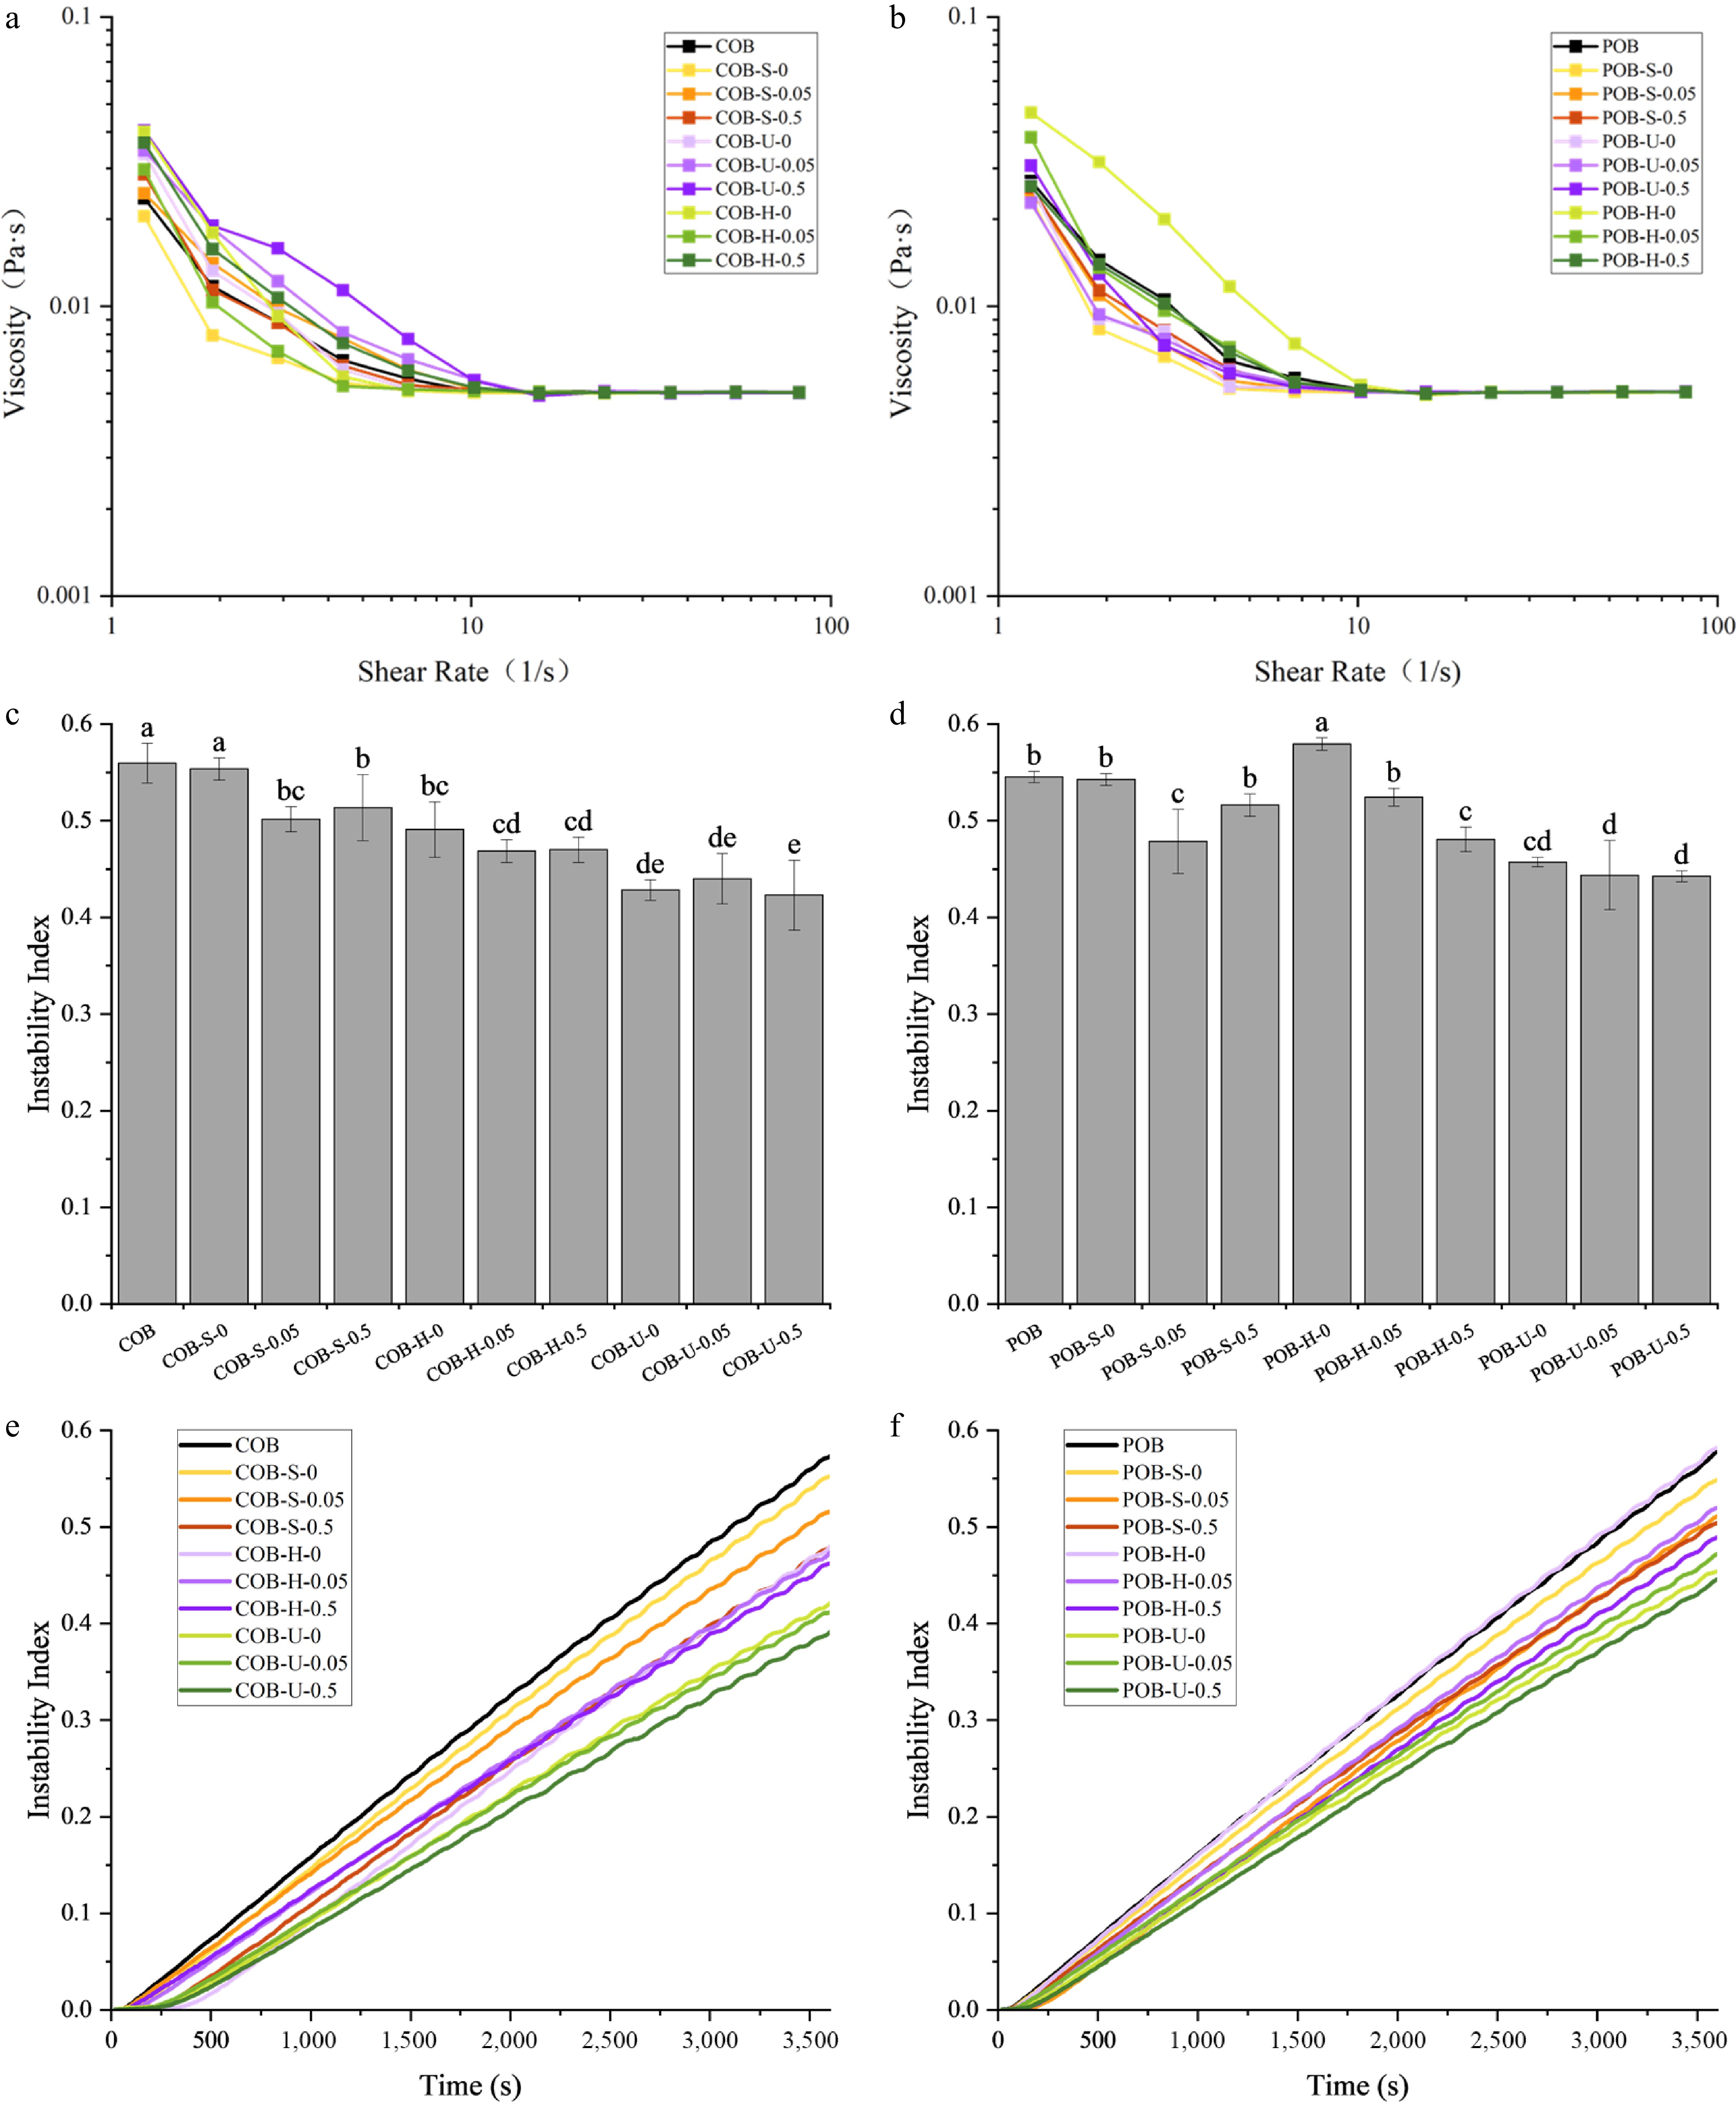
Figure 5.
The physical stability and viscosity of emulsions in different treatment groups. (a) The viscosity of COB emulsions. (b) The viscosity of POB emulsions. (c) The instability index of COBs (LUMi-Sizer). (d) The instability index of POBs (LUMi-Sizer). (e) The instability index over time of COBs (LUMi-Sizer). (f) The instability index over time of POBs (LUMi-Sizer).
-
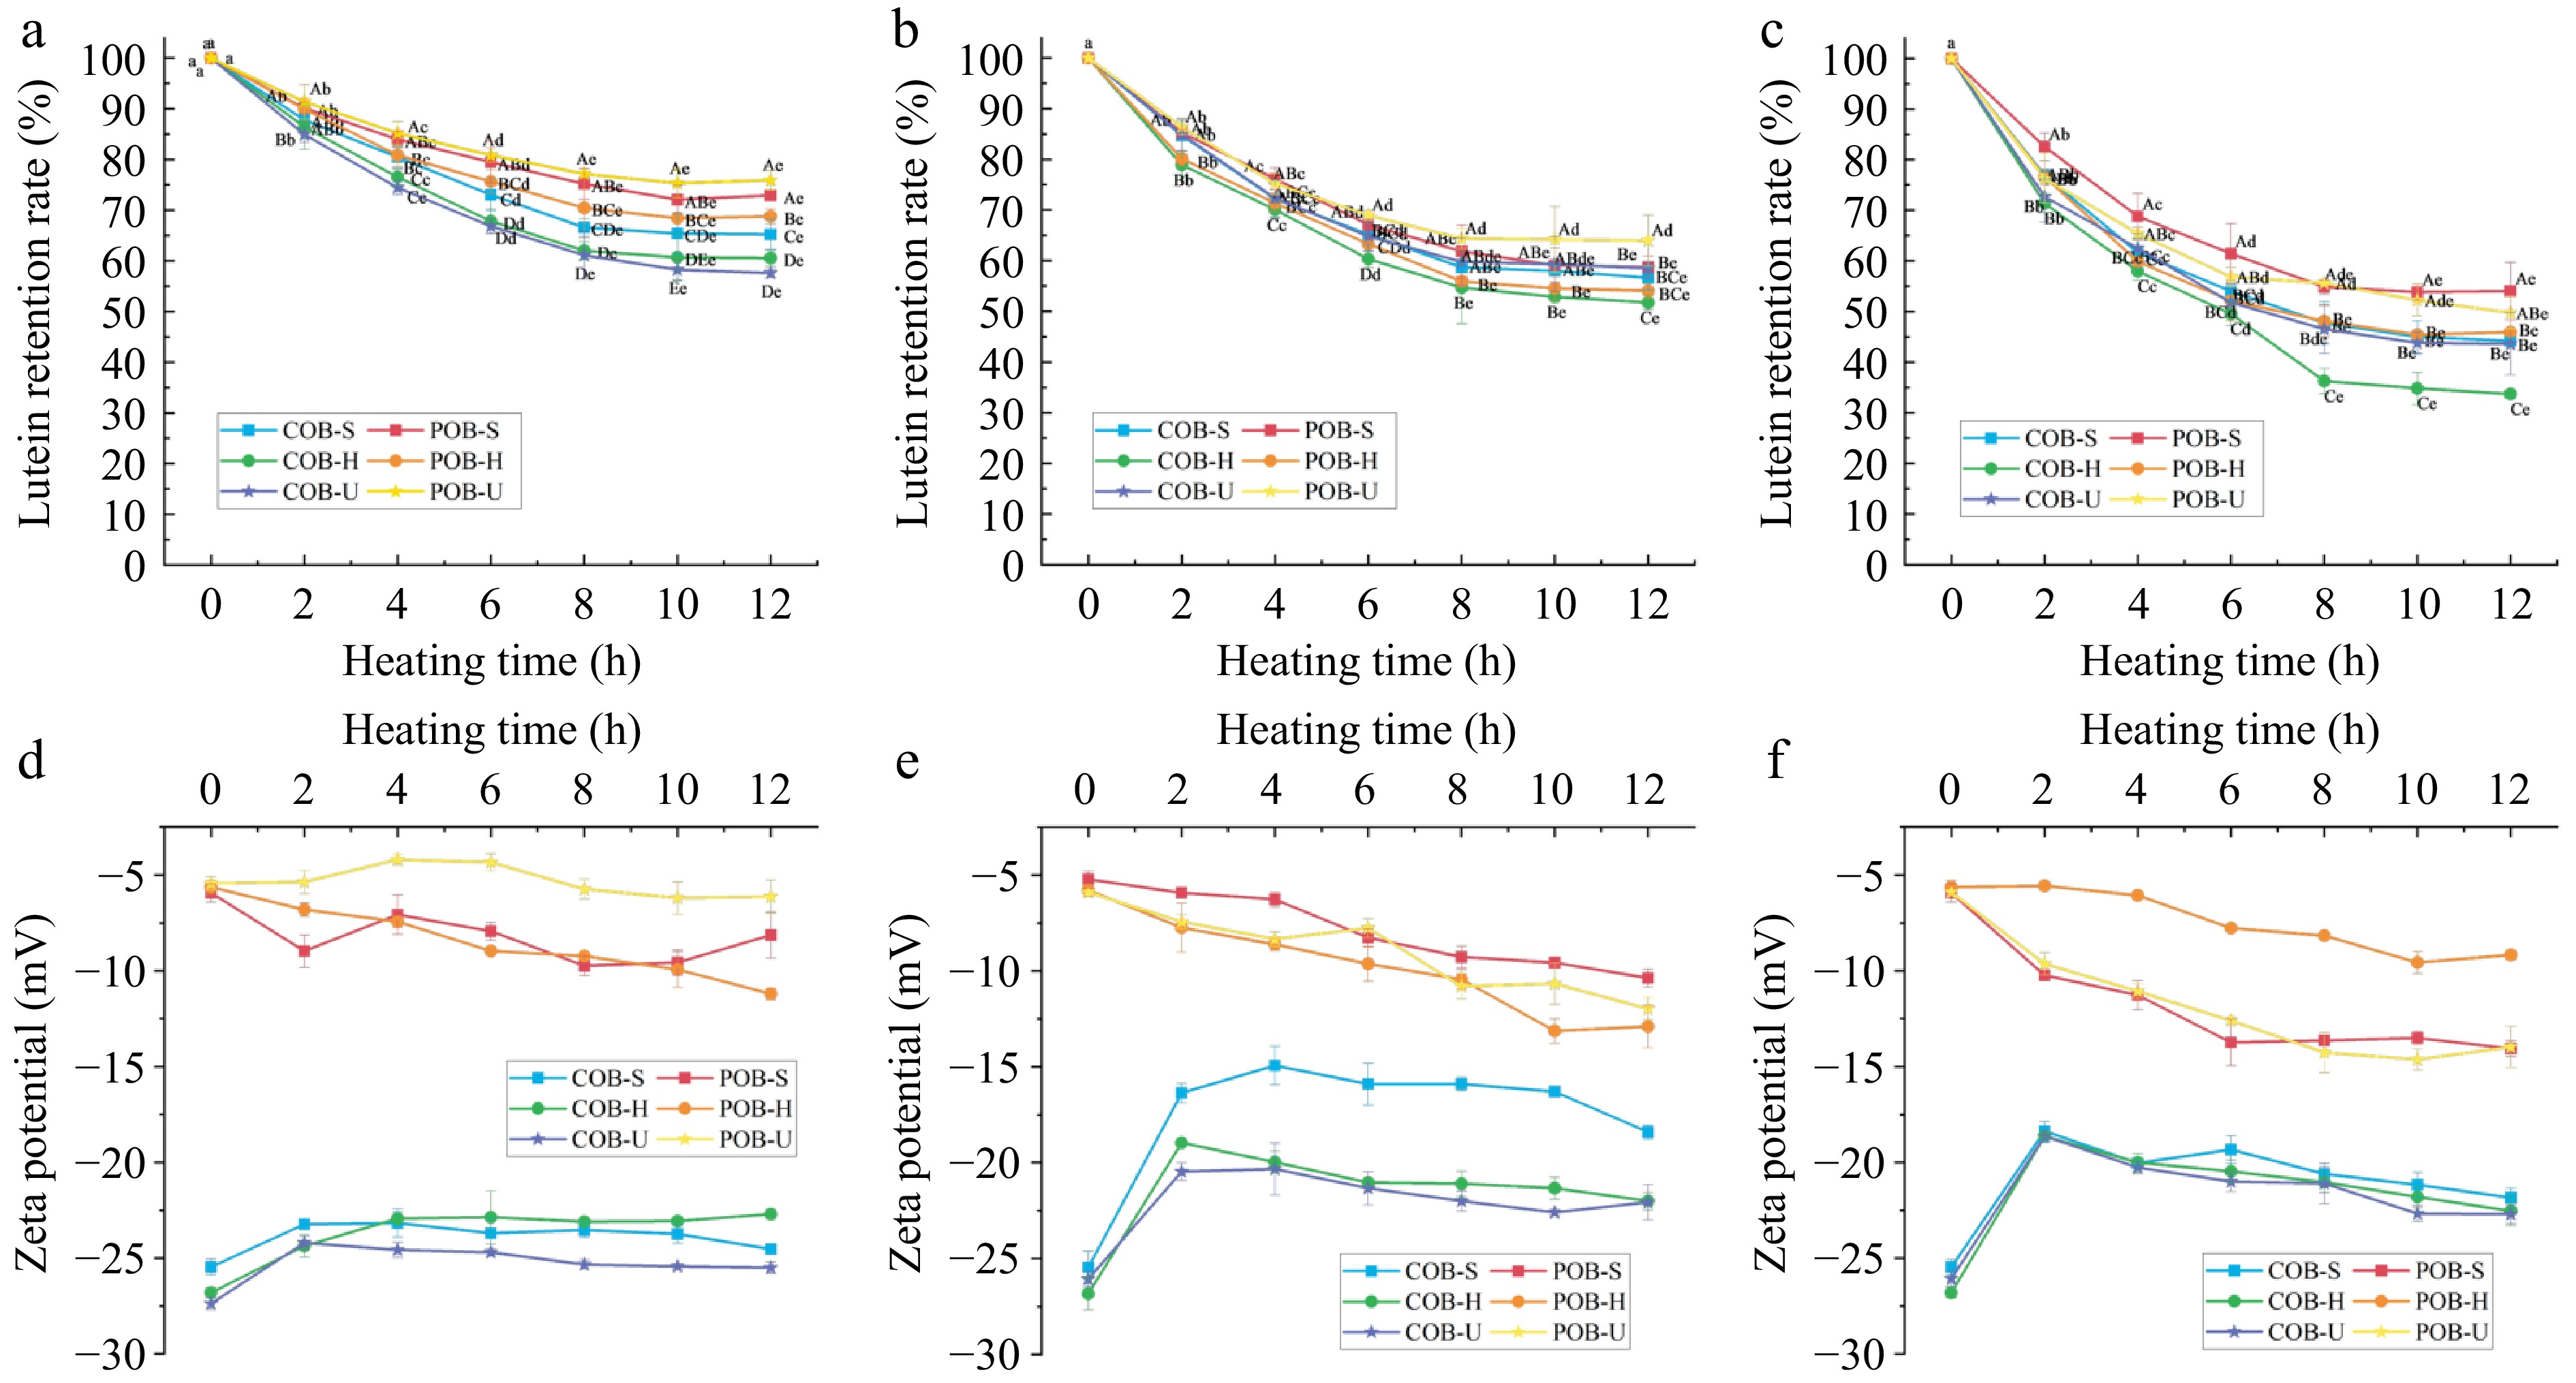
Figure 6.
The lutein retention rate of emulsions (the concentration of lutein–ethanol was 0.5%) in different treatment groups during heating: (a) 60 °C, (b) 75 °C, and (c) 90 °C. The zeta potential of emulsions in different treatment groups during heating: (d) 60 °C, (e) 75 °C, (f) 90 °C.
-
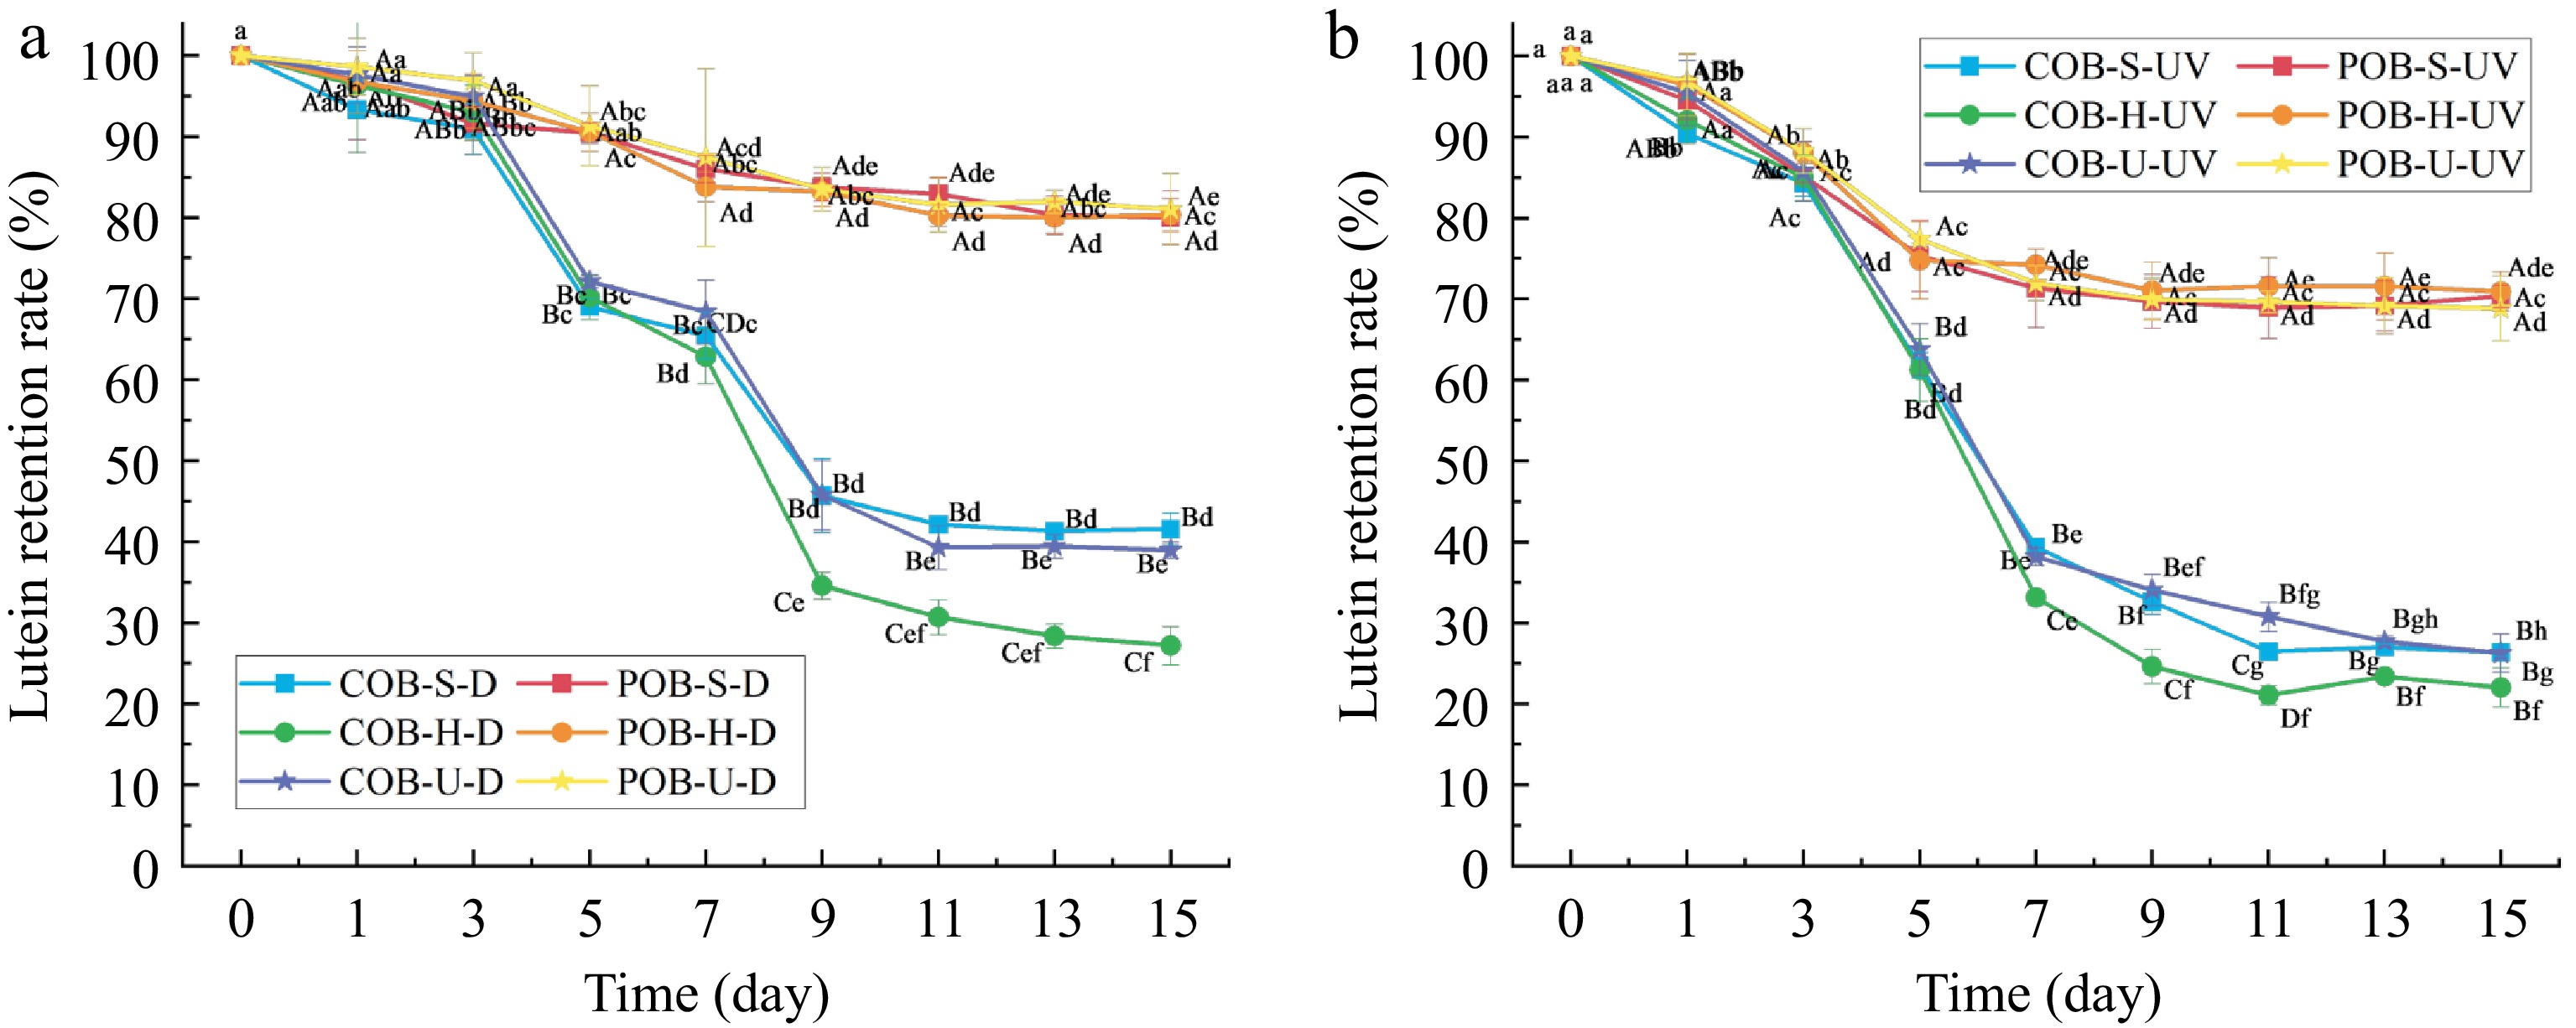
Figure 7.
The lutein retention rate of OB emulsions (the concentration of lutein–ethanol was 0.5%) with different treatments during light exposure. (a) Dark; (b) UV light.
-
Treatment group Encapsulation efficiency (%) Loading efficiency (%) COB-S-0.05 91.11 ± 0.86b 92.15 ± 7.47a COB-H-0.05 94.14 ± 0.36a 66.73 ± 4.08de COB-U-0.05 92.86 ± 0.81ab 83.28 ± 3.53abc COB-S-0.5 72.70 ± 3.63e 86.29 ± 6.67ab COB-H-0.5 77.30 ± 0.55d 74.67 ± 3.15cd COB-U-0.5 63.15 ± 2.45g 86.92 ± 5.78ab POB-S-0.05 90.36 ± 0.43bc 90.42 ± 4.77ab POB-H-0.05 92.04 ± 0.43ab 82.22 ± 3.58bc POB-U-0.05 87.93 ± 0.98c 89.81 ± 1.88ab POB-S-0.5 78.43 ± 1.54d 65.90 ± 4.22de POB-H-0.5 68.41 ± 1.86f 62.55 ± 6.71e POB-U-0.5 63.28 ± 1.70g 68.05 ± 4.36de Notes: S, stirring; h, homogenization; U, ultrasonication. Error bars indicate the standard deviation from triplicate tests. Different letters indicate significant differences (p < 0.05) in different treatment groups. 0.05 and 0.5 represent the concentrations of the lutein–ethanol solution. Table 1.
The encapsulation efficiency and loading efficiency of lutein-loaded OBs emulsions with different treatments.
Figures
(7)
Tables
(1)