-
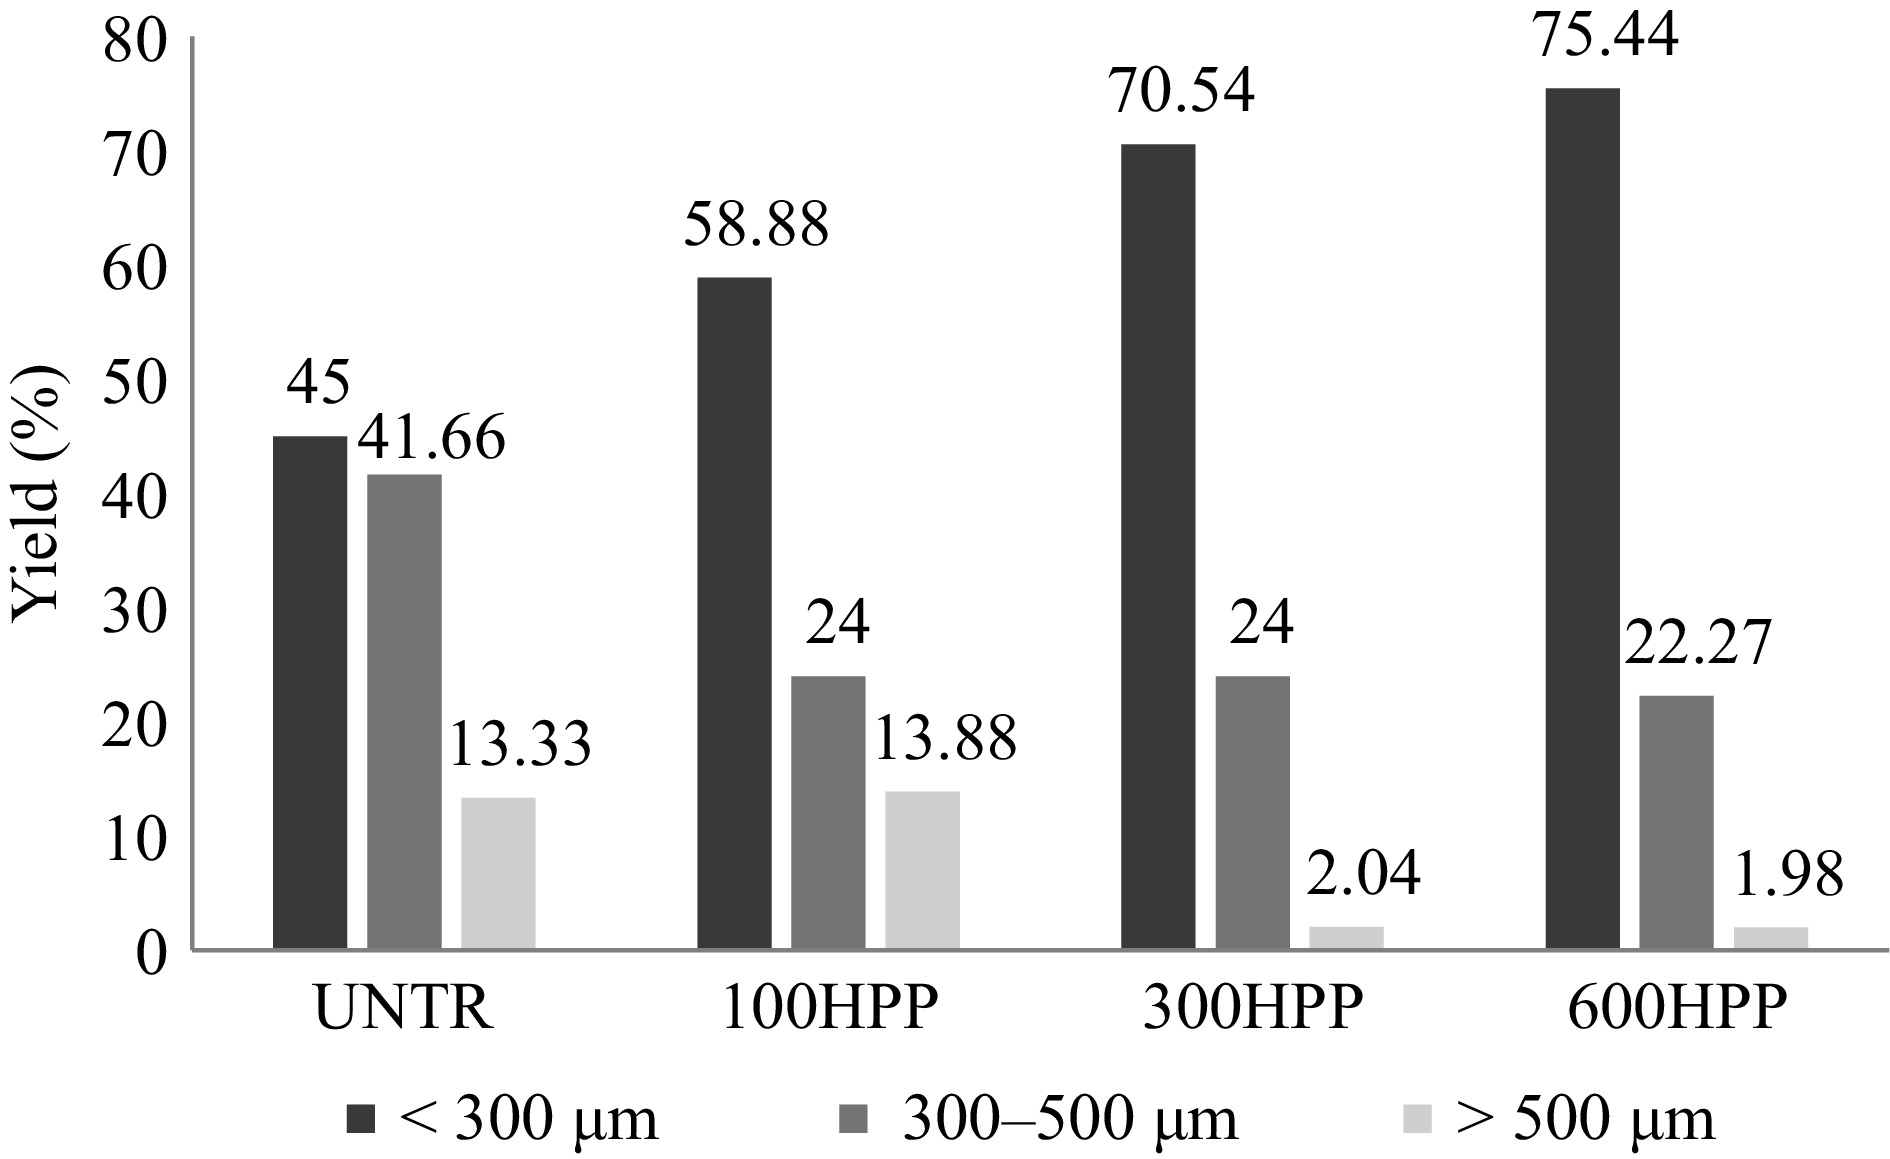
Figure 1.
Particle size distribution of untreated and treated pumpkin flour (PF) after sieving. Data are expressed as percentages. UNTR, untreated sample; 100HPP, 300HPP, and 600HPP: Samples treated by high-pressure processing. Sieve sizes: < 300, 300–500. and > 500 µm.
-
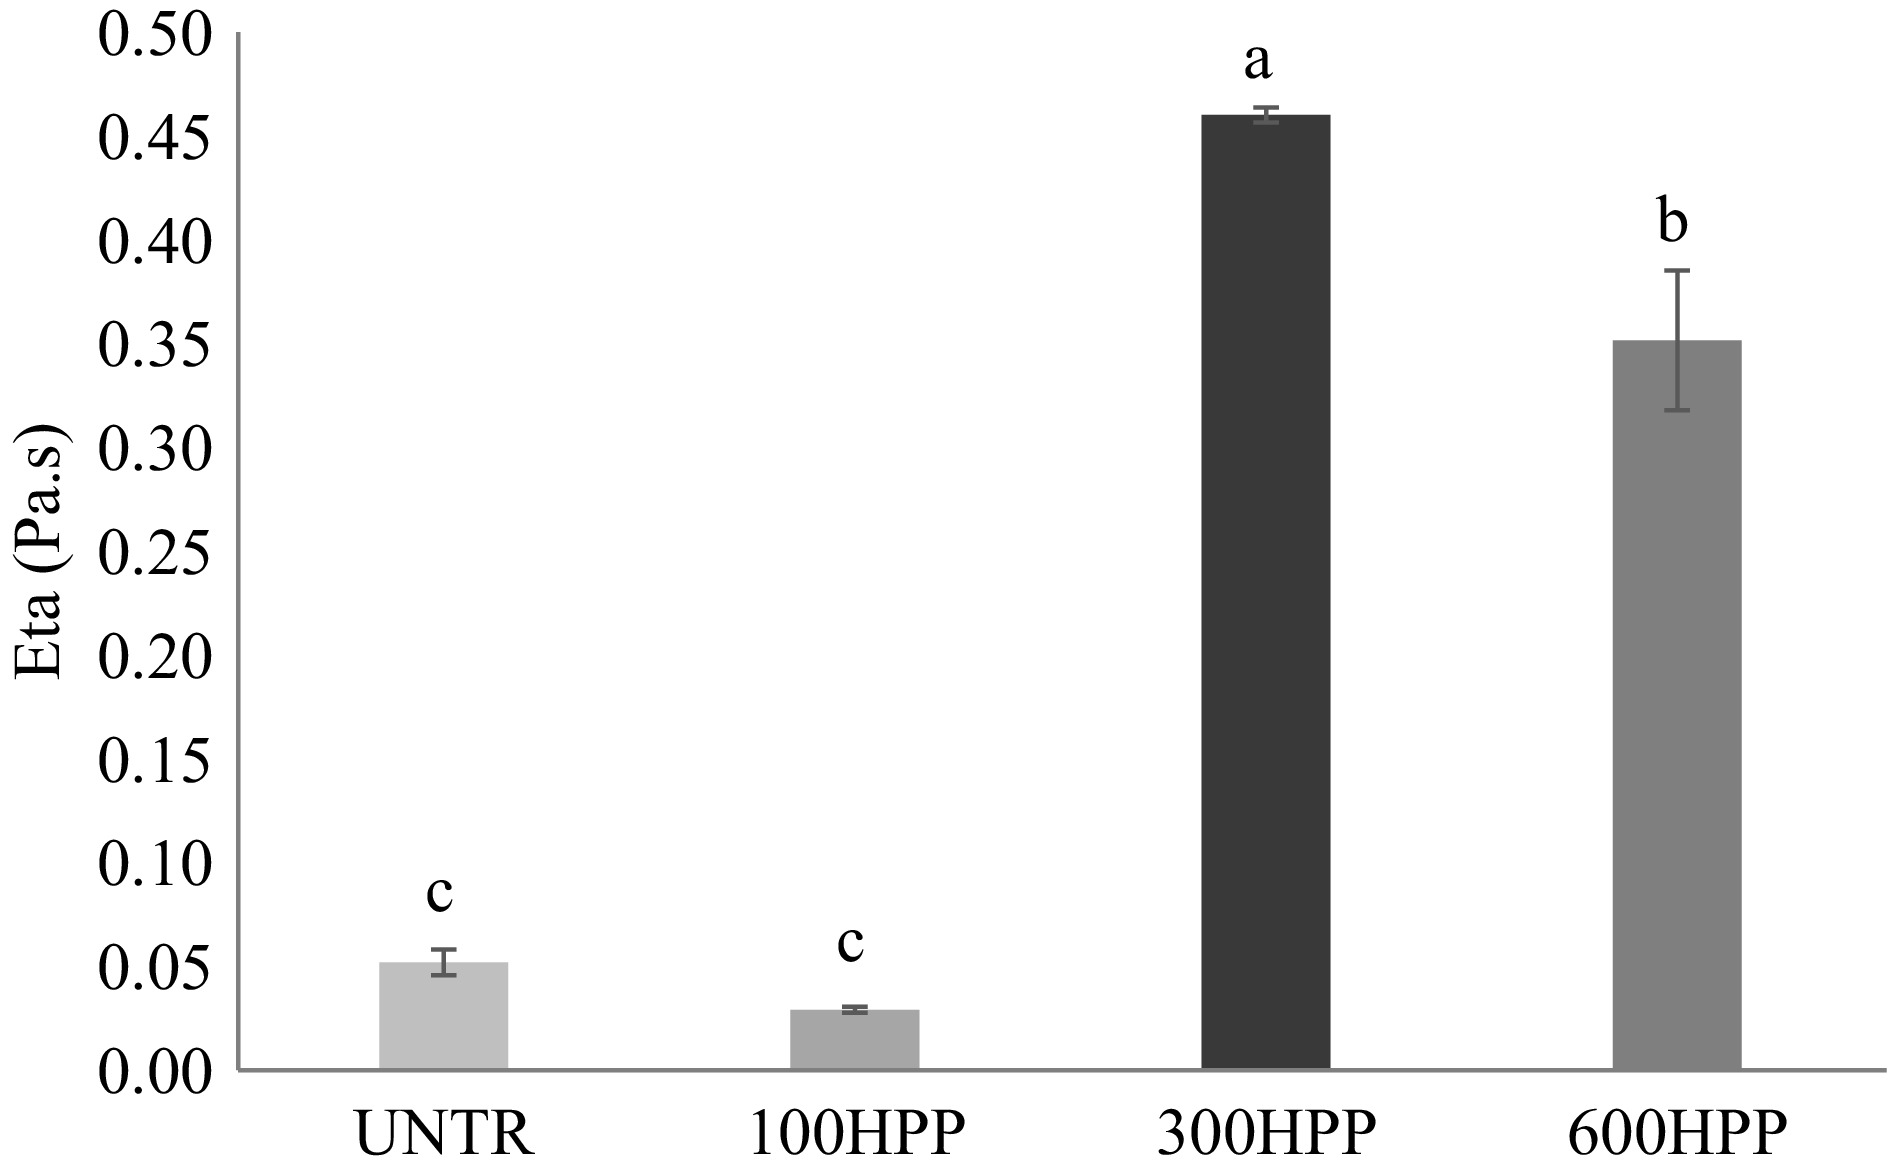
Figure 2.
Rheological properties of untreated and treated PF(< 300 µm) at 25 °C. Data are expressed as the mean ± standard deviation (n = 3). Means followed by different letters (a, b, c) differed significantly (p < 0.05). Legends: UNTR, untreated sample; 100HPP, 300HPP, and 600HPP, sampled treated by high-pressure processing.
-
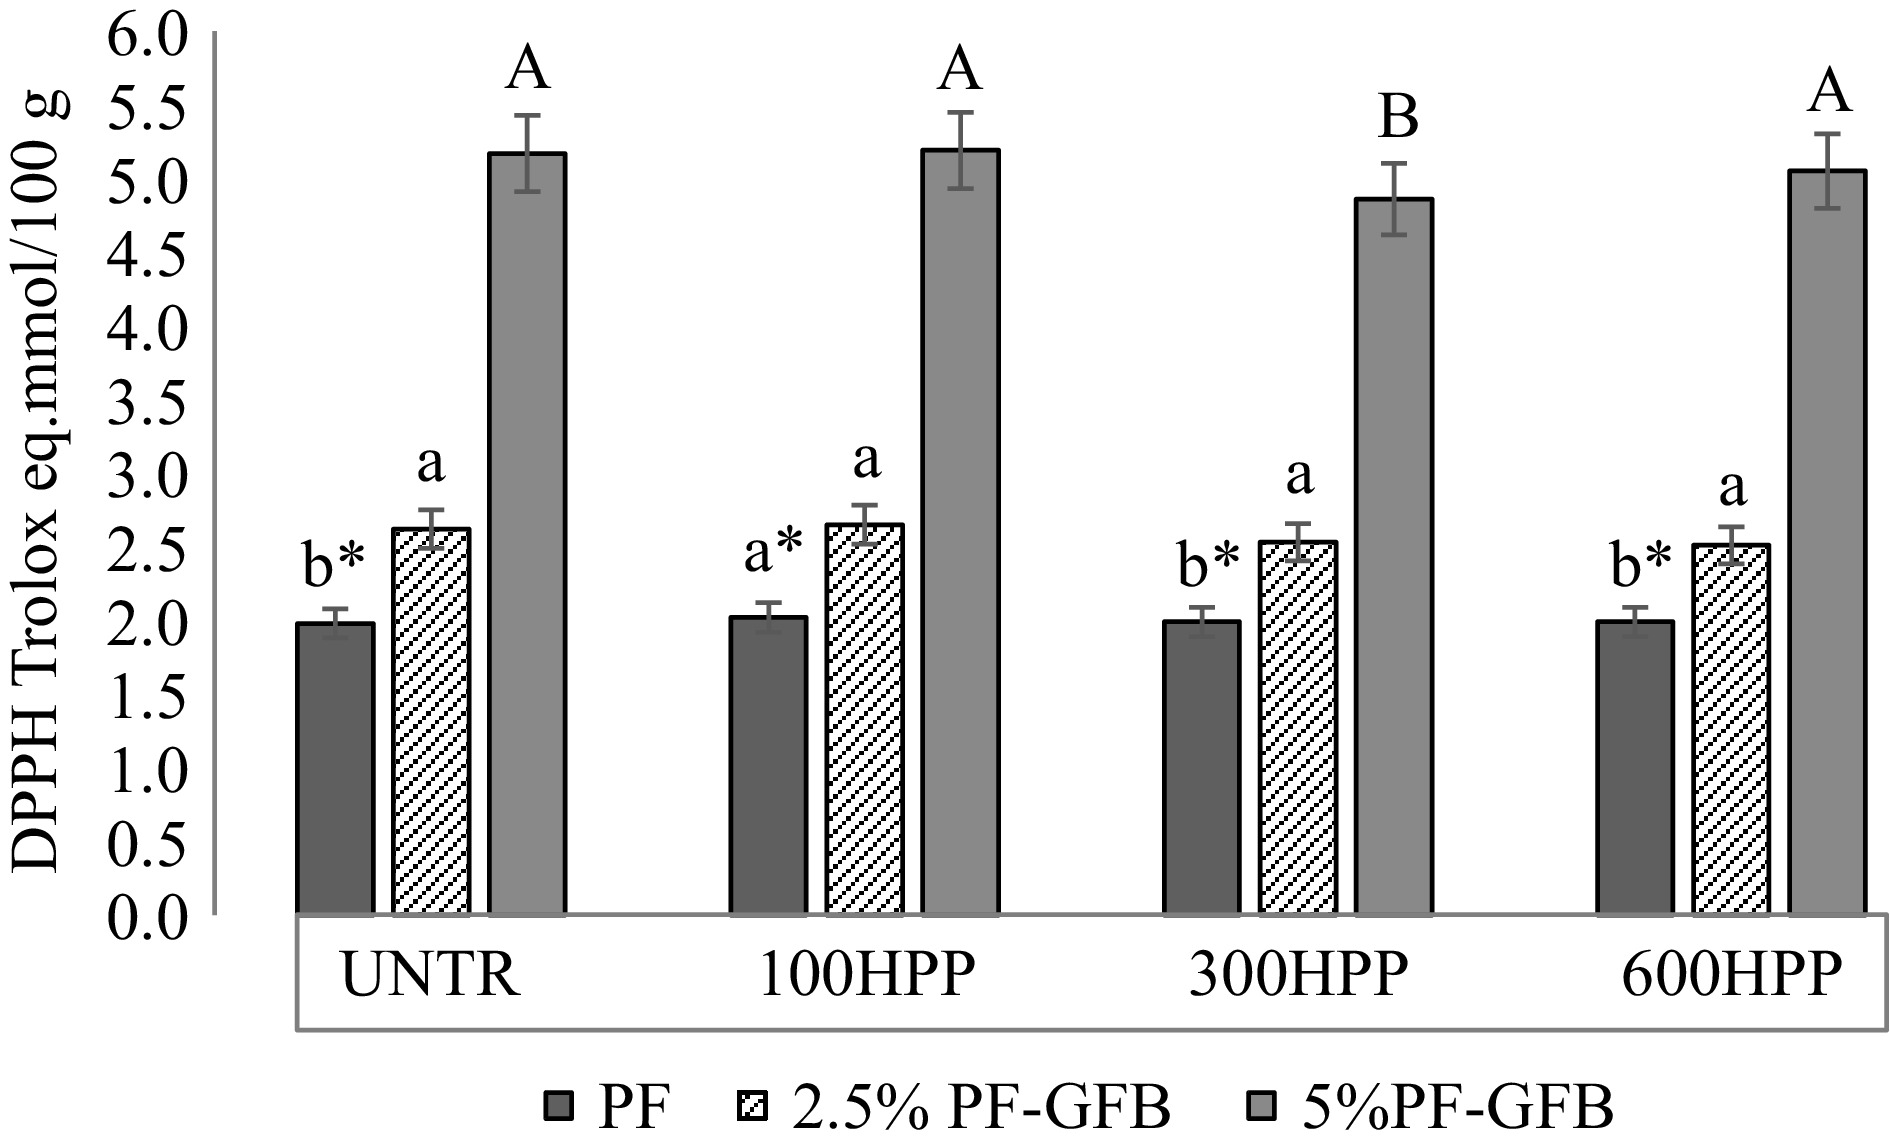
Figure 3.
Total antioxidant capacity of PF GFB made with untreated and treated PF. Data are expressed as the mean ± standard deviation (n = 3). Means in rows followed by different letters, namely (a*, b*) for for 2.5% PF GFB, and (A, B) for 5% PF GFB, differed significantly (p < 0.05) from each other accordign to Tukey's test. UNTR, untreated sample; 100HPP, 300HPP, and 600HPP, samples treated by high-pressure processing.
-
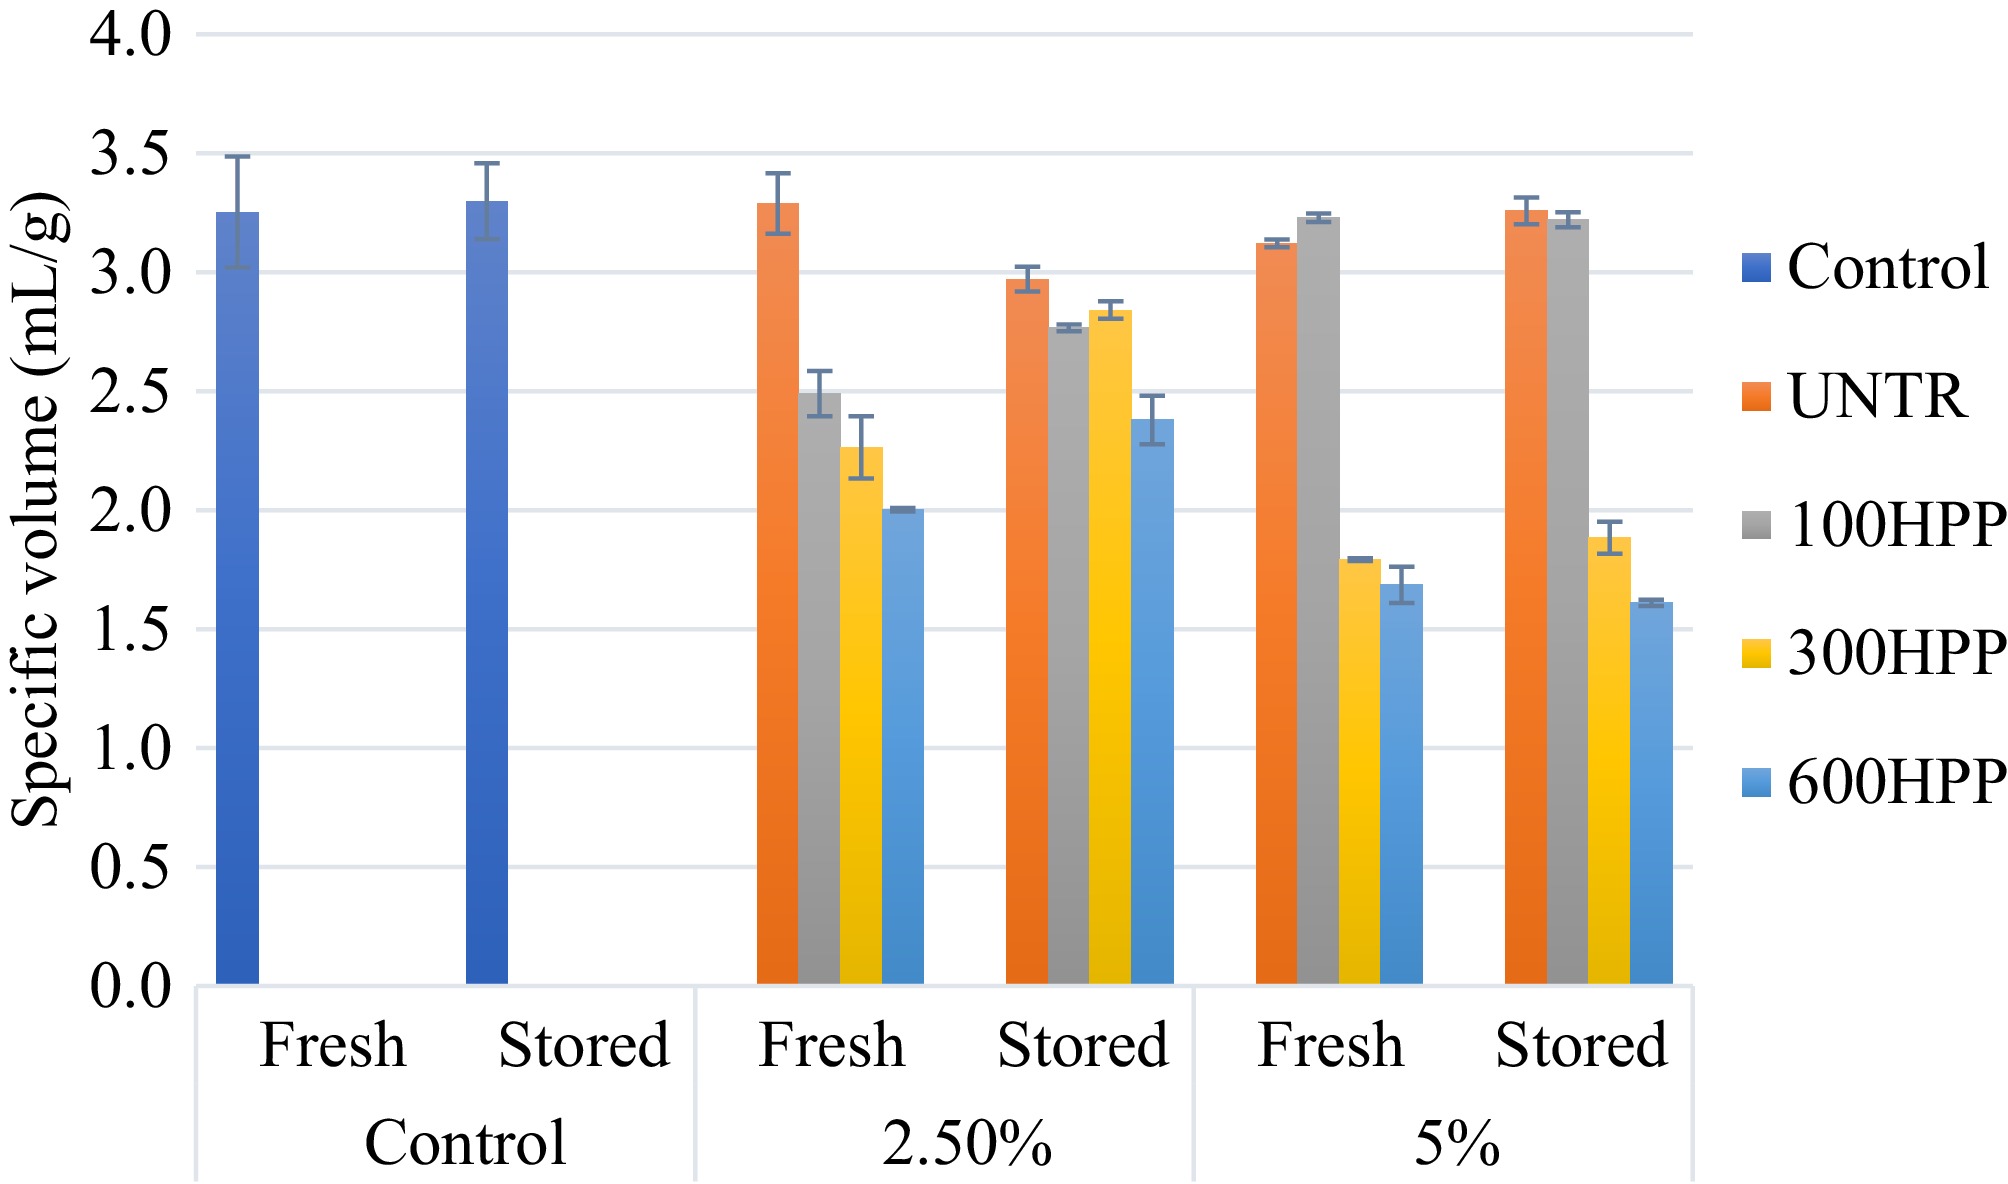
Figure 4.
Specific volume (mL/g) of gluten-free bread incorporating 2.5% and 5% of untreated and treated PF. Data are expressed as the mean ± standard deviation (n = 2). Control: without pumpkin flour; UNTR, untreated sample; 100HPP, 300HPP, and 600HPP: samples treated by high-pressure processing.
-
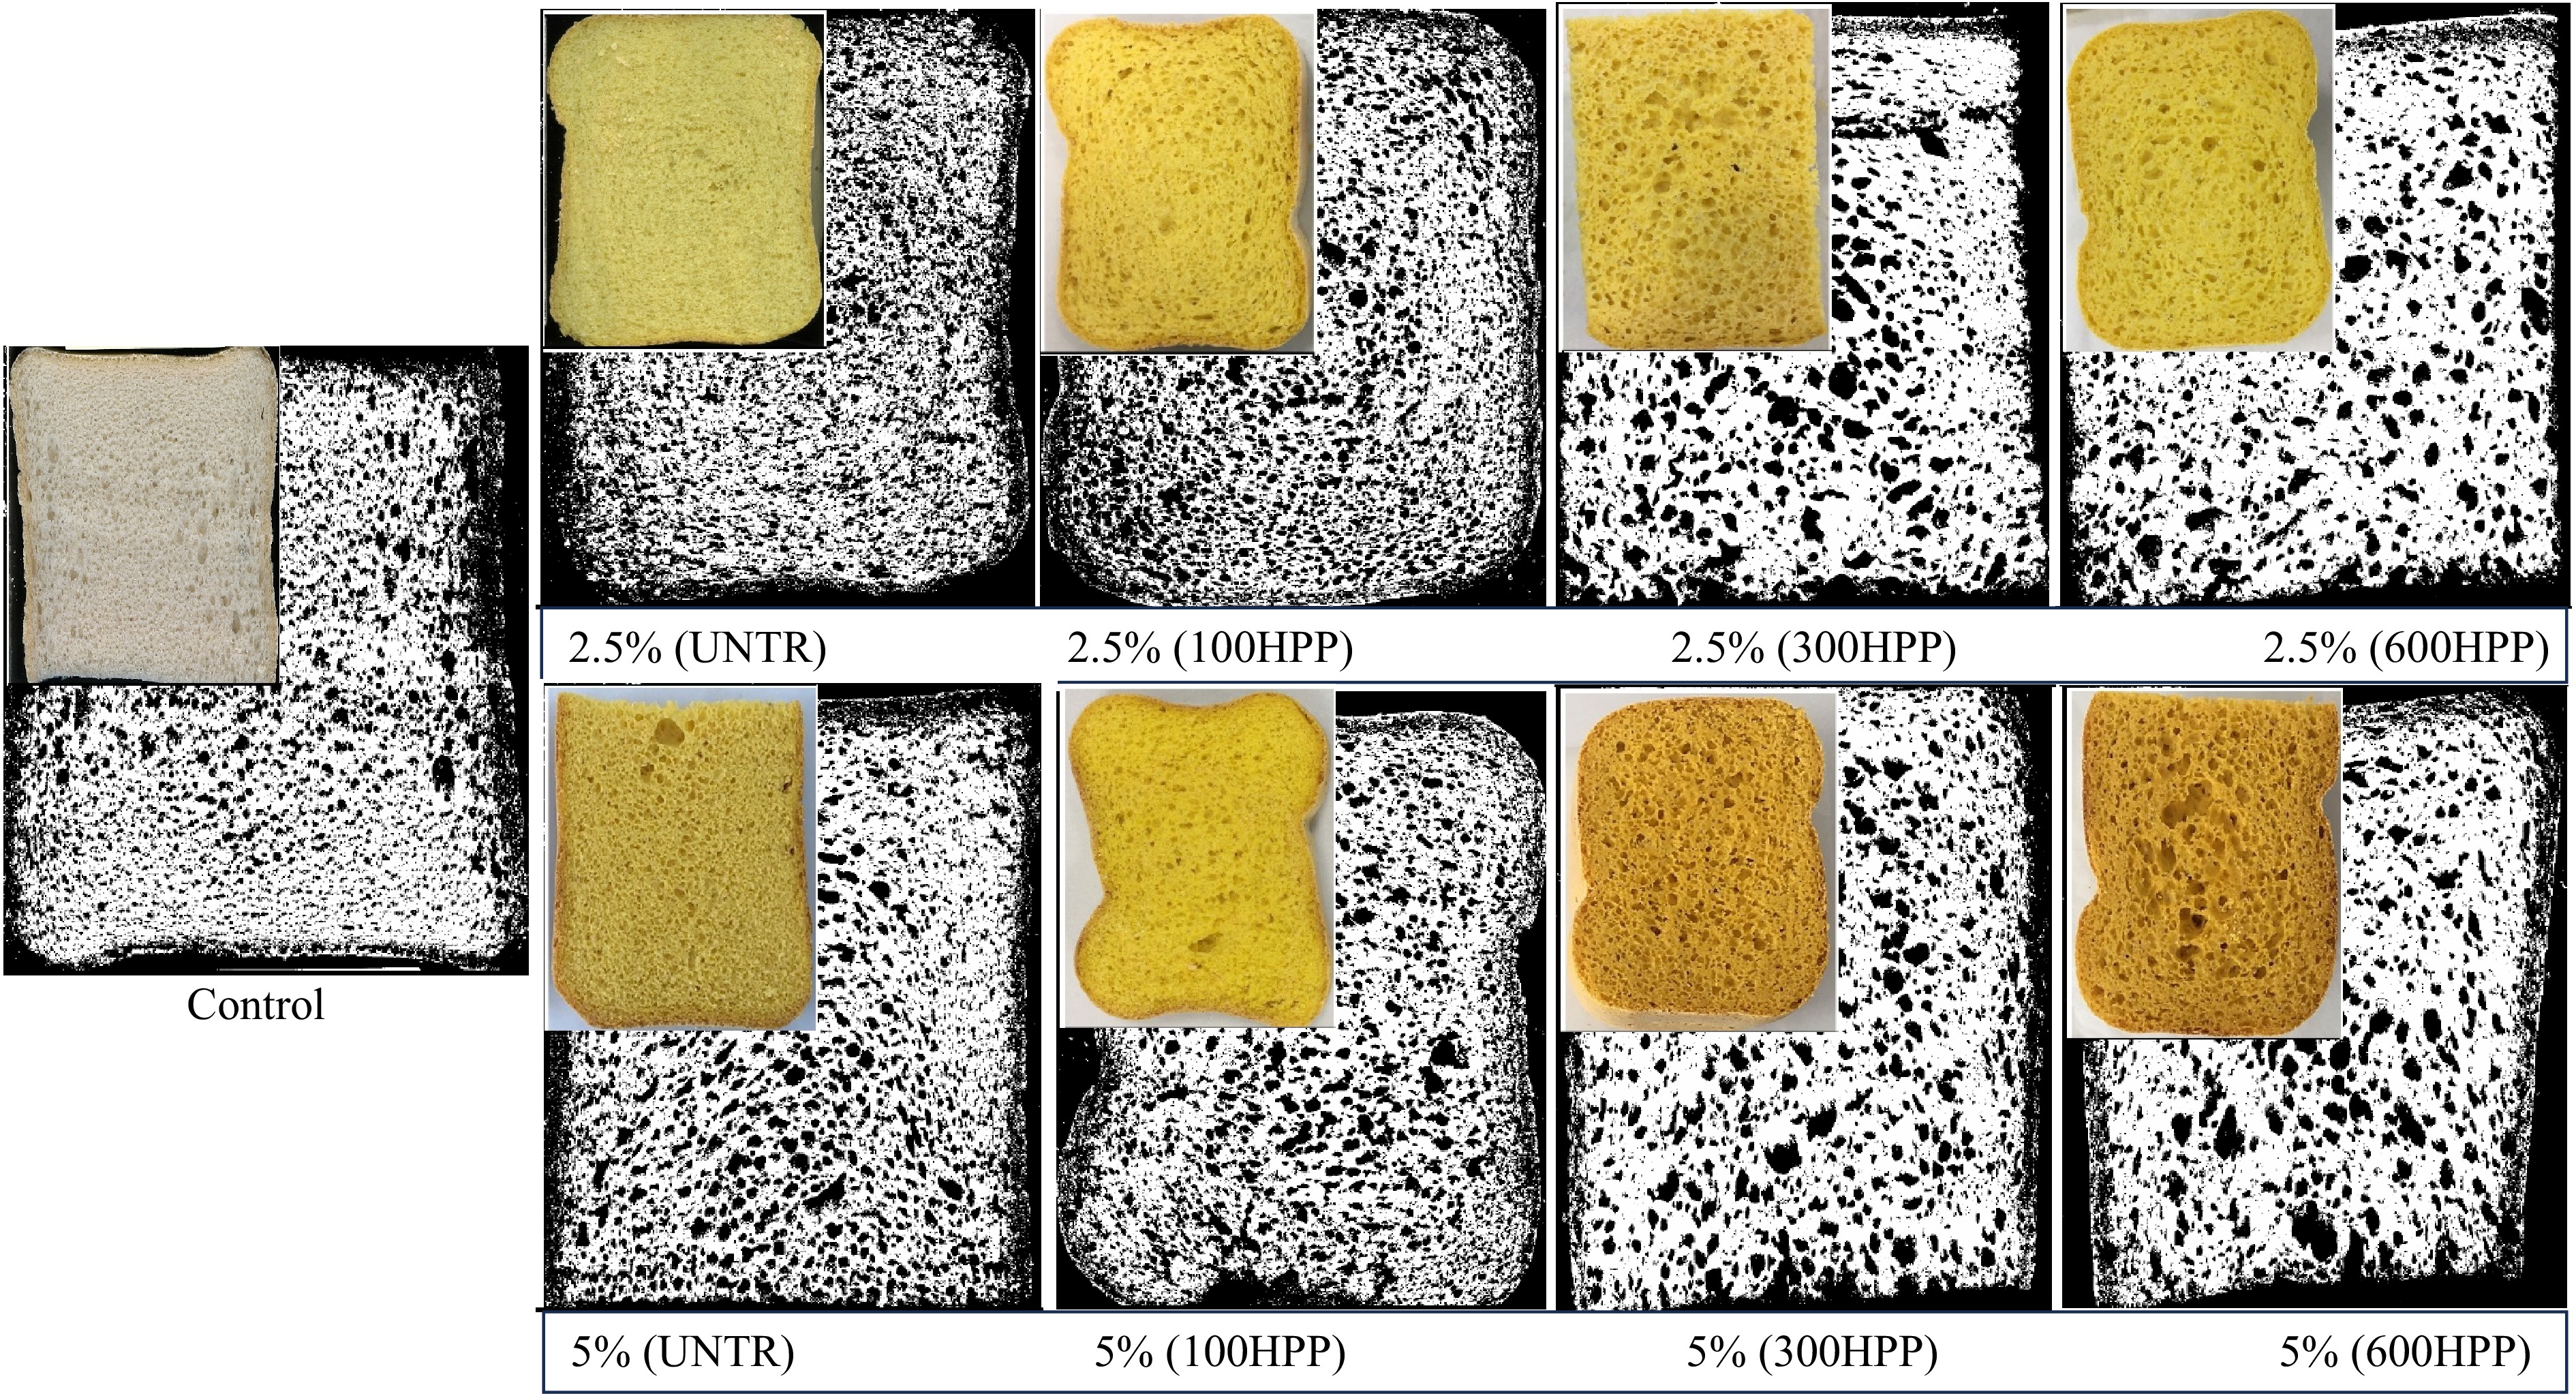
Figure 5.
Effect of adding PF and HPP on GFB. Scanned images showing the external appearance and internal crumb structure of GFB containing 2.5% and 5% PF. The control sample was prepared without pumpkin flour. UNTR refers to the untreated sample; HPP indicates samples treated at 100, 300, or 600 MPa.
-
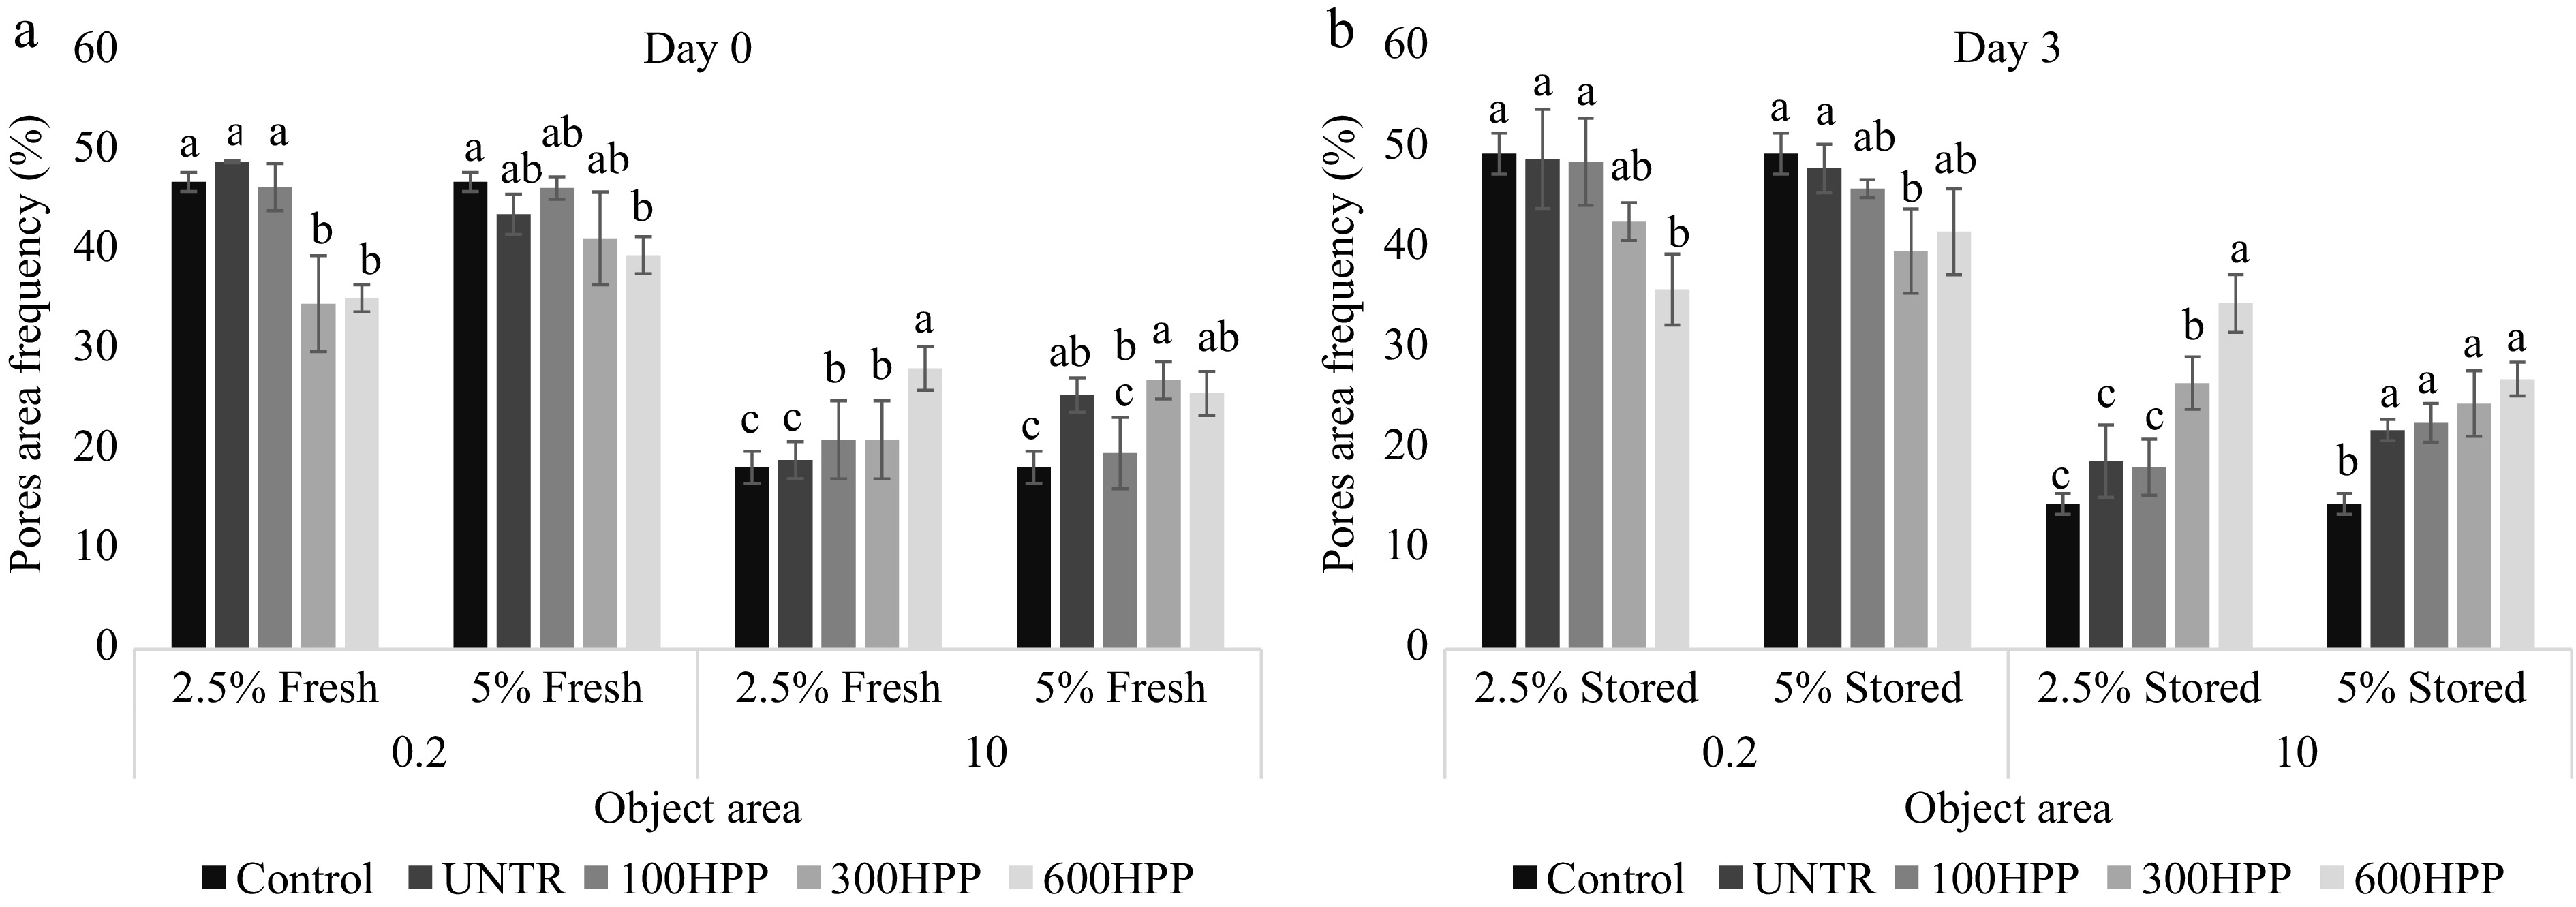
Figure 6.
Pore area frequency (%) fractions of GFB (2.5% and 5% PF concentrations) for < 0.2 and 1.0–10 (mm2) objects. Data are expressed as the mean ± standard deviation (n = 3). Means in rows followed by a different letter (a, b, c) differed significantly (p < 0.05) from each other according to Tukey's test. Legends: Control, without pumpkin flour; UNTR, untreated sample; 100HPP, 300HPP, and 600HPP, samples treated by high-pressure processing. (a) Day 0, fresh bread; (b) crust and crumb after 3 days of storage.
-
Samples MC (g/100 g) aw WAI (g/g) WSI (g/g) Starch (g/100 g) Pectin (g/100 g) UNTR 6.01 ± 1.8b 0.261 ± 0.006c 4.11 ± 0.03c 33.4 ± 0.1a 3.26 ± 1.1c 5.94 ± 1.9d 100HPP 6.50 ± 2.0b 0.265 ± 0.005c 4.33 ± 0.08c 31.0 ± 0.3b 3.39 ± 1.3c 6.22 ± 2.8c 300HPP 7.87 ± 2.4a 0.272 ± 0.002b 7.69 ± 0.13a 19.8 ± 2.8d 4.42 ± 2.0b 7.35 ± 3.2b 600HPP 6.03 ± 1.8b 0.288 ± 0.007a 5.81 ± 0.01b 23.3 ± 1.9c 6.86 ± 2.6a 8.11 ± 2.7a Data are expressed as mean ± standard deviation (n = 3). Means in the same column followed by different superscript letters (a, b, c, d) differ significantly (p < 0.05). Abbreviations: MC, moisture content; aw, water activity; WAI, water absorption index; WSI, water solubility index; UNTR, untreated sample; 100HPP, 300HPP, 600HPP, samples treated by high-pressure processing. Table 1.
Physicochemical properties of < 300-µm PF.
-
Samples L* a* b* ΔE UNTR 80.66 ± 0.2a 17.53 ± 0.1d 39.42 ± 0.3d − 100HPP 77.71 ± 0.2b 24.11 ± 0.2a 43.19 ± 0.7a 8.15 ± 0.5a 300HPP 75.29 ± 0.3d 22.54 ± 0.1b 42.75 ± 0.7b 7.83 ± 0.4b 600HPP 75.79 ± 0.4c 22.09 ± 0.1c 41.27 ± 0.4c 6.94 ± 0.3c Data are expressed as the mean ± standard deviation (n = 10). Means followed by different superscript letters (a, b, c, d) differed significantly (p < 0.05). Legends: UNTR, untreated sample; 100HPP, 300HPP, and 600HPP, samples treated by high-pressure processing. Table 2.
Instrumental color of < 300 µm untreated and treated PF.
-
PF 0% 2.5% 5% Control UNTR 100HPP 300HPP 600HPP UNTR 100HPP 300HPP 600HPP Crust Day 0 L* 85.5 ± 0.6aA 78.9 ± 5.8ab 76.1 ± 9.5b 82.4 ± 0.6ab 80.5 ± 2.1ab 79.9 ± 2.0AB 78.5 ± 2.9B 75.5 ± 3.4B 67.7 ± 7.6C a* 0.81 ± 0.06Cd 1.7 ± 0.3c 2.8 ± 0.4a 2.5 ± 0.2ab 2.2 ± 0.18b 4.4 ± 0.6A 3.7 ± 0.4B 3.6 ± 0.1B 3.4 ± 0.29B b* 13.1 ± 0.3Cd 25.4 ± 2.3bc 24.2 ± 3.2c 27.4 ± 1.2ab 30.3 ± 1.7a 34.9 ± 2.3A 34.8 ± 3.0A 31.6 ± 1.9AB 31.2 ± 3.1B ΔE − − 6.3 ± 8.0a 4.3 ± 0.9c 5.6 ± 1.5b − 10.2 ± 2.4B 8.6 ± 1.0C 13.8 ± 6.1A Day 3 L* 83.7 ± 1.1aA 81.8 ± 0.8b 81.8 ± 0.8b 81.8 ± 1.19b 81.6 ± 0.8b 81.4 ± 1.1AB 80.8 ± 1.4AB 78.2 ± 2.3B 64.8 ± 5.4C a* 0.7 ± 0.09cD 2.2 ± 0.19ab 2.3 ± 0.1a 2.4 ± 0.2a 2.03 ± 0.2b 3.2 ± 0.2BC 3.6 ± 0.3A 3.03 ± 0.1C 3.3 ± 0.2B b* 13.1 ± 0.5dC 26.9 ± 0.7c 29.1 ± 0.5a 27.8 ± 0.42b 27.1 ± 0.59c 32.4 ± 1.2AB 33. ± 0.8A 33.6 ± 0.9A 31.5 ± 1.9B ΔE − − 2.4 ± 0.35a 1.3 ± 0.73b 0.9 ± 0.56c − 1.8 ± 0.85C 3.8 ± 1.83B 16.7 ± 1.6A Crumb Day 0 L* 72.4 ± 1.4abA 72.9 ± 2.5a 66.8 ± 2.5d 68.6 ± 2.9cd 69.9 ± 1.8bc 65.3 ± 3.1B 63.7 ± 5.1B 64.3 ± 1.52B 65.7 ± 2.2B a* 1.3 ± 0.2dC 1.9 ± 0.2c 3.5 ± 0.4ab 3.8 ± 0.6a 3.3 ± 0.2b 4.5 ± 0.5B 4.8 ± 0.7B 6.1 ± 0.4A 6.8 ± 1.1A b* 12.9 ± 0.9cC 34.3 ± 2.1a 34.0 ± 1.8a 31.5 ± 1.4b 33.4 ± 2.35ab 36.6 ± 3.8B 36.9 ± 5.8B 37.1 ± 1.6B 52.1 ± 2.2A ΔE − − 15.1 ± 1.6a 12.3 ± 2.62b 12.4 ± 1.95b − 20.5 ± 3.6C 31.7 ± 1.03A 30.4 ± 1.9B Day 3 L* 68.6 ± 2.5abA 70.0 ± 1.4a 67.5 ± 2.5b 66.3 ± 2.2b 68.04 ± 2.06ab 67.5 ± 1.3A 67.6 ± 1.4A 64.1 ± 1.5B 62.7 ± 1.29B a* 1.6 ± 0.3cC 2.6 ± 0.26b 3.3 ± 0.5a 2.9 ± 2.2ab 2.9 ± 0.46ab 4.6 ± 0.4B 4.8 ± 0.4B 7.01 ± 0.5A 7.1 ± 0.8A b* 14.8 ± 1.3cC 37.8 ± 1.2b 41.8 ± 1.4a 38.02 ± 1.7b 38.8 ± 1.8b 38.1 ± 1.5B 38.7 ± 2.1B 52.9 ± 1.13A 51.6 ± 1.8A ΔE − − 5.2 ± 1.8a 4.1 ± 2.1b 3.1 ± 1.6c − 2.3 ± 1.2C 15.4 ± 1.07A 14.5 ± 1.9B Data are expressed as the mean ± standard deviation (n = 10). Means in rows followed by different lowercase superscript letters (a, b, c, d) or different capital letters (A, B, C, D) differed significantly (p < 0.05) from each other according to Tukey's test. Legends: PF, pumpkin flour concentration; Control, without pumpkin flour; UNTR, untreated sample; 100HPP, 300HPP, and600HPP, samples treated by high-pressure processing. Table 3.
Instrumental color of the crust and crumb of GFB made with untreated and treated pumpkin flour.
-
Control UNTR 100HPP 300HPP 600HPP UNTR 100HPP 300HPP 600HPP 0% 2.5% 5% Crust Day 0 21.4 ± 0.5aA 17.8 ± 0.9ab 18.6 ± 2.0ab 16.4 ± 1.6b 16.8 ± 1.2b 14.2 ± 1.1C 16.1 ± 1.4BC 15.4 ± 0.3BC 16.9 ± 0.6B Day 3 20.5 ± 1.2bC 24.5 ± 0.9a 23.5 ± 1.4a 24.0 ± 0.8a 22.7 ± 0.4ab 24.9 ± 0.8AB 25.5 ± 0.4A 24.1 ± 1.0AB 22.4 ± 0.8BC Crumb Day 0 51.6 ± 0.5aA 50.0 ± 1.1ab 49.7 ± 0.6b 51.6 ± 0.1a 51.06 ± 0.4ab 49.3 ± 1.0ABC 48.4 ± 1.1BC 47.8 ± 1.1C 50.7 ± 0.7AB Day 3 51.3 ± 0.3bA 52.3 ± 0.1a 52.0 ± 0.1a 52.4 ± 0.04a 51.8 ± 0.3ab 50.4 ± 0.03A 48.6 ± 3.6A 49.0 ± 0.5A 49.1 ± 1.9A Data are expressed as the mean ± standard deviation (n = 3). Means in rows followed by different lowercase superscript letters (a, b, c) for 2.5% PF and uppercase letters (A, B, C) for 5% PF, focusing on 0 days and 3 days separately, significantly differ from each other by Tukey's test (p < 0.05). Legends: Control, without pumpkin flour; UNTR, untreated sample; 100HPP, 300HPP, and 600HPP, samples treated by high-pressure processing. Day 0: fresh bread; Day 3, stored crust and crumb. Table 4.
Moisture content (g/100 g) of fresh and stored GFB's crust and crumb.
-
Control UNTR 100HPP 300HPP 600HPP UNTR 100HPP 300HPP 600HPP 0% 2.5% 5% Crumb TPA Hardness (N) Day 0 2.7 ± 0.5bcC 1.8 ± 0.4c 3.4 ± 1.0b 3.0 ± 1.2b 10.4 ± 1.3a 2.7 ± 0.5C 2.7 ± 0.8C 7.4 ± 1.0B 10.7 ± 2.0A Resilience 47.5 ± 4.1aA 39.8 ± 3.6bc 44.9 ± 4.8ab 44.3 ± 3.5a 38.4 ± 3.6c 36.7 ± 4.1B 45.5 ± 4.2A 35.7 ± 2.5BC 32.93 ± 3.3C Cohesiveness 0.7 ± 0.03aA 0.7 ± 0.04ab 0.7 ± 0.05b 0.7 ± 0.04ab 0.6 ± 0.04c 0.6 ± 0.04B 0.7 ± 0.05A 0.6 ± 0.03C 0.5 ± 0.03C Springiness 99.3 ± 1.5aA 97.4 ± 0.9b 98.8 ± 0.5ab 98.7 ± 0.6a 96.5 ± 1.01c 98.4 ± 0.8AB 98.1 ± 1.0B 97.3 ± 0.53BC 96.6 ± 1.2C Chewiness 2.0 ± 1.2bC 1.2 ± 0.8c 2.4 ± 0.9b 2.1 ± 0.8b 6.2 ± 1.0a 1.7 ± 0.6C 1.9 ± 0.8C 4.3 ± 1.2B 5.7 ± 0.7A Hardness (N) Day 3 3.1 ± 1.3cC 4.5 ± 1.6bc 4.5 ± 1.1bc 3.9 ± 1.4bc 14.9 ± 2.1a 4.7 ± 1.6C 4.3 ± 2.2C 16.5 ± 3.0B 19.4 ± 3.0A Resilience 21.6 ± 5.5aA 16.4 ± 2.5b 16.7 ± 3.3ab 18.3 ± 2.7ab 14.4 ± 2.7b 12.2 ± 2.0B 12.8 ± 3.4B 11.1 ± 0.9B 13.3 ± 2.04B Cohesiveness 0.4 ± 0.07aA 0.3 ± 0.03b 0.3 ± 0.05b 0.3 ± 0.04ab 0.3 ± 0.04b 0.2 ± 0.03B 0.2 ± 0.06B 0.2 ± 0.09B 0.2 ± 0.03B Springiness 94.3 ± 2.0aA 90.5 ± 2.0b 91.0 ± 1.6b 88.2 ± 5.5bc 88.3 ± 2.6b 80.3 ± 4.3B 82.6 ± 6.5B 79.2 ± 6.2B 83.9 ± 4.6B Chewiness 1.4 ± 0.7aA 1.5 ± 0.6a 1.5 ± 0.8a 1.3 ± 0.7a 1.4 ± 0.9a 1.0 ± 0.6A 0.9 ± 1.5A 2.8 ± 0.7B 4.0 ± 1.0A Crust Penetration Force (N) Day 0 2.53 ± 0.03aBC 3.10 ± 0.01a 2.71 ± 0.91a 2.89 ± 0.80a 2.35 ± 0.63a 6.063 ± 1.71A 3.07 ± 0.68B 2.87 ± 0. 74B 1.75 ± 0.45C Day 3 1.75 ± 0.39bD 1.94 ± 0.50b 1.83 ± 0.41b 2.16 ± 0.33b 2.81 ± 0.71a 2.16 ± 0.58D 3.01 ± 0.83B 3.88 ± 1.09A 2.89 ± 0.60BC Distance (mm) Day 0 2.9 ± 0.5bcA 3.4 ± 0.9b 2.3 ± 0.4c 3.4 ± 1.0b 4.4 ± 0.7a 2.4 ± 0.6A 2.2 ± 0.7A 2.3 ± 0.5A 2.8 ± 1.5A Day 3 2.9 ± 1.3bA 4.3 ± 0.07a 4.2 ± 0.78a 4.0 ± 0.9a 4.0 ± 0.9a 4.0 ± 1.1A 3.7 ± 1.3A 3.3 ± 1.3A 3.3 ± 0.8A Data are expressed as the mean ± standard deviation (n = 10). Means in rows followed by different lowercase superscript letters (a, b, c, d) for 2.5% PF and different capital letters (A, B, C, D) for 5% PF differed significantly (p < 0.05) from each other according to Tukey's test. Legends: Control, without pumpkin flour; UNTR, untreated sample; 100HPP, 300HP, and 600HPP, samples treated by high-pressure processing. Day 0, fresh bread; Day 3, stored crust and crumb. Table 5.
Means of texture attributes of GFB's crust and crumb made with untreated and treated PF.
Figures
(6)
Tables
(5)