-
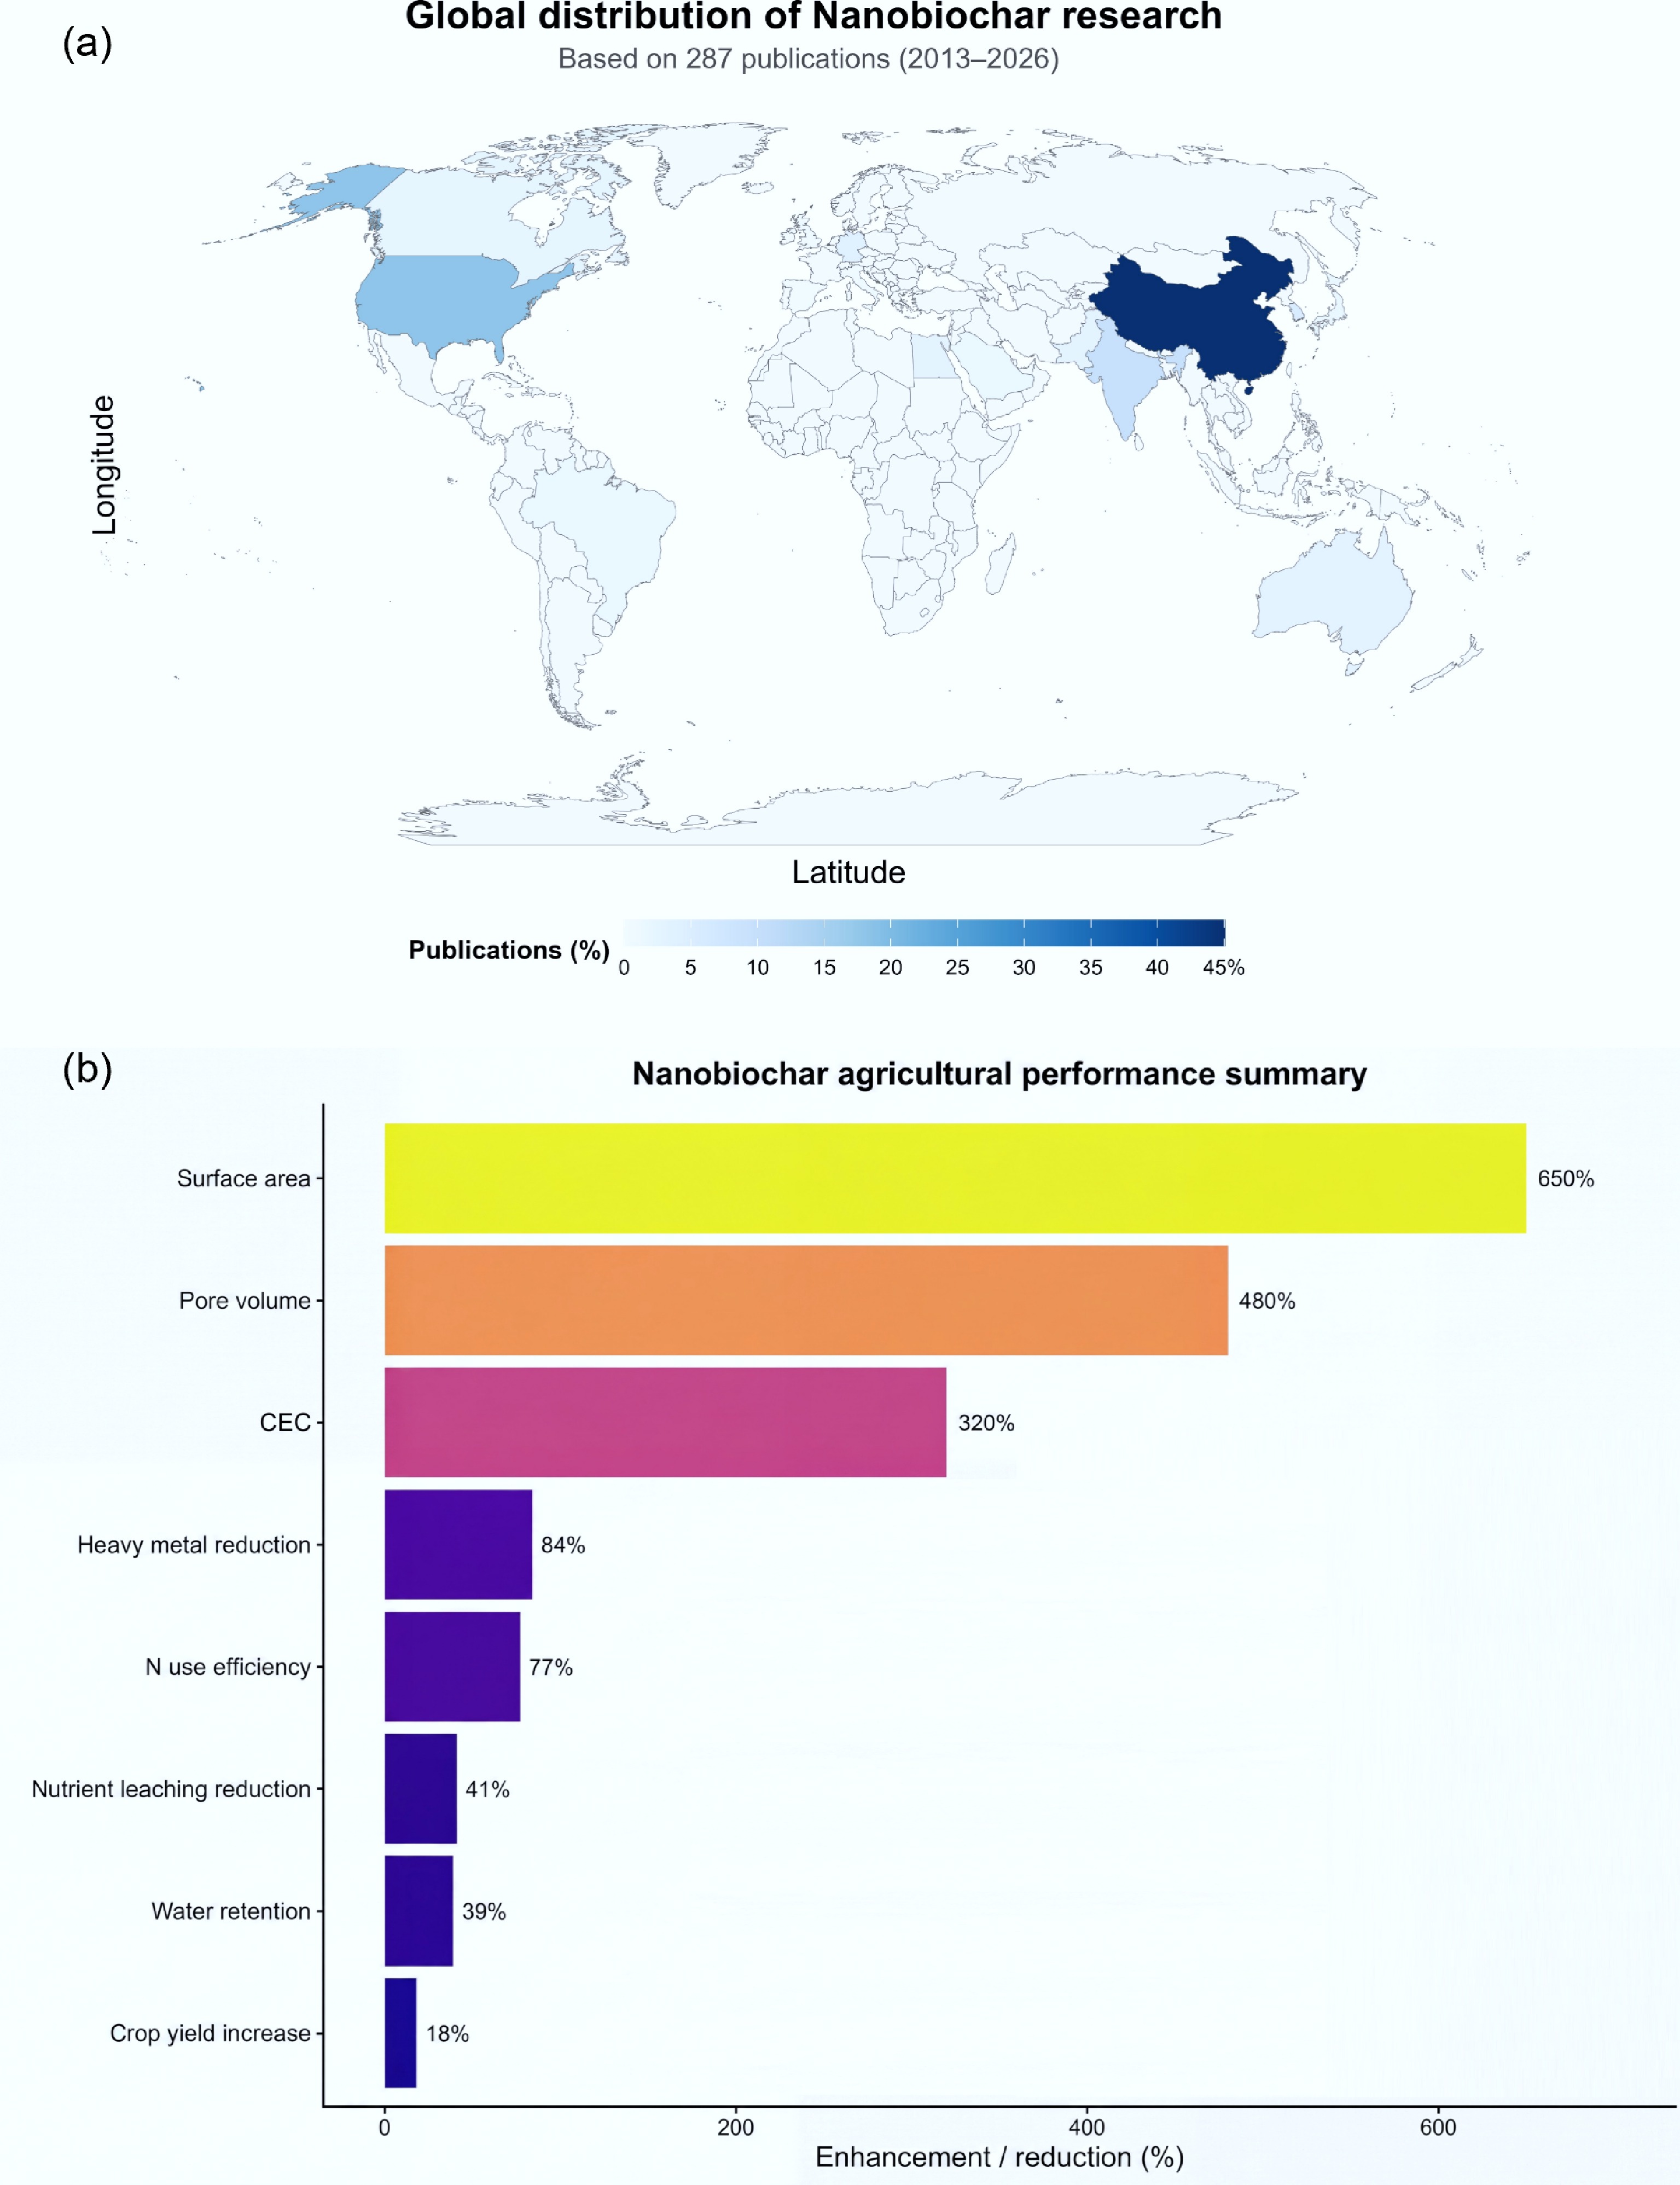
Figure 1.
Global research landscape and agricultural performance of nanobiochar (2013–2026). (a) Map of publication contributions by country, with China leading at 45%, followed by the USA (18%), India (9.5%), and others. (b) Median enhancements in key agricultural parameters: surface area (+ 650%), pore volume (+ 480%), CEC (+ 320%), heavy metal reduction (84%), nitrogen use efficiency (+ 77%), nutrient leaching reduction (41%), water retention (+ 39%), and crop yield (+ 18%) (compiled from[10−13, 16,17]).
-
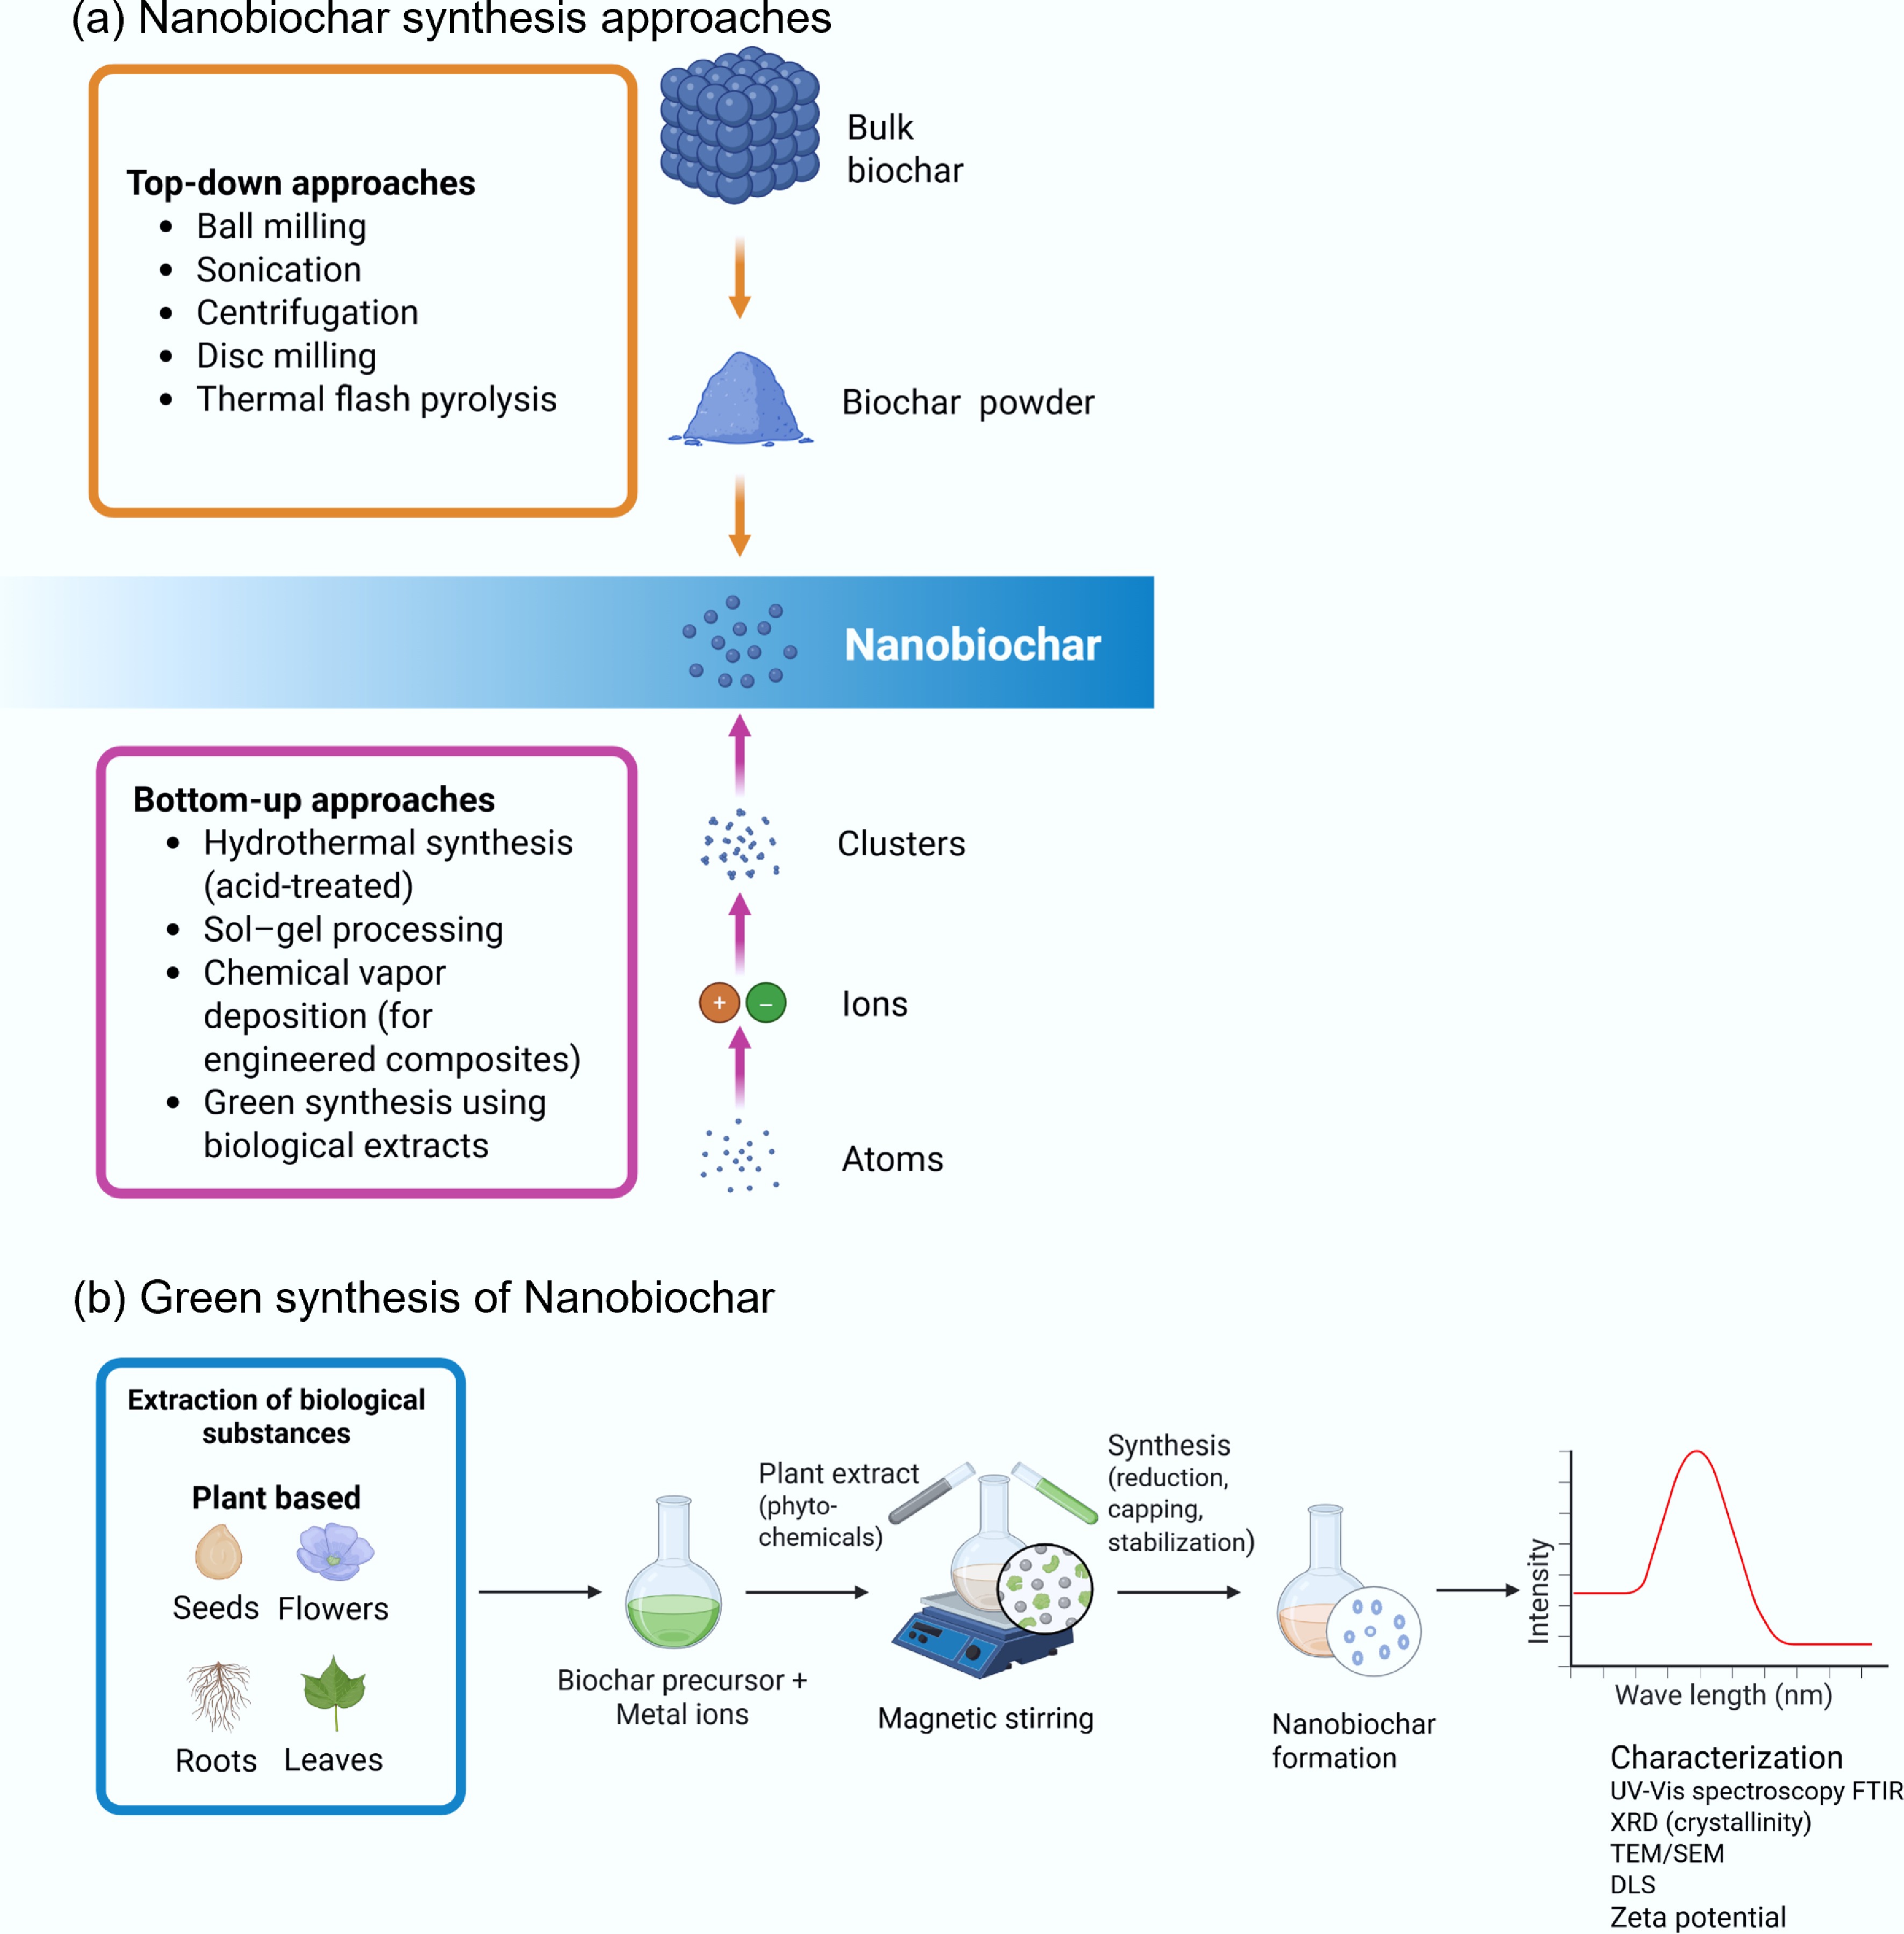
Figure 2.
Synthesis approaches for nanobiochar production. (a) Top-down methods fracture bulk biochar into nanoscale particles through mechanical or physical forces, while bottom-up approaches assemble nanobiochar from molecular or ionic precursors. (b) Green synthesis employs plant extracts as reducing and capping agents to generate stable nanobiochar under mild conditions. The resulting materials are characterized by a suite of spectroscopic and microscopic techniques including UV-Vis, FTIR, XRD, TEM/SEM, DLS, and zeta potential analysis.
-
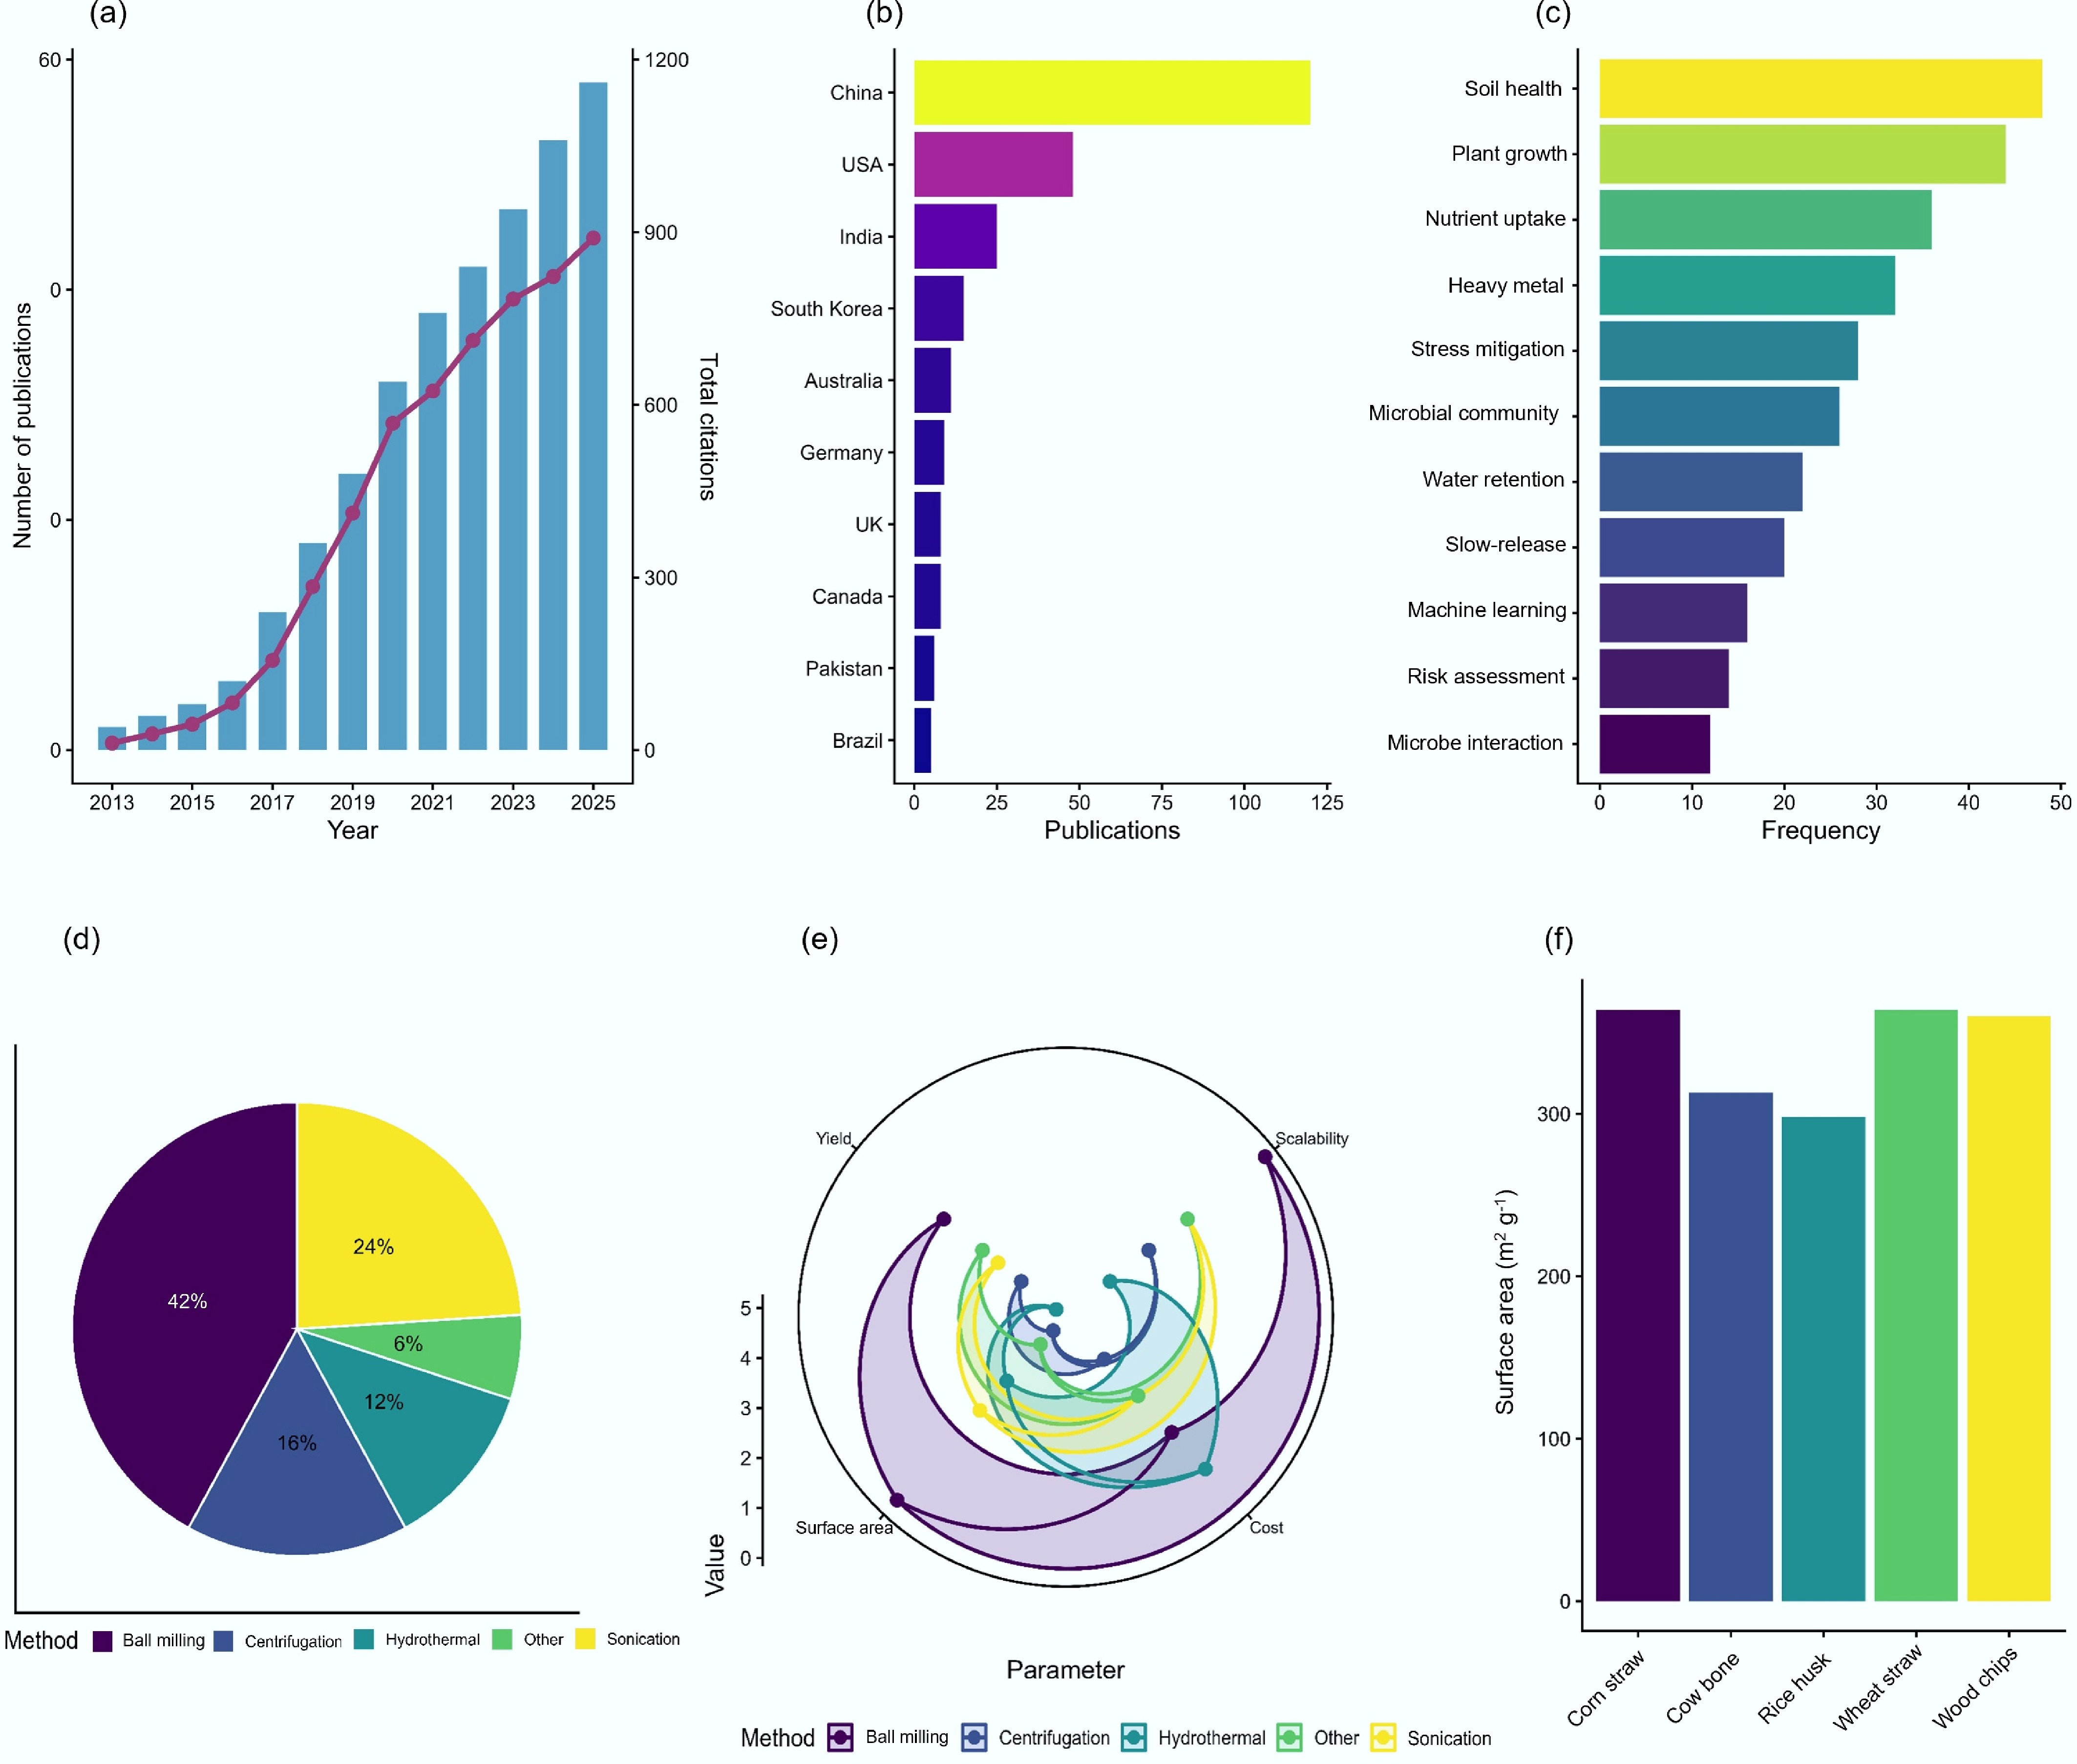
Figure 3.
Bibliometric analysis and synthesis pathways of agricultural nanobiochar research. (a) Annual publication trend showing exponential growth during 2013–2025. (b) Top contributing countries, with China as the leading contributor. (c) Key research themes during 2022–2025. (d) Synthesis method distribution. (e) Multi-criteria performance comparison of synthesis methods. (f) Feedstock-dependent surface area after nanobiochar production. Data compiled from[10−13, 16,17].
-
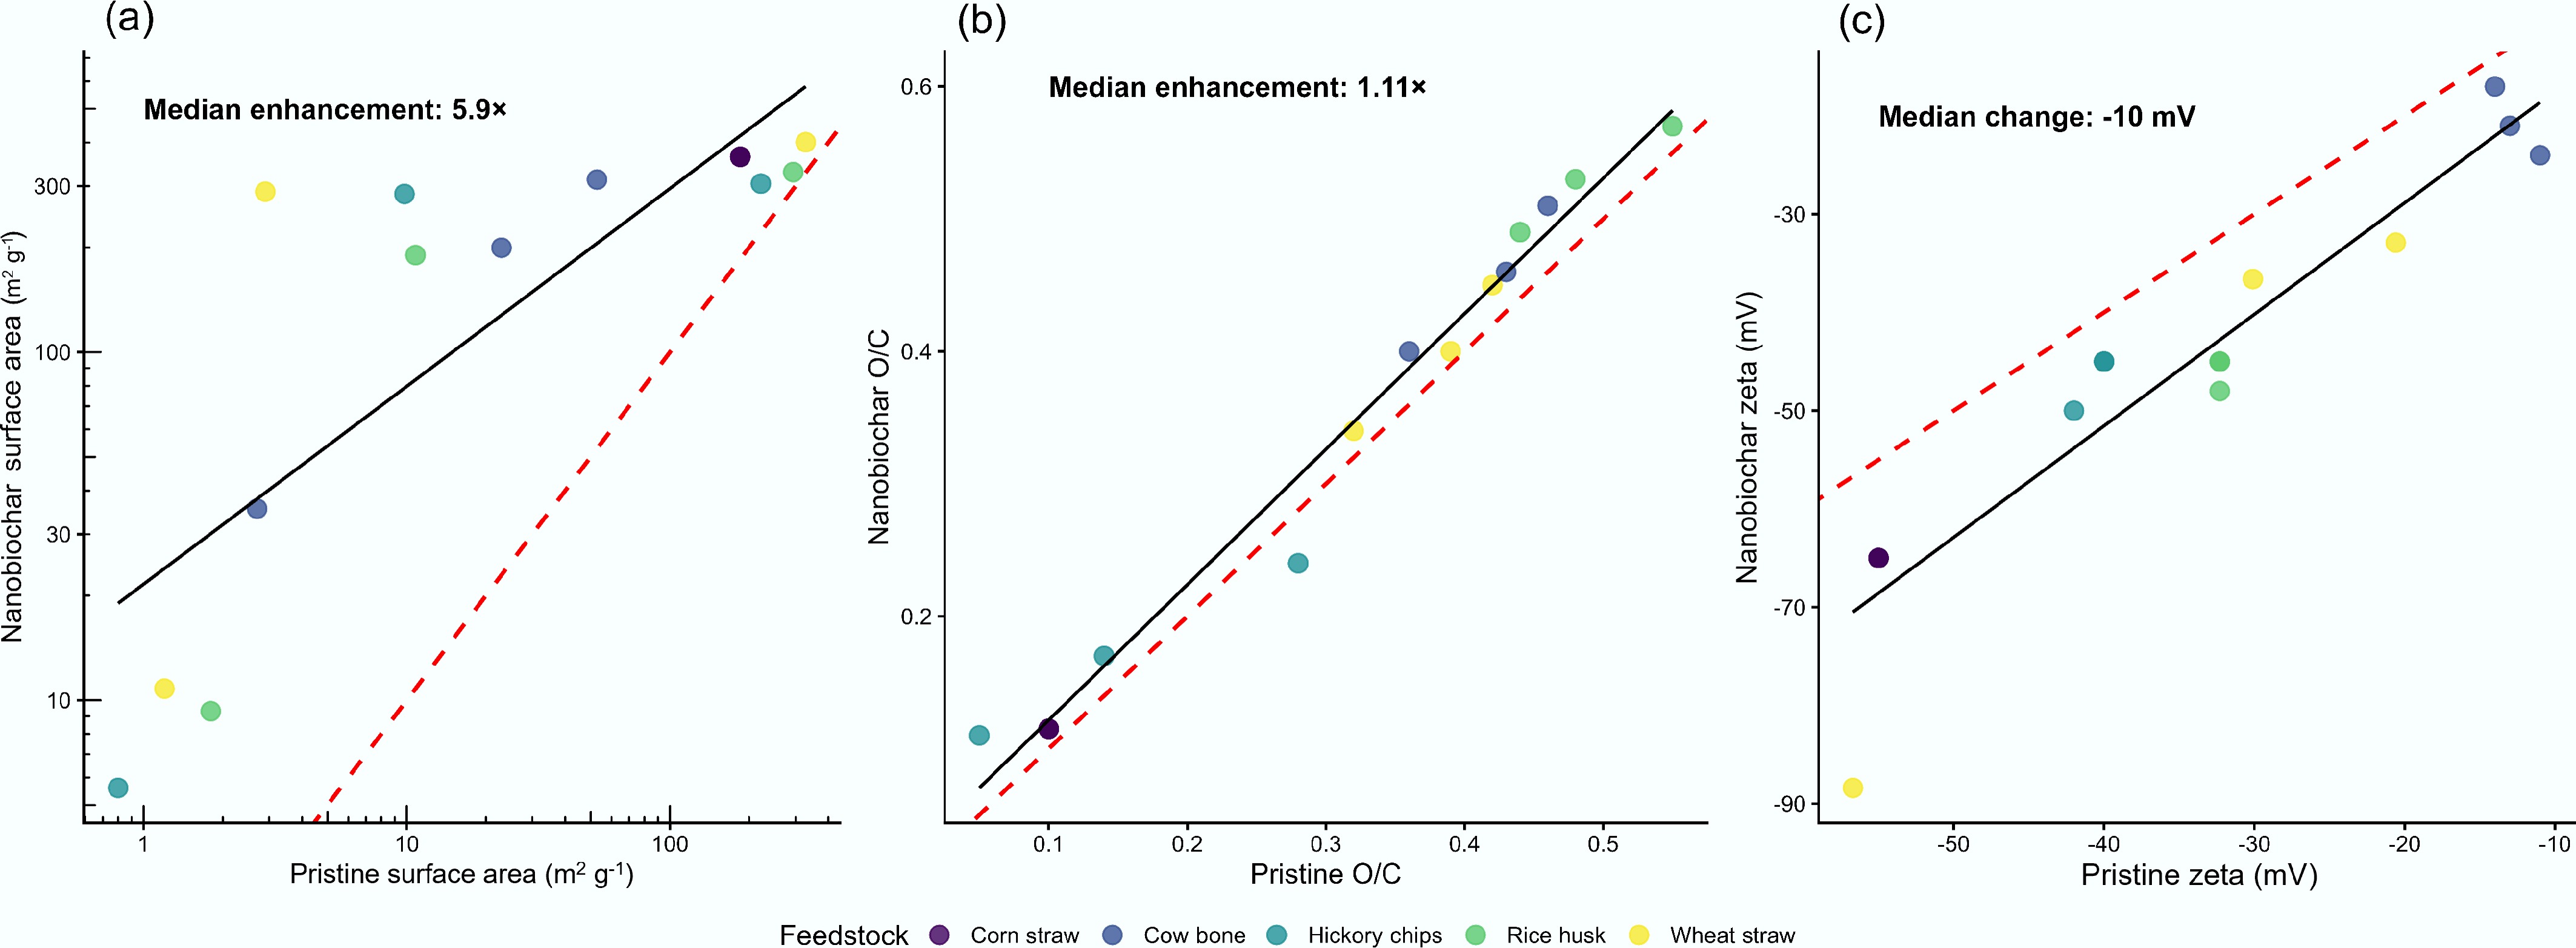
-
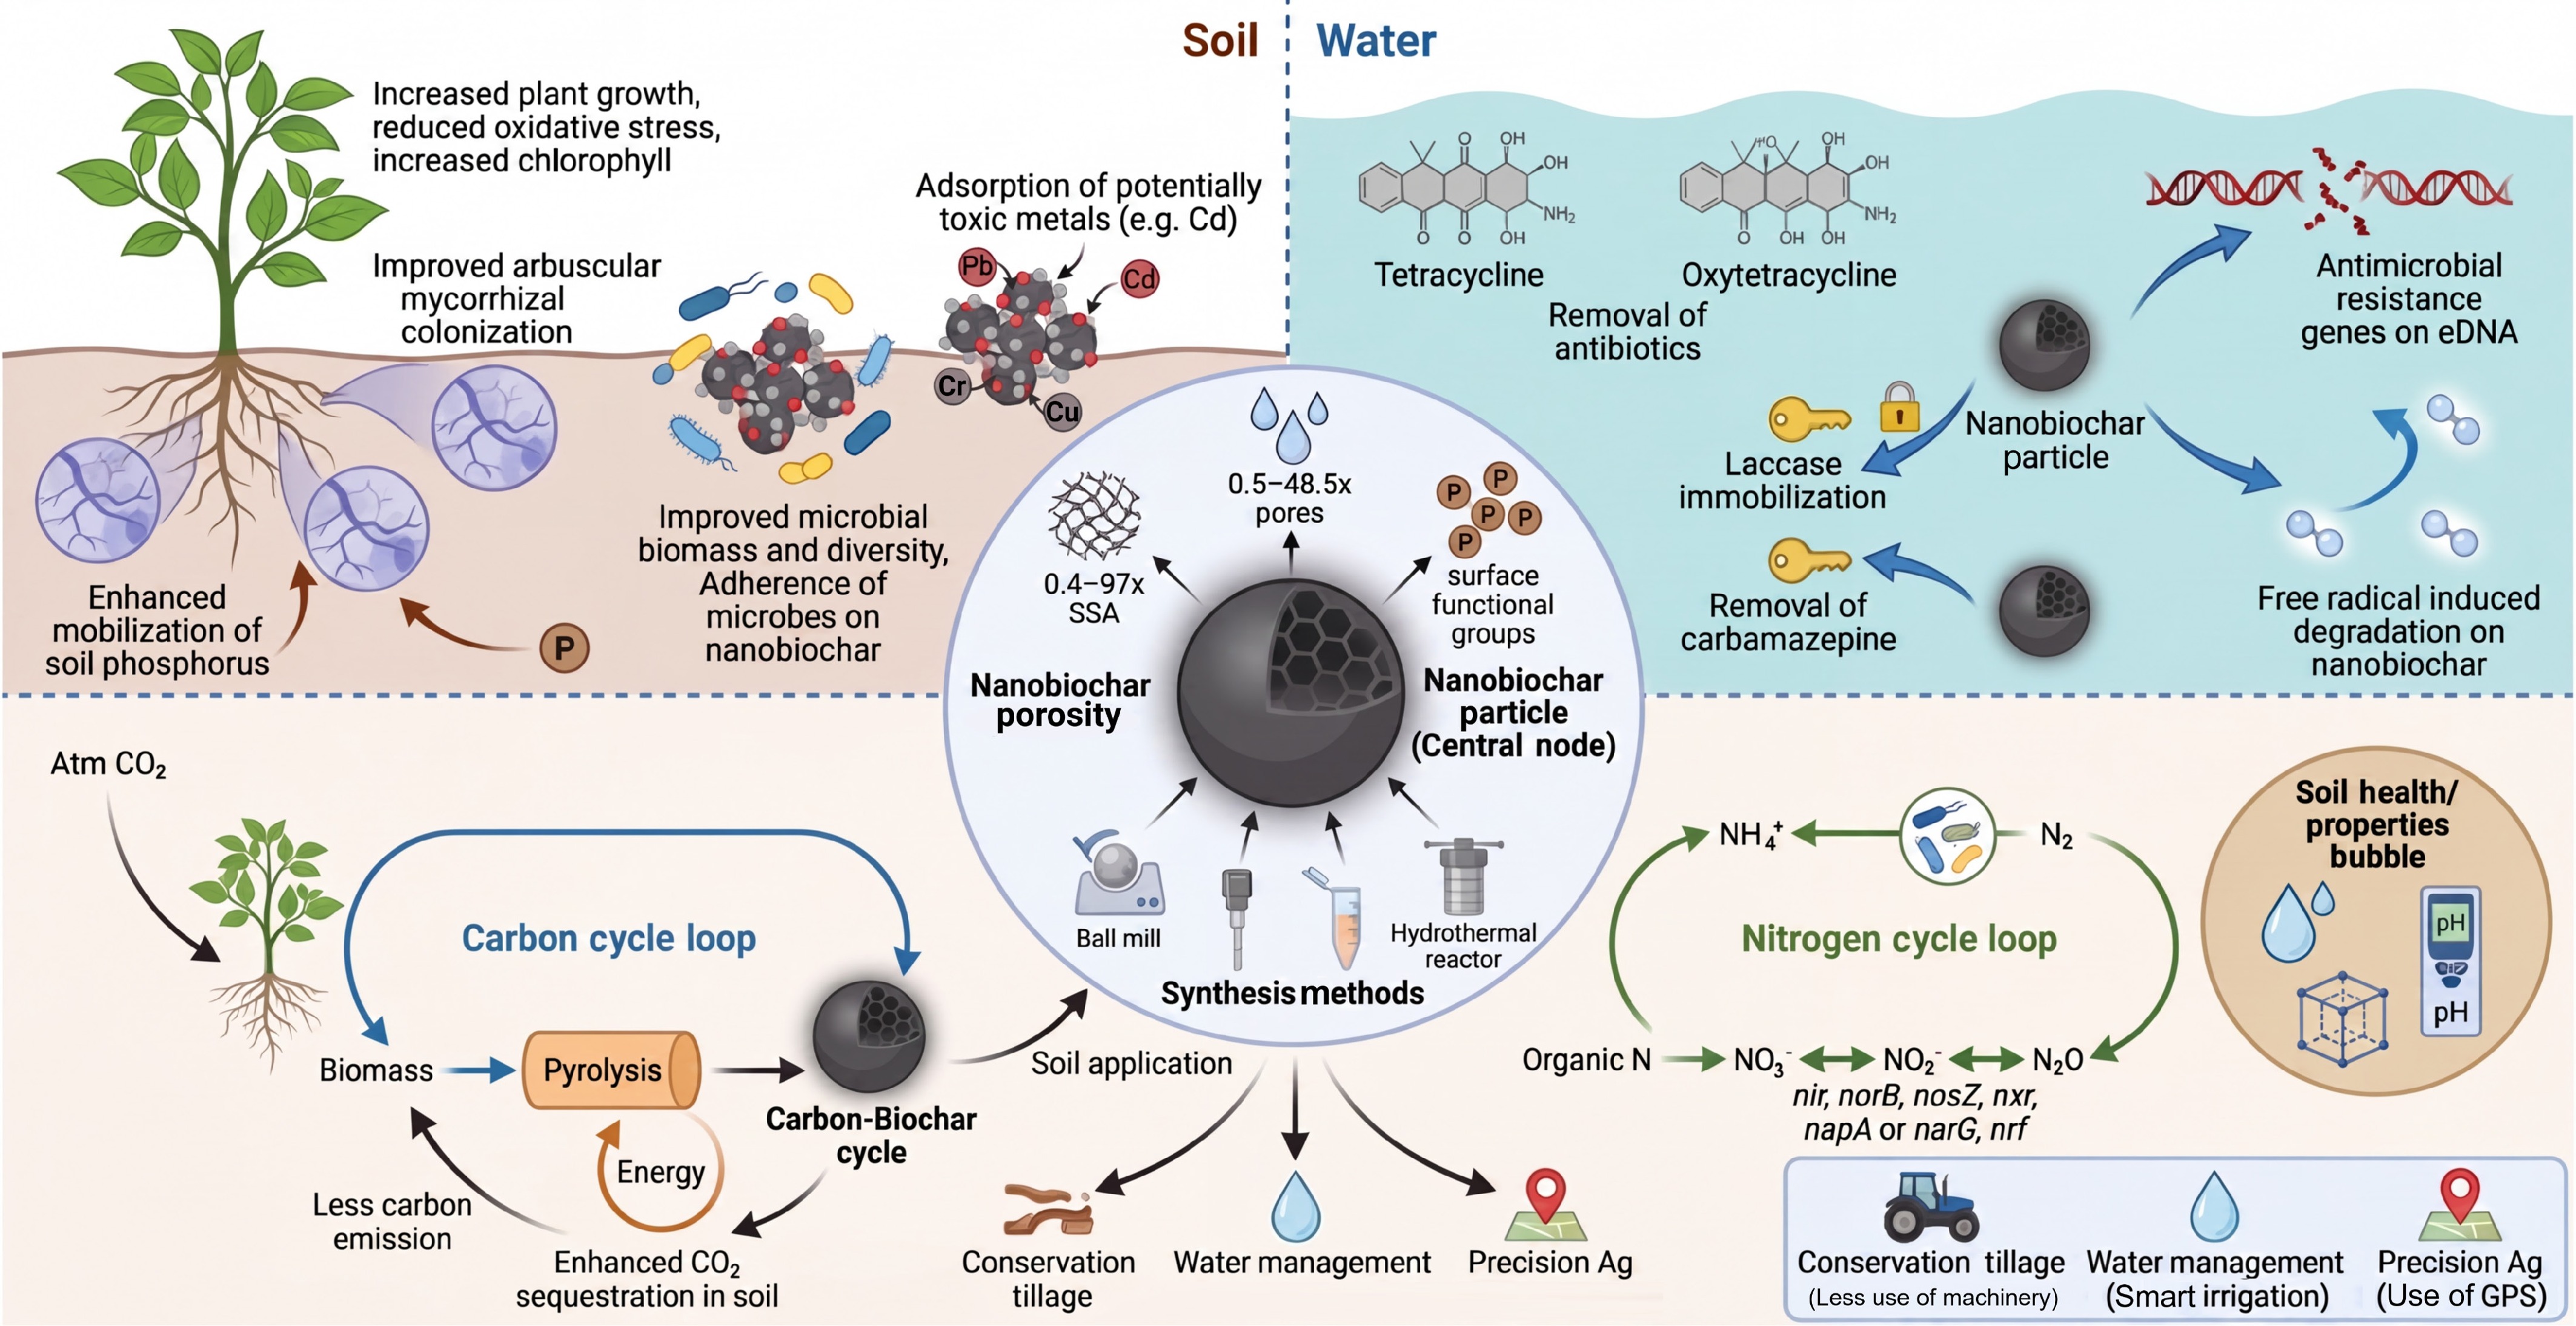
Figure 5.
Multifunctional roles of nanobiochar in sustainable agriculture, illustrating its effects on soil and water quality, plant growth, microbial interactions, pollutant removal, and integration into carbon and nitrogen cycles, along with applications in conservation tillage, water management, and precision agriculture.
-
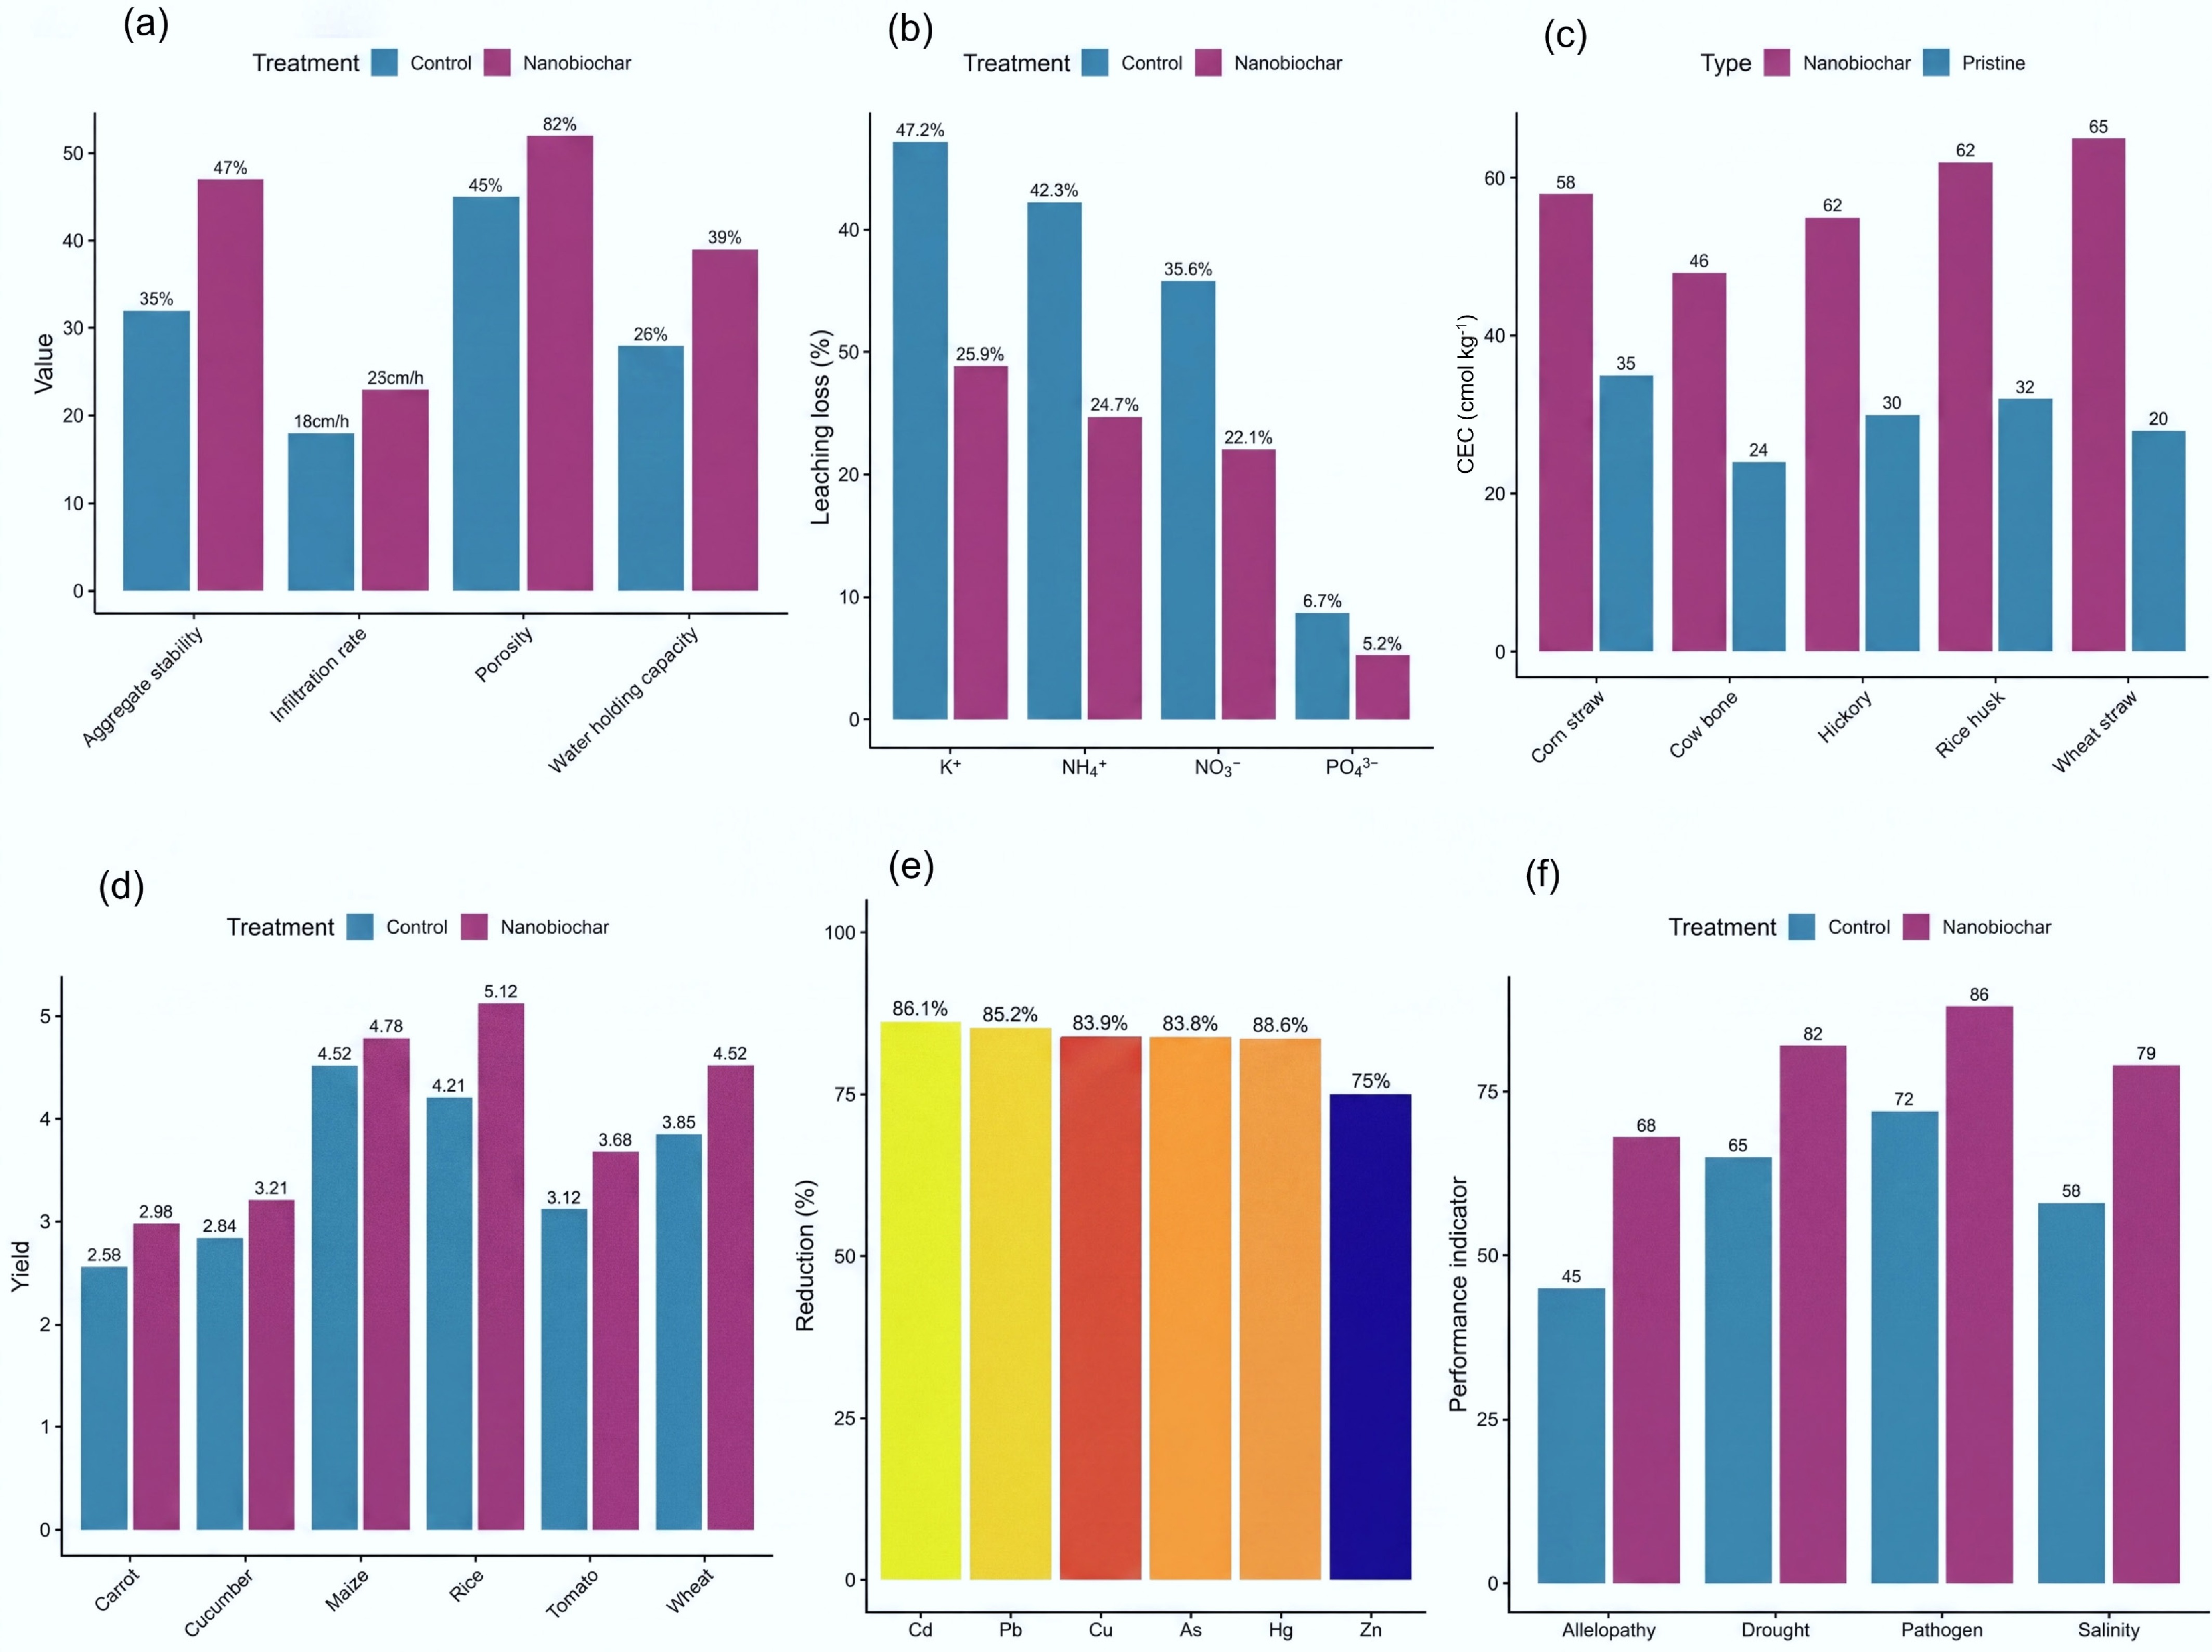
Figure 6.
Soil health improvement and plant growth promotion by nanobiochar. (a) Soil physical properties enhancement with nanobiochar amendment. (b) Nutrient leaching reduction across major nutrients. (c) Cation exchange capacity enhancement across feedstocks. (d) Crop yield enhancement across different crops. (e) Heavy metal uptake reduction. (f) Stress tolerance enhancement under drought, salinity, pathogen, and allelopathic stress. Data compiled from[13, 16,17, 31, 34,35, 41].
-
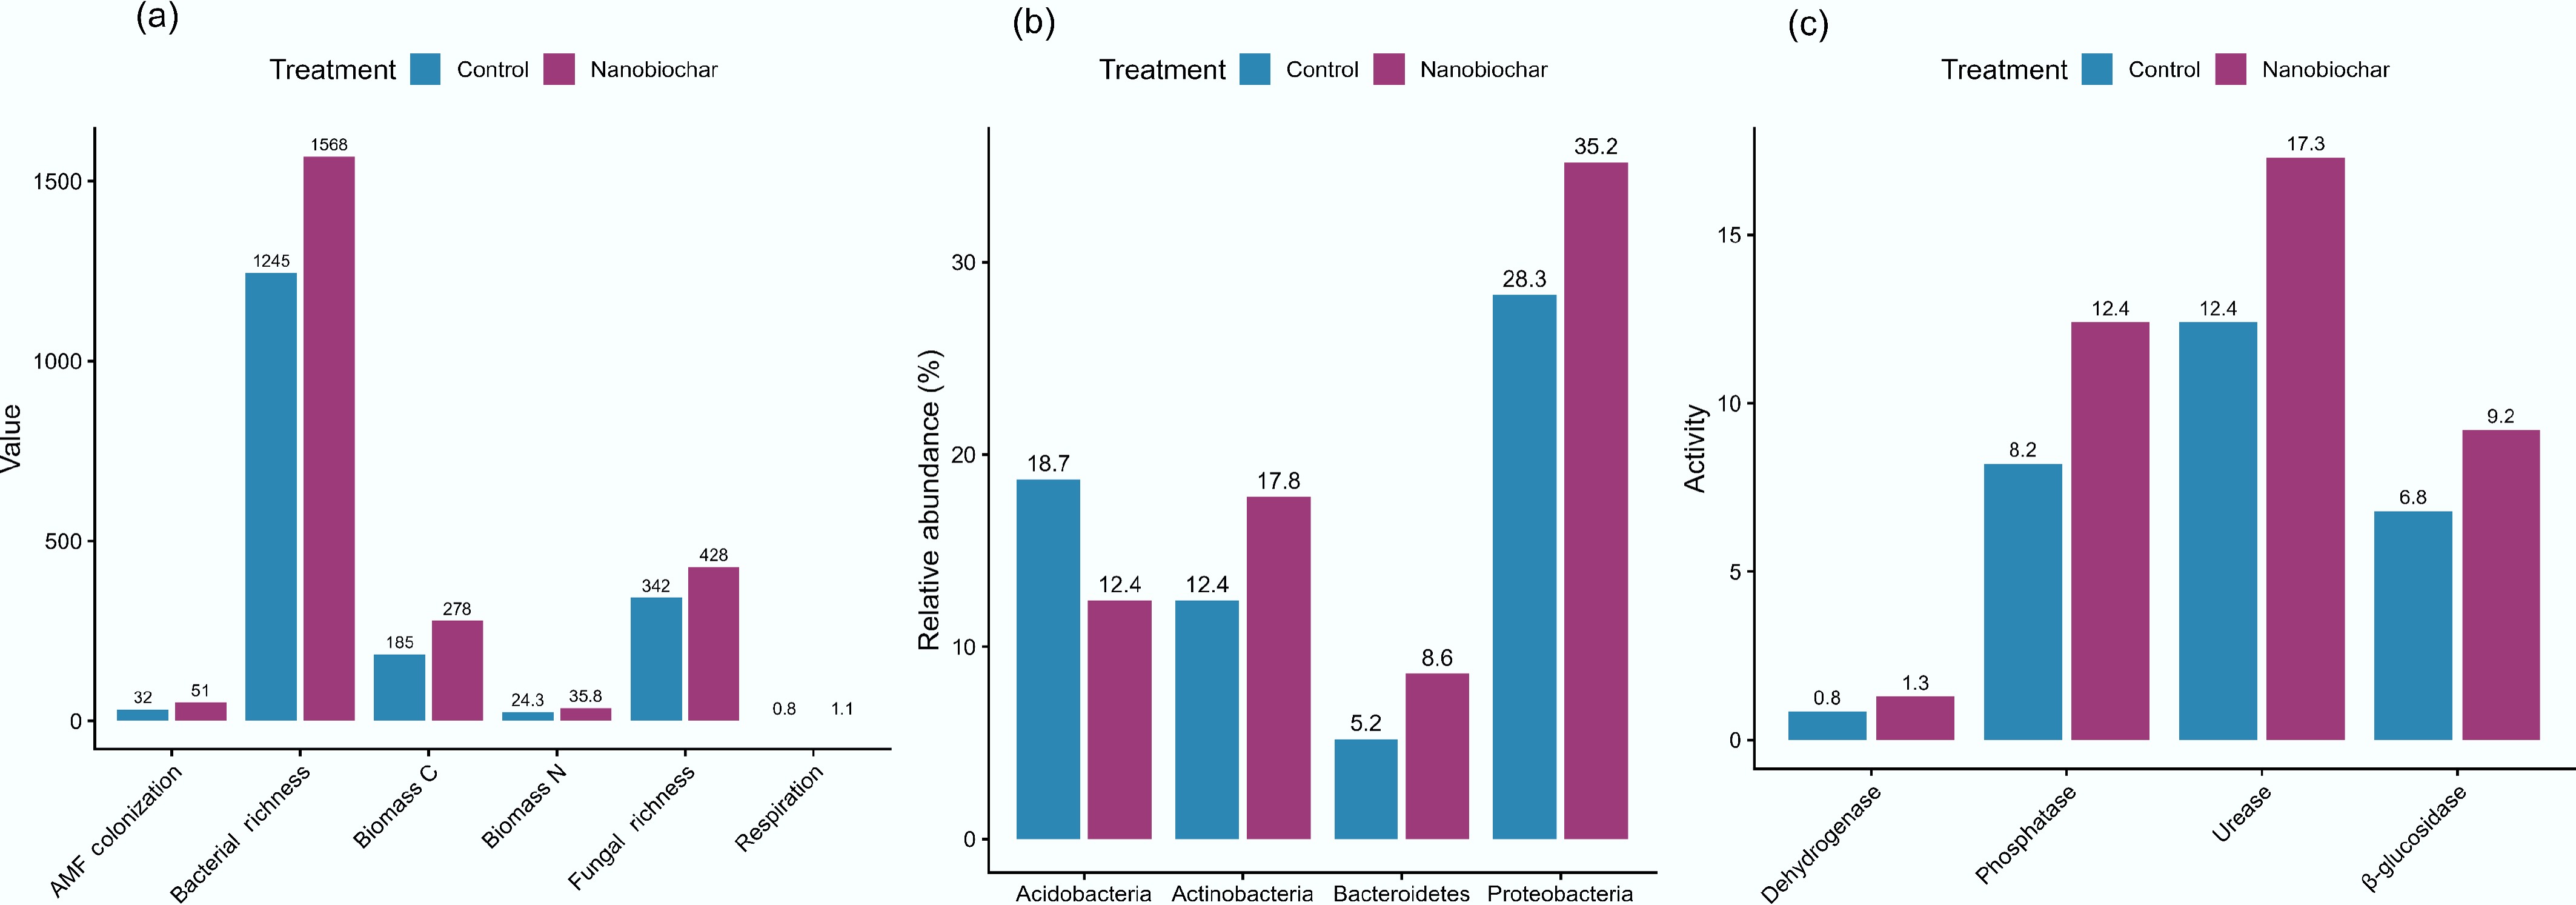
Figure 7.
Microbial community responses to nanobiochar amendment. (a) Increase in microbial biomass and activity parameters. (b) Changes in bacterial phylum abundance showing rises in Proteobacteria, Actinobacteria, and Bacteroidetes with a decrease in Acidobacteria. (c) Enhancement of soil enzyme activities including dehydrogenase, urease, phosphatase, and β-glucosidase. Data compiled from[10, 25, 31, 34].
-
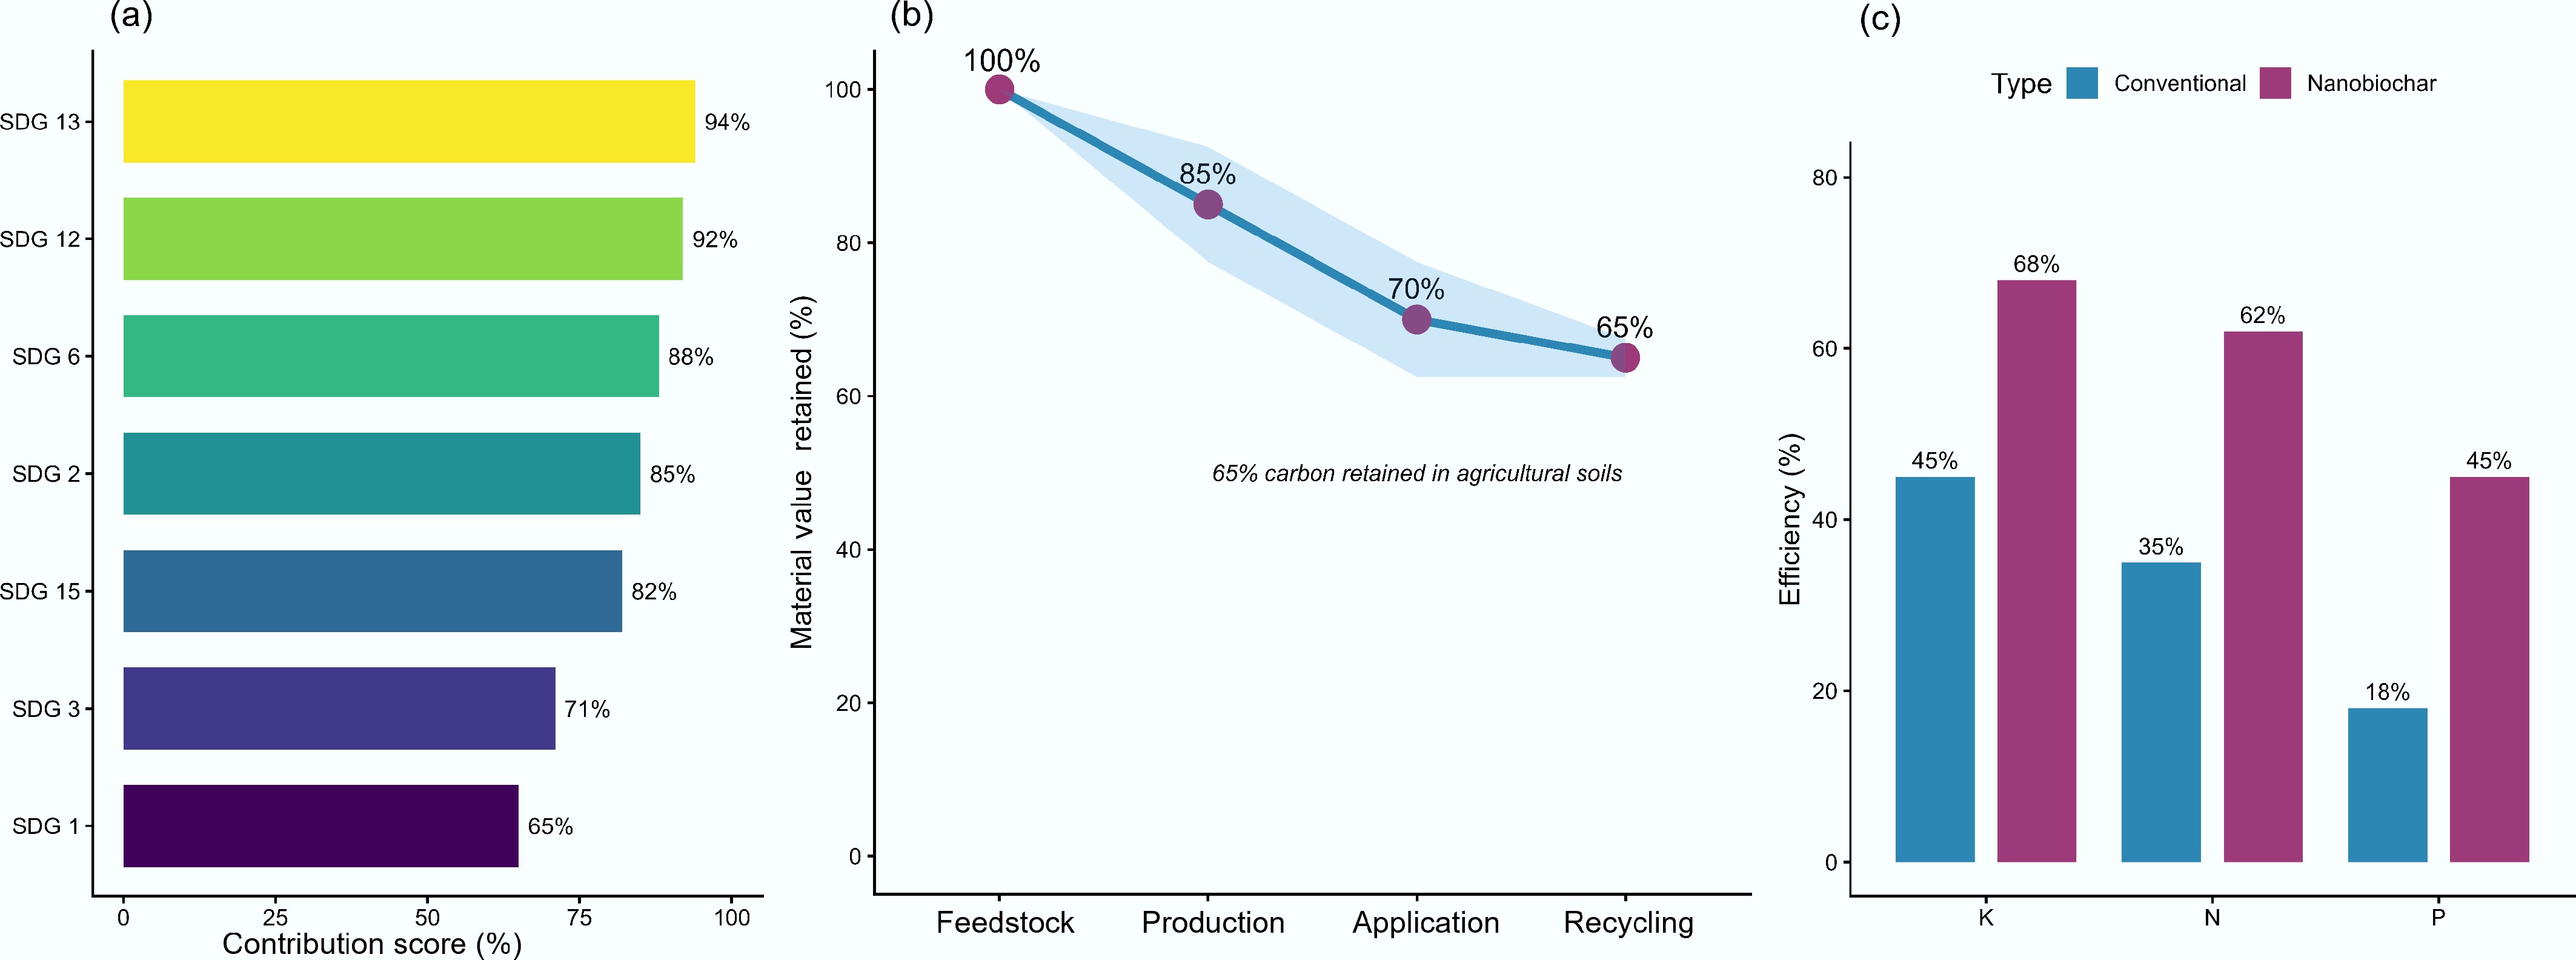
Figure 8.
Circular agriculture and sustainable development contributions of nanobiochar. (a) Contribution scores to Sustainable Development Goals. (b) Material flow efficiency in circular economy showing carbon retention in agricultural soils. (c) Nutrient use efficiency improvement with nanobiochar-based fertilizers compared to conventional fertilizers. Data compiled from previous studies[10, 56,57].
-
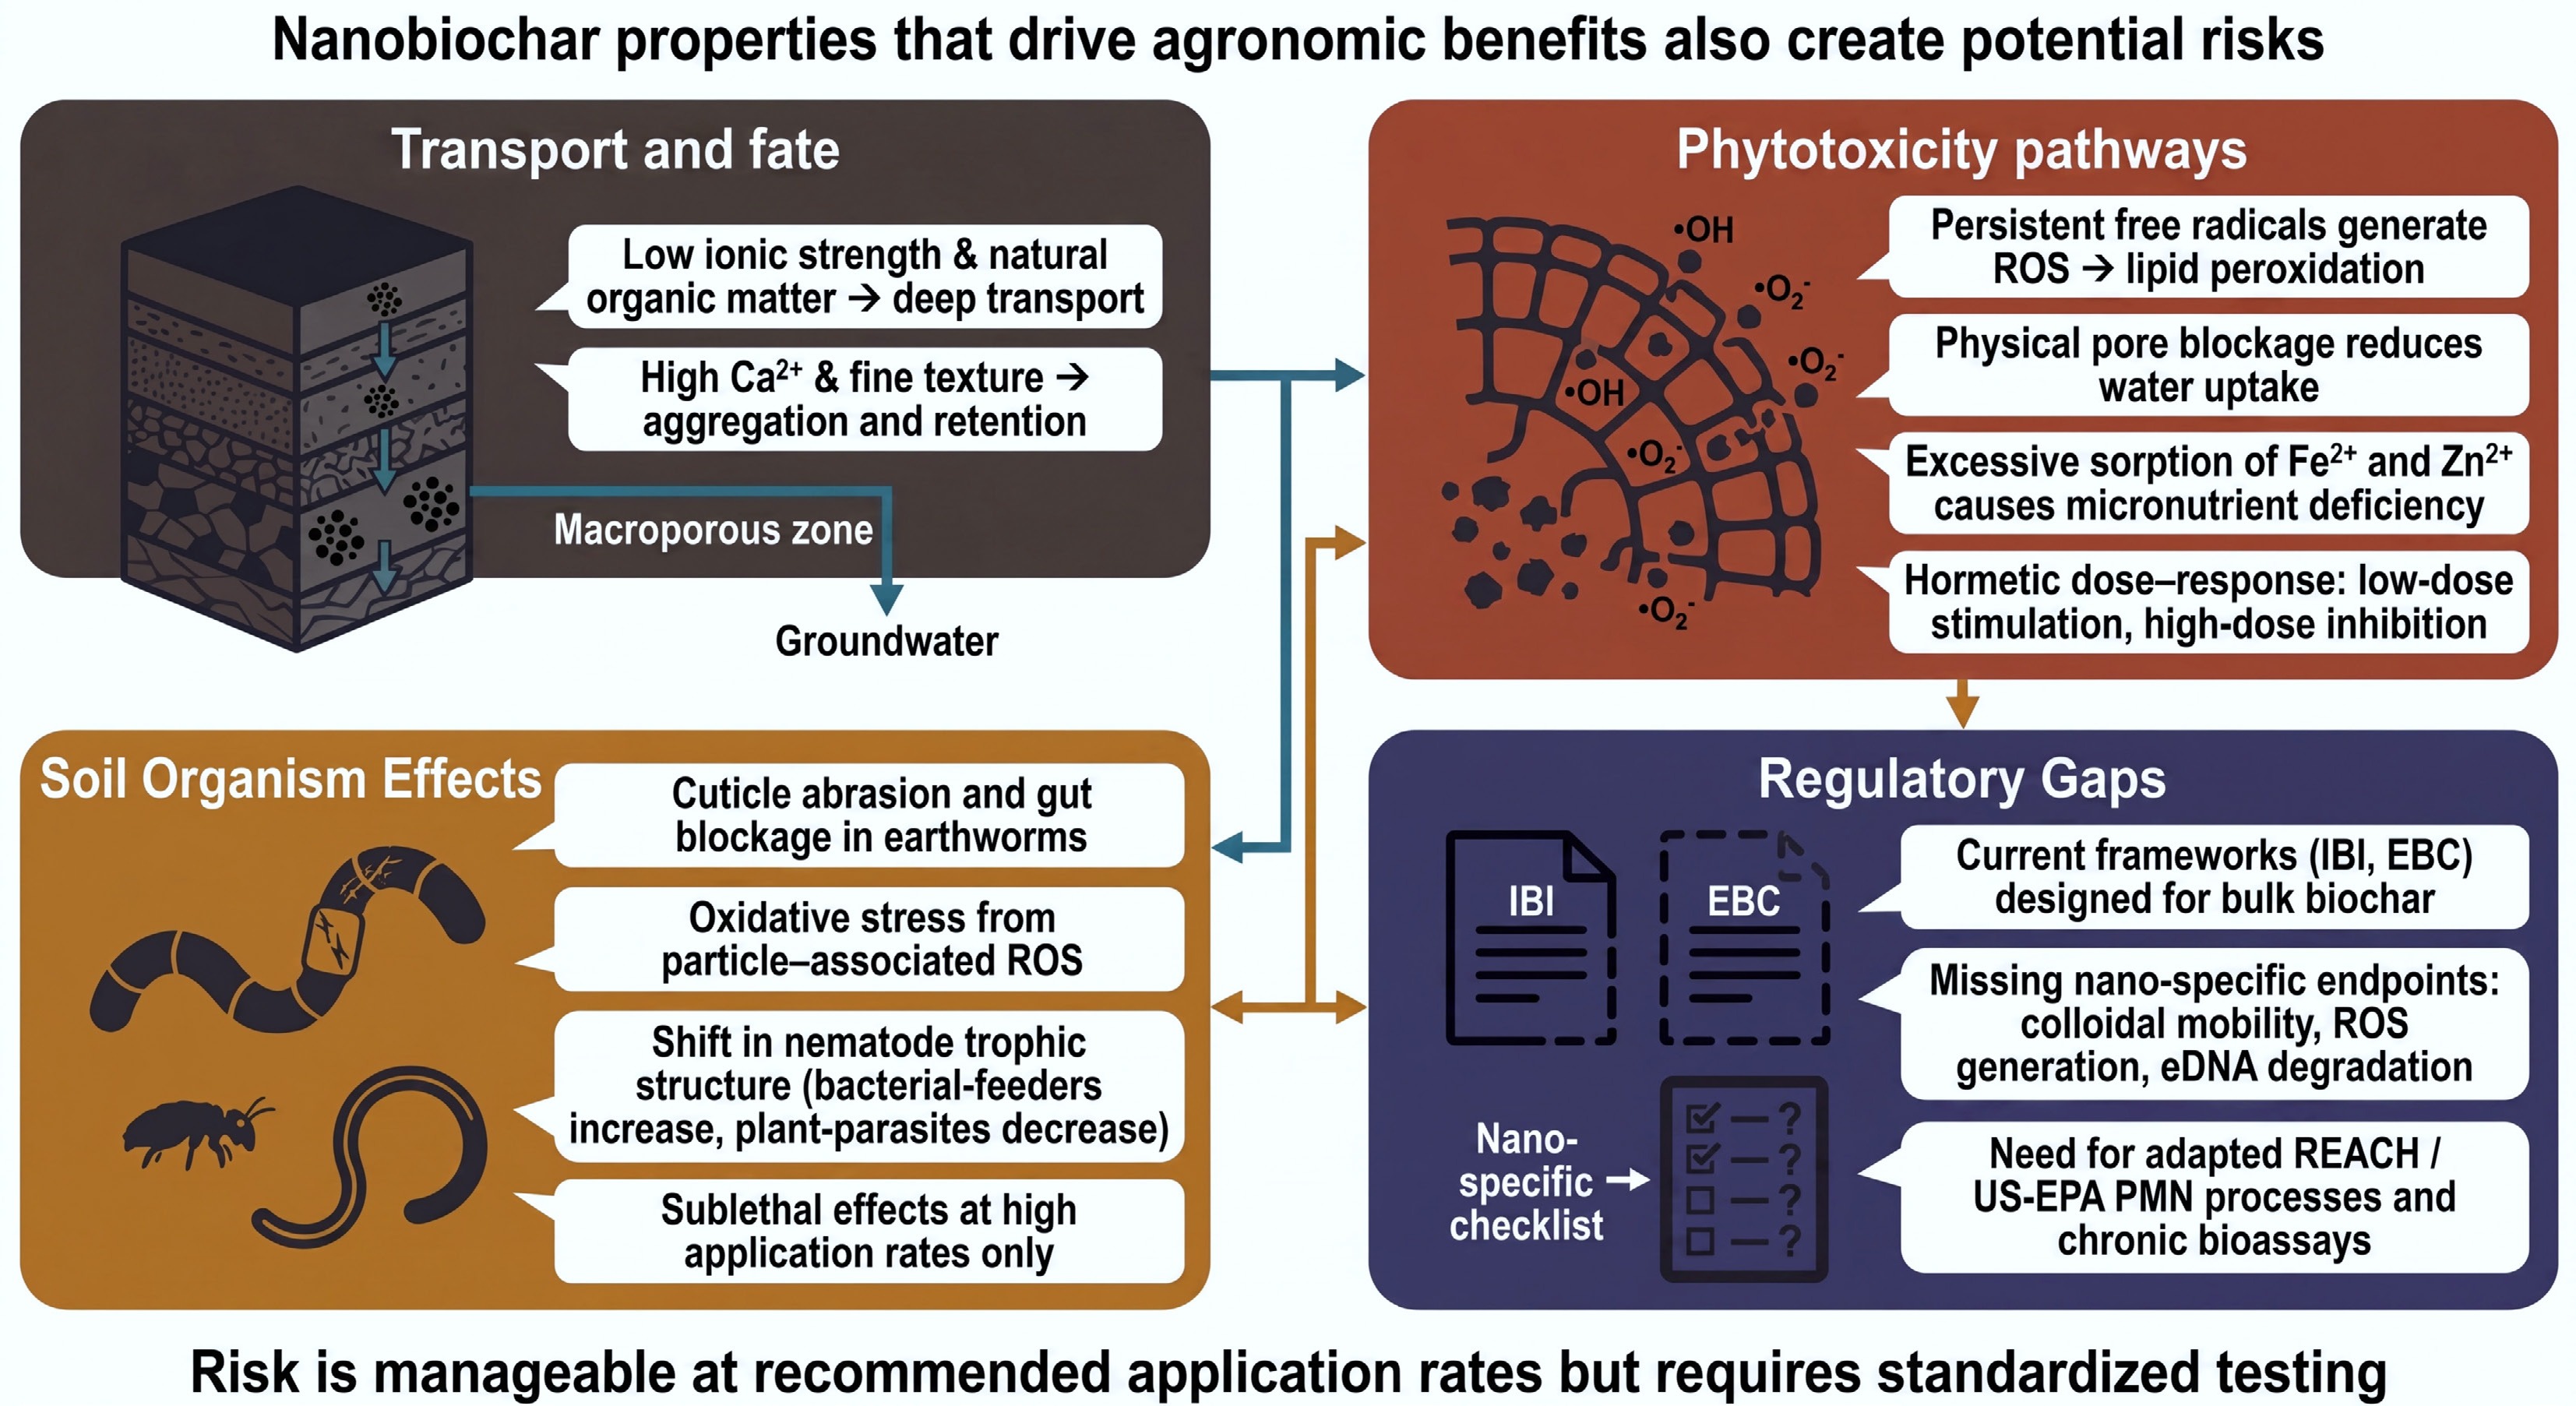
Figure 9.
Environmental risk mechanisms of agricultural nanobiochar. The figure illustrates four interconnected domains critical for safe use: (i) transport and fate (ionic strength, NOM, cation bridging); (ii) phytotoxicity pathways (ROS from persistent free radicals, root blockage, micronutrient imbalance); (iii) soil organism effects (cuticle abrasion, oxidative stress, nematode trophic shifts); and (iv) regulatory gaps where existing bulk-biochar standards lack nano-specific endpoints for mobility, ROS, and eDNA degradation. Risks remain manageable at recommended rates but demand standardized testing and proactive regulation.
-
Property category Parameter Wheat straw biochar Wheat straw nanobiochar Wood chip biochar Wood chip nanobiochar Significance for cyanobacterial colonization Ref. Physical properties Particle size range 50–500 μm 25–180 nm 100–800 μm 40–220 nm Nanoscale dimensions increase available surface area for cyanobacterial cell attachment [10] Specific surface area (m2 g−1) 85.3 ± 12.4 342.6 ± 28.7 112.7 ± 15.8 398.2 ± 31.5 Higher surface area provides more binding sites for cyanobacterial adhesins [10] Total pore volume (cm3 g−1) 0.08 ± 0.02 0.24 ± 0.04 0.12 ± 0.03 0.31 ± 0.05 Mesoporous structure facilitates nutrient diffusion around attached cells [10] Average pore diameter (nm) 15.3 ± 2.1 8.7 ± 1.2 18.6 ± 2.4 9.2 ± 1.3 Smaller pores in nanobiochar enhance water retention in dryland soils [10, 12] Surface roughness (nm) 85.6 ± 12.3 12.4 ± 3.1 112.3 ± 15.7 15.6 ± 3.8 Nanoscale topography mimics natural soil particle surfaces [10] Zeta potential at
pH 7 (mV)–18.7 ± 2.3 –38.4 ± 4.1 –22.5 ± 2.8 –42.3 ± 4.5 Higher negative charge promotes electrostatic interactions with cyanobacterial cells [11, 25] Colloidal stability (h) < 2 56.3 ± 7.2 < 2 62.8 ± 8.1 Extended stability ensures prolonged interaction with motile cyanobacteria [25] Chemical properties Carbon content (%) 72.4 ± 3.2 78.6 ± 3.5 81.3 ± 3.8 84.7 ± 3.9 High carbon stability ensures long-term persistence in soil [10] Oxygen content (%) 15.3 ± 1.8 12.4 ± 1.5 11.2 ± 1.4 9.8 ± 1.2 Oxygen-containing groups serve as recognition sites for cell surface proteins [10] Carboxyl groups (mmol g−1) 0.42 ± 0.08 1.38 ± 0.15 0.38 ± 0.07 1.42 ± 0.16 Carboxyl groups mediate hydrogen bonding with EPS polysaccharides [12, 23] Hydroxyl groups (mmol g−1) 0.56 ± 0.09 1.62 ± 0.18 0.48 ± 0.08 1.58 ± 0.17 Hydroxyl groups contribute to water retention and hydrogen bonding [12, 23] Phenolic groups (mmol g−1) 0.23 ± 0.04 0.78 ± 0.09 0.28 ± 0.05 0.82 ± 0.10 Phenolic compounds may stimulate heterocyst differentiation [12] Cation exchange capacity (cmol kg−1) 28.6 ± 3.5 64.3 ± 5.8 32.4 ± 3.9 71.5 ± 6.2 Enhanced nutrient retention supports cyanobacterial metabolism [13, 34] pH (in water) 8.7 ± 0.3 7.4 ± 0.2 8.2 ± 0.3 7.1 ± 0.2 Near-neutral pH minimizes osmotic stress during colonization [10] Electron donating capacity (μmol e− g−1) 98.4 ± 12.5 287.6 ± 24.3 124.7 ± 15.8 326.8 ± 28.4 Redox activity facilitates electron transfer to photosynthetic chains [10] Surface functional groups (FTIR peak intensity) O–H stretching
(3,400 cm−1)0.28 ± 0.04 0.72 ± 0.08 0.24 ± 0.03 0.68 ± 0.07 Hydroxyl groups enhance hydrogen bonding with cyanobacterial sheaths [11] 3.2 C=O Stretching (1,700 cm−¹) 0.18 ± 0.03 0.58 ± 0.06 0.16 ± 0.02 0.54 ± 0.06 Carbonyl groups participate in protein recognition [11] 3.3 C–O Stretching (1,100 cm−¹) 0.32 ± 0.04 0.82 ± 0.09 0.28 ± 0.03 0.78 ± 0.08 C–O groups indicate polysaccharide-like structures [11] Aromatic C=C
(1,600 cm−¹)0.45 ± 0.05 0.38 ± 0.04 0.52 ± 0.06 0.44 ± 0.05 Aromatic structures contribute to hydrophobic interactions [11] Elemental composition C/N ratio 45.6 ± 4.2 42.3 ± 3.9 78.4 ± 6.5 72.6 ± 5.8 Lower C/N ratio in straw biochar favors microbial activity [10] H/C atomic ratio 0.38 ± 0.04 0.32 ± 0.03 0.35 ± 0.03 0.30 ± 0.03 Lower H/C indicates higher aromaticity and stability [10] O/C atomic ratio 0.21 ± 0.02 0.16 ± 0.02 0.14 ± 0.01 0.12 ± 0.01 O/C ratio correlates with surface hydrophilicity [10] Ash content (%) 12.3 ± 1.5 9.8 ± 1.1 5.6 ± 0.7 4.8 ± 0.6 Ash provides micronutrients for cyanobacterial metabolism [10] Table 1.
Physicochemical properties of bulk biochar and nanobiochar derived from different feedstocks
-
Category Parameter Observed effect Ref. Soil physical properties Total porosity Increased by 5%–15% [16, 35] Soil moisture retention Increased from 28% to 39%–47% [16, 35] Soil erosion loss Reduced by 10%–11% [16, 35] Nutrient dynamics Ammonium (NH4+) leaching Reduced by 30%–50% [16] Total Phosphorus (P) leaching Reduced by 40%–45% [16, 34] Plant-available P Increased by 20%–30% [16, 34] Plant growth Grain yield Increased by 10%–20% [9, 14] Shoot biomass Increased by 15%–25% [9, 14] Root biomass Increased by 20%–30% [9, 14] Stress mitigation Drought yield reduction Mitigated by 30%–50% [16,17] Cadmium (Cd) tissue accumulation Decreased by 86.5%–95.1% [31, 41] Salinity stress biomass Increased by 25%–40% [42] Bacterial leaf spot severity Reduced by 30%–50% [46] Soil biological activity Microbial biomass Enhanced by 25%–60% [25, 31] N-cycling enzyme activity Increased by 25%–45% [31] Dehydrogenase activity Increased by 30%–60% [31, 34] AMF root colonization Increased by 30%–60% [40] Table 2.
Agronomic and environmental performance enhancements of nanobiochar amendments across diverse cropping systems and stress conditions
Figures
(9)
Tables
(2)