-
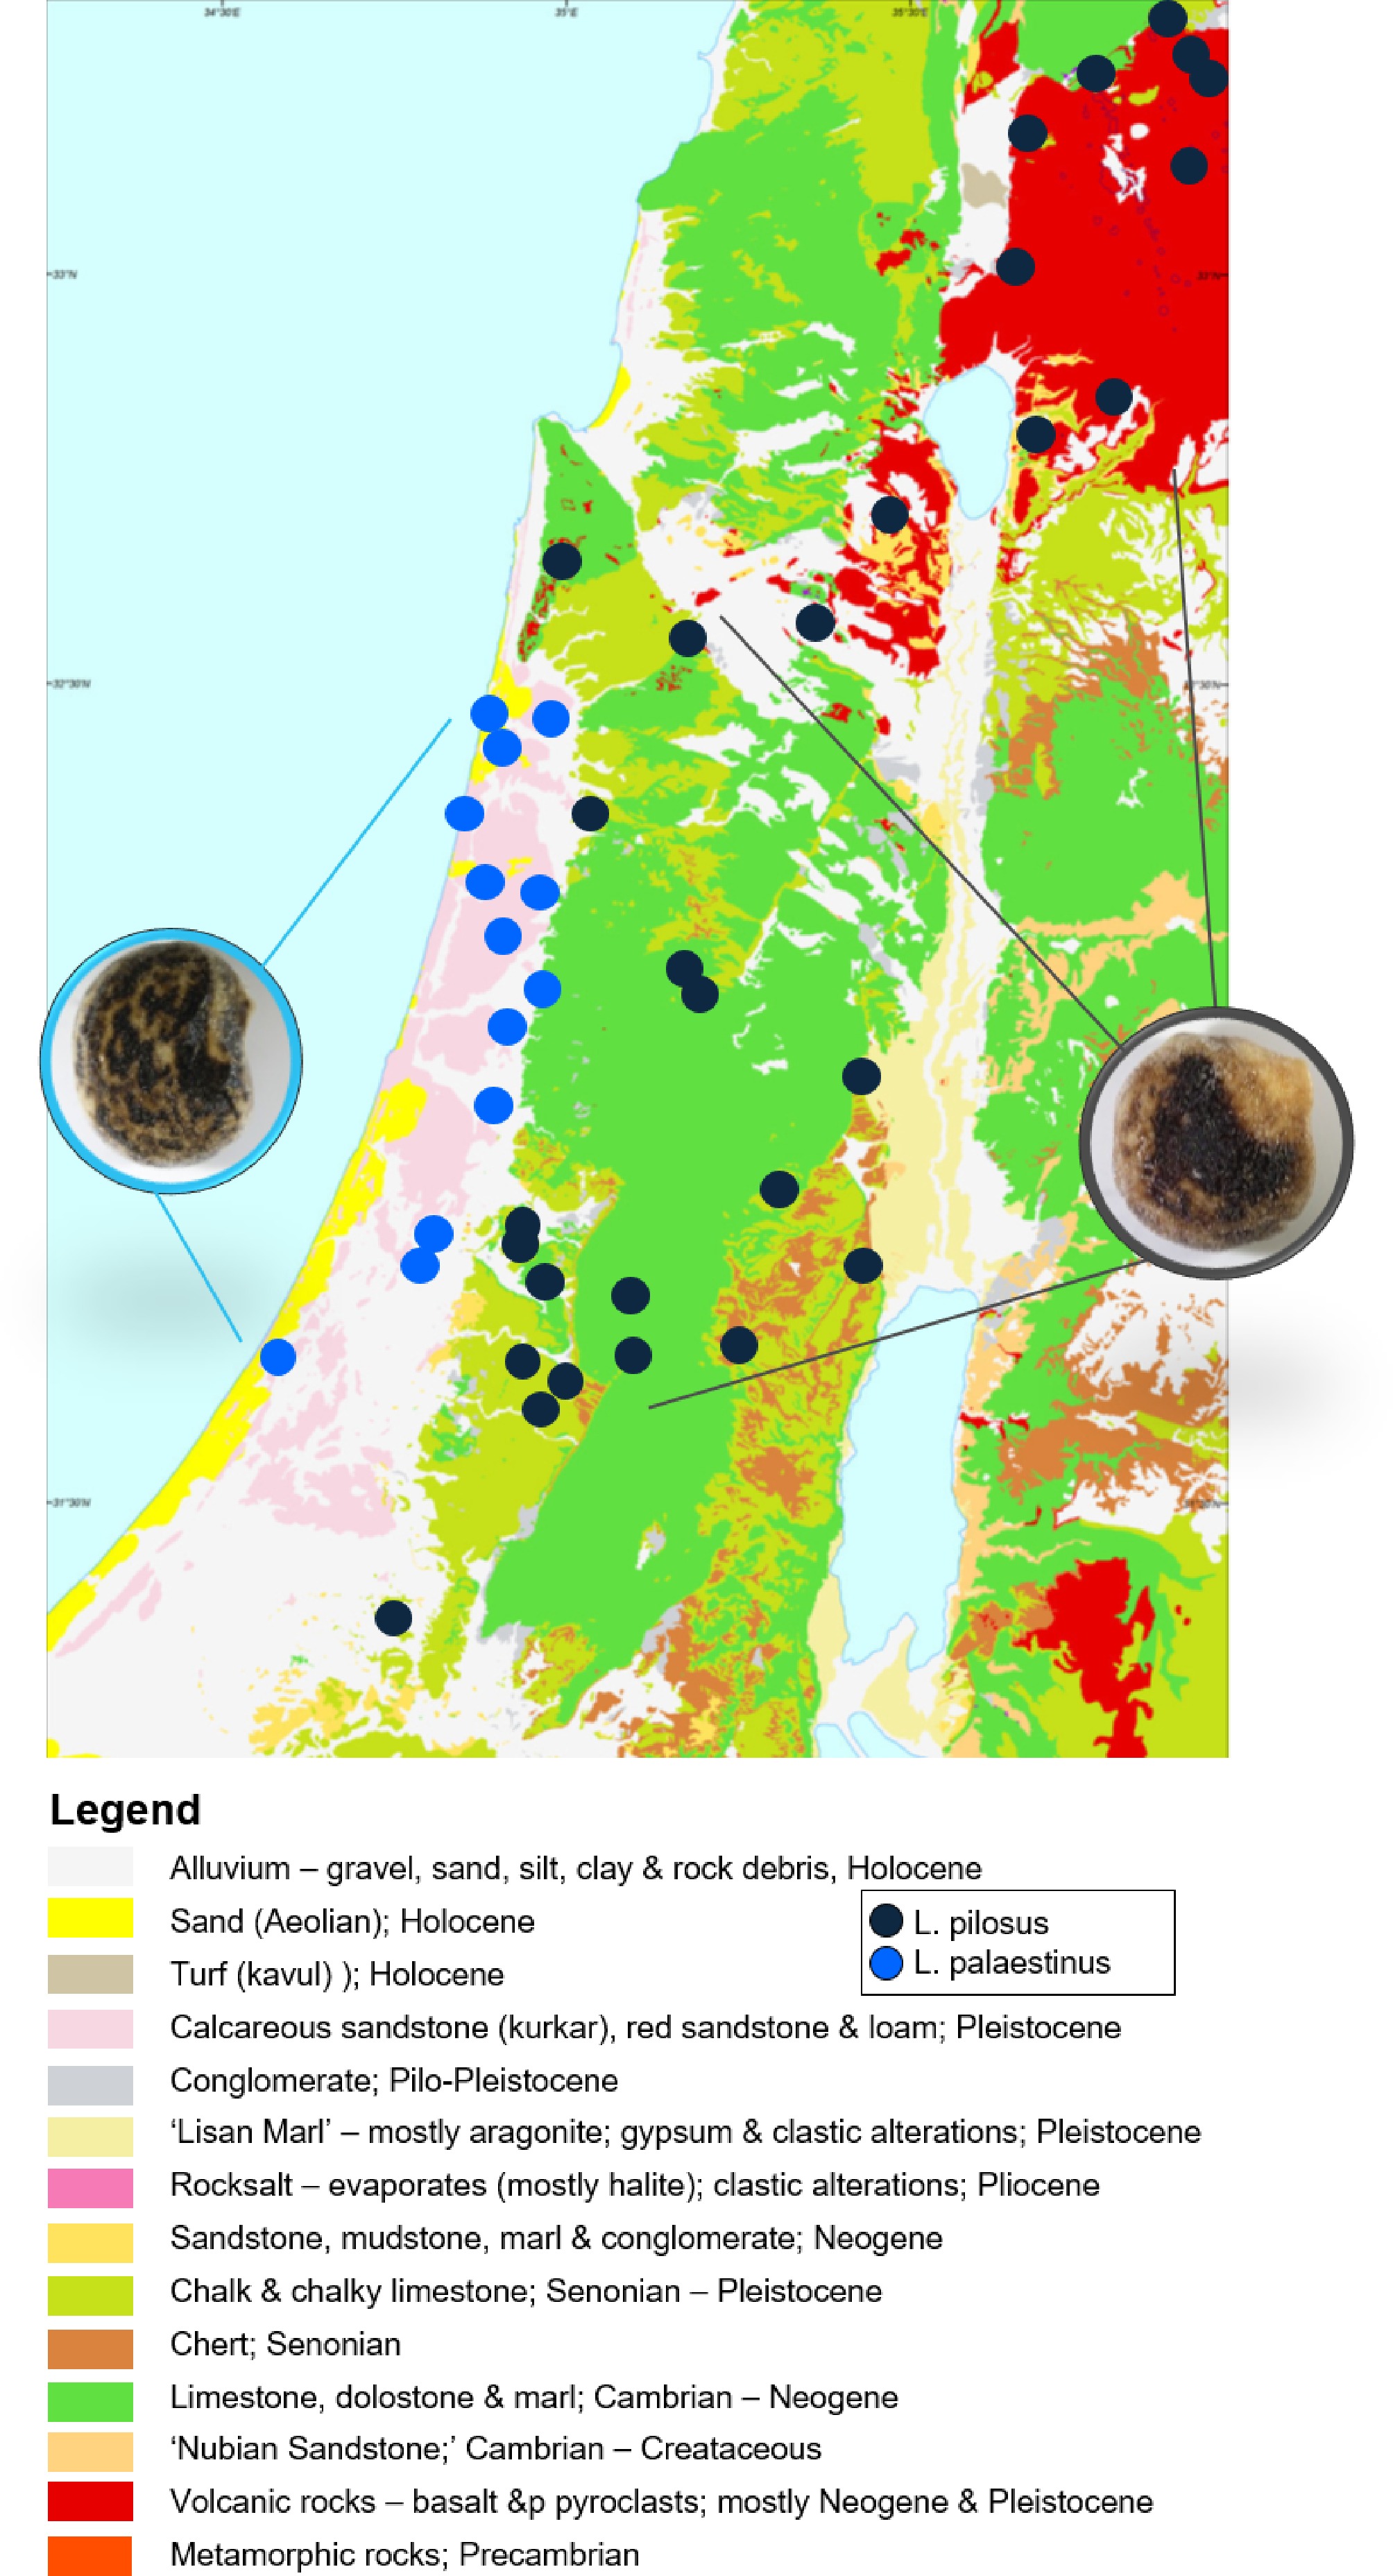
Figure 1.
Sampling locations of the populations of local wild lupins Lupinus pilosus (dark grey dots; photo of seed on the right side of the map), and L. palaestinus (light blue dots; photo of seed on the left side of the map), overlain on the geological map of Israel. The background map is taken from the Geological Survey of Israel, the governmental website:
www.gov.il/en/pages/israel-map-1-200k . -
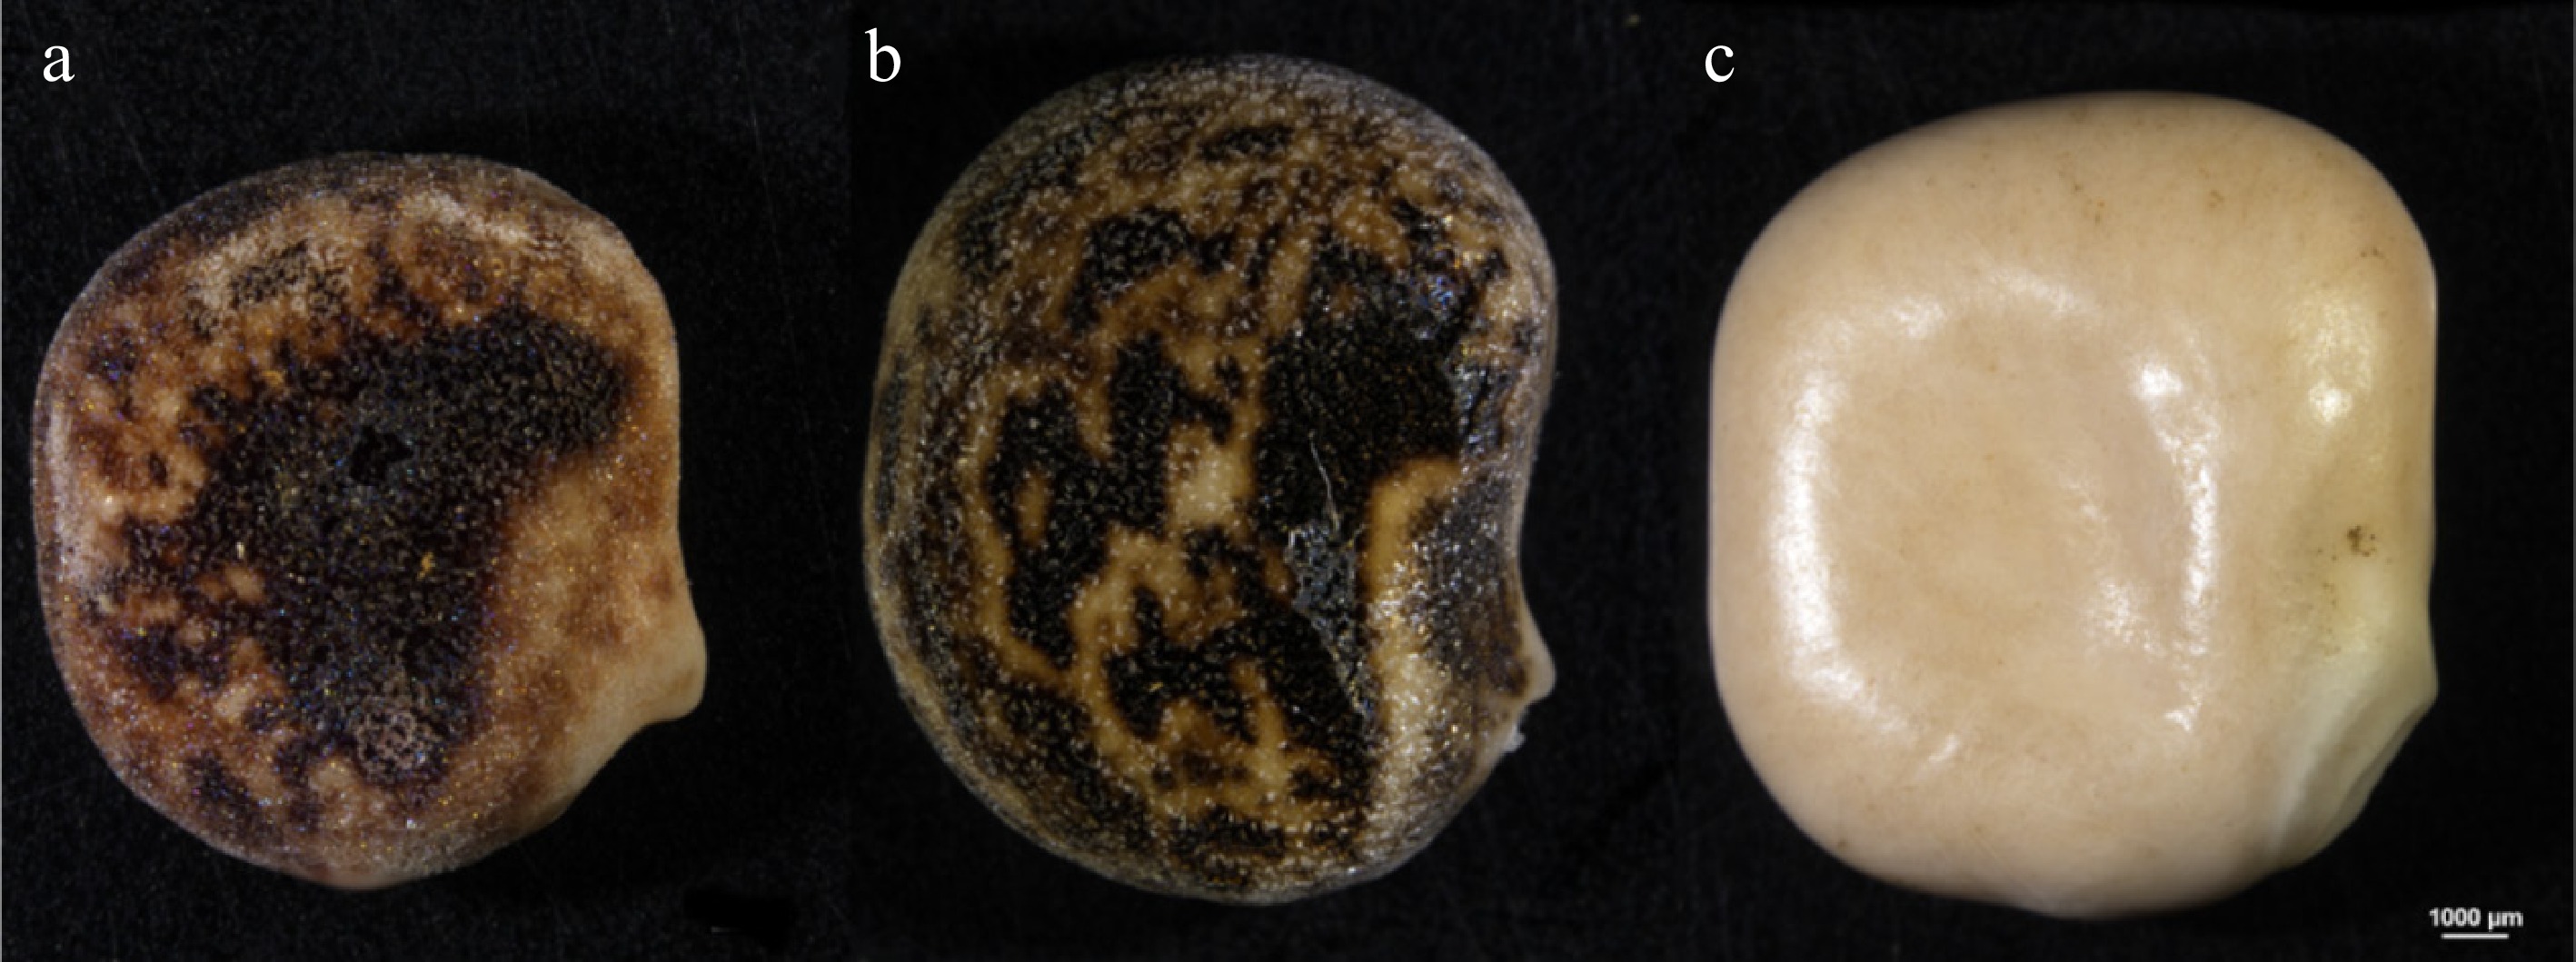
Figure 2.
Representative seeds of Lupinus species in this study: two local species: (a) L. pilosus, (b) L. palaestinus, and (c) L. albus; edible reference species.
-
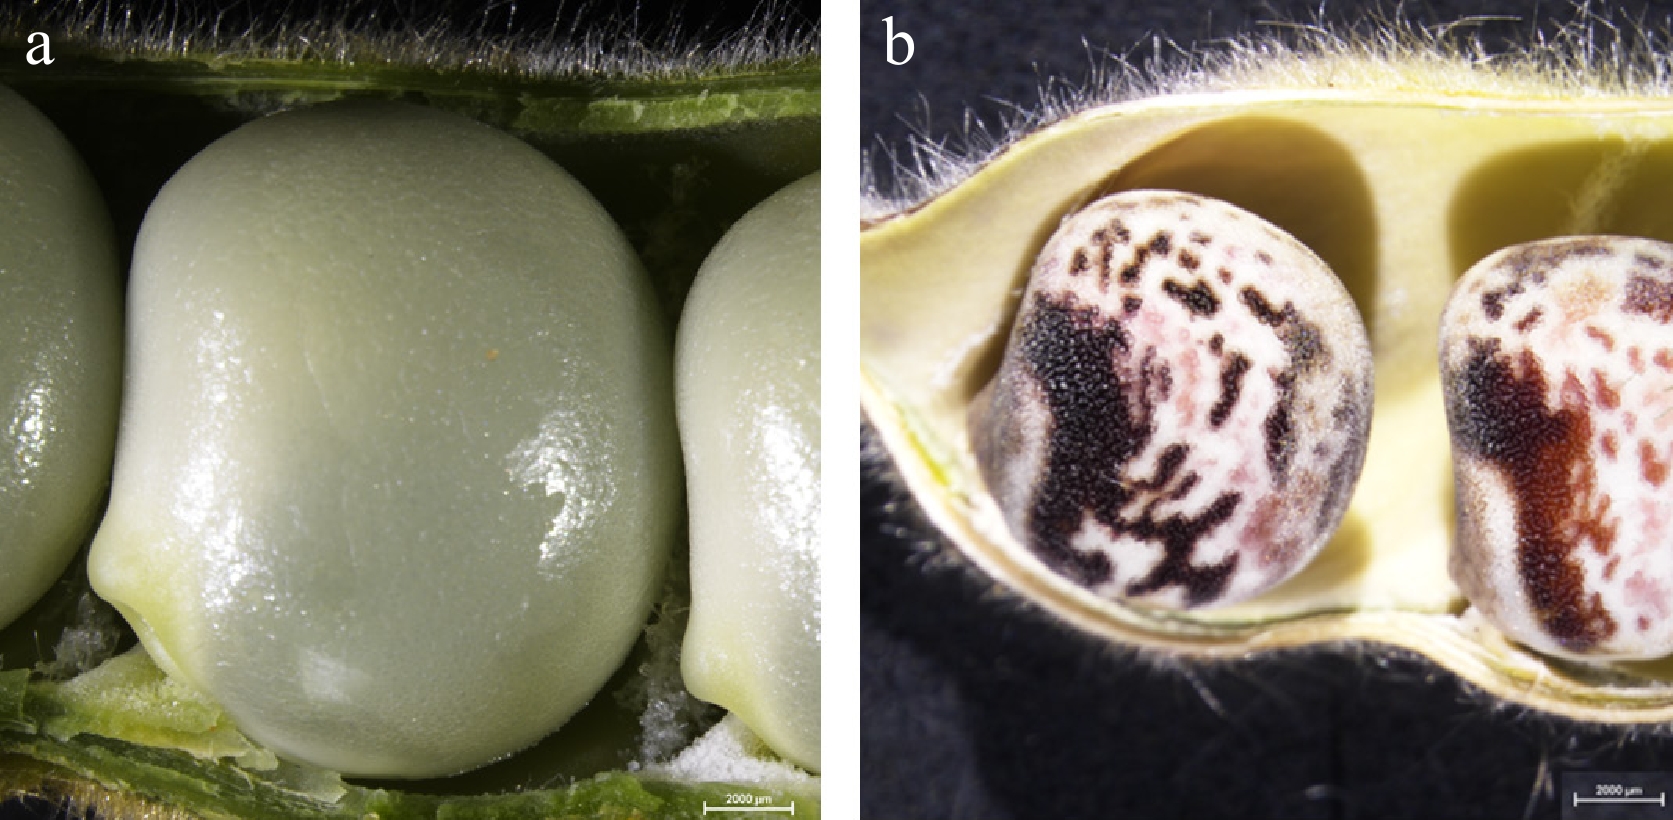
Figure 3.
Lupinus pilosus seeds in a pod immediately after harvest and exposure to the (a) air, and (b) after 5 h of air drying.
-
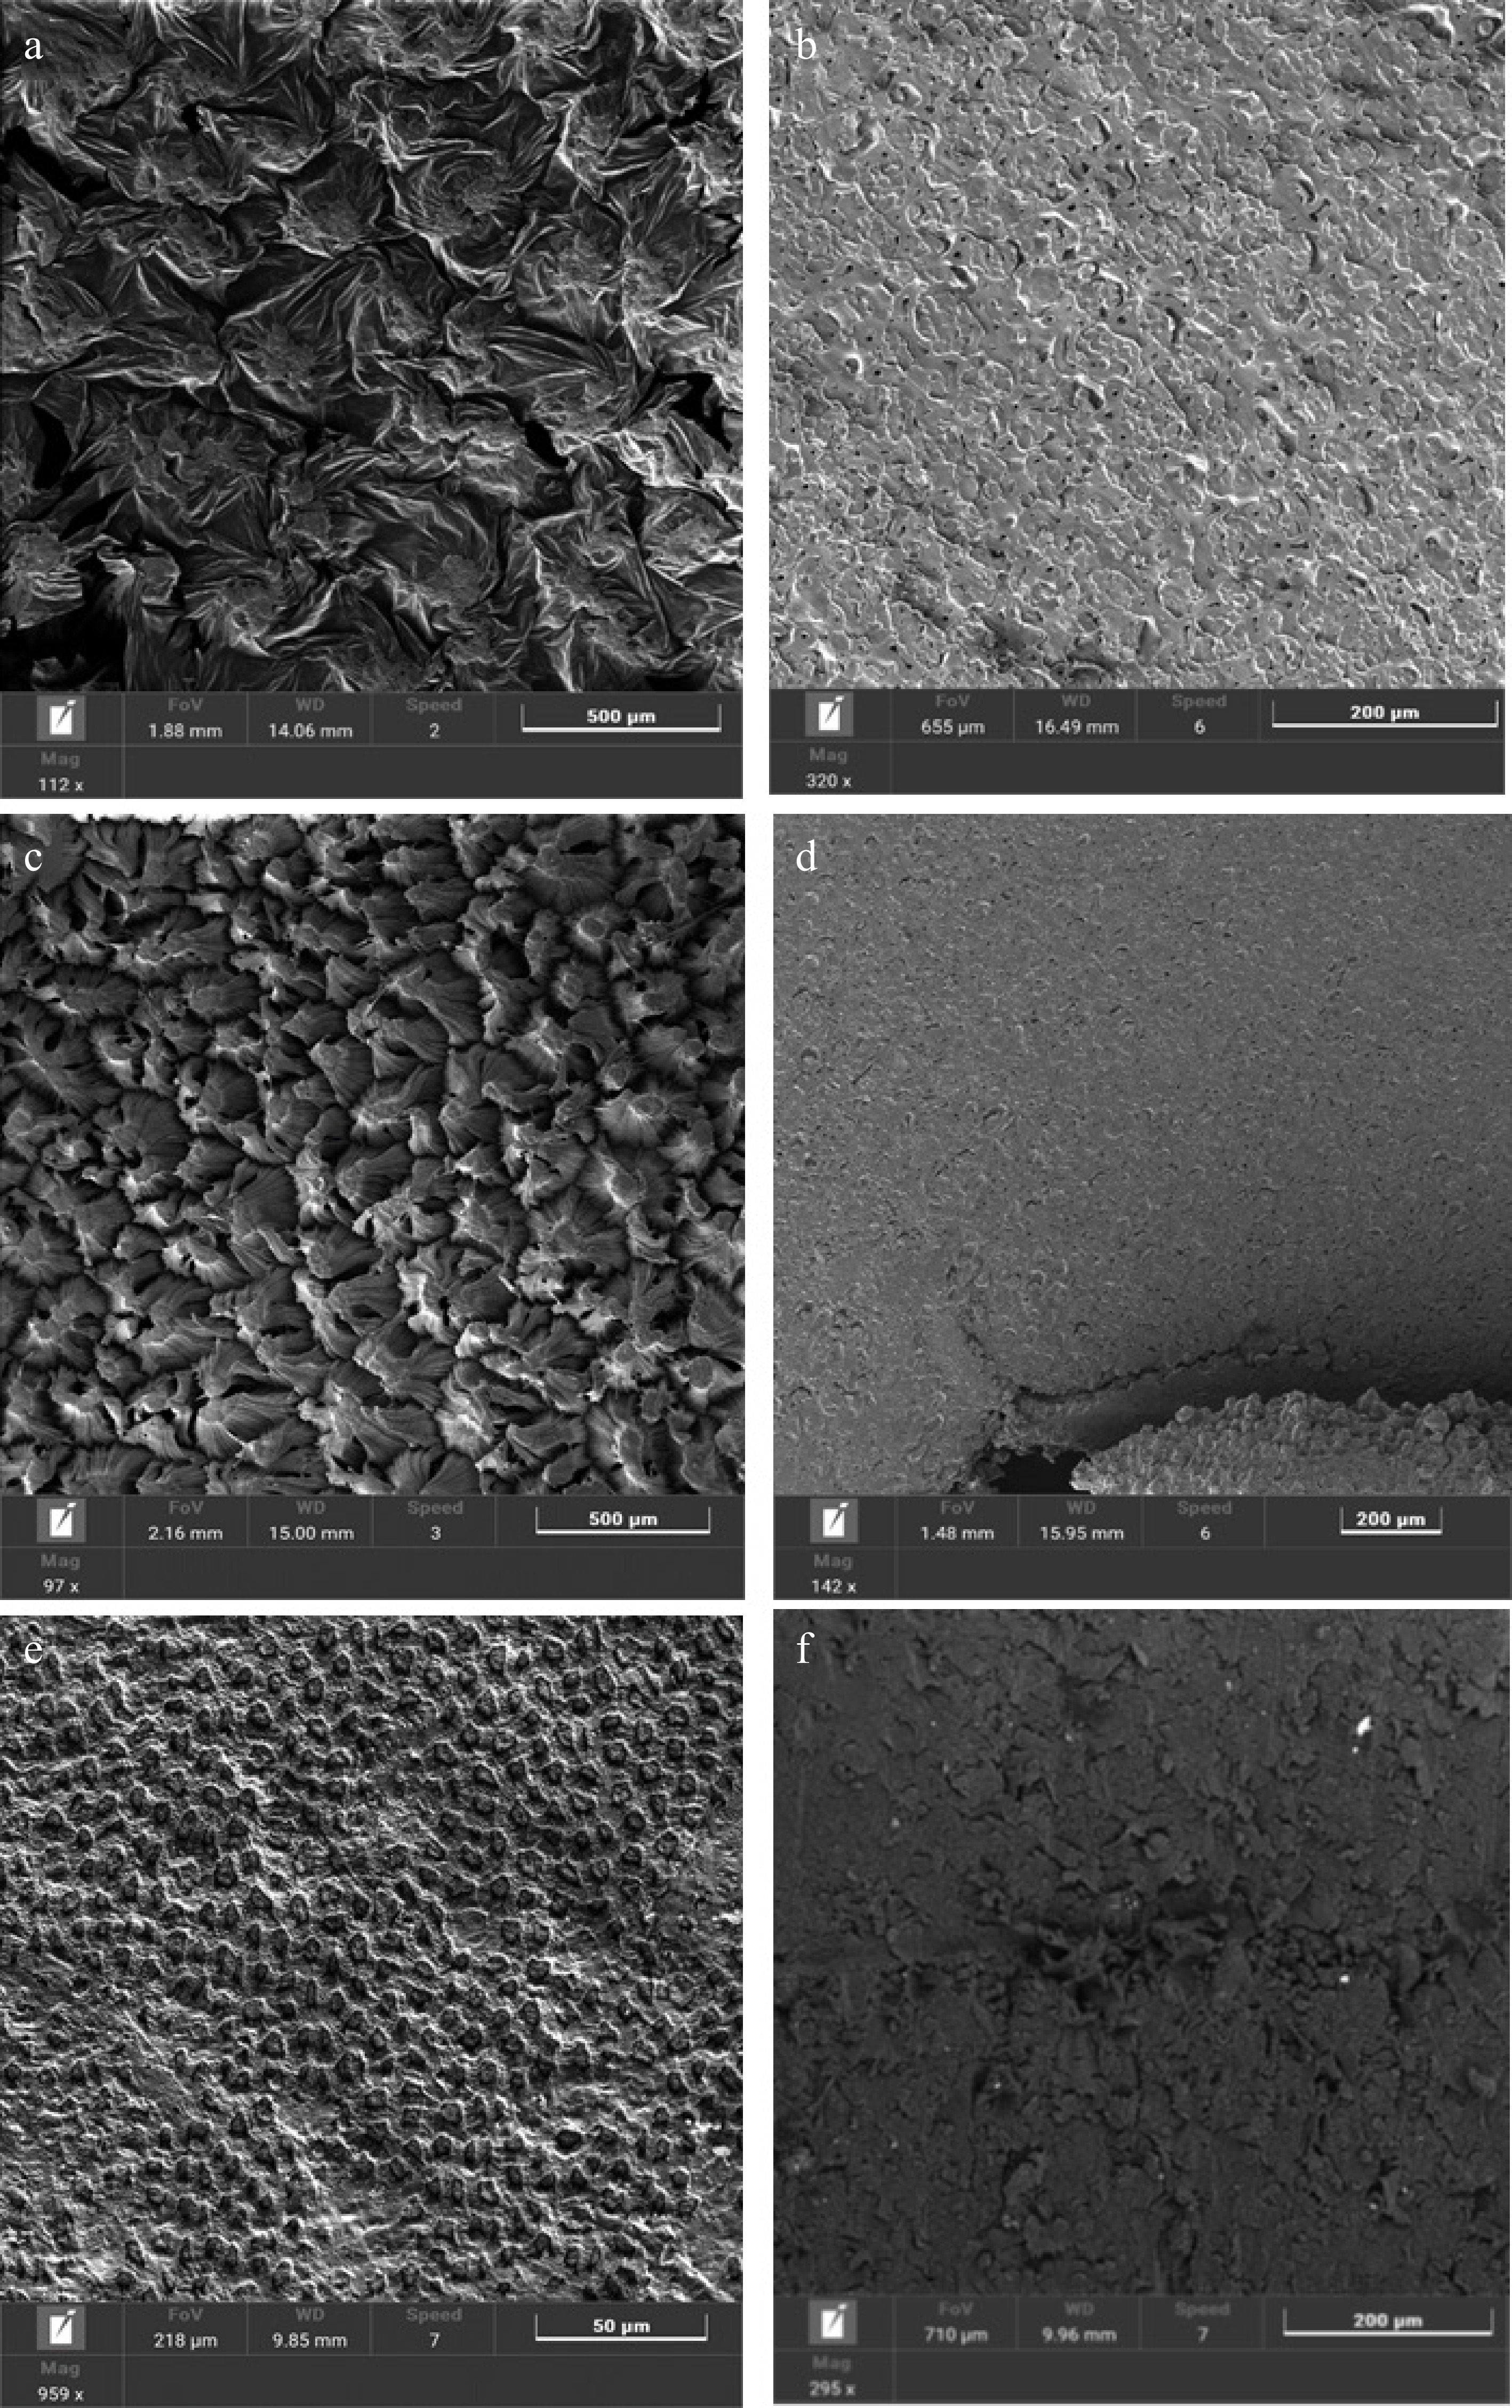
Figure 4.
Seed surface (panels on the left) and cotyledons (panels on the right) of the three Lupinus species studied. Representative scanning electron micrographs of rough-seeded lupins (a), (b) L. pilosus (PIL-5); (c), (d) L. palaestinus (PA-10), smooth-seeded sweet lupin; and (e),(f) L. albus (ALB-sh).
-
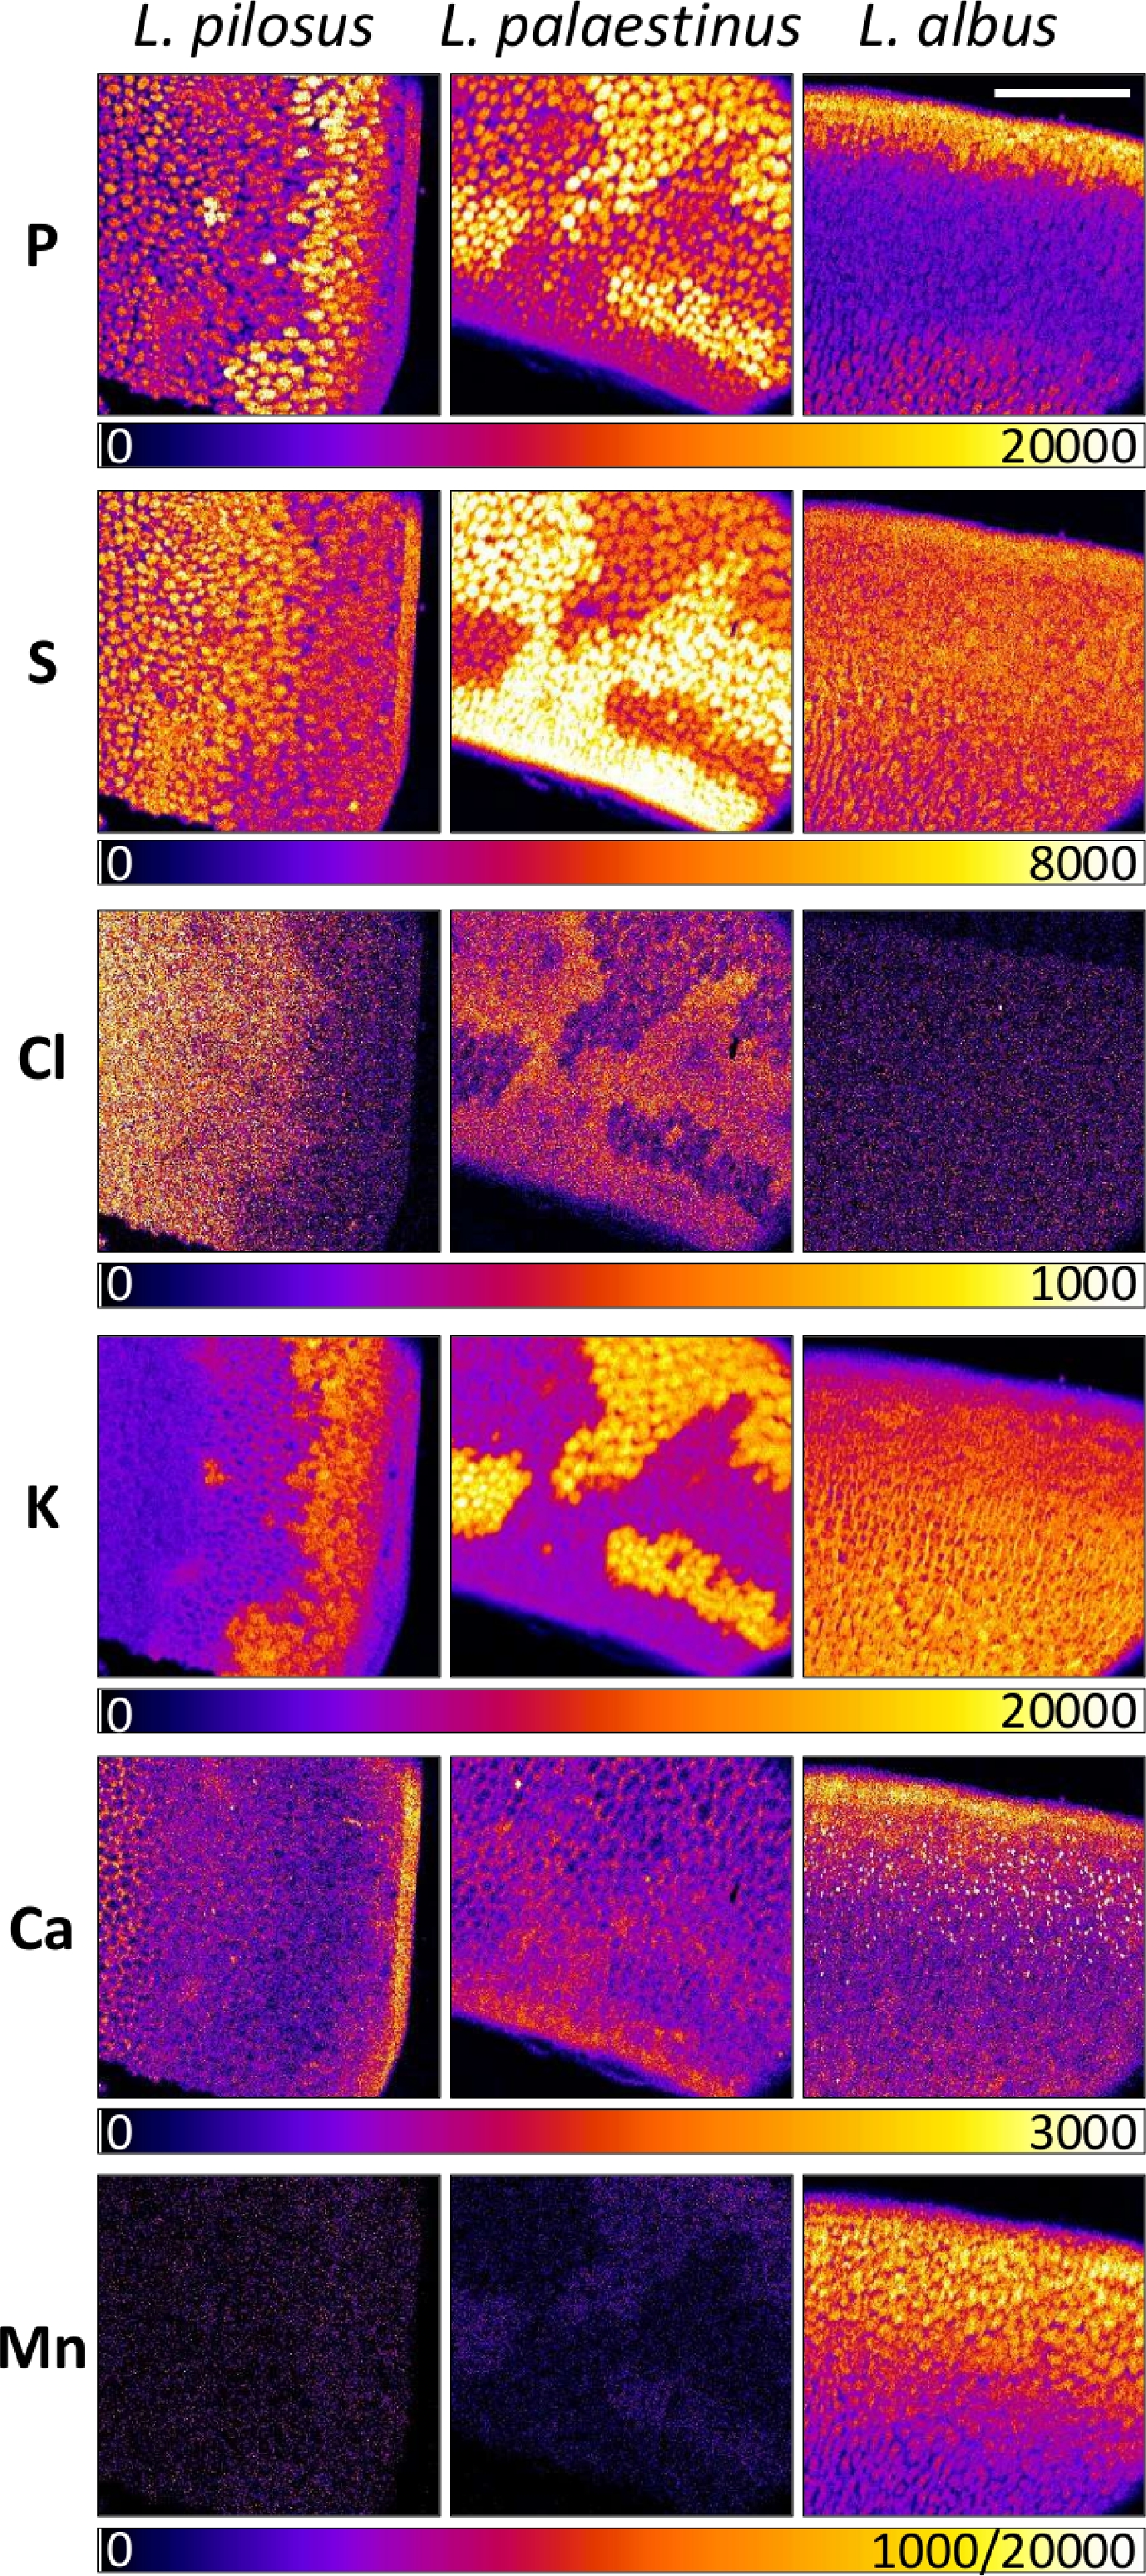
Figure 5.
Representative quantitative distribution maps of phosphorus (P), sulfur (S), chlorine (Cl), potassium (K), calcium (Ca), and manganese (Mn) in longitudinally cut seeds of three different Lupinus species. Scale bar represents 500 µm and the scale is the same for all maps. Color legends represent minimum and maximum displayed concentrations in mg·kg−1 dry weight. There are two maxima values for Mn: the lower for L. pilosus and L. palaestinus, and the higher for L. albus.
-
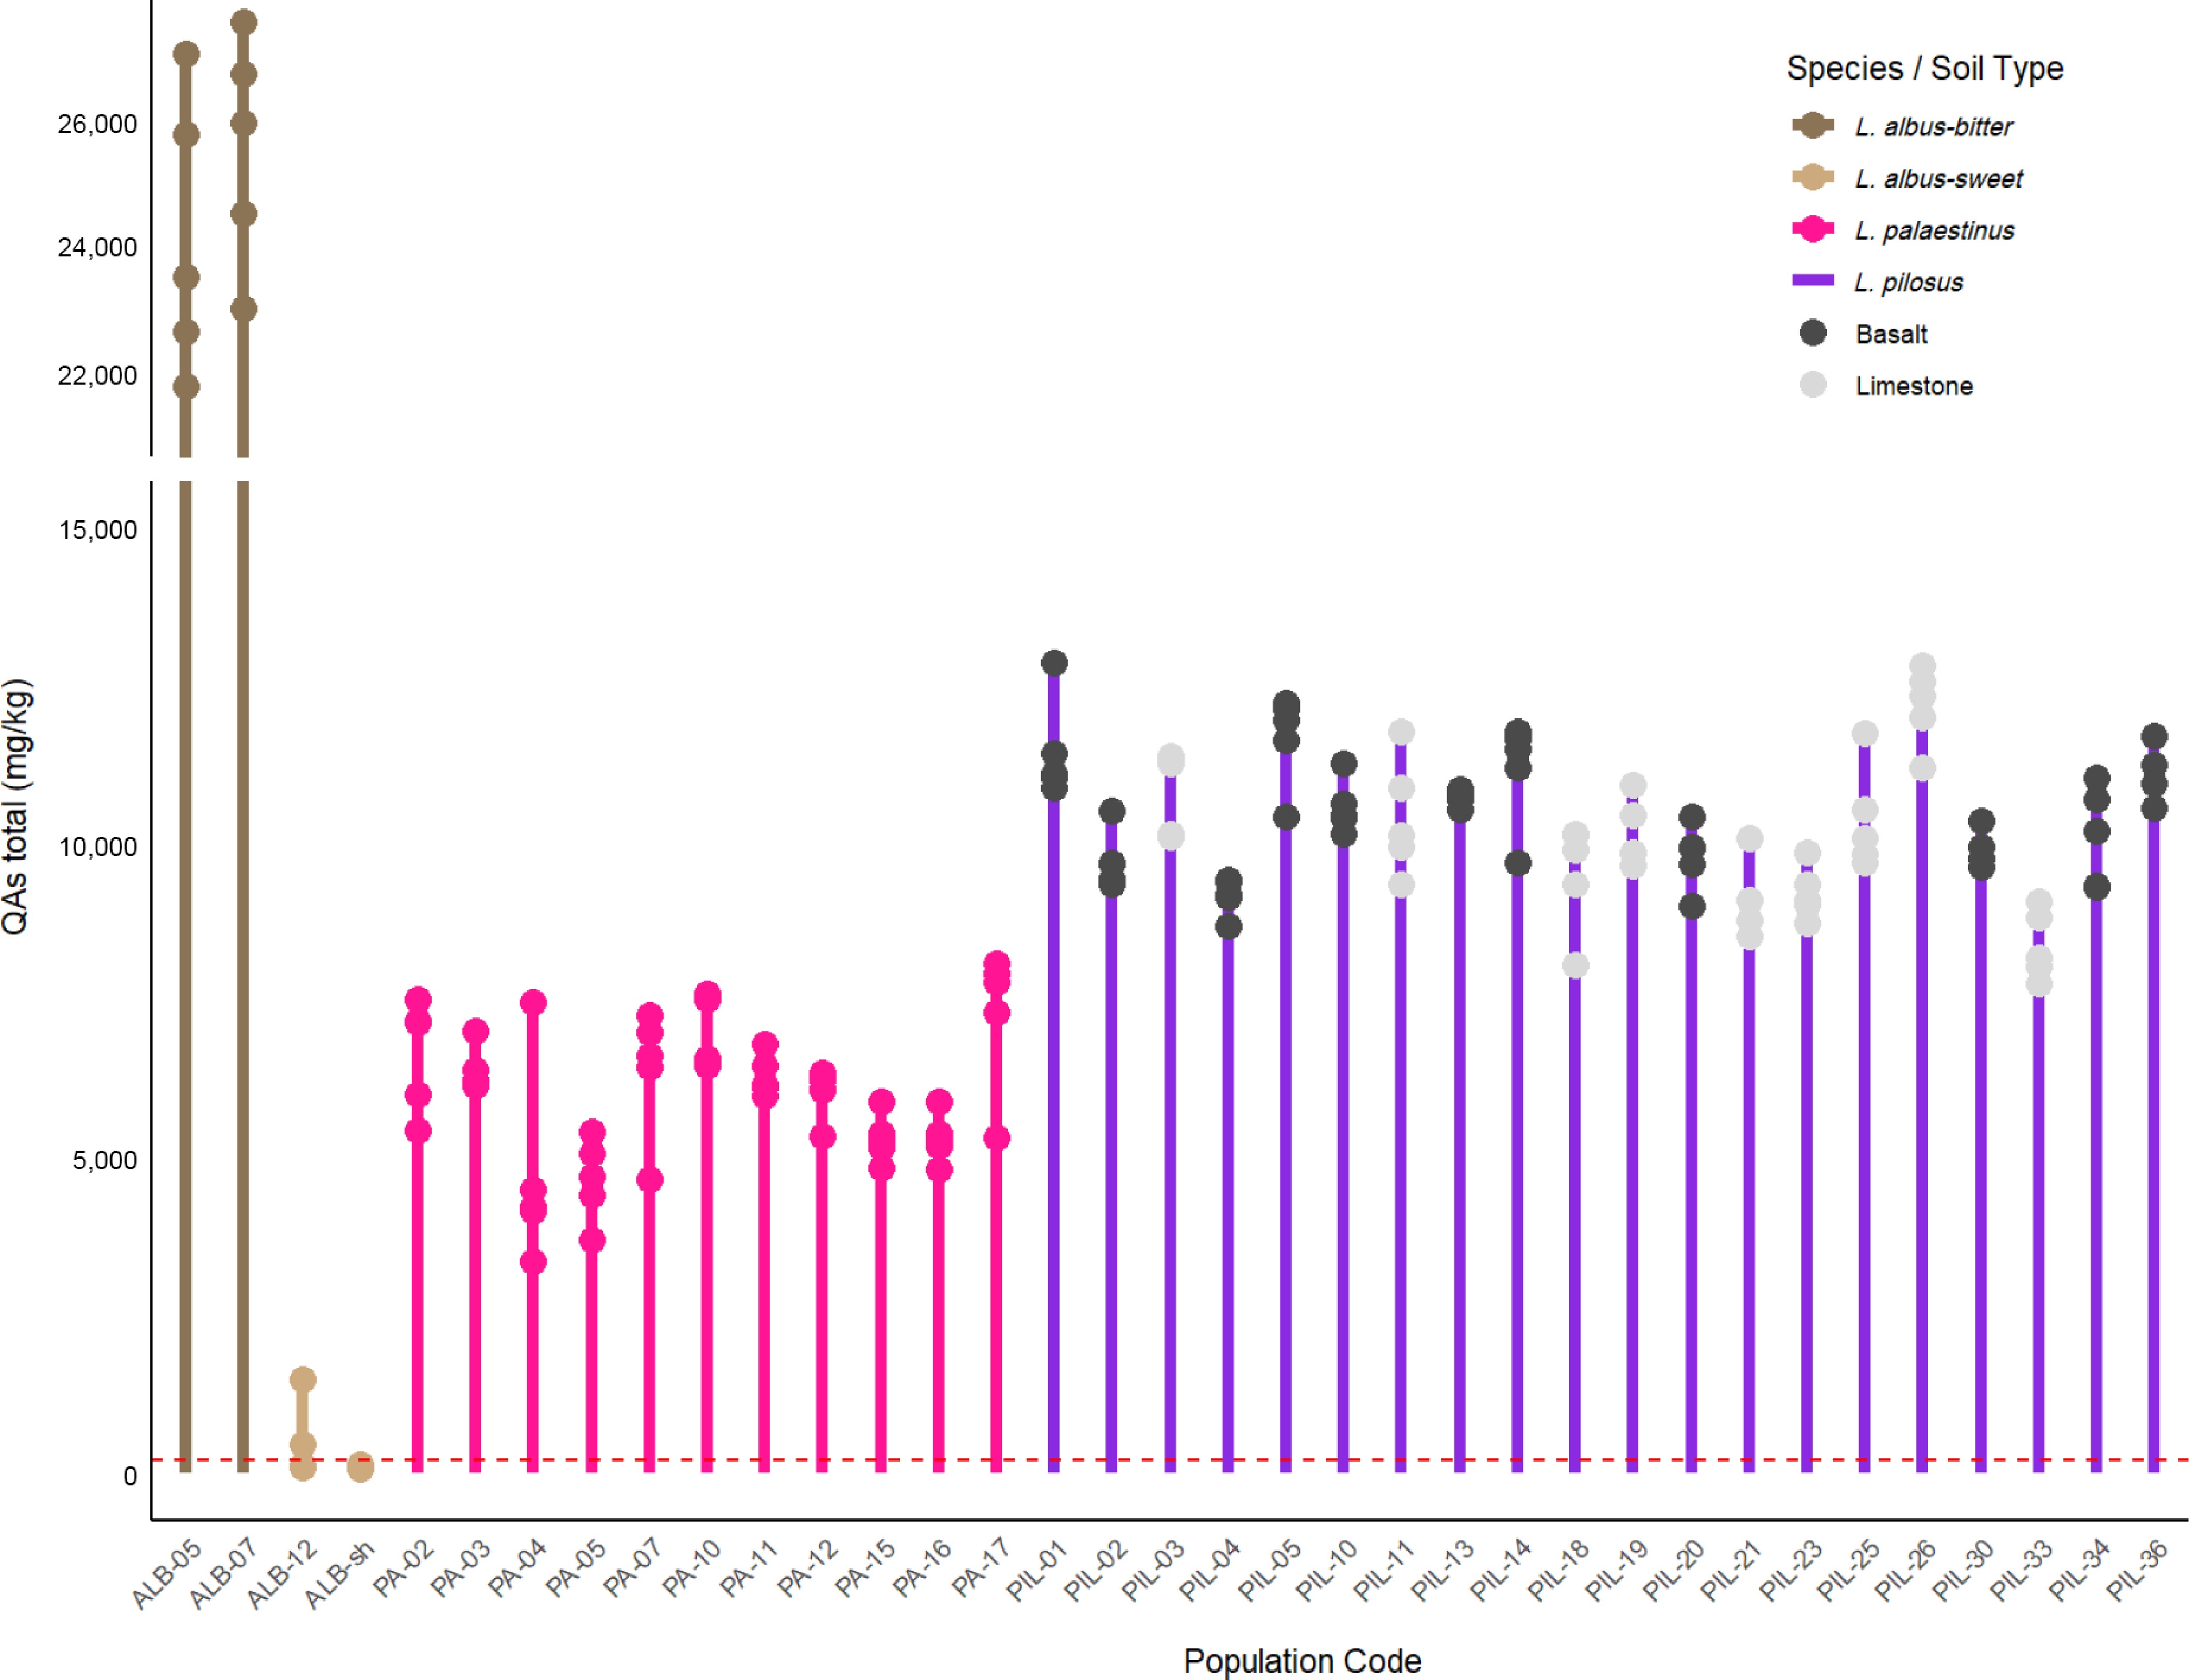
Figure 6.
Total quinolizidine alkaloid (QA) levels were detected in L. palaestinus and L. pilosus, and in one cultivar of the non-local edible L. albus. The dashed red line marks the level of QAs in food considered safe for human consumption[21]. Total QAs of three wild L. albus populations were added for comparison (for details regarding these species, see Namdar et al.[18]). For the Population Code, please see Table 1.
-
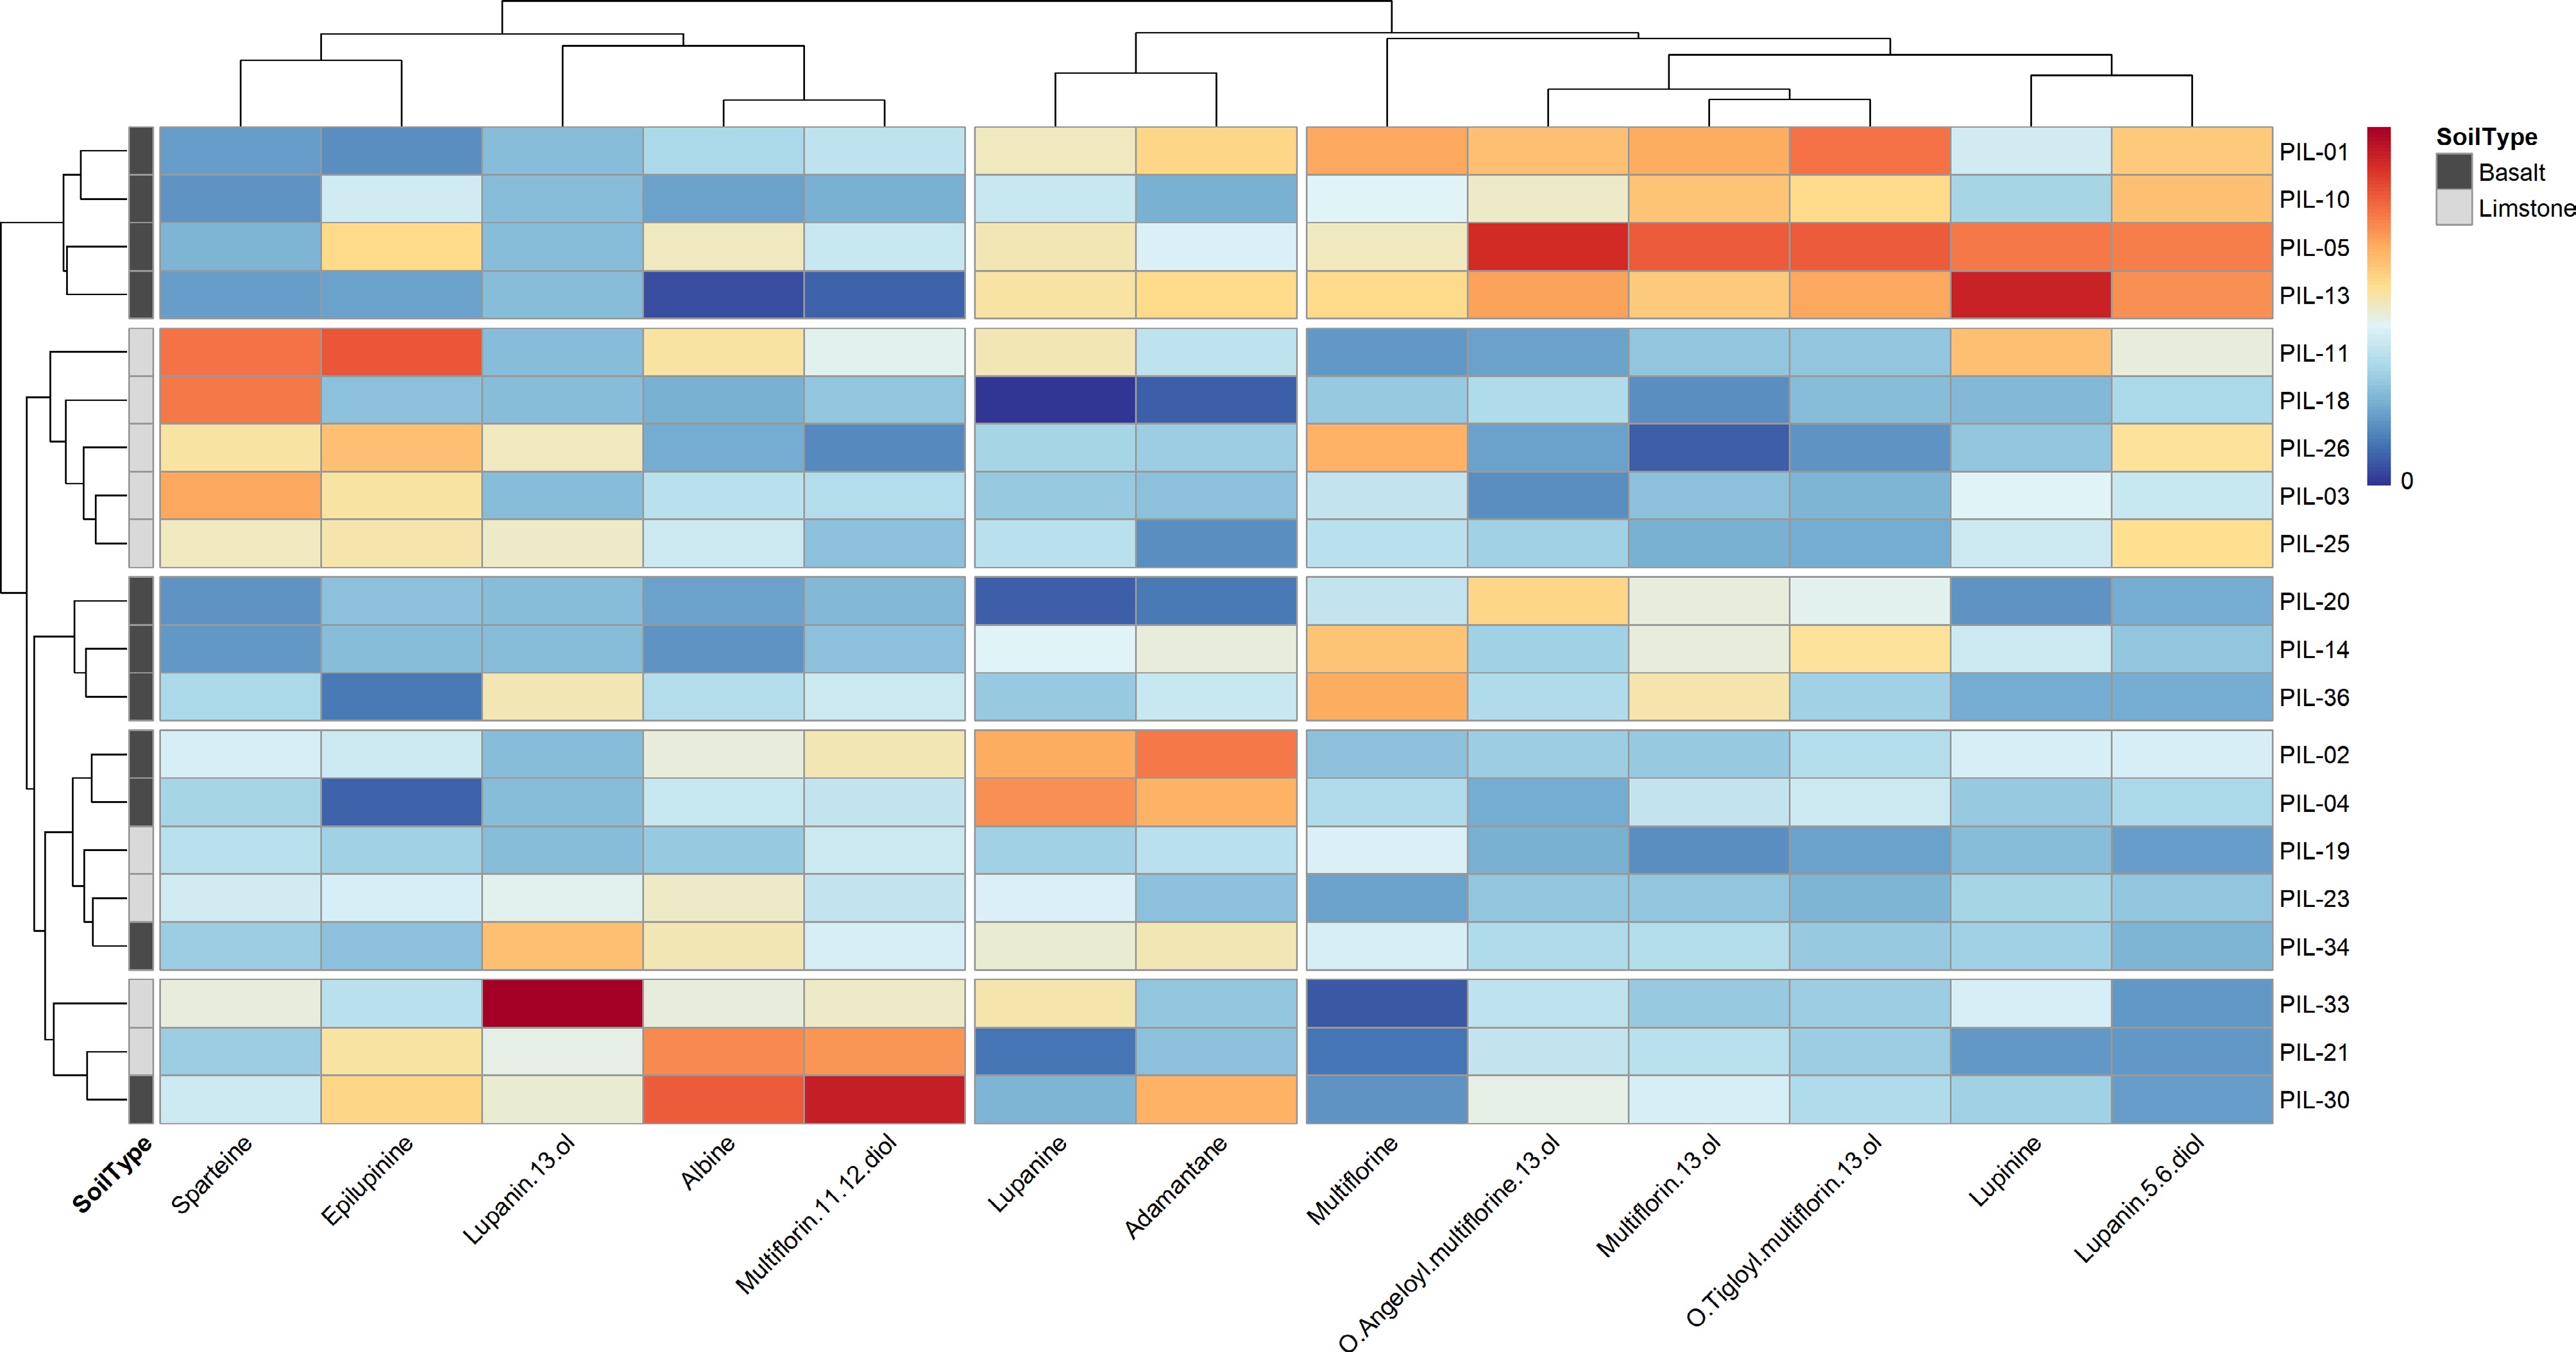
Figure 7.
QA distribution (on a 0–10 scale) in L. pilosus based on their geological distribution. For the original raw data, see Namdar et al.[18].
-
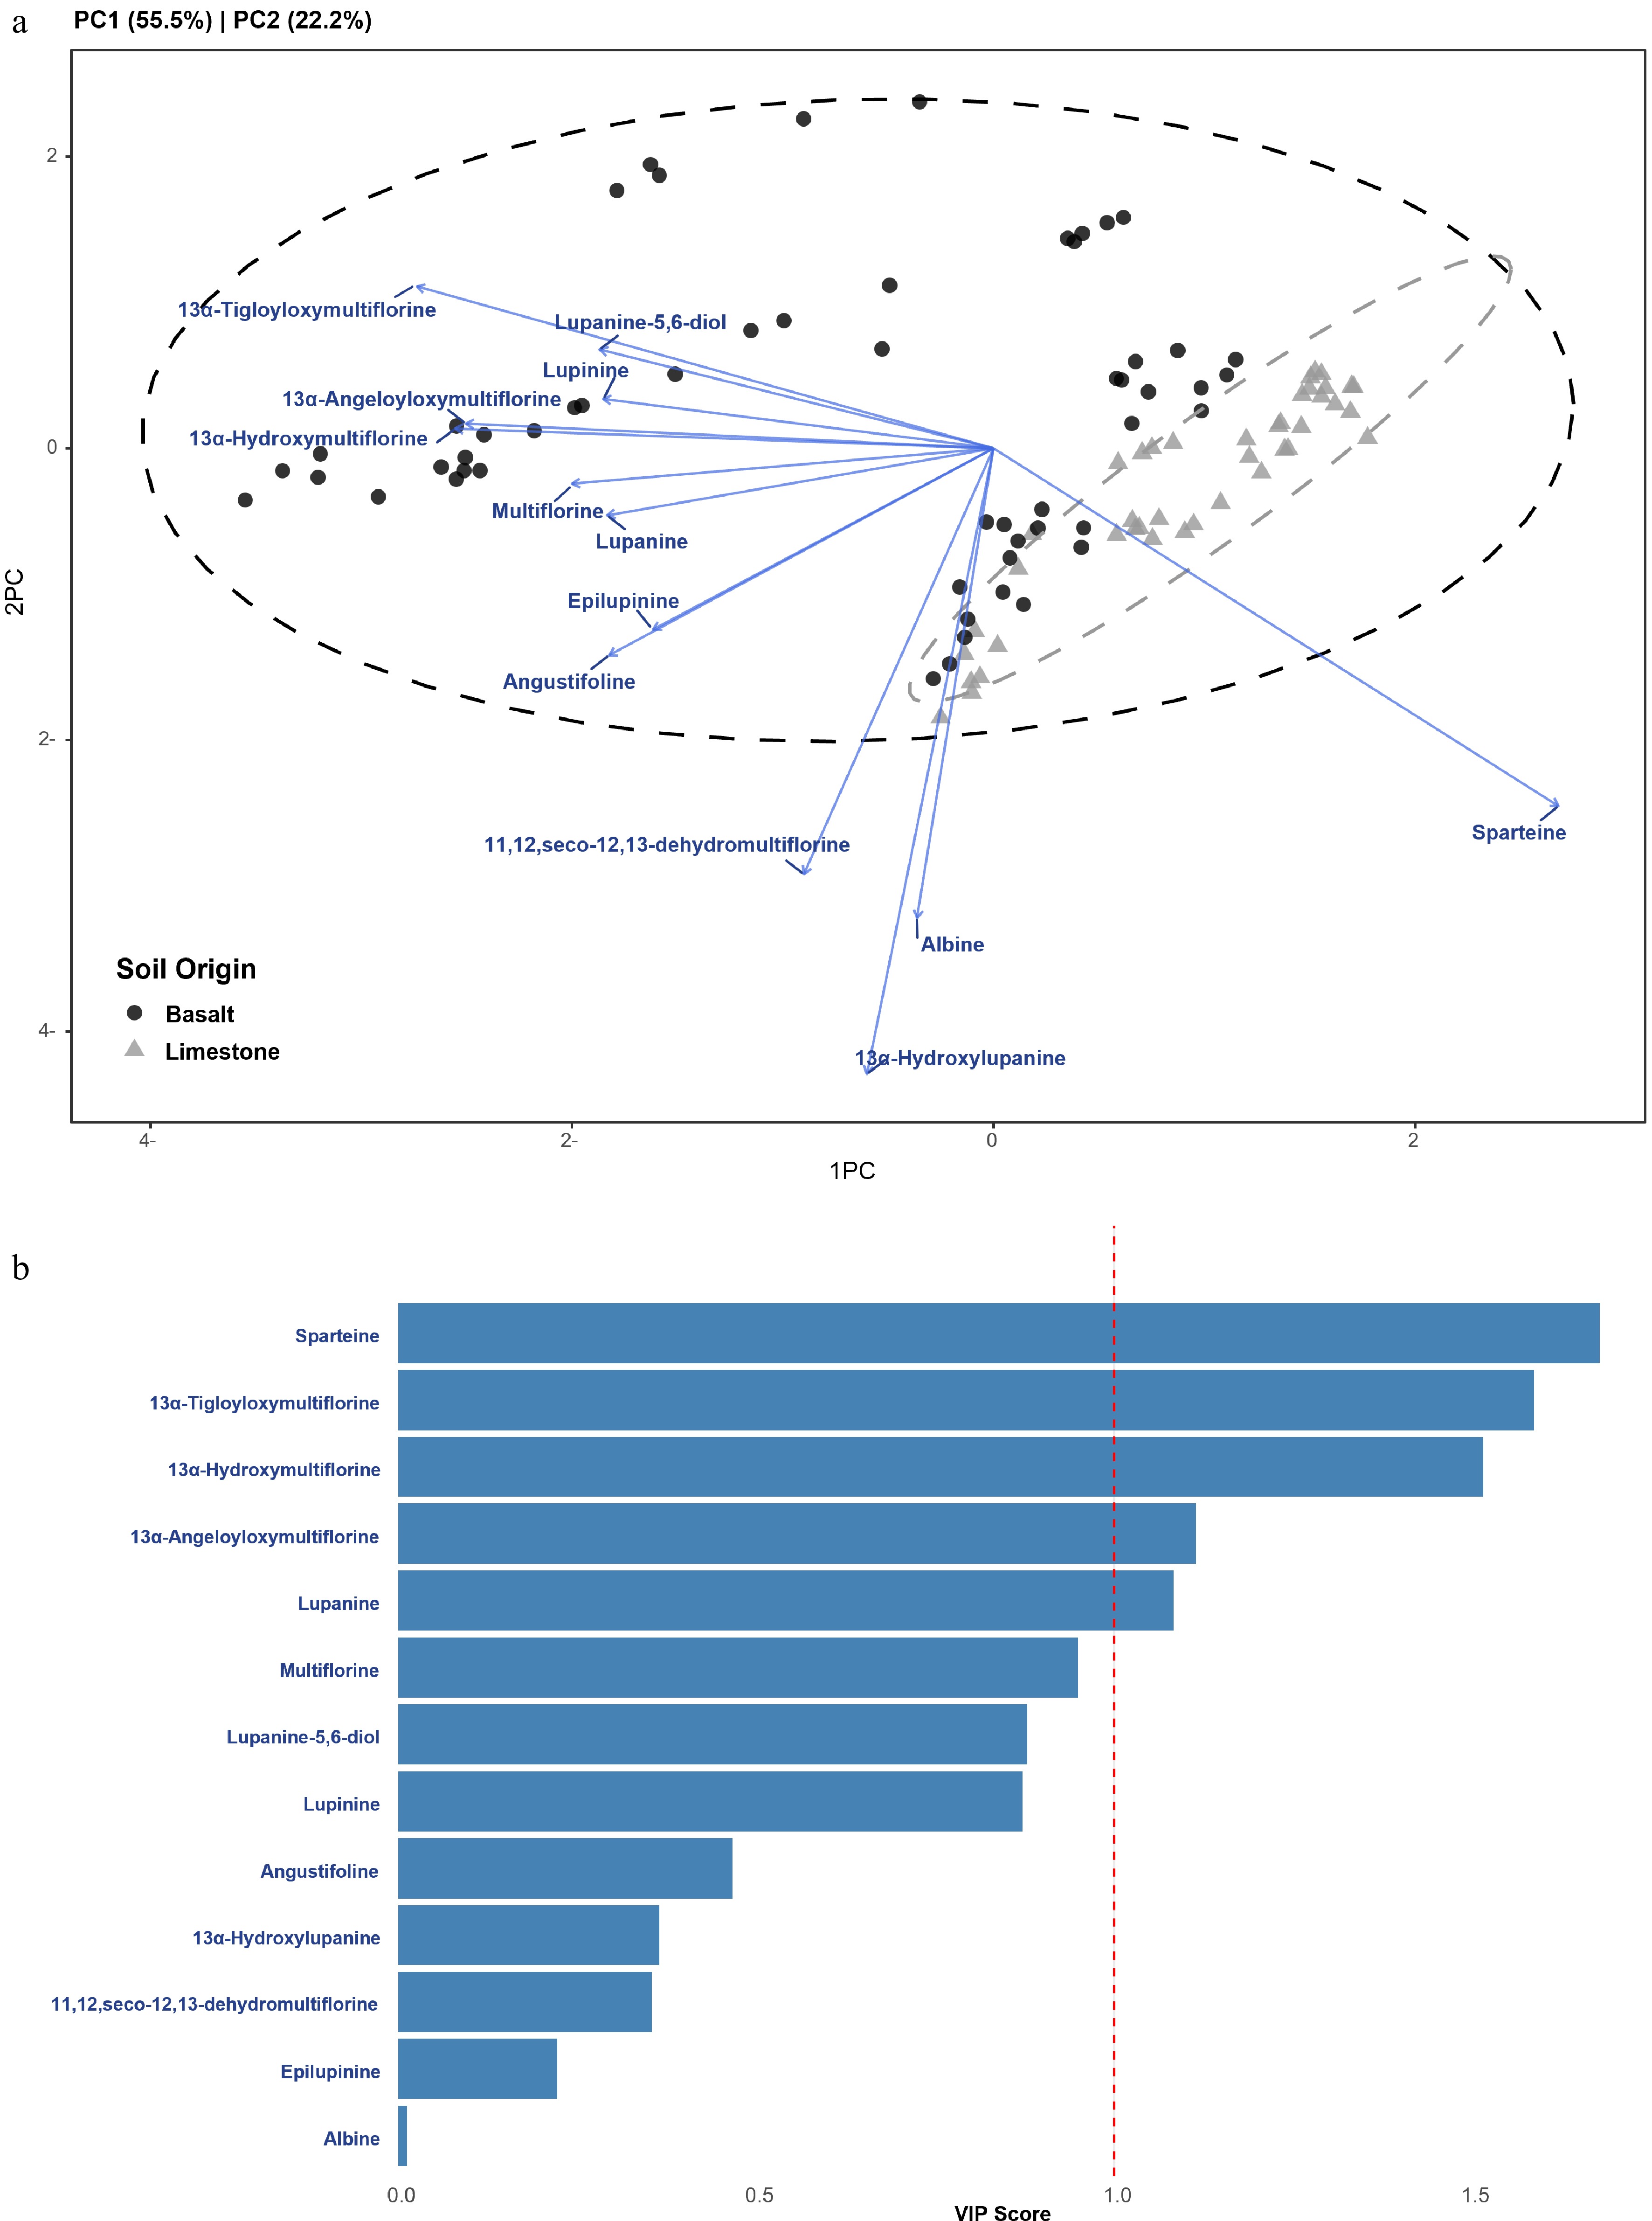
Figure 8.
Multivariate statistical analysis of quinolizidine alkaloid (QA) profiles in Lupinus pilosus seeds originating from basaltic and calcareous soils. (a) PCA Biplot: Principal Component Analysis (PCA) displaying the metabolic grouping of populations by soil origin. The first two components account for 77.71% of the total variance (PC1: 55.54%, PC2: 22.17%). Points represent individual samples (Basalt = black circles, Limestone = grey triangles), with 95% confidence ellipses. Blue vectors indicate the loading contributions of specific alkaloids to the principal components. (b) VIP Scores: top 10 predictive alkaloids ranked by variable importance in projection scores from the OPLS-DA model (Q2 = 0.733, R2Y = 0.755). Variables with VIP > 1.0 (indicated by the red dashed line) are considered significant discriminants for soil-type classification.
-
Region Population code Collection site Soil bedrock X coordinate Y coordinate Mean temperature 2006–2020 (°C) Altitude (m) Golan Heights PIL-1 Mapalim Junction B 35.75115 32.98624 18 510 Hula Valley PIL-2 Naḥal Ḥamdal B 35.67416 33.09425 19 470 Judean Hills PIL-3 Tel Socoh South L 34.97057 31.68486 20 320 Golan Heights PIL-4 Ofir Viewpoint B 35.66266 32.8149 22 210 Golan Heights PIL-5 South-west Ḥispin B 35.79299 32.84563 18 420 Golan Heights PIL-10 Ḥazeka Road B 34.93600 31.69999 20 330 Judean Hills PIL-11 Matta L 35.06057 31.71652 19 600 Golan Heights PIL-13 Fares Road (Vineyard) B 32.950322 35.86401 17 730 Golan Heights PIL-14 Tel Fazra B 35.69216 33.22469 19 410 Judean Hills PIL-18 Khirbet Kanim L 34.96411 31.66636 19 390 Judean Hills PIL-19 Tel esh-Sharia L 34.68087 31.39089 20 180 Golan Heights PIL-20 Avital B 35.78519 33.10365 15 1,000 Carmel Mountains PIL-21 Makura B 35.42362 32.16415 21 230 Samaria Mountains PIL-23 Awartha L 35.28638 32.16152 18 520 Samaria Mountains PIL-25 Shecḥem Mountains L 35.01352 32.3207 17 800 Samaria Mountains PIL-26 Kedumim L 35.15738 32.21239 20 400 Carmel Mountains PIL-30 Kerem Maharal South B 34.99145 32.64432 20 65 Judean Hills PIL-33 Sarisa L 35.06529 31.79748 19 650 Lower Galilee PIL-34 Ahuzat Barak B 35.33889 32.6431 21 160 Lower Galilee PIL-36 Nau'ra B 35.38378 32.60564 21 110 Sharon Coastal Plain PA-2 Pardes Ḥana L 34.974200 32.4728 20 30 Sharon Coastal Plain PA-3 Ilanot West L 34.907942 32.29253 20 50 Sharon Coastal Plain PA-5 Bnei-Tzion North L 34.86837 32.21983 20 40 Sharon Coastal Plain PA-7 Ilanot East L 34.89259 32.29232 20 40 Sharon Coastal Plain PA-10 Netanya L 34.85319 32.32145 21 30 Sharon Coastal Plain PA-11 Ḥirbet Samara L 34.87782 32.39219 20 20 Sharon Coastal Plain PA-12 Hod Ha-Sharon L 34.88387 32.14996 20 30 Sharon Coastal Plain PA-15 Tel Mond-Kurkar L 34.91846 32.2566 20 50 Coastal Plain South PA-16 Ashqelon L 34.57425 31.66878 21 30 Coastal Plain East PA-17 Sitriya L 34.84209 31.88985 21 80 Commercial product ALB-sh
(L. albus-sweet)NA NA NA NA NA NA Soil bedrock: B, basalt; L, limestone; NA, not applicable. Table 1.
Ecological description of sampling sites from which wild Lupinus pilosus (PIL) and L. palaestinus (PA) populations were collected in Israel between 2017 and 2020.
-
Element L. pilosus L. palaestinus L. albus Cotyledon
Wt% (st dev)Seed testa
Wt% (st dev)Cotyledon
Wt% (st dev)Seed testa
Wt% (st dev)Cotyledon
Wt% (st dev)Seed testa
Wt% (st dev)C 63.13 (2.71)ab 49.92 (3.05) 61.05 (1.54)b 47.97 (3.58) 68.08 (13.53)a 63.65 (5.01) O 28.29 (2.48) 45.02 (1.69)a 25.31 (1.58) 50.75 (4.42)a 29.73 (12.49) 18.31 (4.63)b K 0.34 (0.09) 1.05 (0.31) 2.55 (3.23) 0.75 (0.35) 0.80 (0.56) 0.34 (0.61) Ca 2.24 (1.18) 1.34 (1.09) 0.44 (0.02) Al 0.50 (0.12) 0.72 (0.34) 0.69 (0.55) N 7.33 (1.07) 9.64 (2.14) 1.72 (1.27) S 0.17 (0.11) 0.96 (0.32) Mn 15.64 (0.26)a Significant value < 0.05; significance (marked by lowercase letters a, b) was detected for C in the cotyledon, and for Mn and O in the testa. The averages (n = 3 biological samples and n = 4 scan sites on each sample) are shown with standard deviations. Empty cells = element not detected. Table 2.
Elemental analysis (SEM-EDX) of L. pilosus, L. palaestinus, and L. albus cotyledons and seed testa.
-
Wt%stat L. pilosus (n = 6) L. palaestinus (n = 6) L. albus (n = 7) P 42.37 b 44.39a 23.70b S 13.4 b 12.55 a 12.78b Cl 2.18a 1.04 a 0.12b K 35.59 35.24 35.81 Ca 5.44b 5.53 a 4.36b Mn 0.77b 1.08 b 22.89a Fe 0.22 b 0.17 b 0.34a Zn 0.25 0.17 0.27 Different letters next indicate significant differences between the species for each element separately (ANOVA on Ranks, followed by Dunn's post hoc test at p < 0.05). Table 3.
Relative concentration (out of the total amount measured, averaged, in mg·kg−1 dry weight) of phosphorus (P), sulphur (S), chlorine (Cl), potassium (K), calcium (Ca), manganese (Mn), iron (Fe), and zinc (Zn) in the entire section of cotyledons of Lupinus pilosus, L. palaestinus, and L. albus analyzed with micro-PIXE.
Figures
(8)
Tables
(3)