-
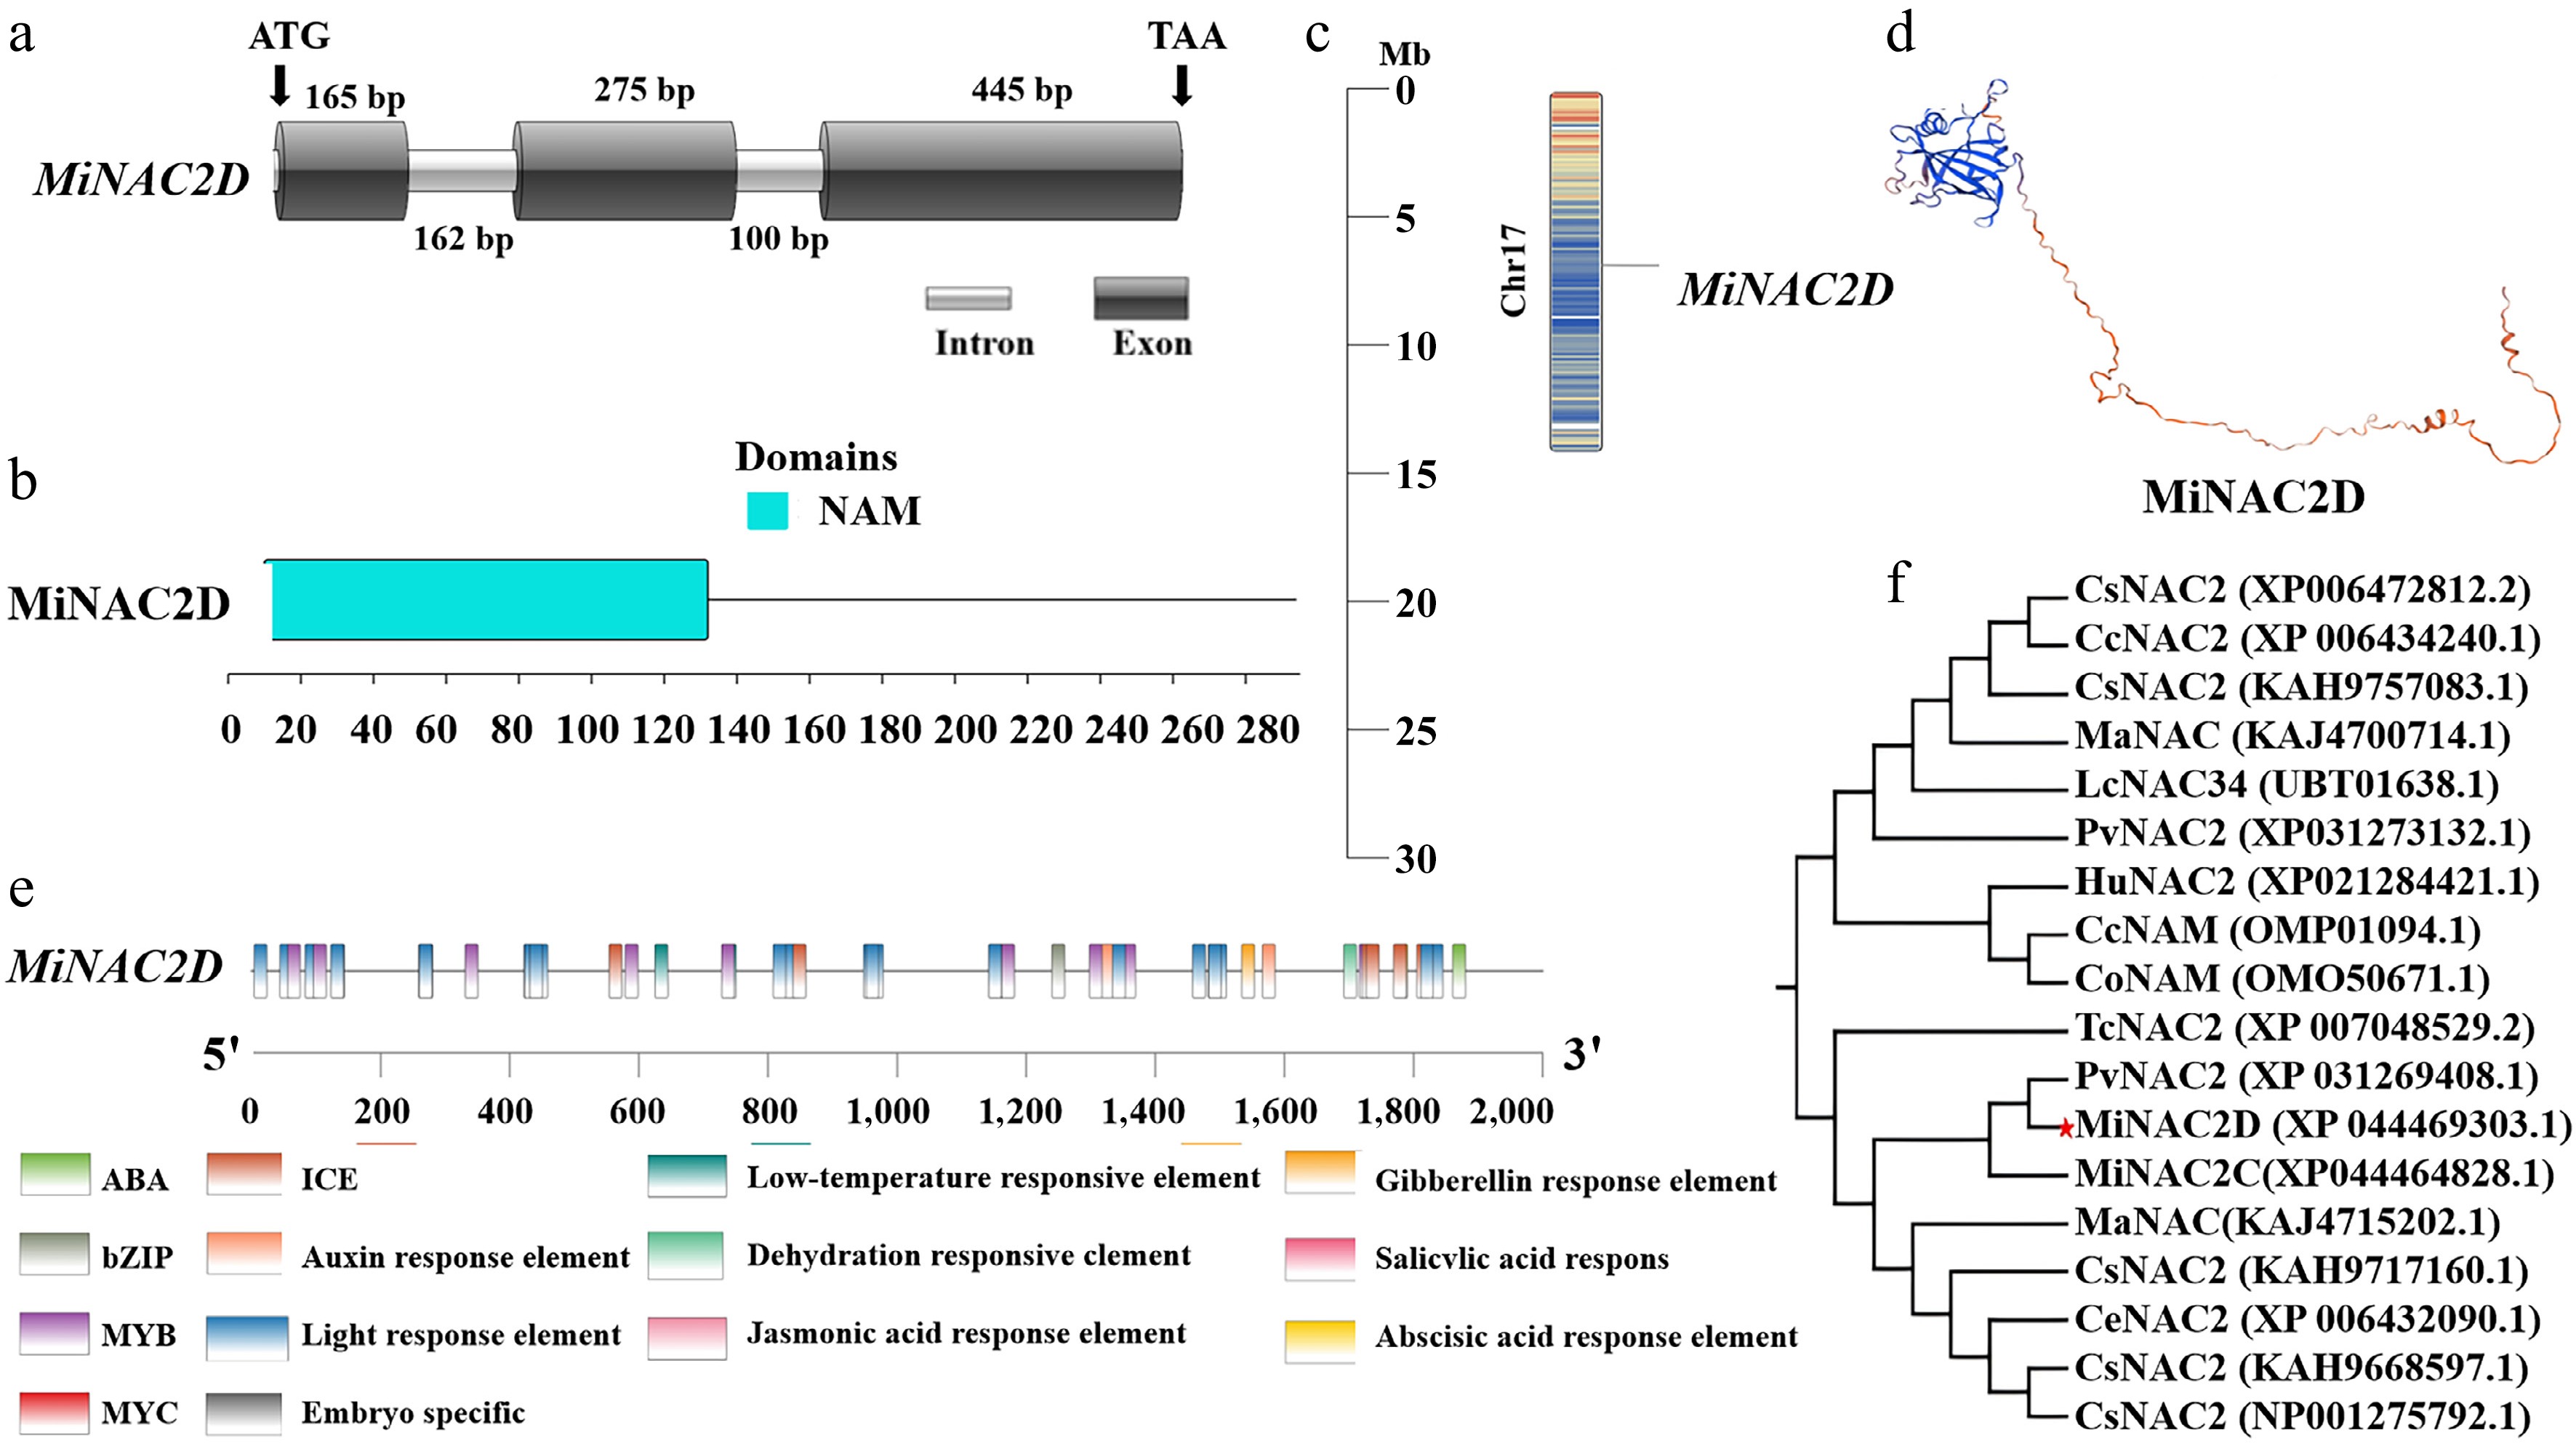
Figure 1.
Identification of MiNAC2D gene. (a) Gene structure of MiNAC2D. (b) Conserved structural domains of MiNAC2D. (c) Chromosomal localization of MiNAC2D. (d) Structure of MiNAC2D protein. (e) Cis-element analysis of MiNAC2D. (f) Phylogenetic tree of NAC proteins. Pv, Pistacia vera; Cs, Cucumis sativus; Cc, Cymbopogon citratus; Ma, Melia azedarach; Lc, Litchi chinensis; Cu, Citrus unshiu; Tc, Theobroma cacao; Hu, Hylocereus undatus; Tc, Theobroma cacao.
-
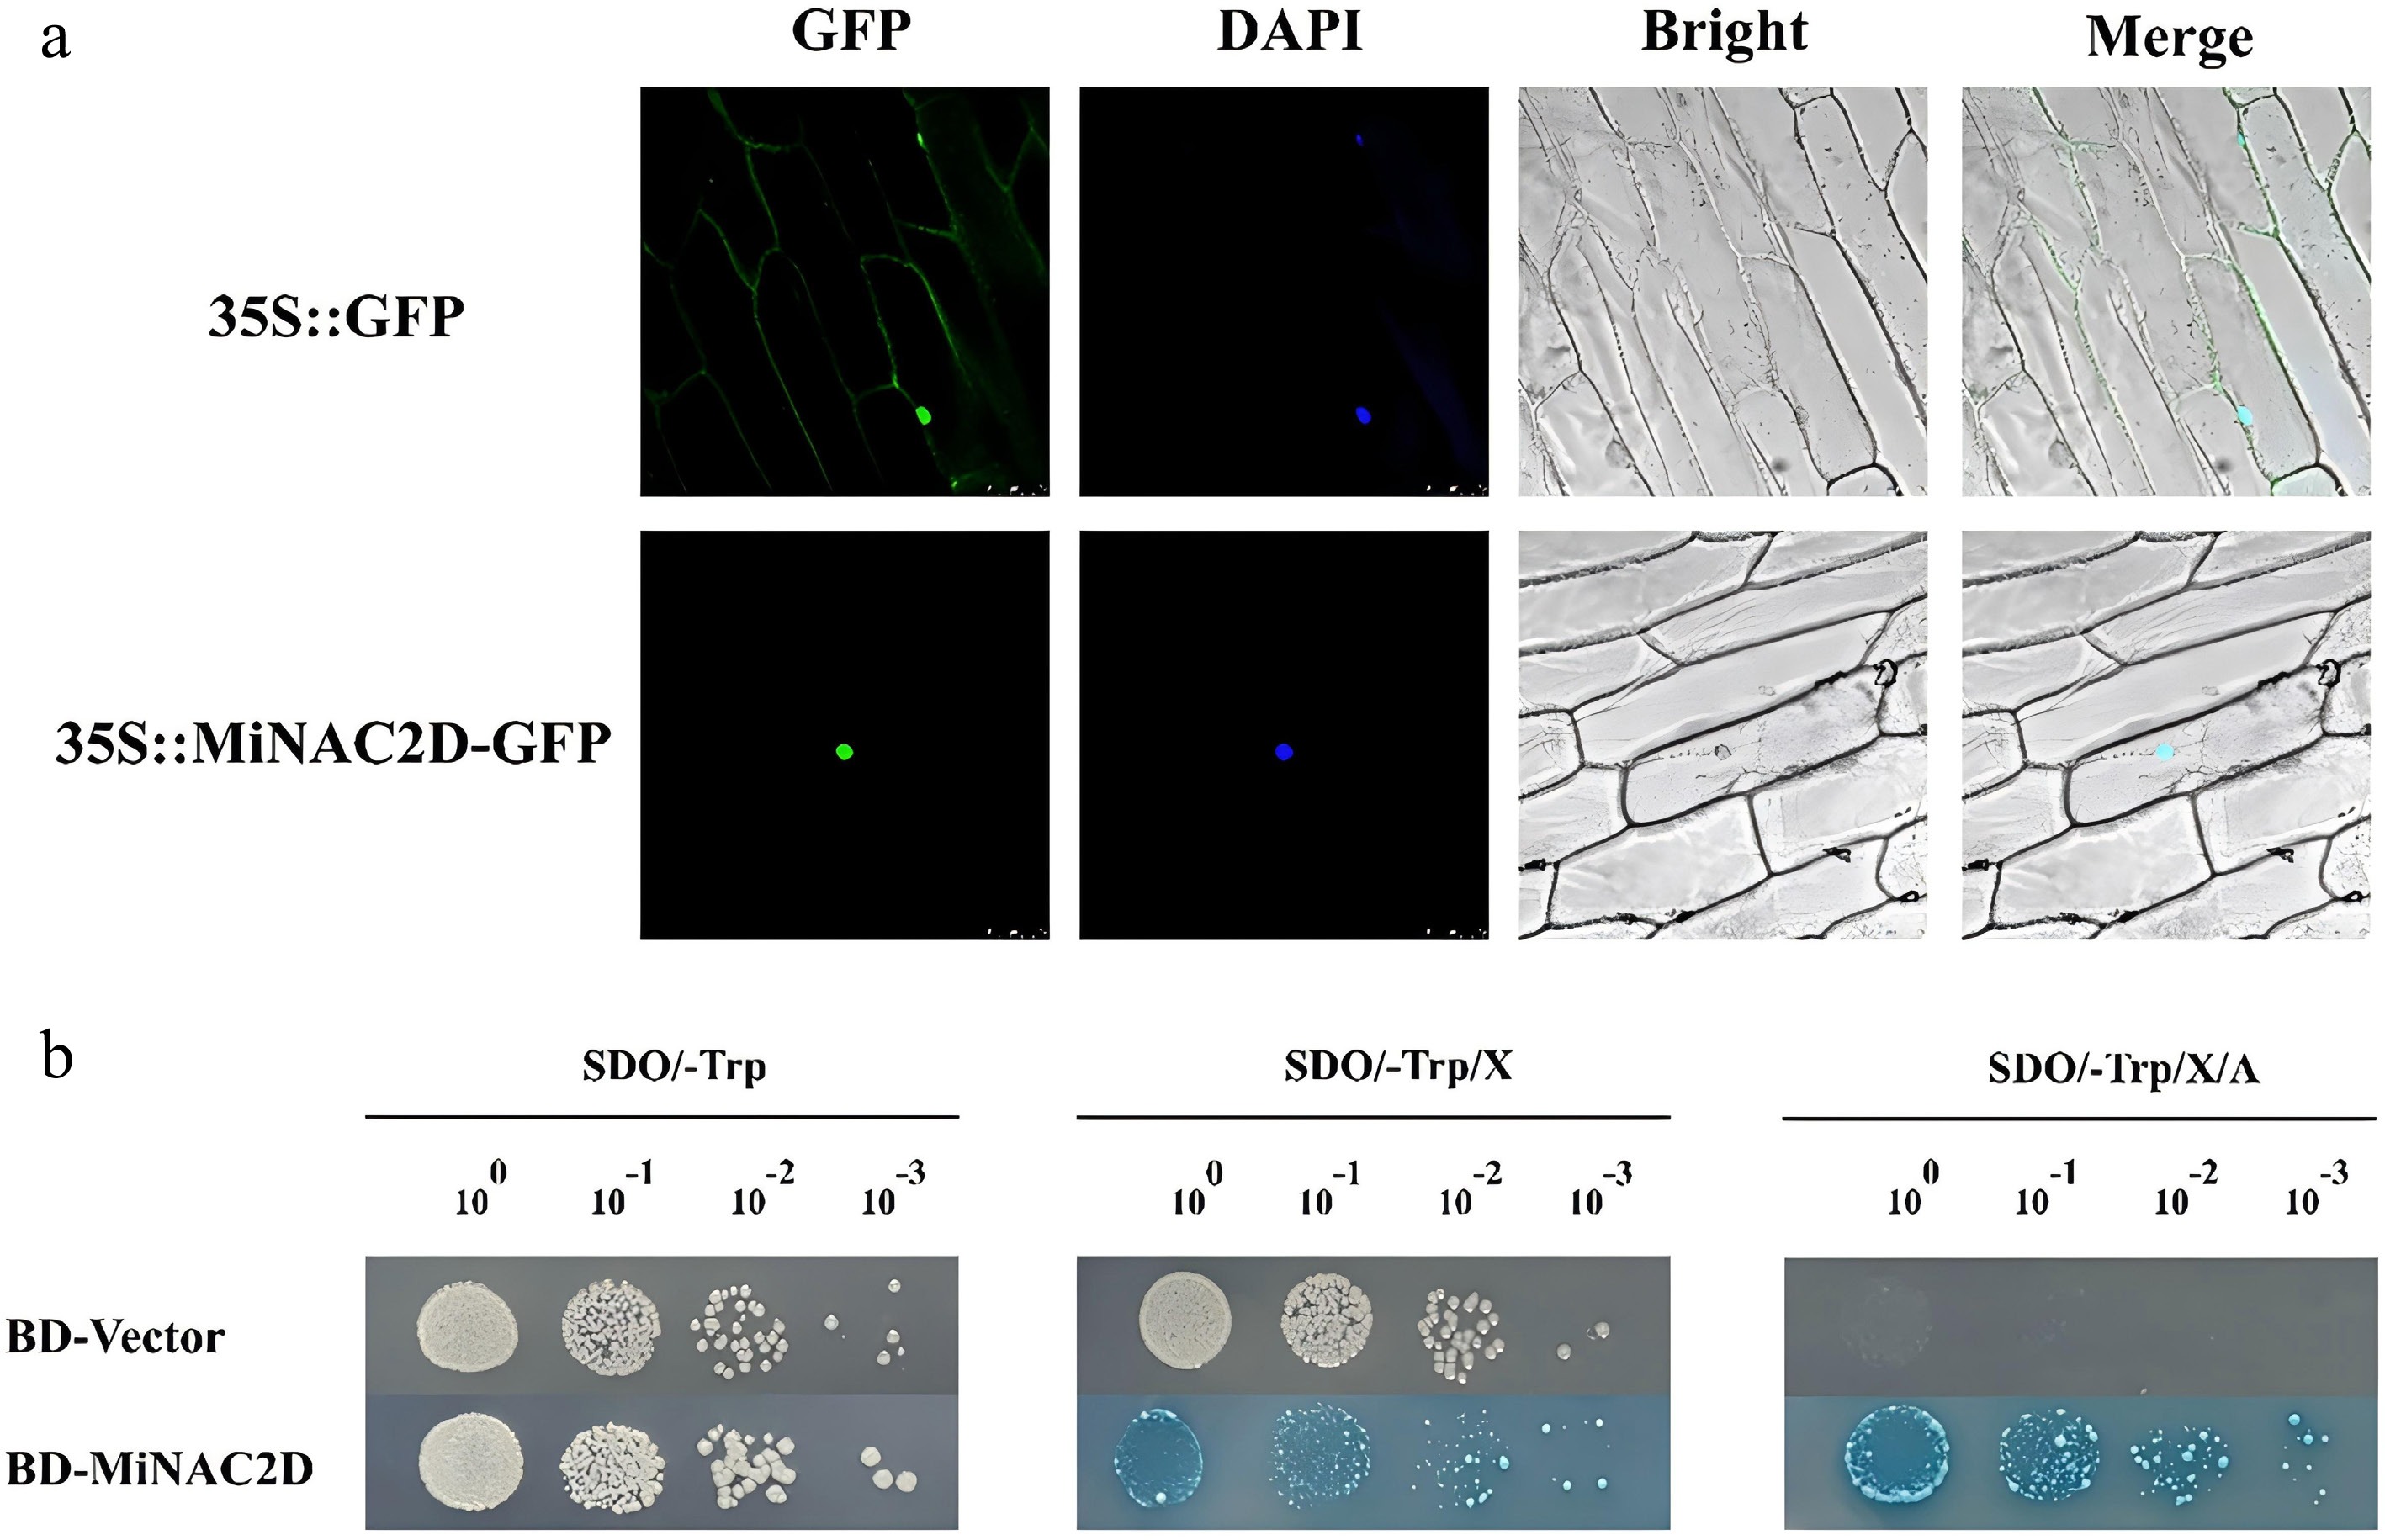
Figure 2.
Subcellular localization and transcriptional activation activity analysis. (a) Subcellular localization of MiNAC2D. Bars = 100 μm. (b) Transcriptional activation activity analysis of MiNAC2D.
-
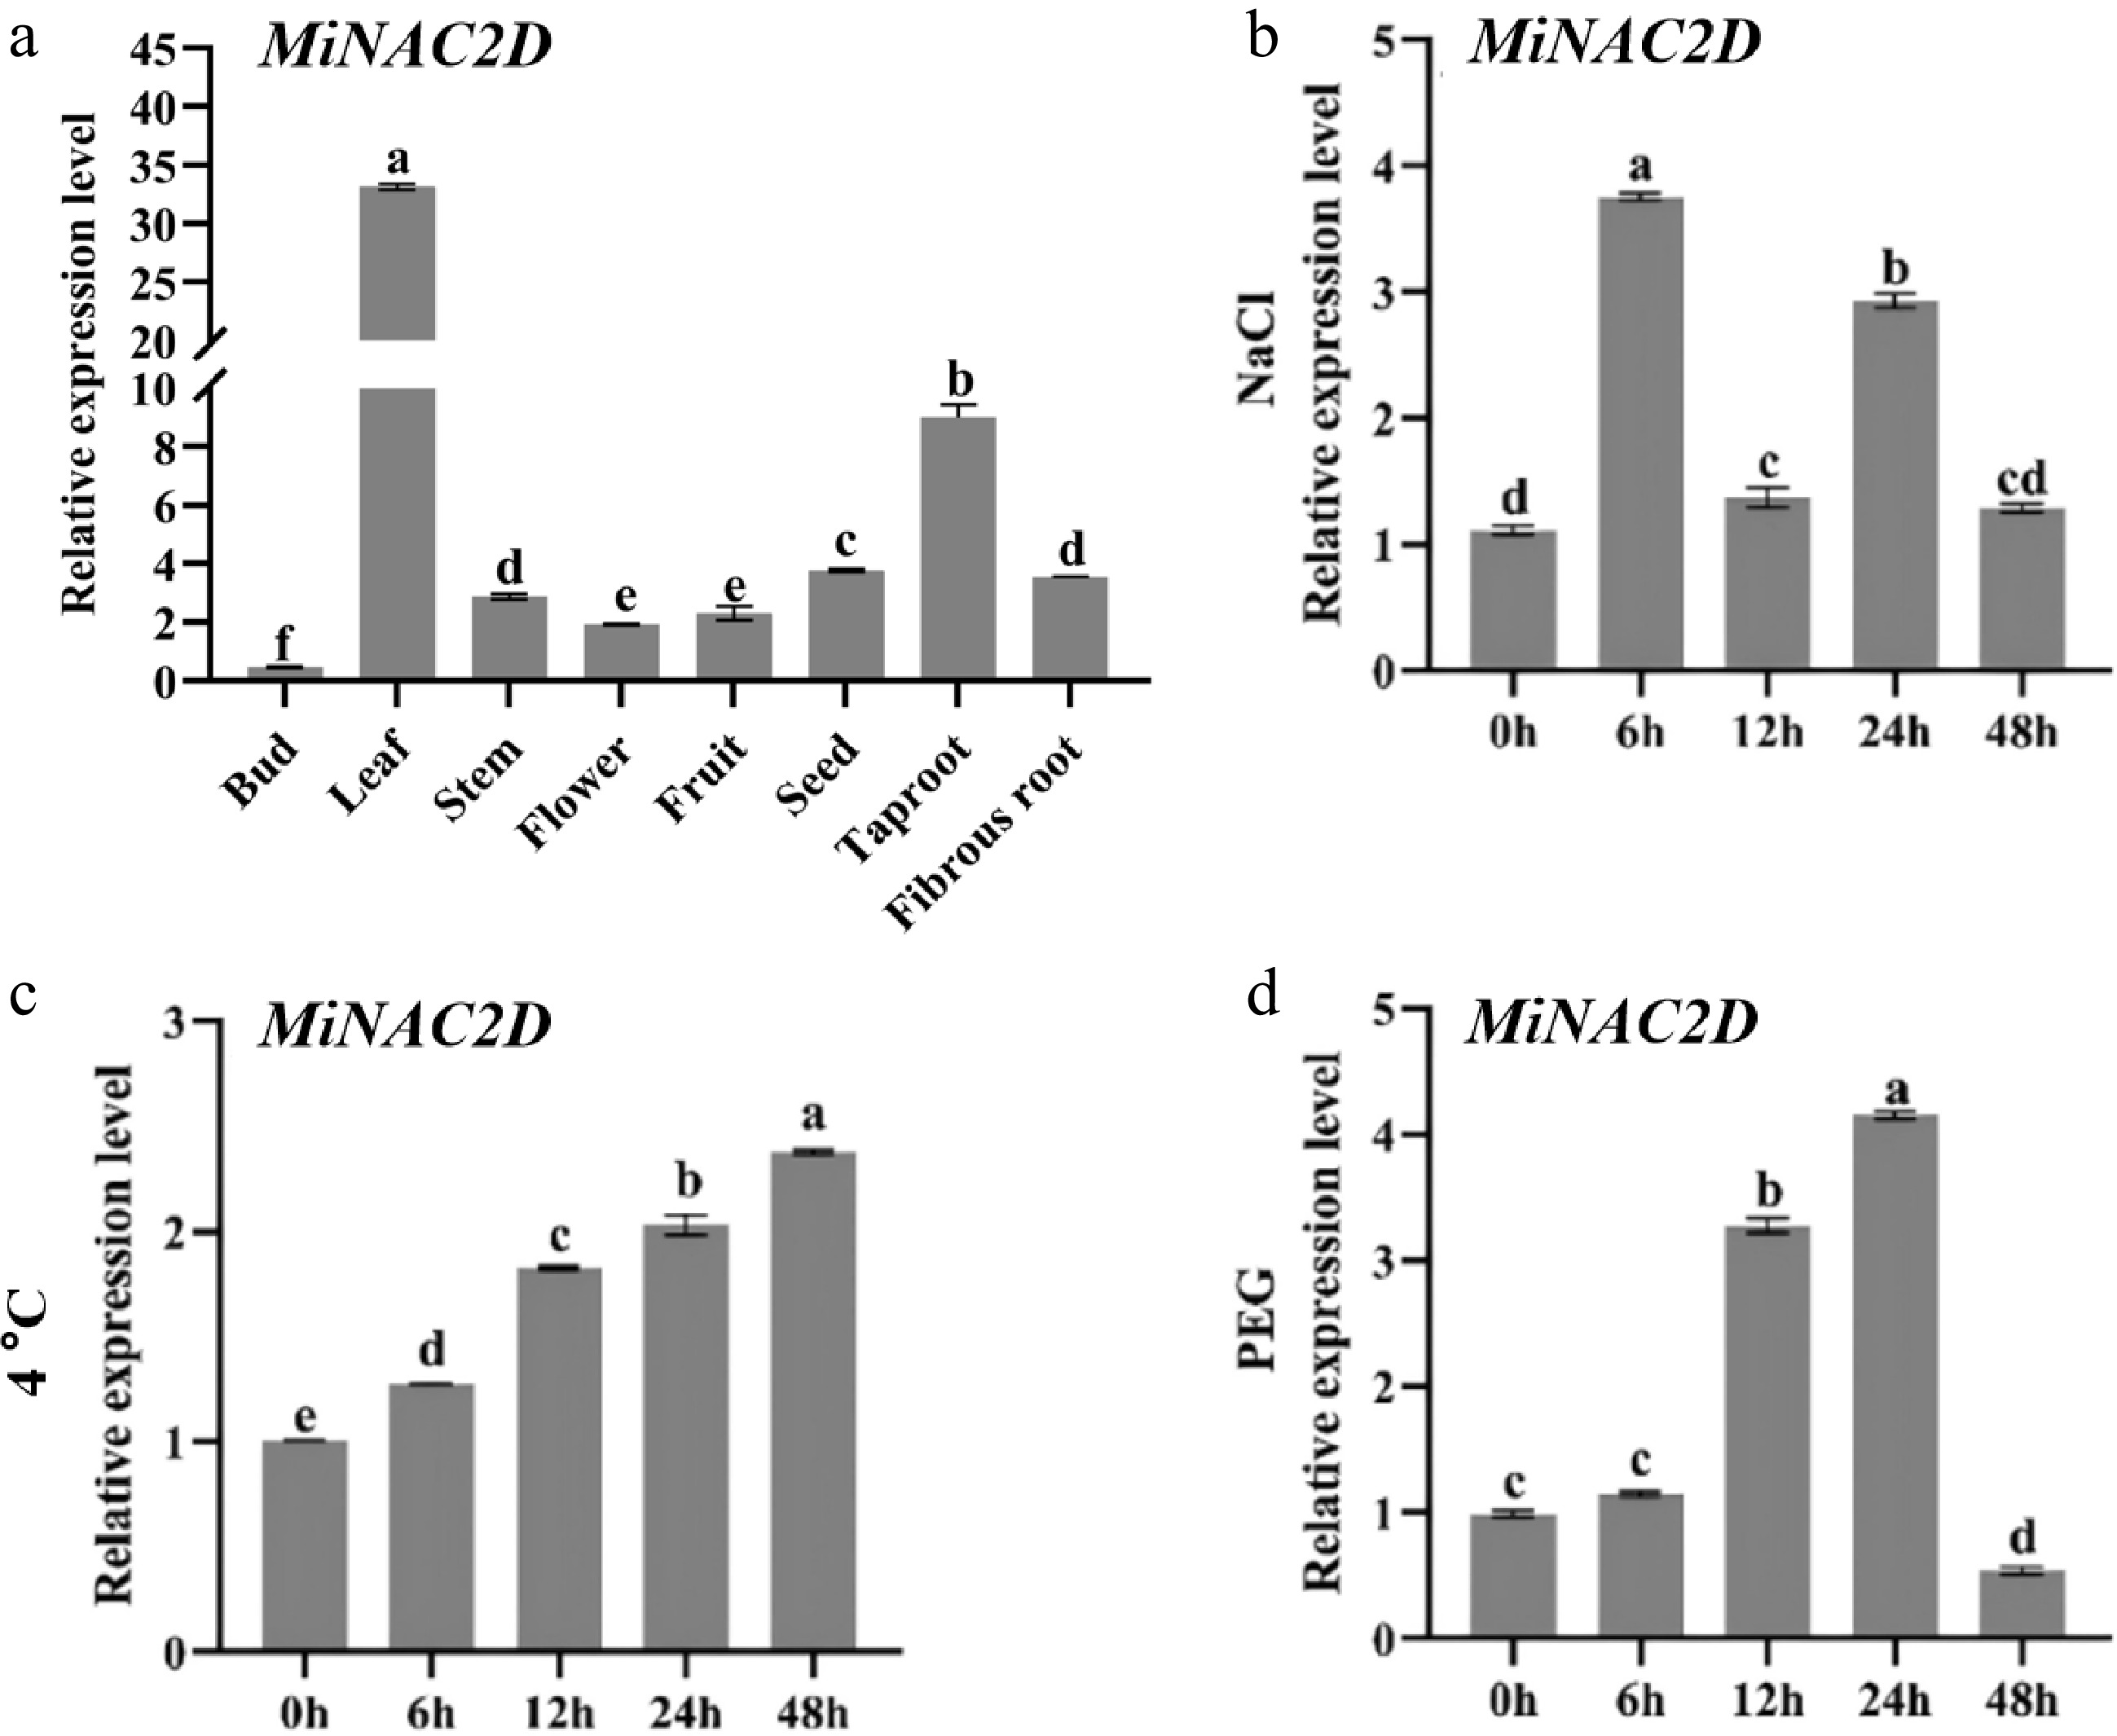
Figure 3.
Expression analysis of the MiNAC2D gene. (a) Tissue expression pattern analysis of the MiNAC2D gene. (b) Expression pattern analysis of the MiNAC2D gene under salt stress. (c) Expression pattern analysis of the MiNAC2D gene under low temperature stress. (d) Expression pattern analysis of the MiNAC2D gene under drought stress. Significant differences are indicated when p < 0.05, with a, b, c, d, e, and f representing significant differences.
-
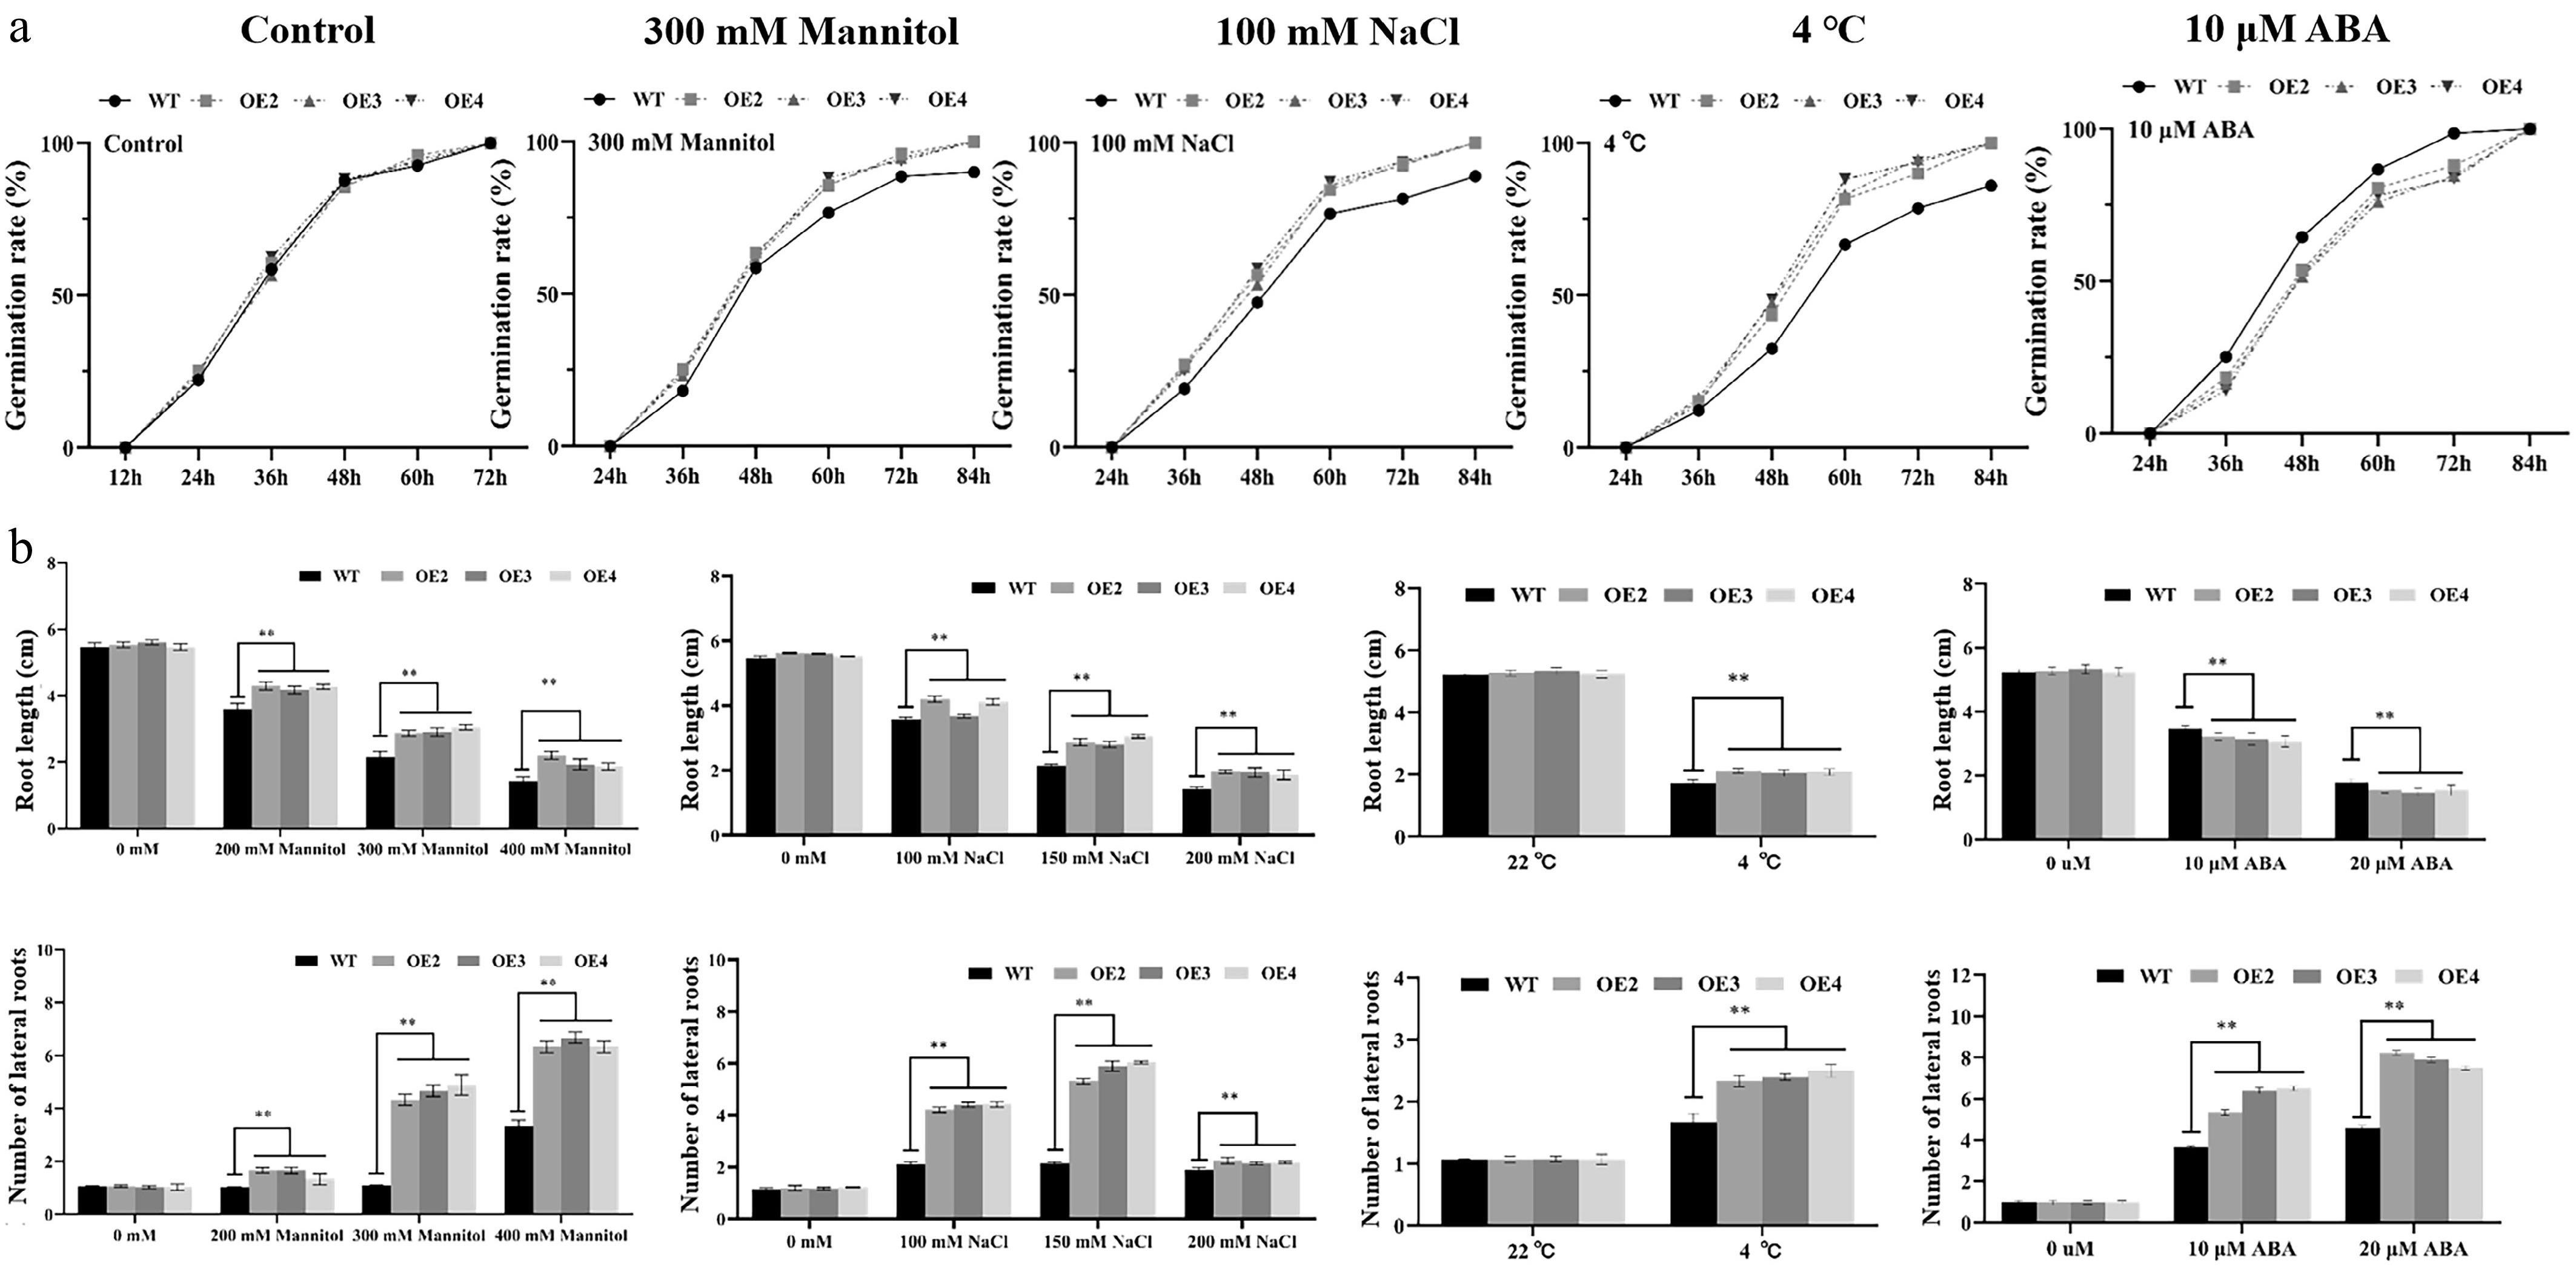
Figure 4.
Performance of WT and MiNAC2D-OE Arabidopsis under drought, salt, 4 °C, and ABA treatment. (a) Germination rate analysis of WT and MiNAC2D-OE. (b) Analysis of root length and lateral root numbers in MiNAC2D-OE and WT after treatment with different sodium chloride concentrations, ABA, and temperature gradients. Significant differences were defined as p < 0.01 (**) according to Tukey's t-tests.
-
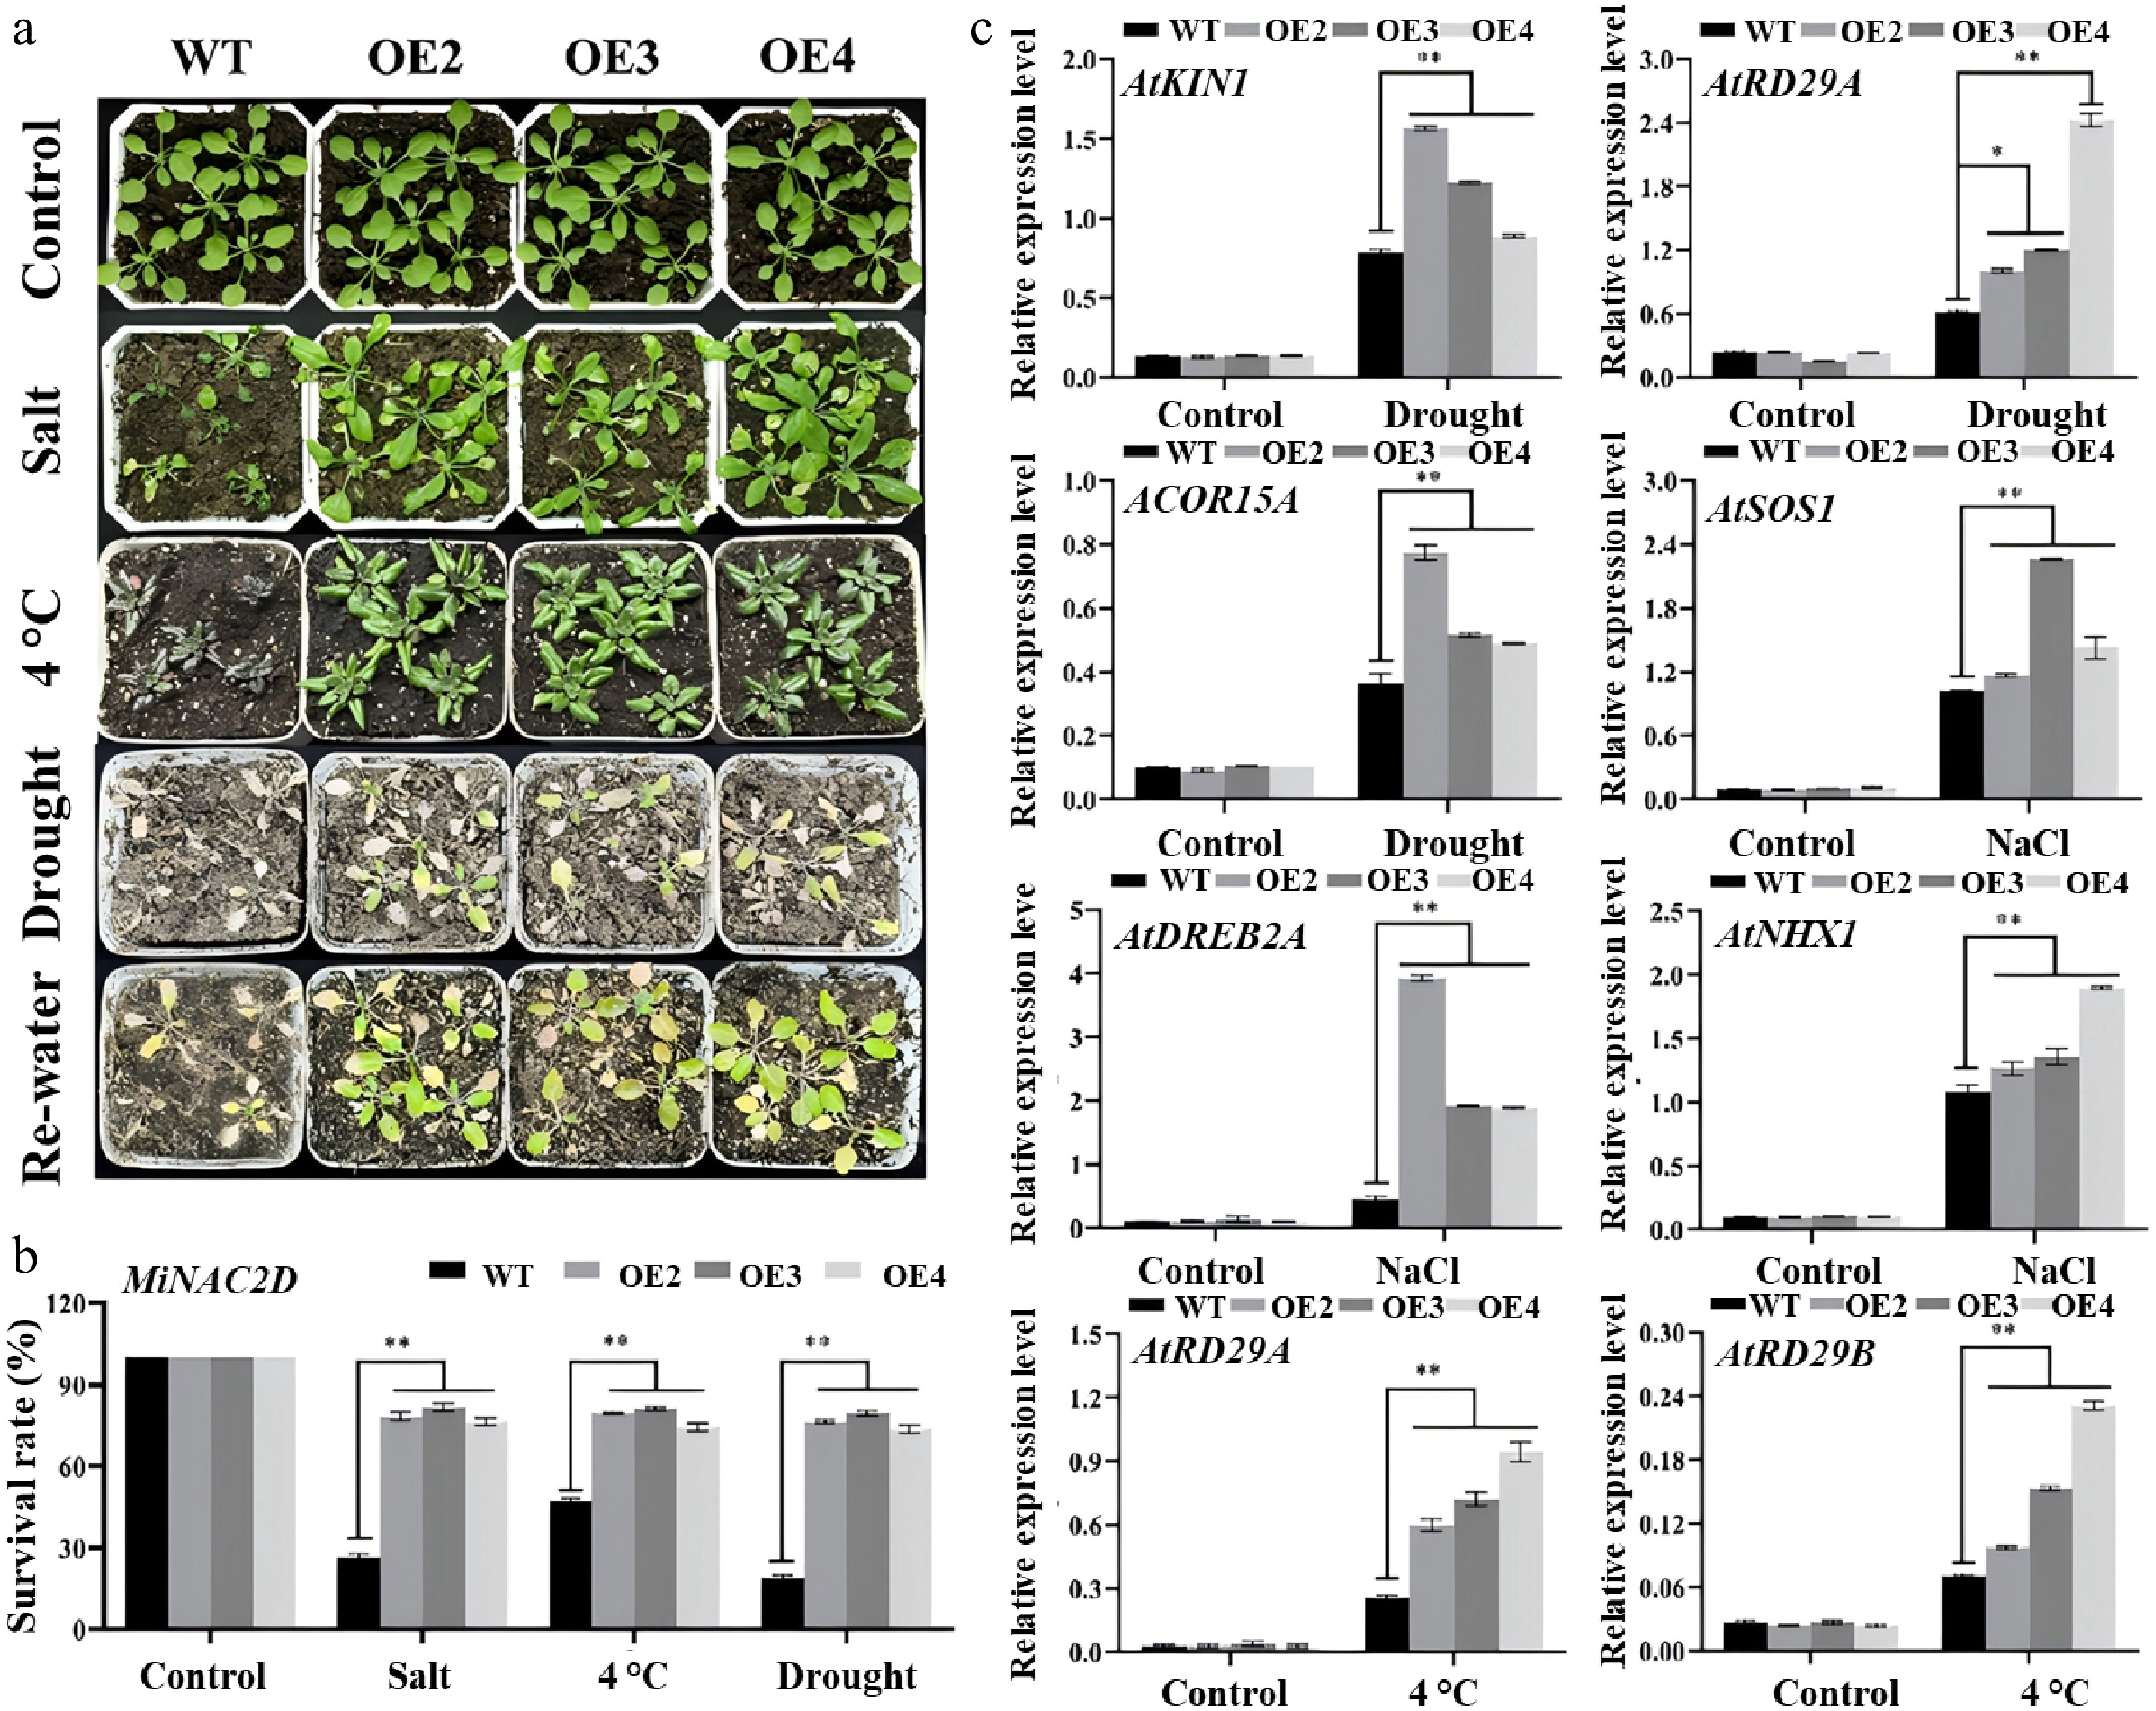
Figure 5.
MiNAC2D enhanced abiotic stress tolerance in Arabidopsis. (a) Growth phenotype of WT and MiNAC2D-OE lines. (b) Survival rate analysis of WT and MiNAC2D-OE lines. (c) Expression levels of the stress-related genes in WT and MiNAC2D-OE lines. Significant differences were defined as p < 0.01 (**) according to Tukey's t-tests.
-
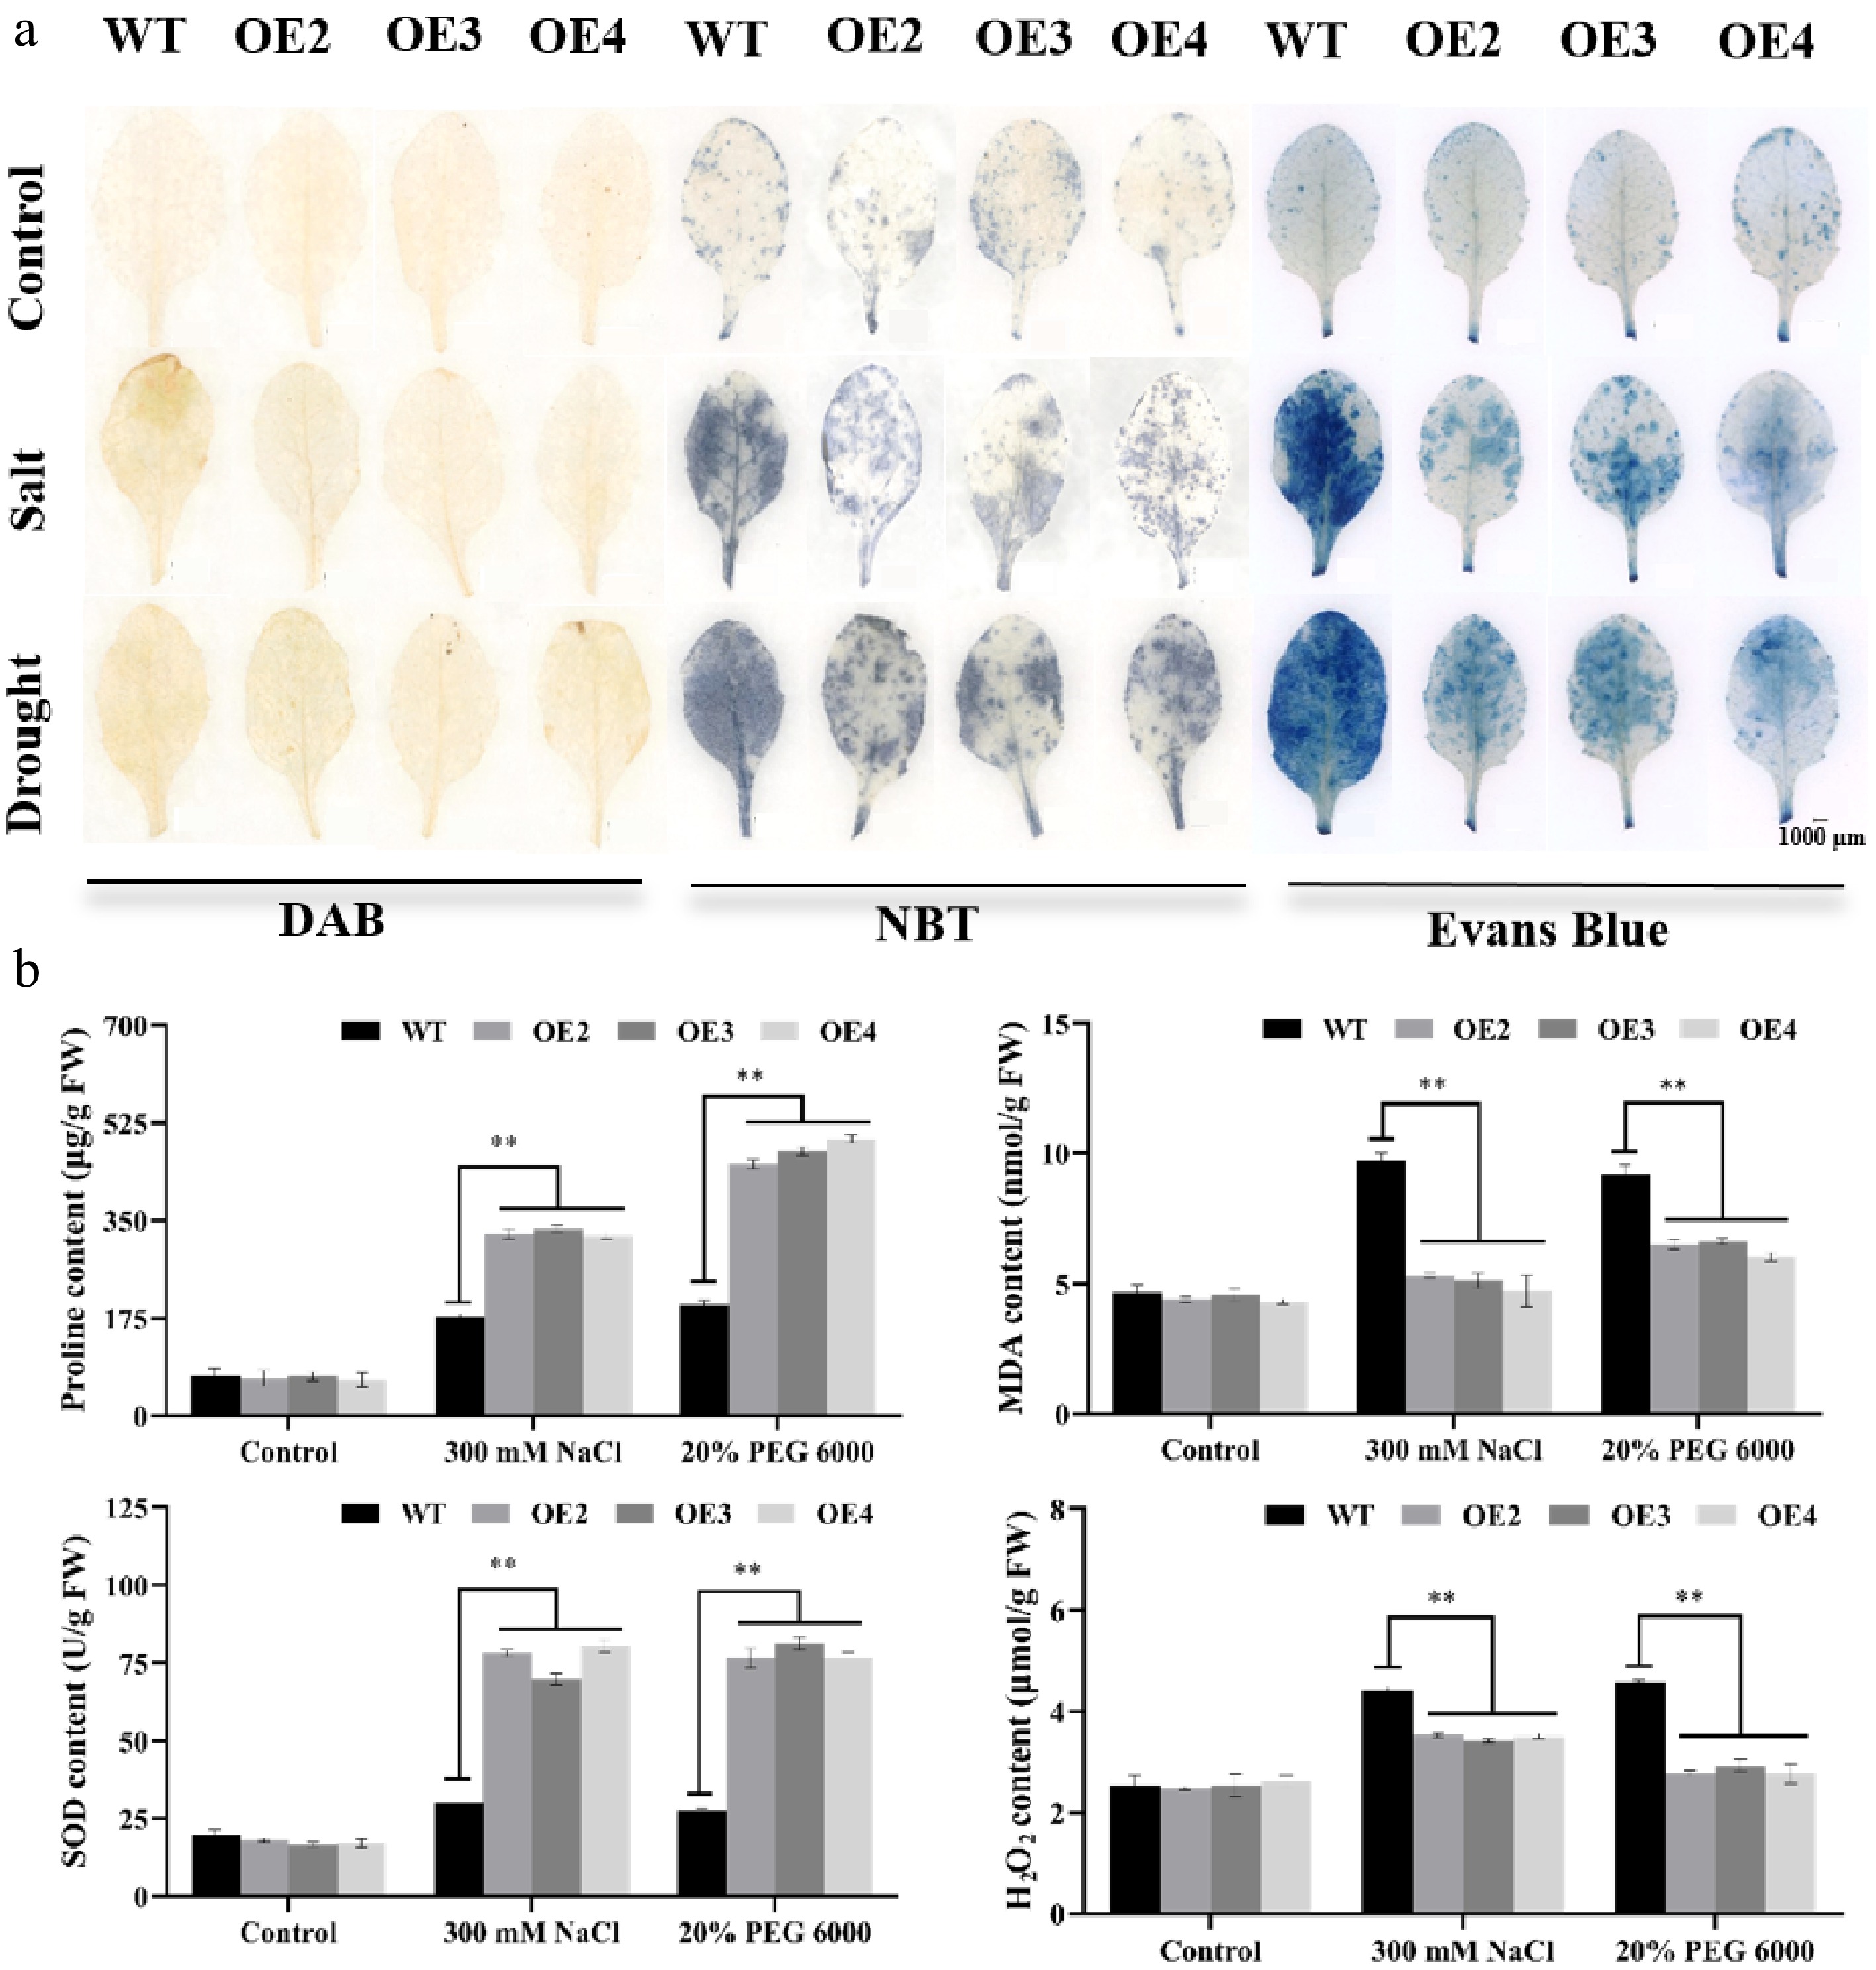
Figure 6.
MiNAC2D enhances Arabidopsis tolerance by boosting antioxidant enzymes and modulating osmotic homeostasis. (a) Phenotypes of WT and MiNAC2D-OE leaves stained with DAB, NBT, and Evans Blue. (b) SOD activity as well as the content of Pro, H2O2, and MDA in WT and MiNAC2D-OE lines. Significant differences were defined as p < 0.01 (**) according to Tukey's t-tests.
-
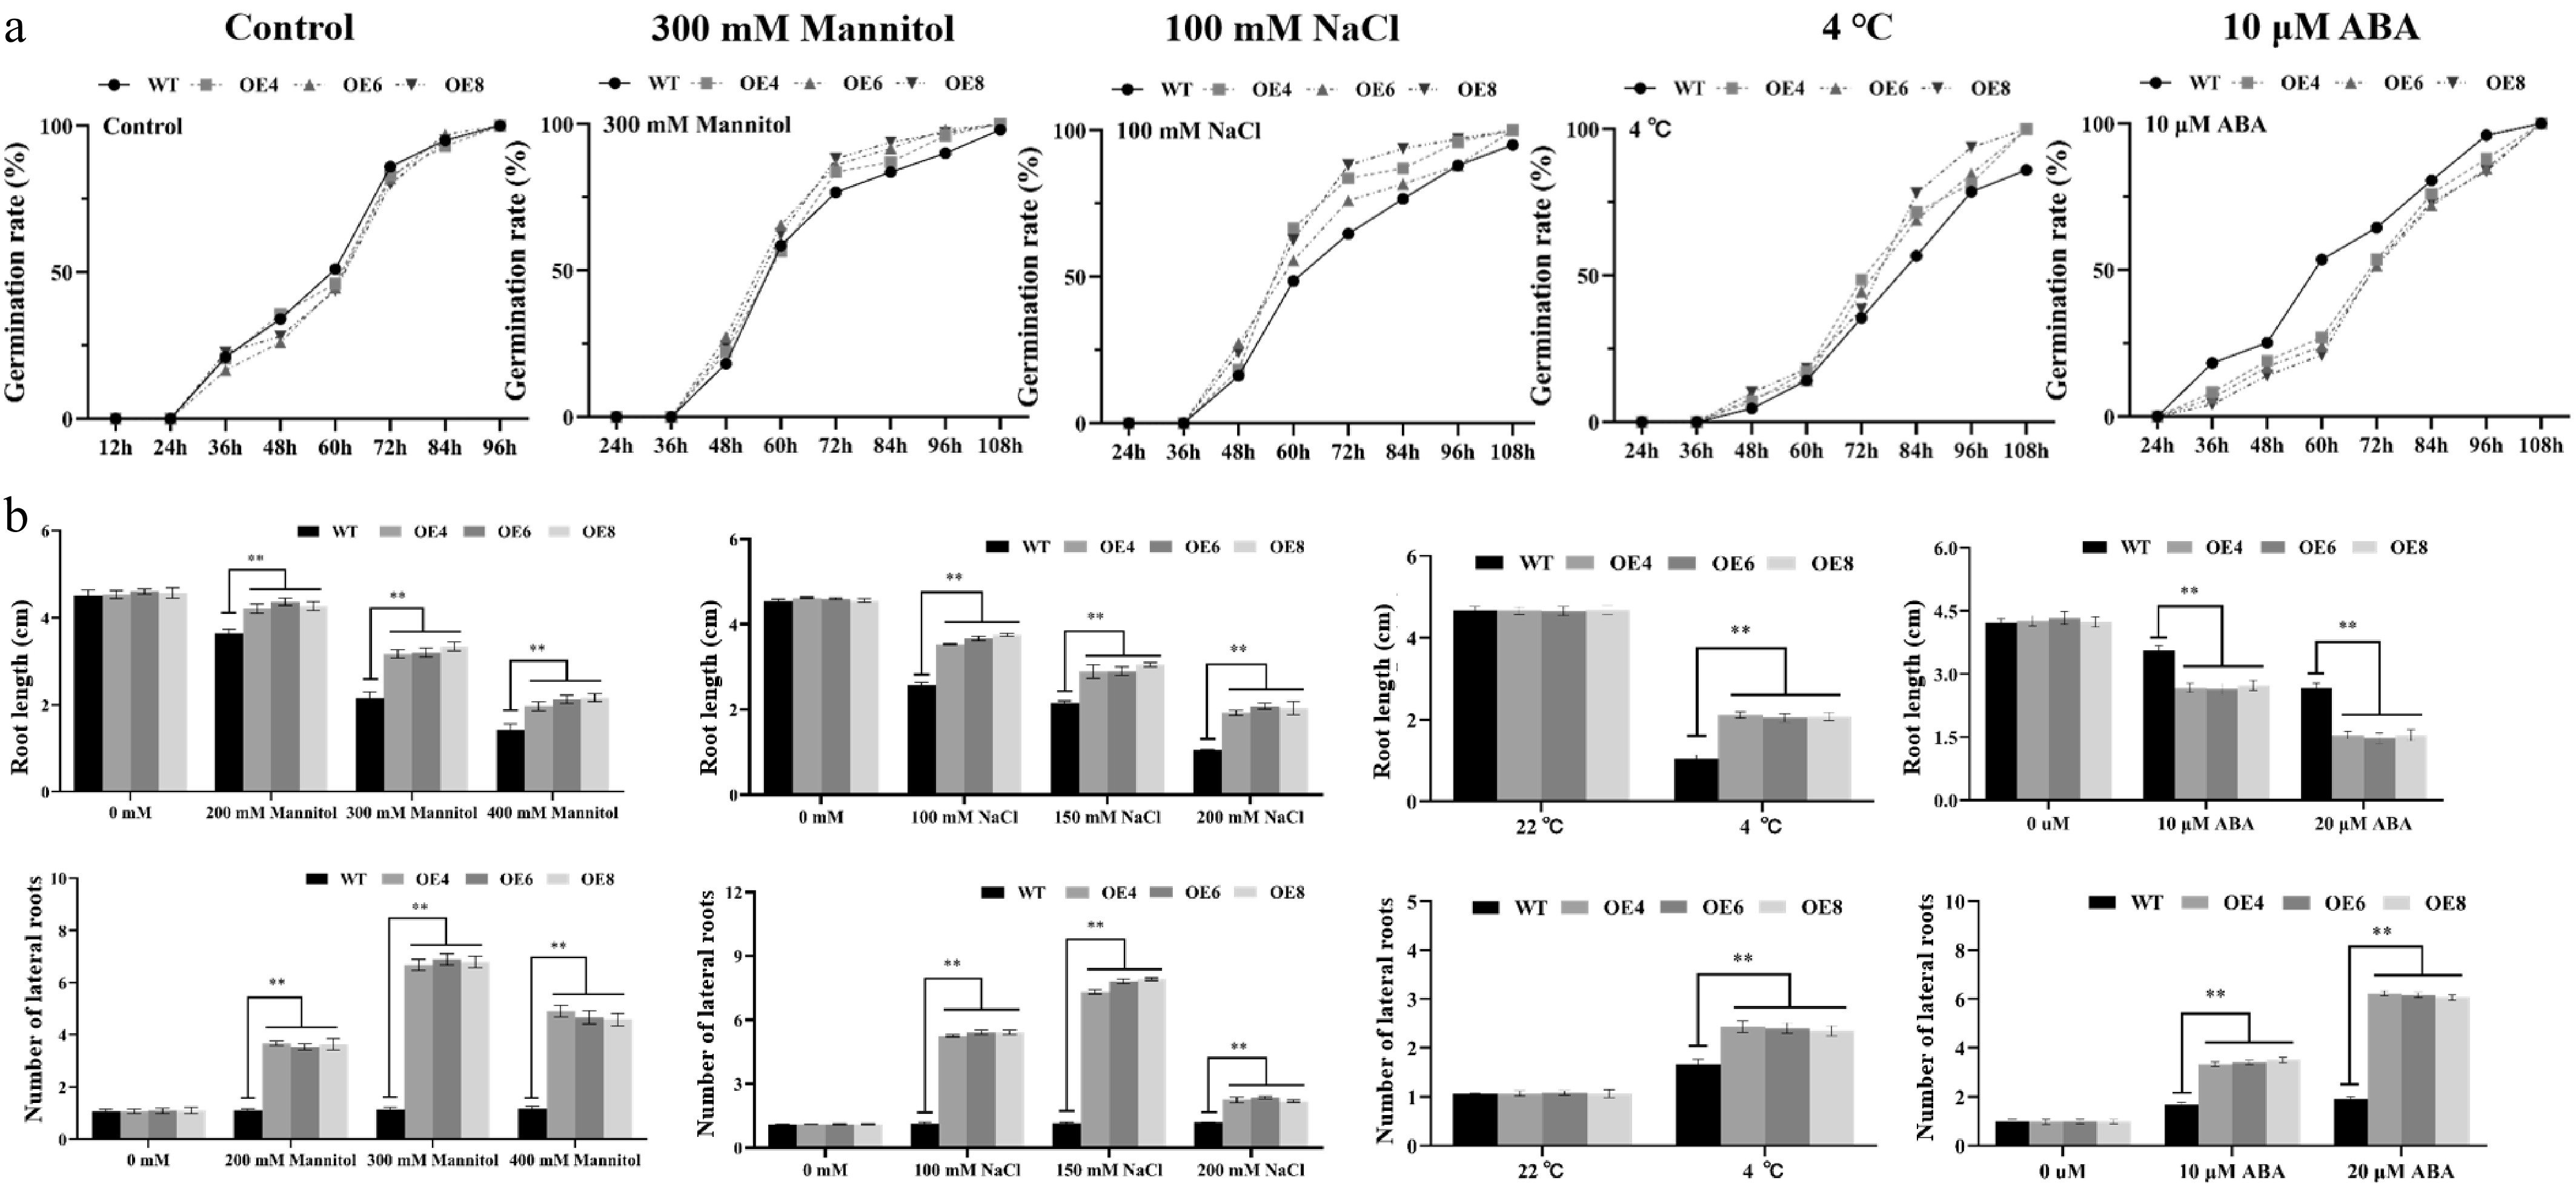
Figure 7.
Performance of WT and MiNAC2D-OE tomato under drought, salt, 4 °C and ABA treatment. (a) Germination rate analysis of WT and MiNAC2D-OE lines. (b) Root length and lateral root number of WT and MiNAC2D-OE lines. Significant differences were defined as p < 0.01 (**) according to Tukey's t-tests.
-
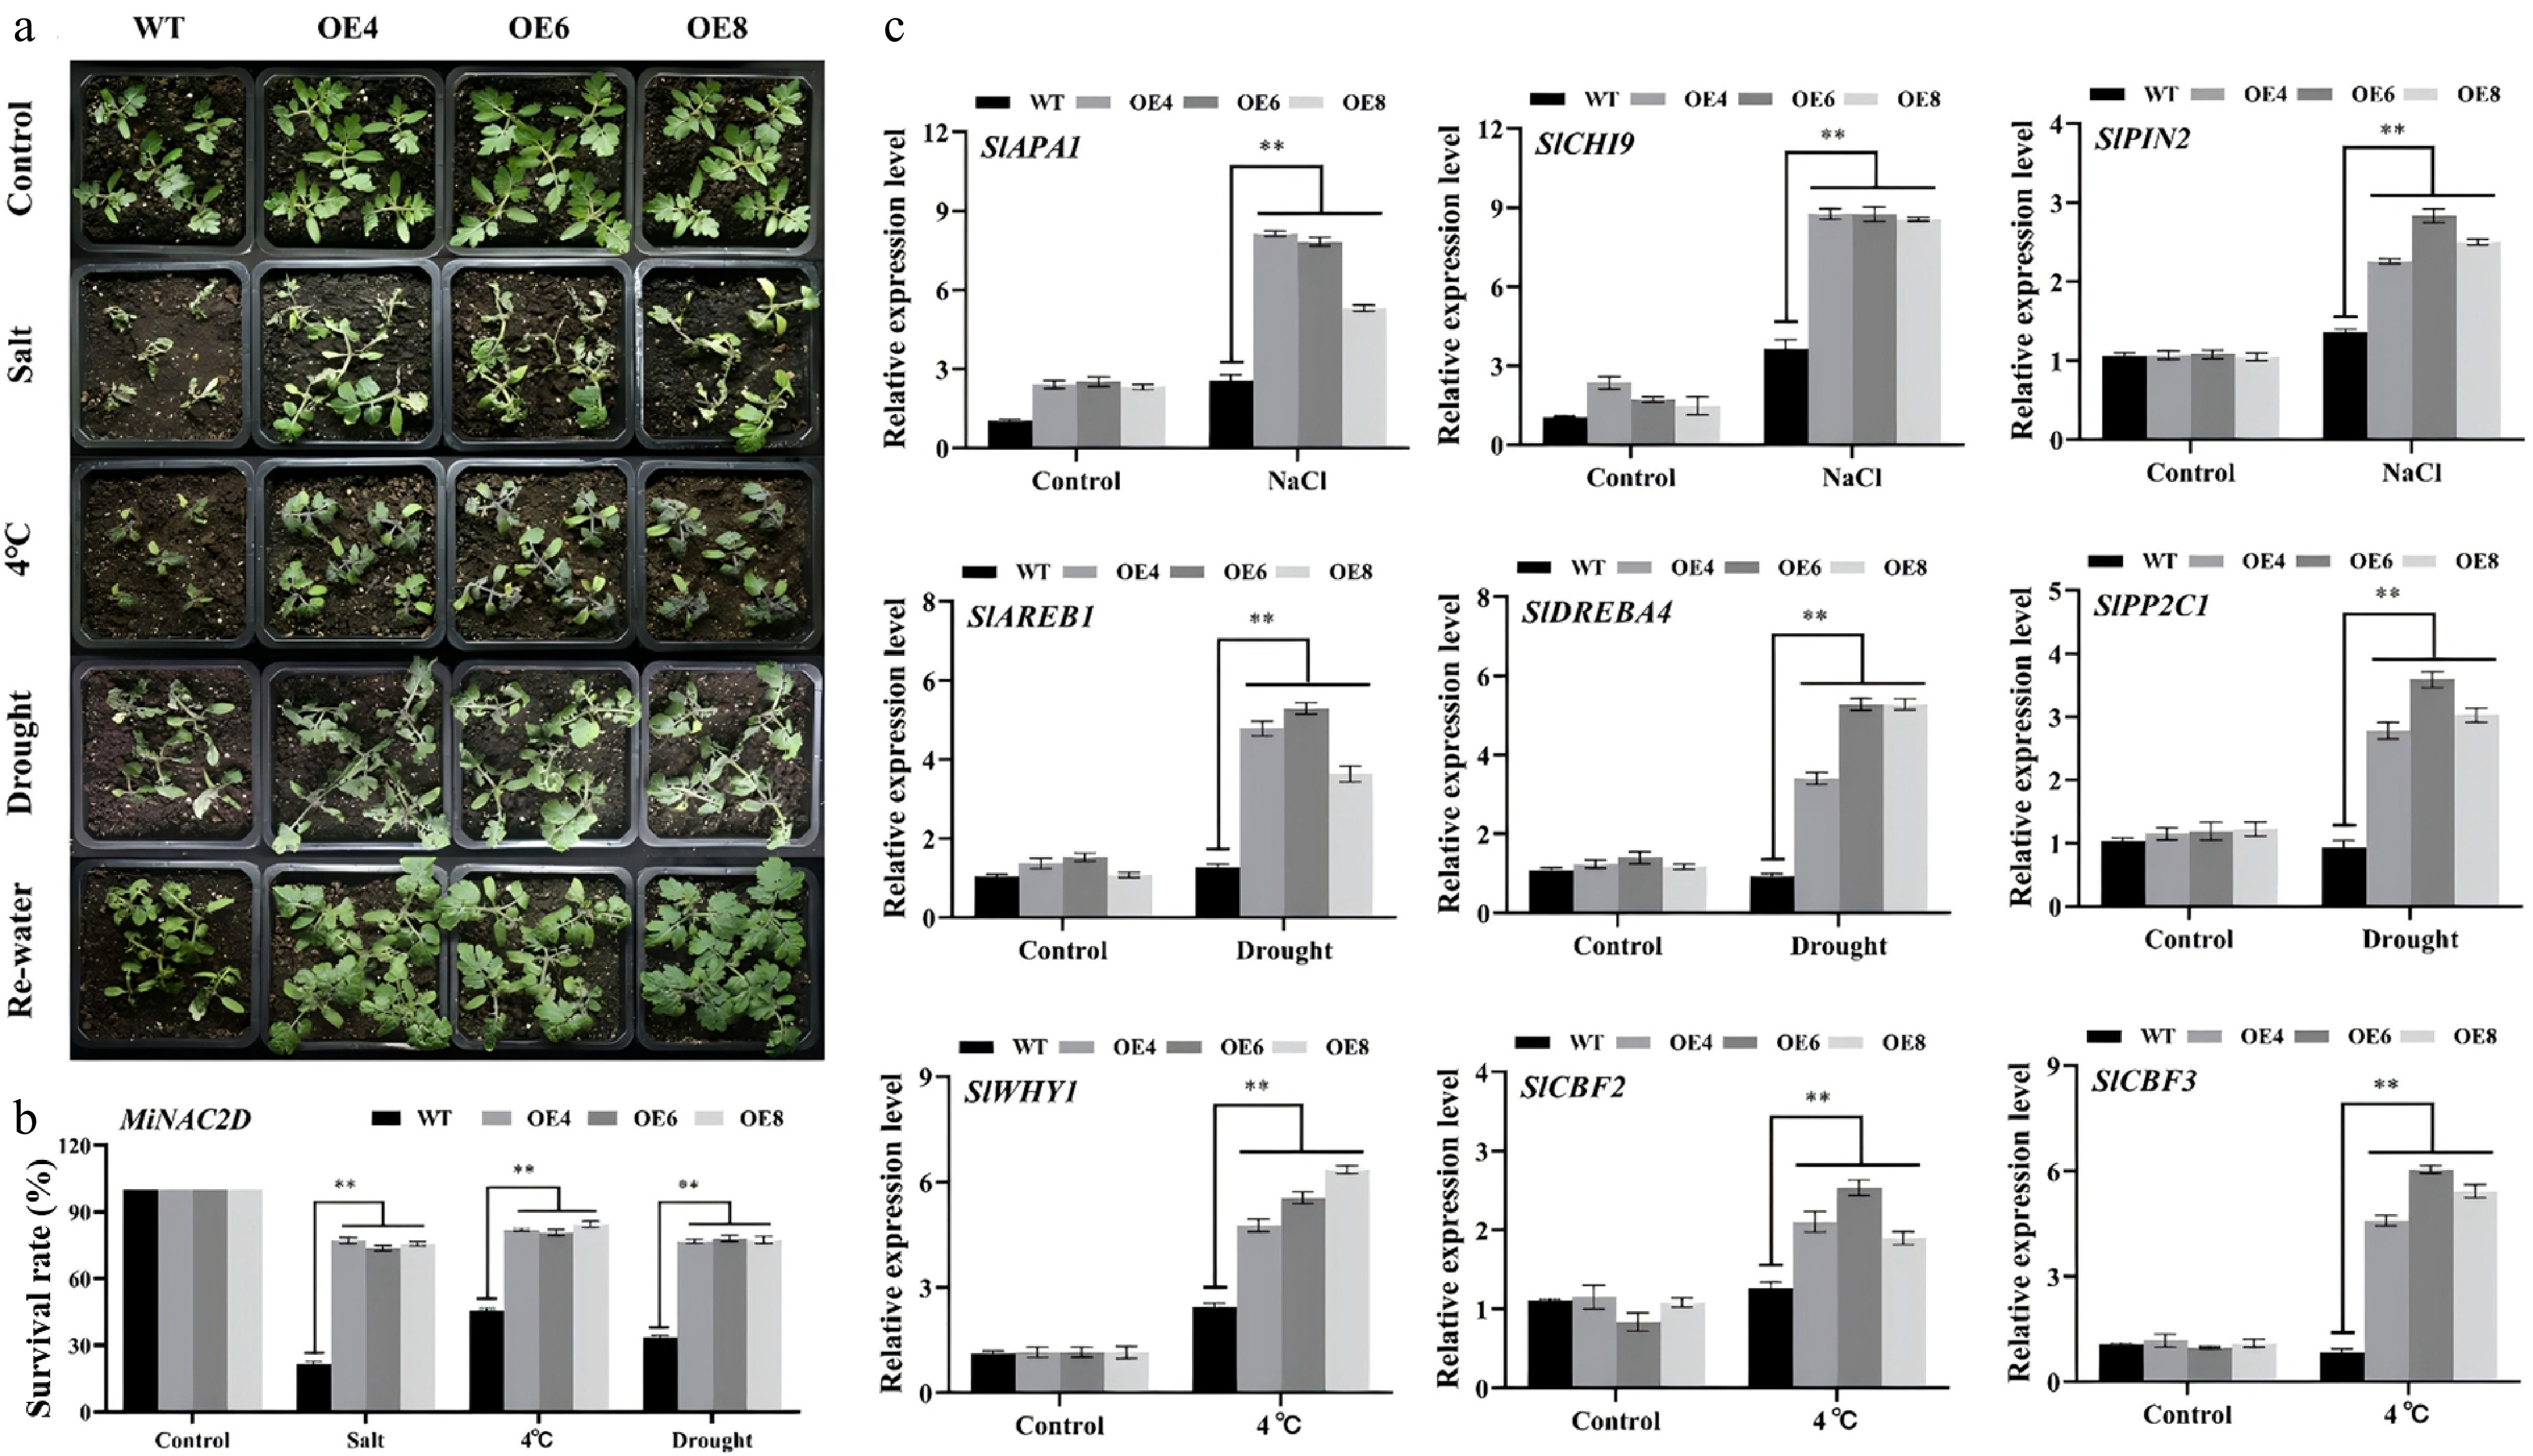
Figure 8.
MiNAC2D enhanced abiotic stress tolerance in tomato. (a) Growth phenotype of WT and MiNAC2D-OE lines. (b) Survival rate analysis of WT and MiNAC2D-OE lines. (c) Expression levels of the stress-related genes in WT and MiNAC2D-OE lines. Significant differences were defined as p < 0.01 (**) according to Tukey's t-tests.
-
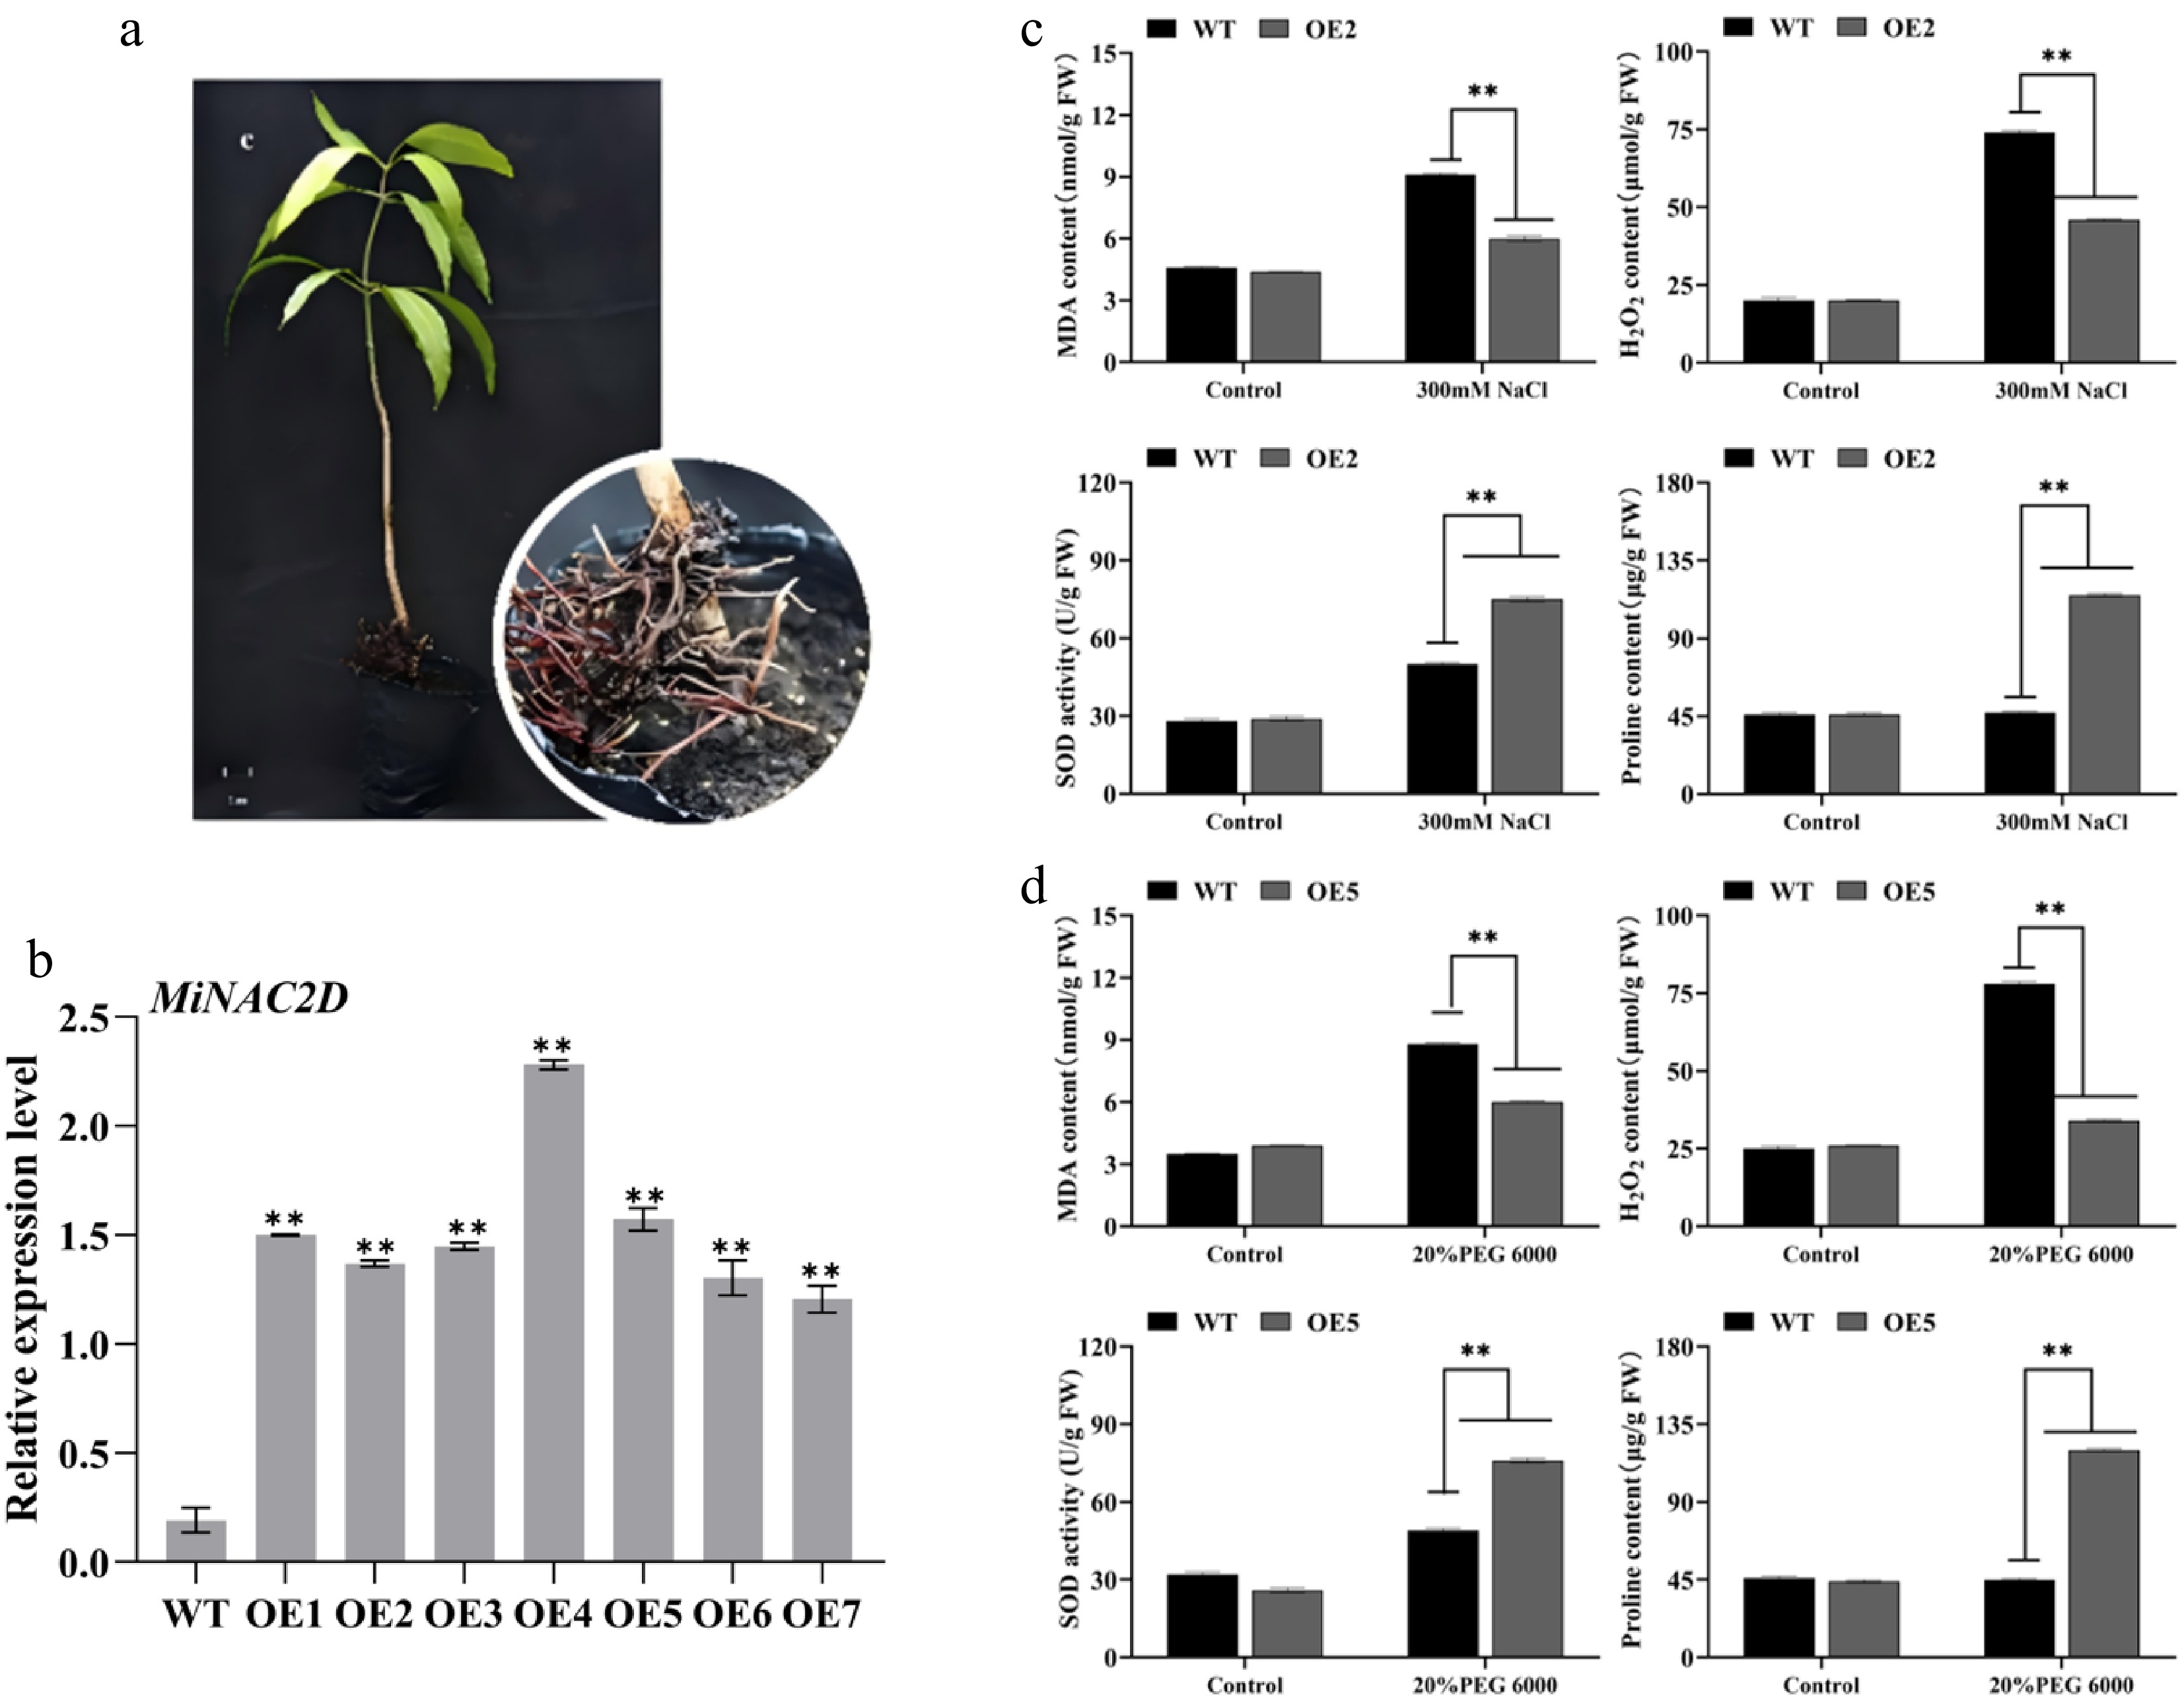
Figure 9.
MiNAC2D enhanced abiotic stress tolerance in mango. (a), (b) Overexpression of MiNAC2D in the root system of mango. (c) Physiological index changes of WT and OE2 under 300 mM NaCl salt stress. MDA content, H2O2 content, SOD activity and proline content were determined in control and salt-treated seedlings. (d) Physiological index changes of WT and OE5 under 20% PEG 6000 drought stress. MDA content, H2O2 content, SOD activity and proline content were determined in control and drought-treated seedlings. Significant differences were defined as p < 0.01 (**) according to Tukey's t-tests.
-
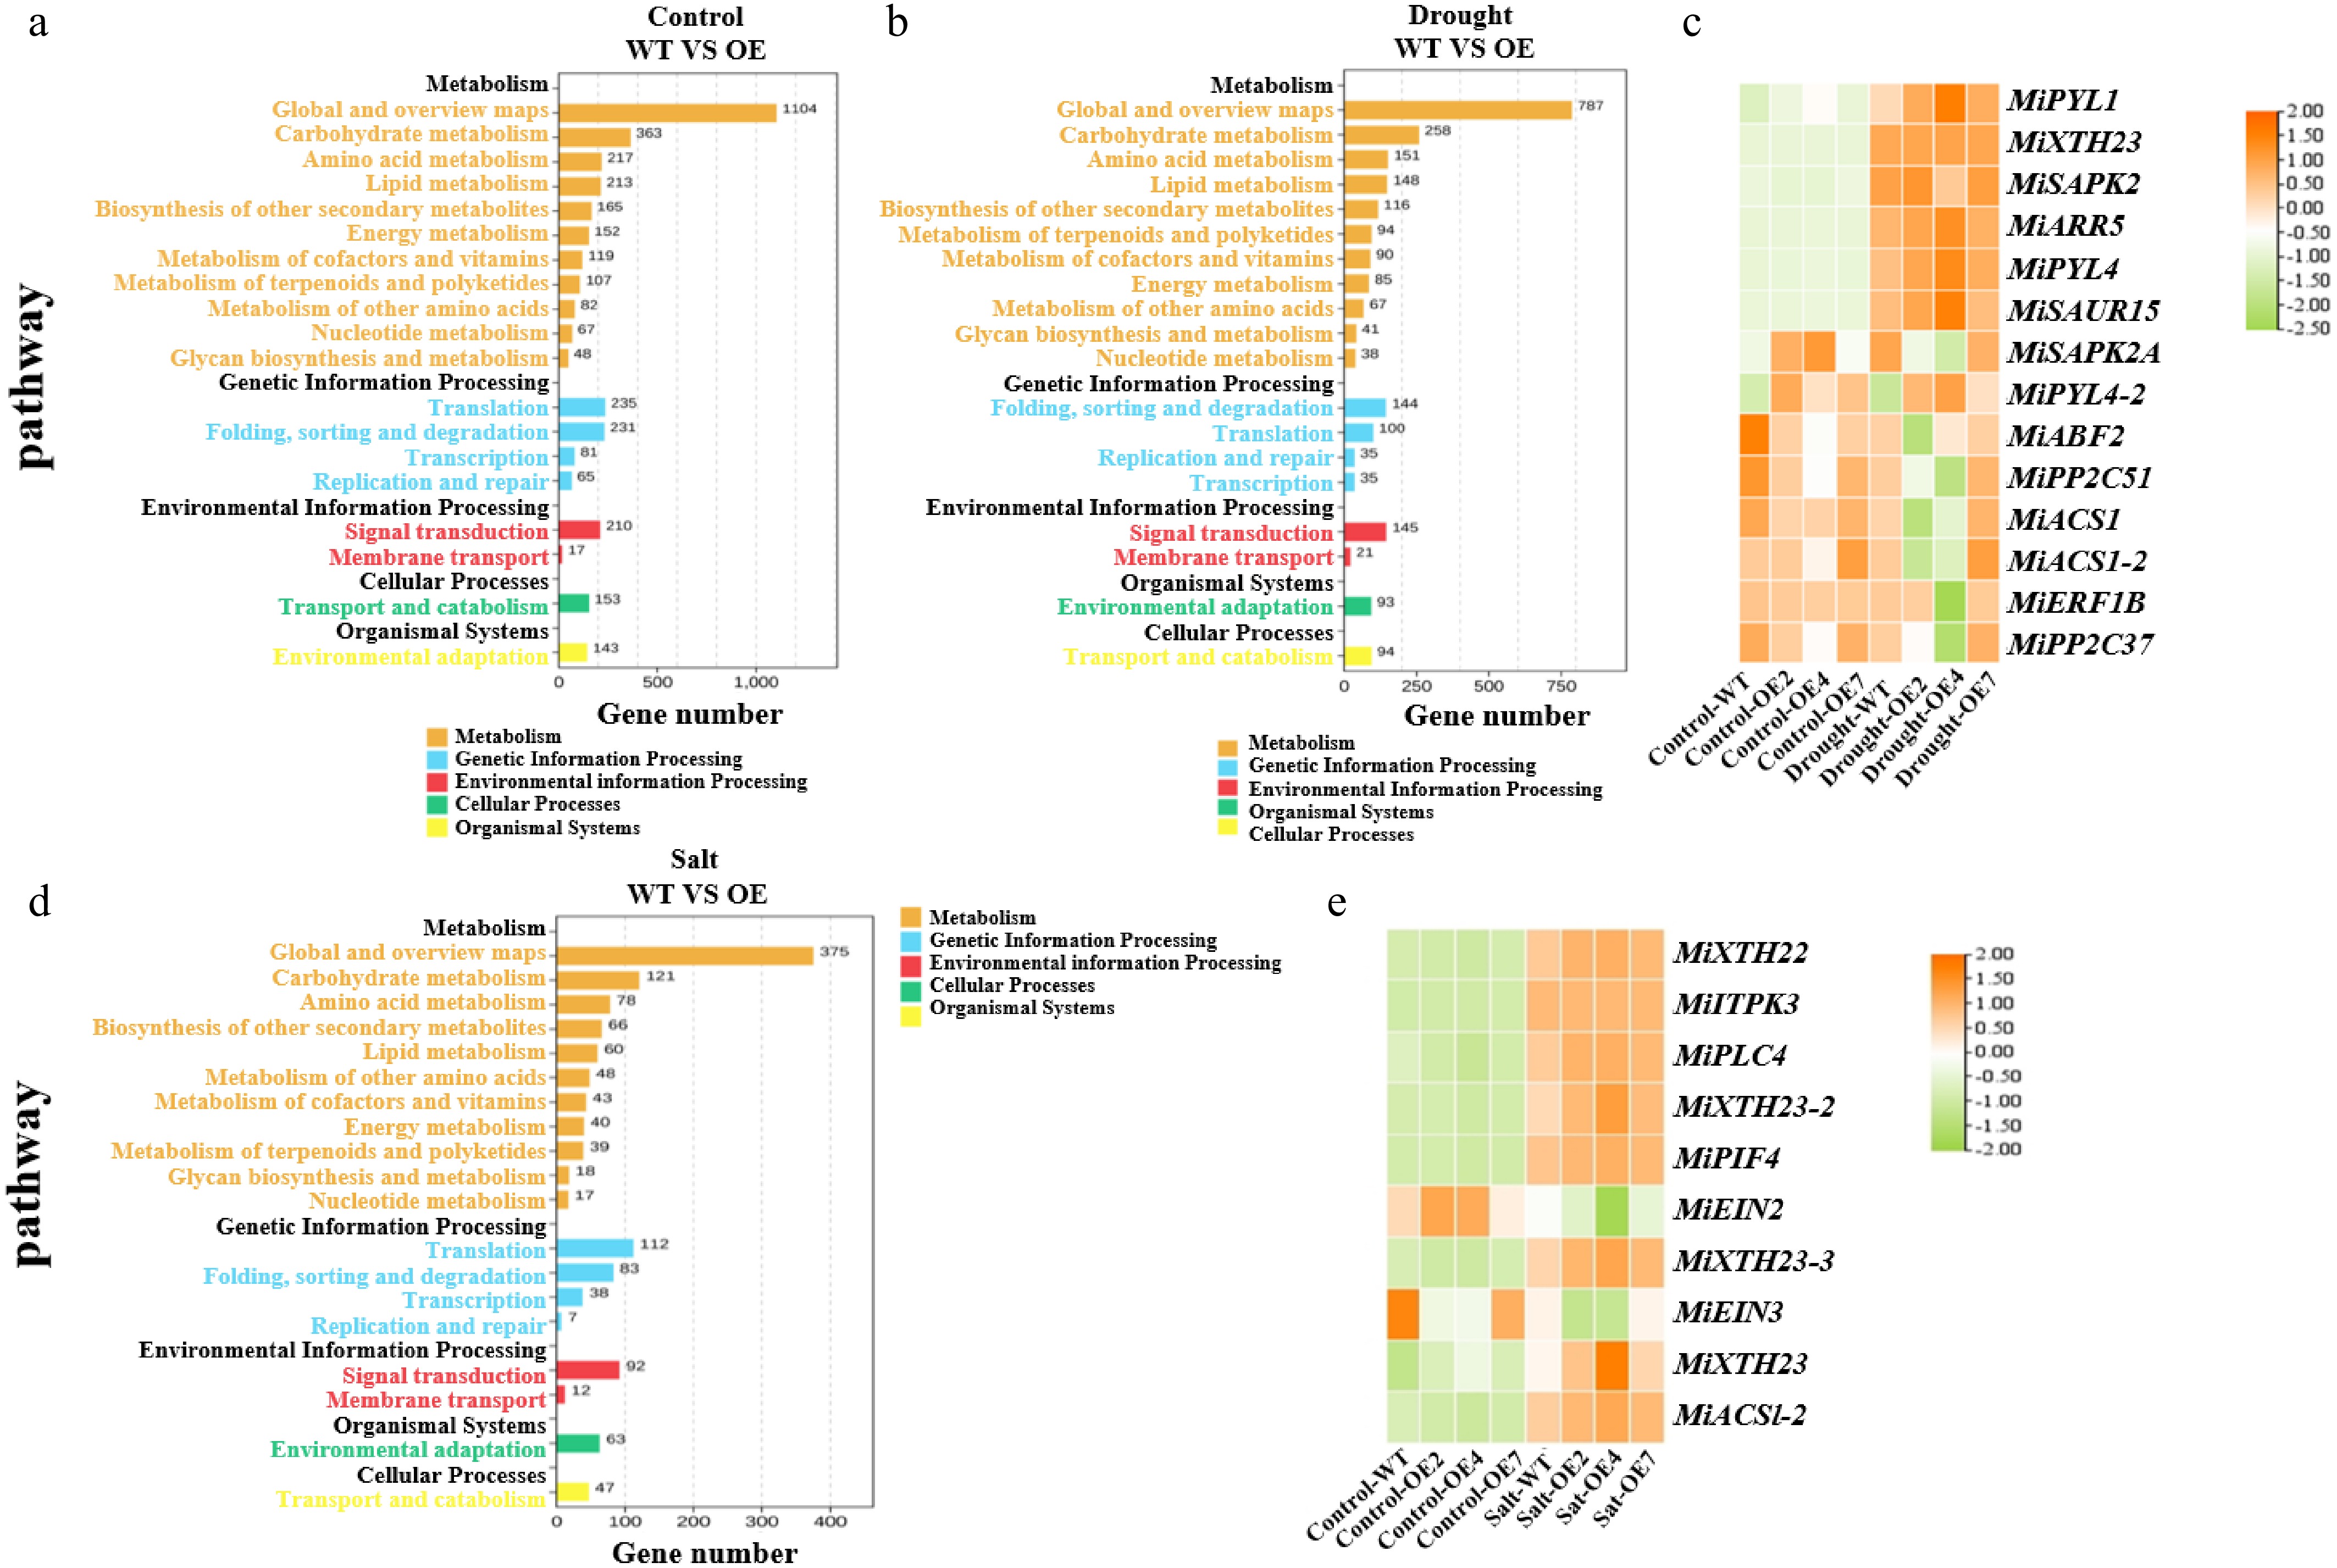
Figure 10.
MiNAC2D mediates drought and salt tolerance through distinct signaling pathways. (a) KEGG pathway enrichment histogram in WT and OE lines under control conditions. (b) KEGG pathway enrichment histogram in WT and OE lines under drought conditions. (c) Heatmap analysis of candidate gene expression patterns under control and drought conditions. (d) KEGG pathway enrichment histogram in WT and OE lines under salt conditions. (e) Heatmap analysis of candidate gene expression under different treatment conditions.
Figures
(10)
Tables
(0)