-
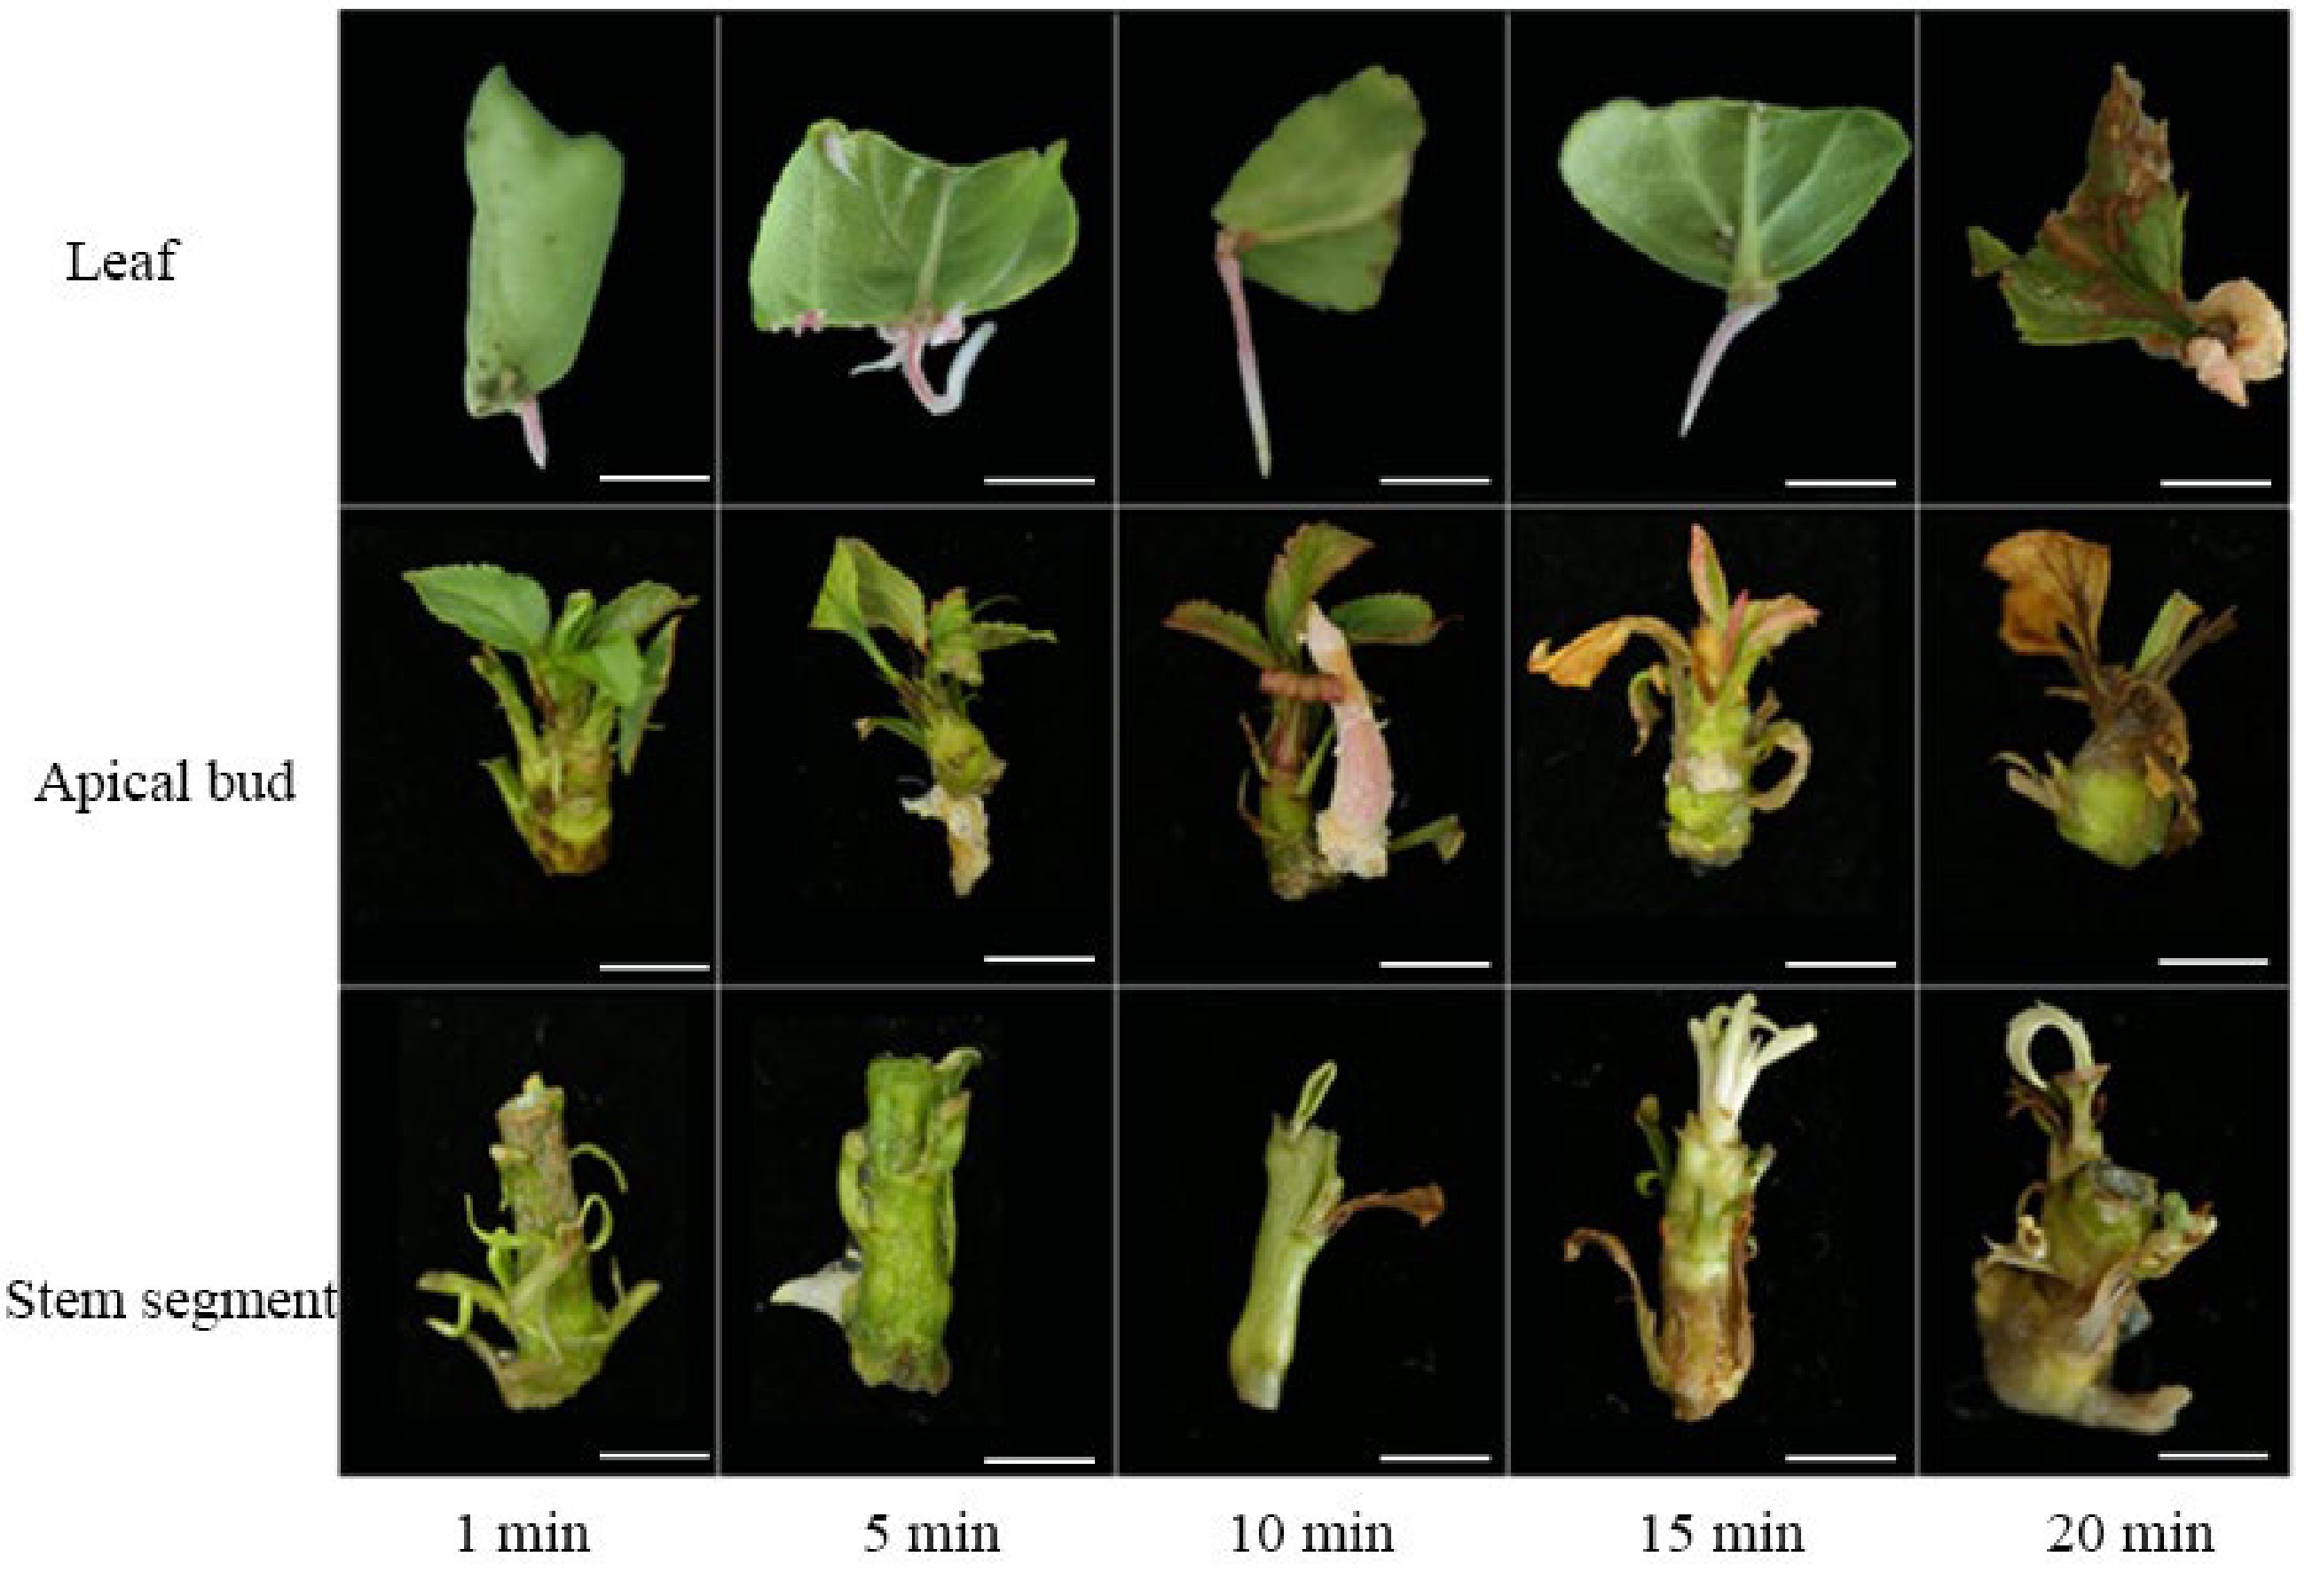
Figure 1.
Morphological effect of explant types and Agrobacterium infection duration on hairy root induction efficiency in CX5. Scale bars, 1 cm.
-
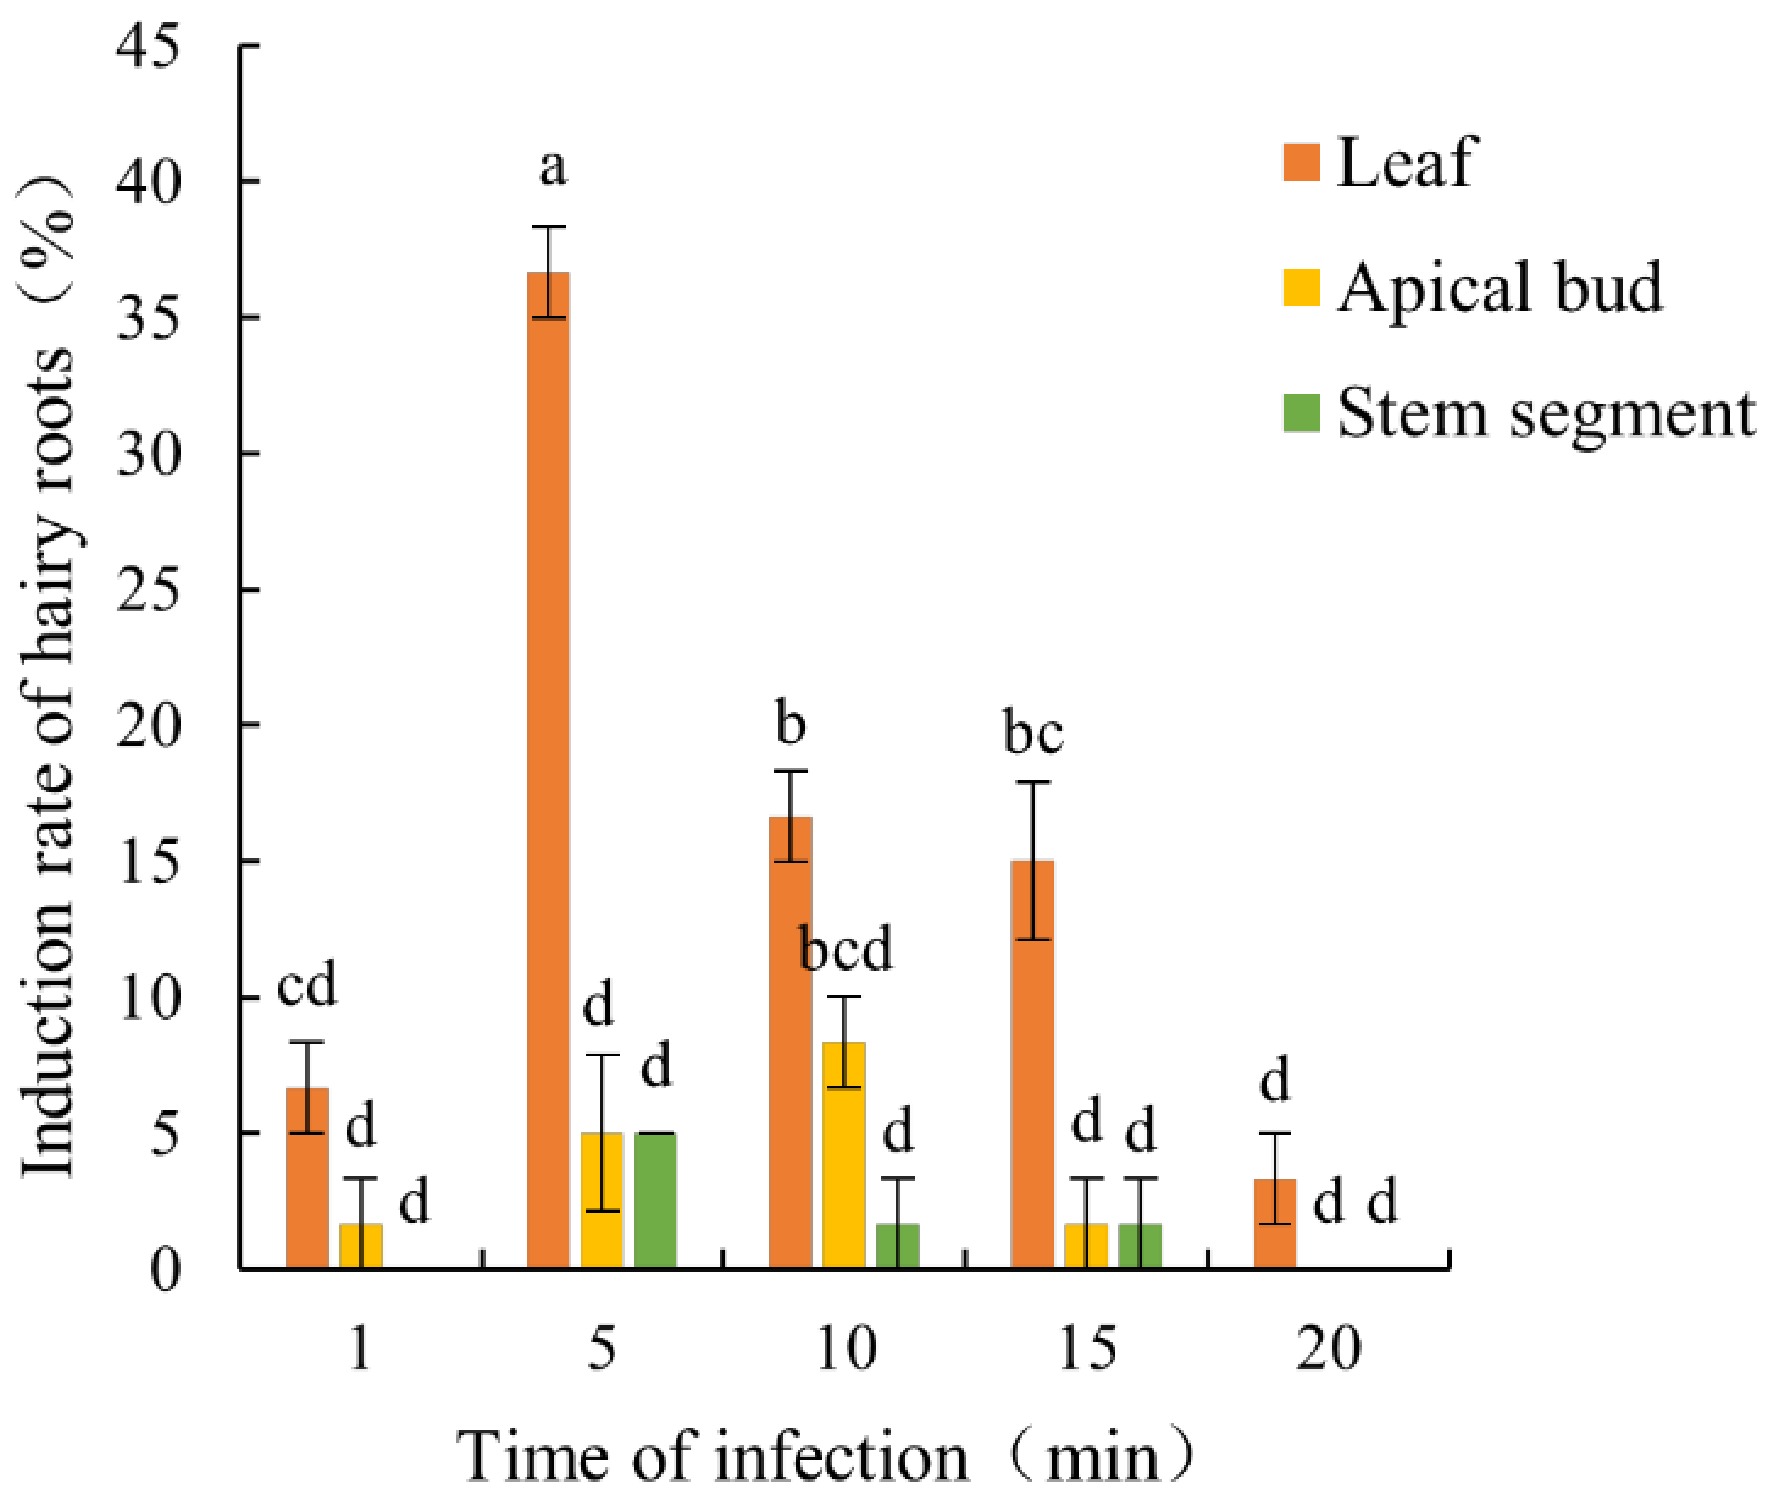
Figure 2.
Effects of explant types and Agrobacterium infection duration on hairy root induction efficiency in CX5 infection duration. Bars represent the mean value ± standard error (SE) (n = 3). Lowercase letters indicate significant differences among treatments (p < 0.05, one-way ANOVA test). Color codes denote explant types: leaf (orange), apical bud (yellow), and stem segment (green).
-
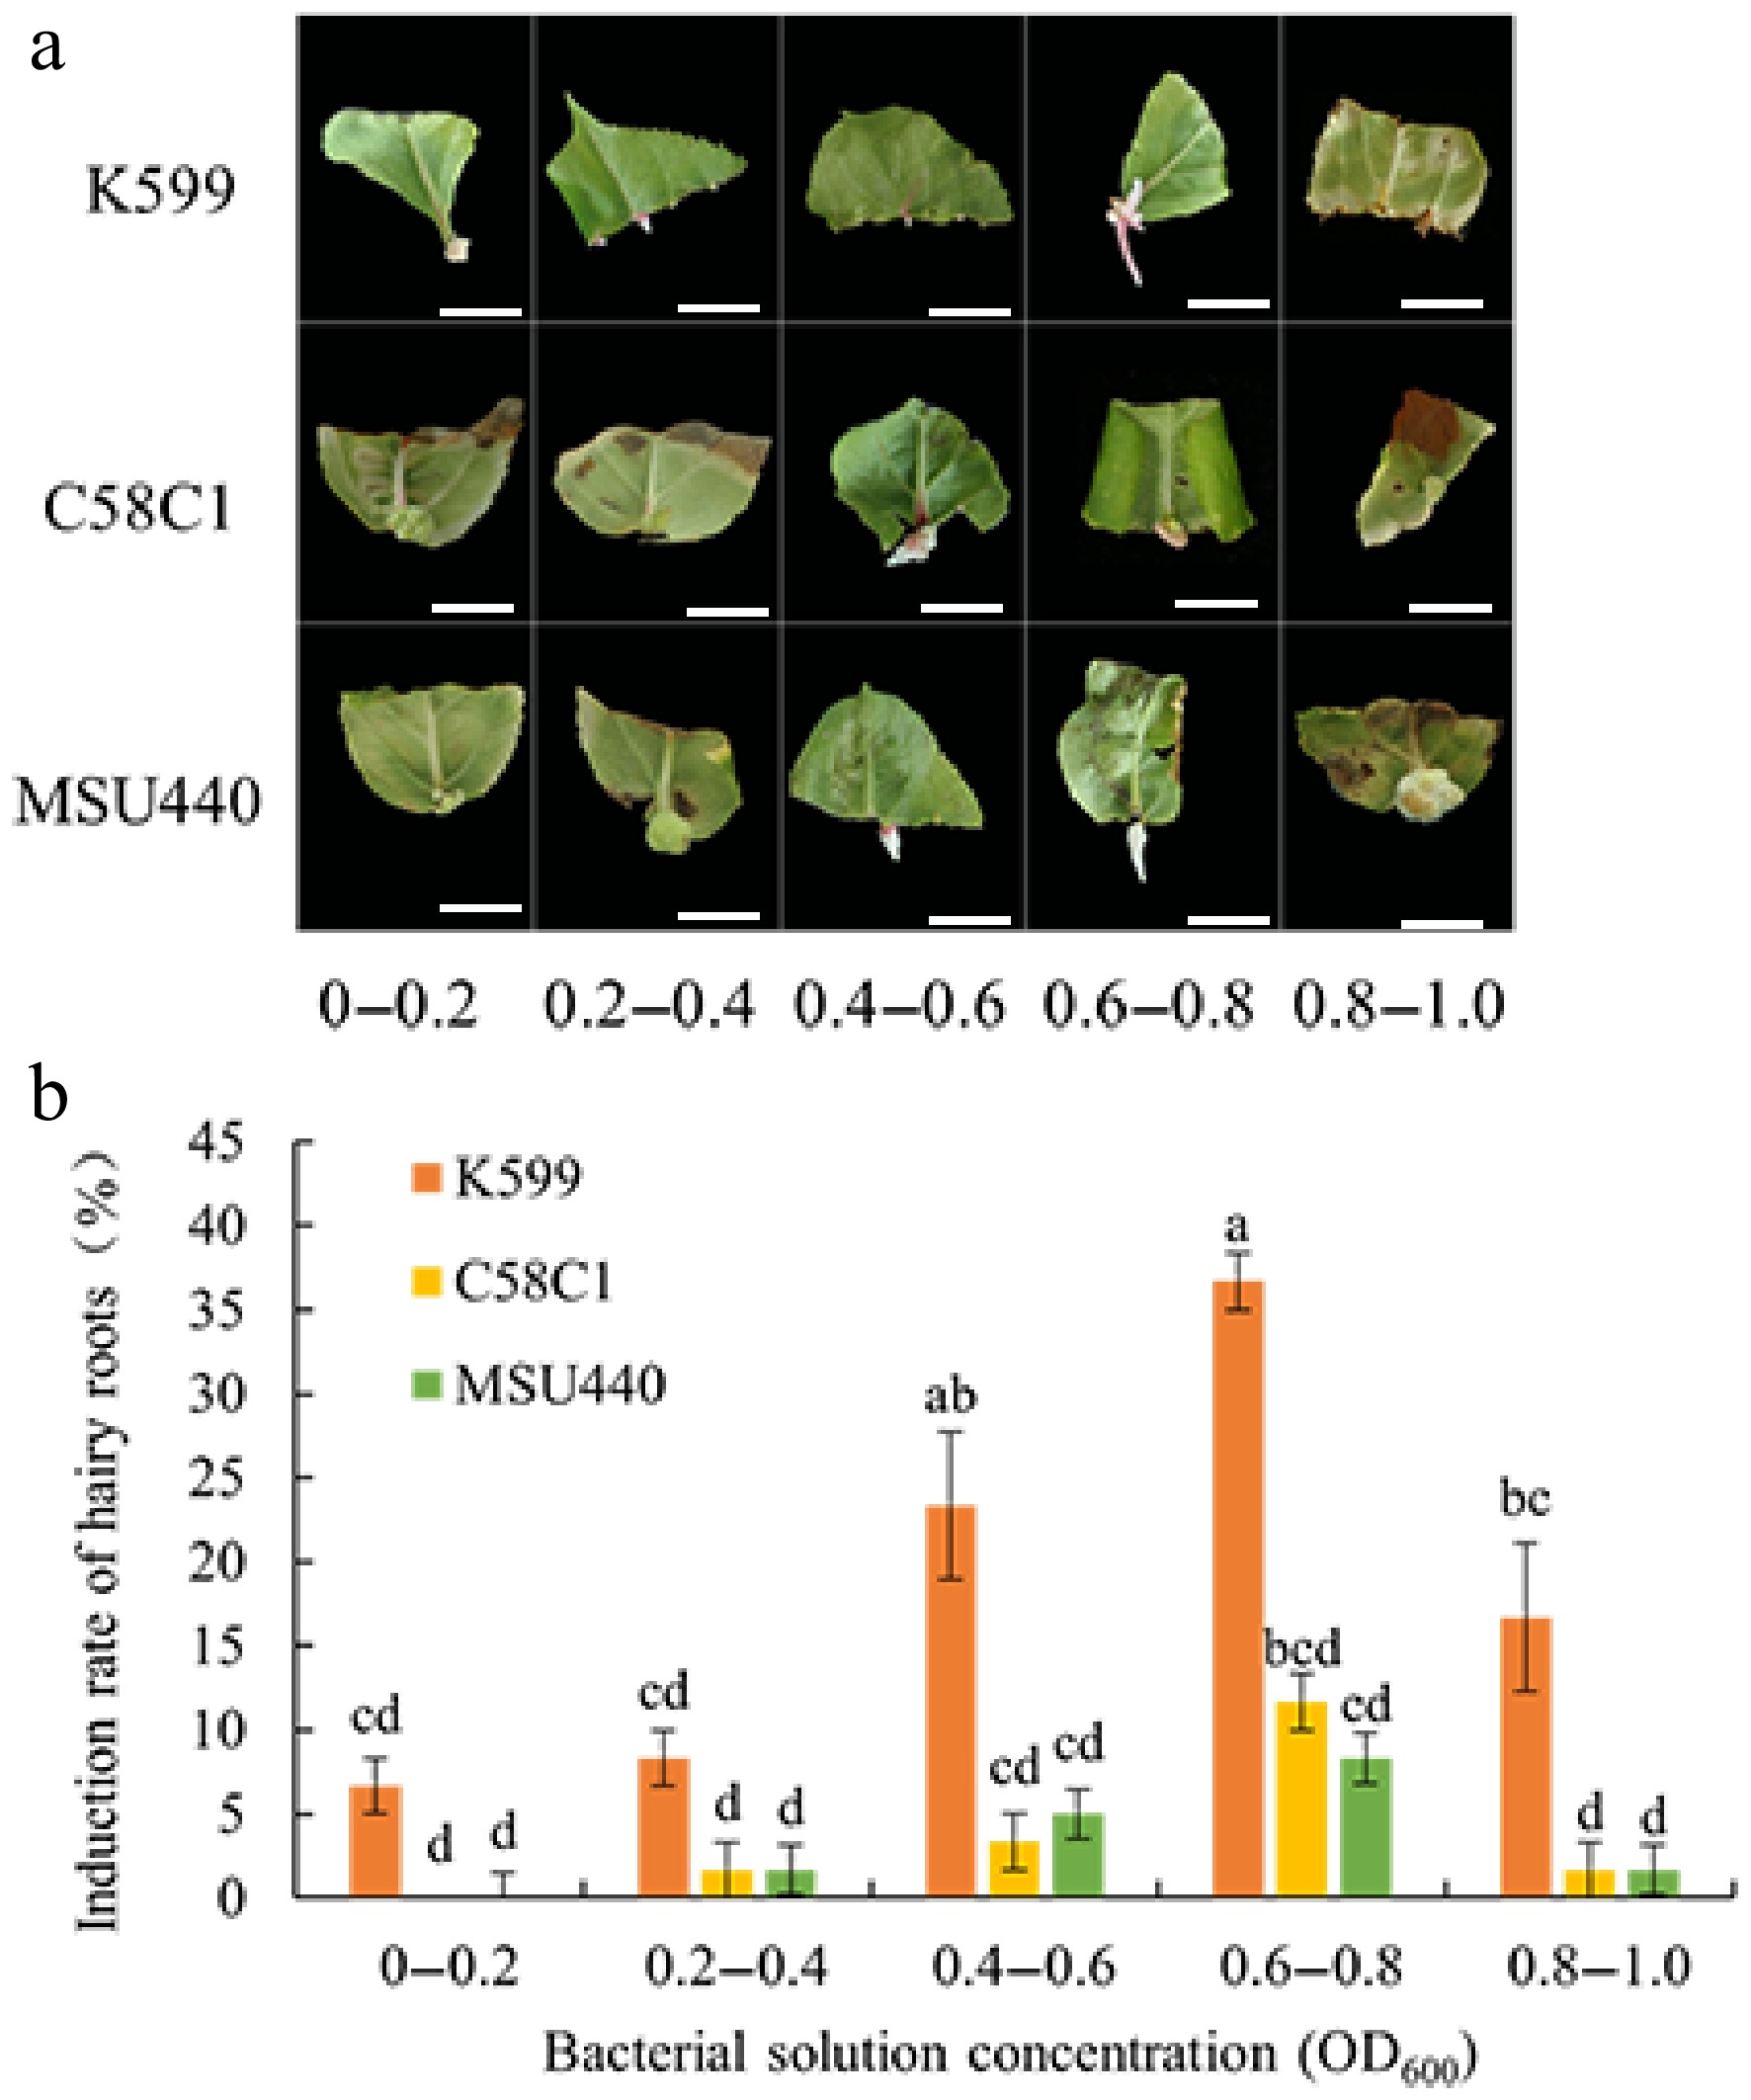
Figure 3.
Effects of A. rhizogenes strain types and bacterial concentrations on hairy root induction in leaves of CX5. (a) Morphological effects of infection concentrations mediated by strains K599, C58C1, and MSU440 on hairy root induction in CX5 leaves. (b) Effects of strain types and bacterial concentrations on hairy root induction efficiency in CX5 Bars represent the mean value ± standard error (SE) (n = 3). Lowercase letters indicate significant differences among treatments (p < 0.05, one-way ANOVA test). Color codes denote explant types: leaf (orange), apical bud (yellow), and stem segment (green). Scale bars, 1 cm.
-
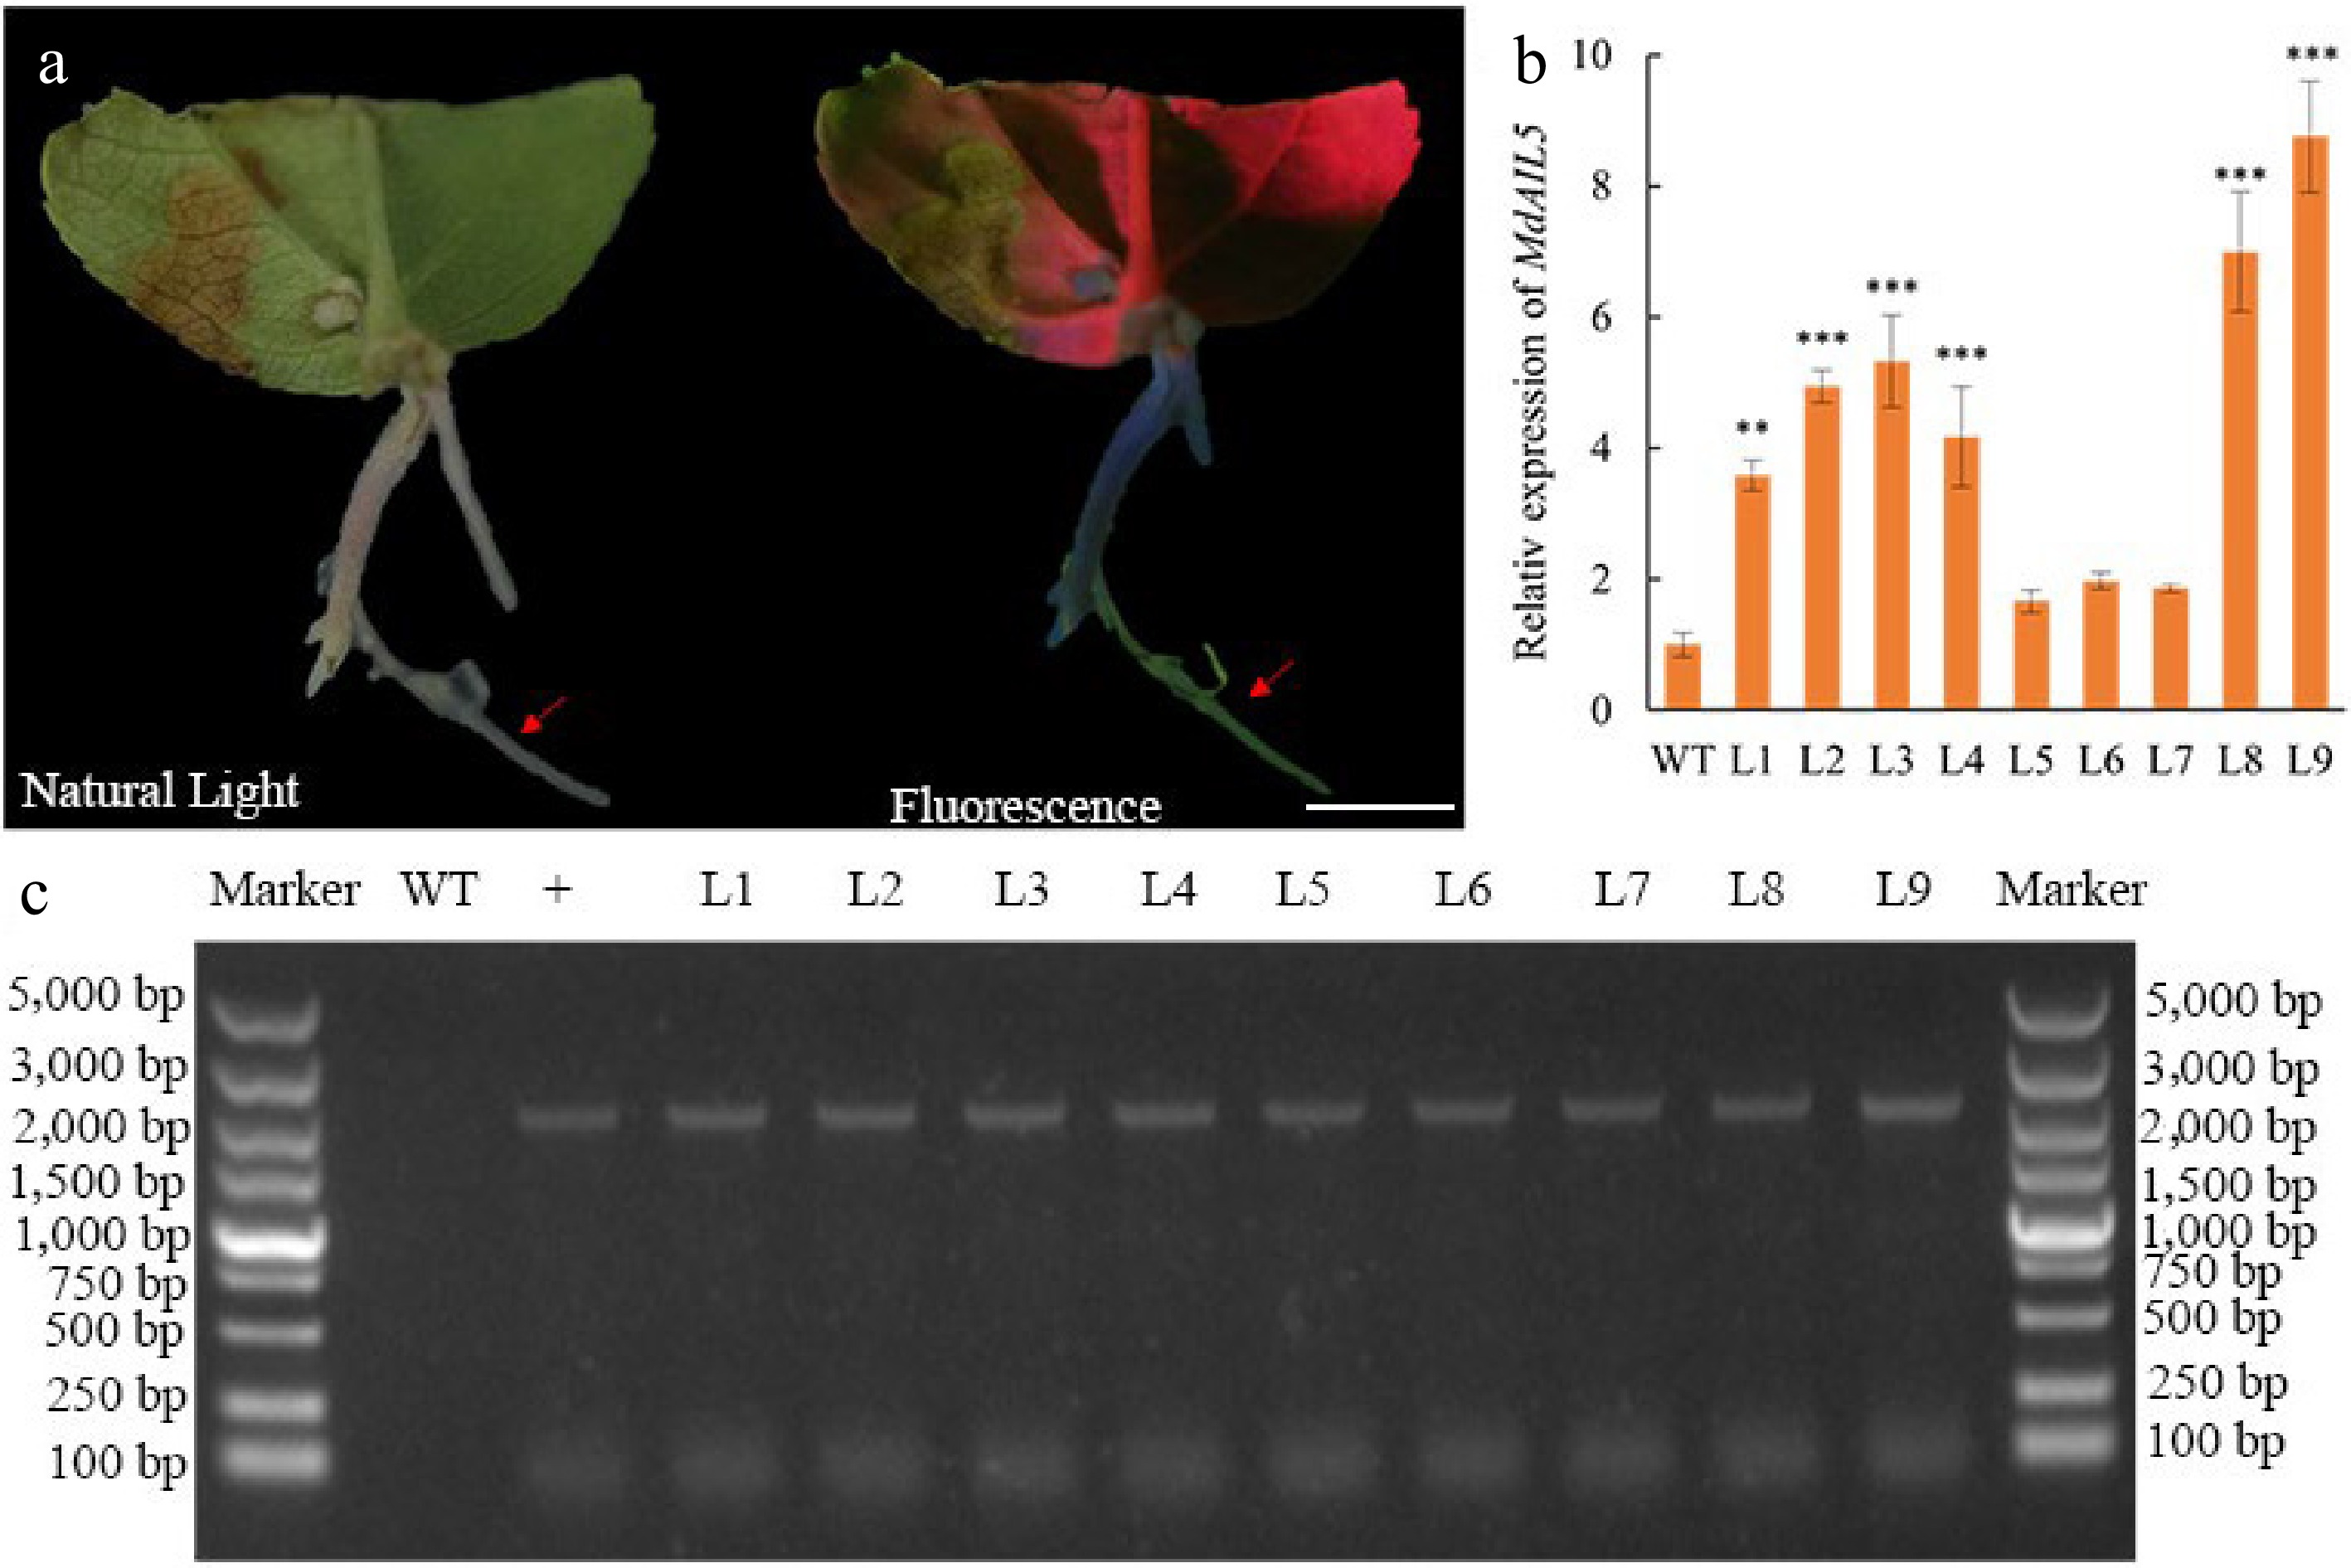
Figure 4.
Identification of MdAIL5 transgenic hairy roots. (a) Fluorescence detection of transgenic hairy roots. (b) Relative expression levels of MdAIL5 transcripts in hairy roots of WT and L1−9 lines based on qRT-PCR. For each sample, transcript levels were normalized with those of MdActin. Relative expression levels for each gene were obtained via the 2−ΔΔCᴛ method. The value of WT-Vector was set to '1'. (c) Identification of MdAIL5 transgenic hairy roots by PCR. WT, wild-type; +, positive control; arrows indicate transgenic hairy roots; L1−L9, transgenic hairy roots; Asterisks indicate significantly different values (*p < 0.05, ** p < 0.01, and *** p < 0.001; two-tailed t-tests). Scale bars, 1 cm.
-
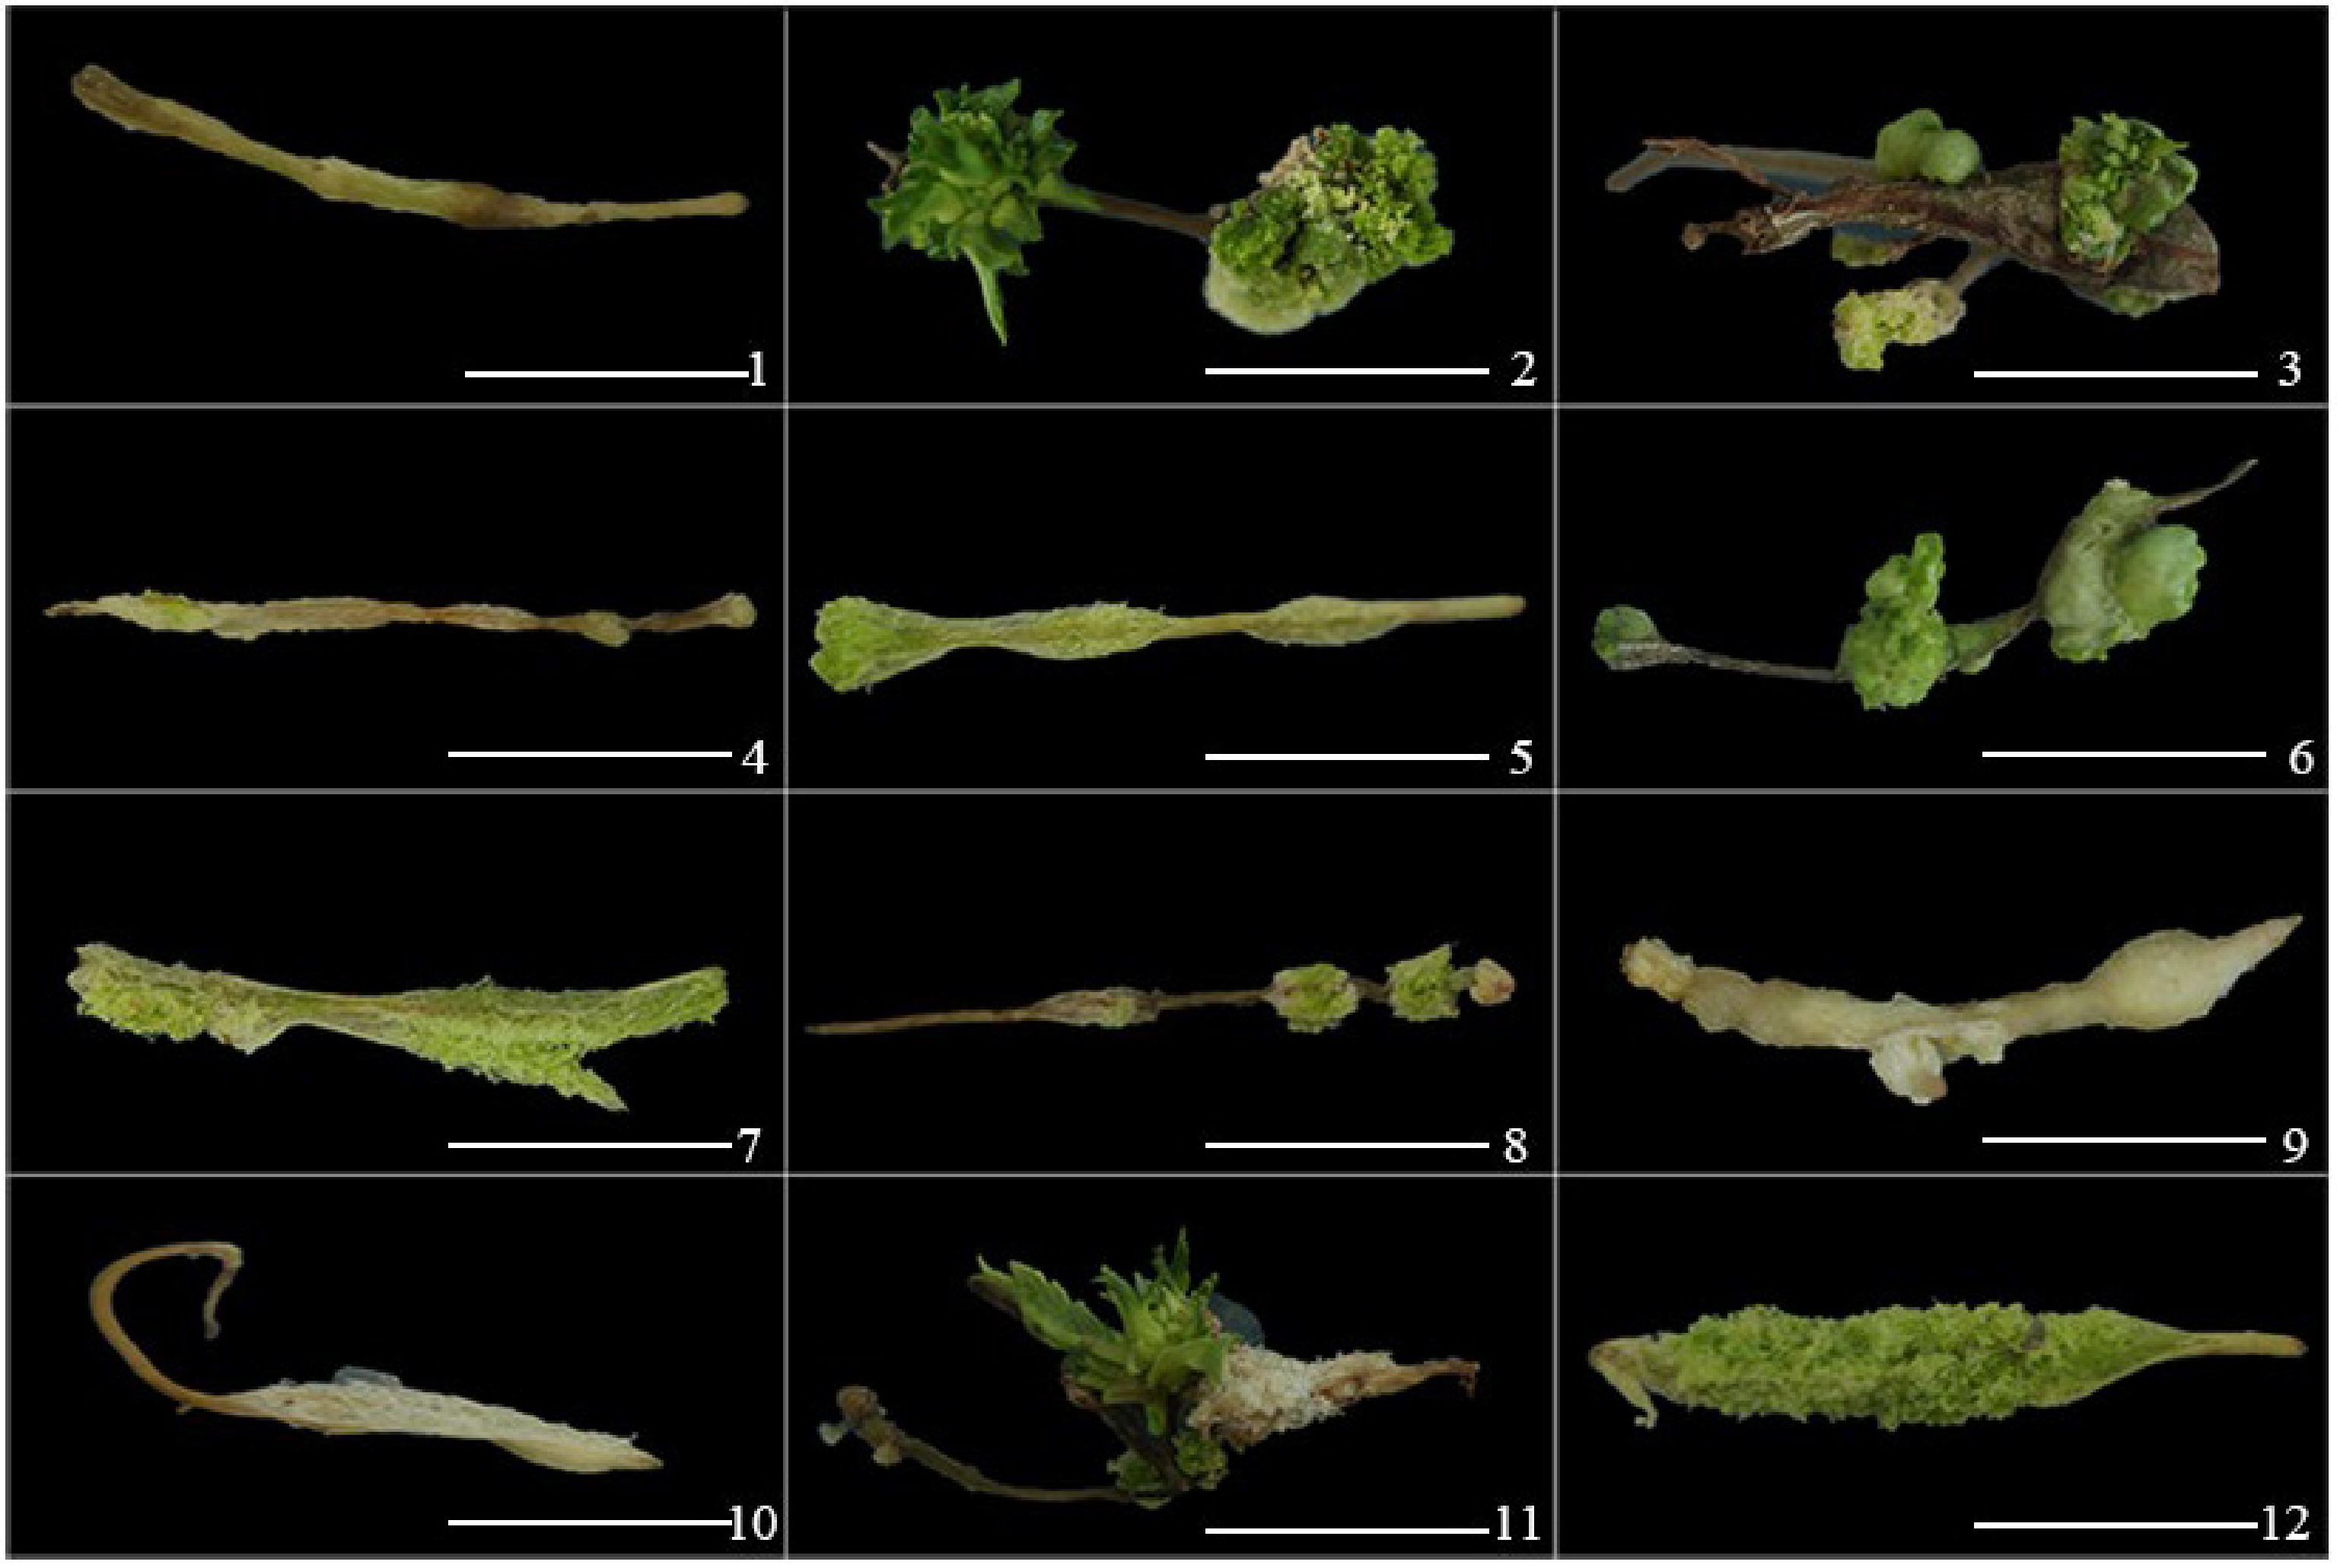
Figure 5.
The effect of different plant hormone ratios on the induction of adventitious buds from hairy roots. The hormone ratios from one to 12 are consistent with Table 9. Scale bars, 1 cm.
-
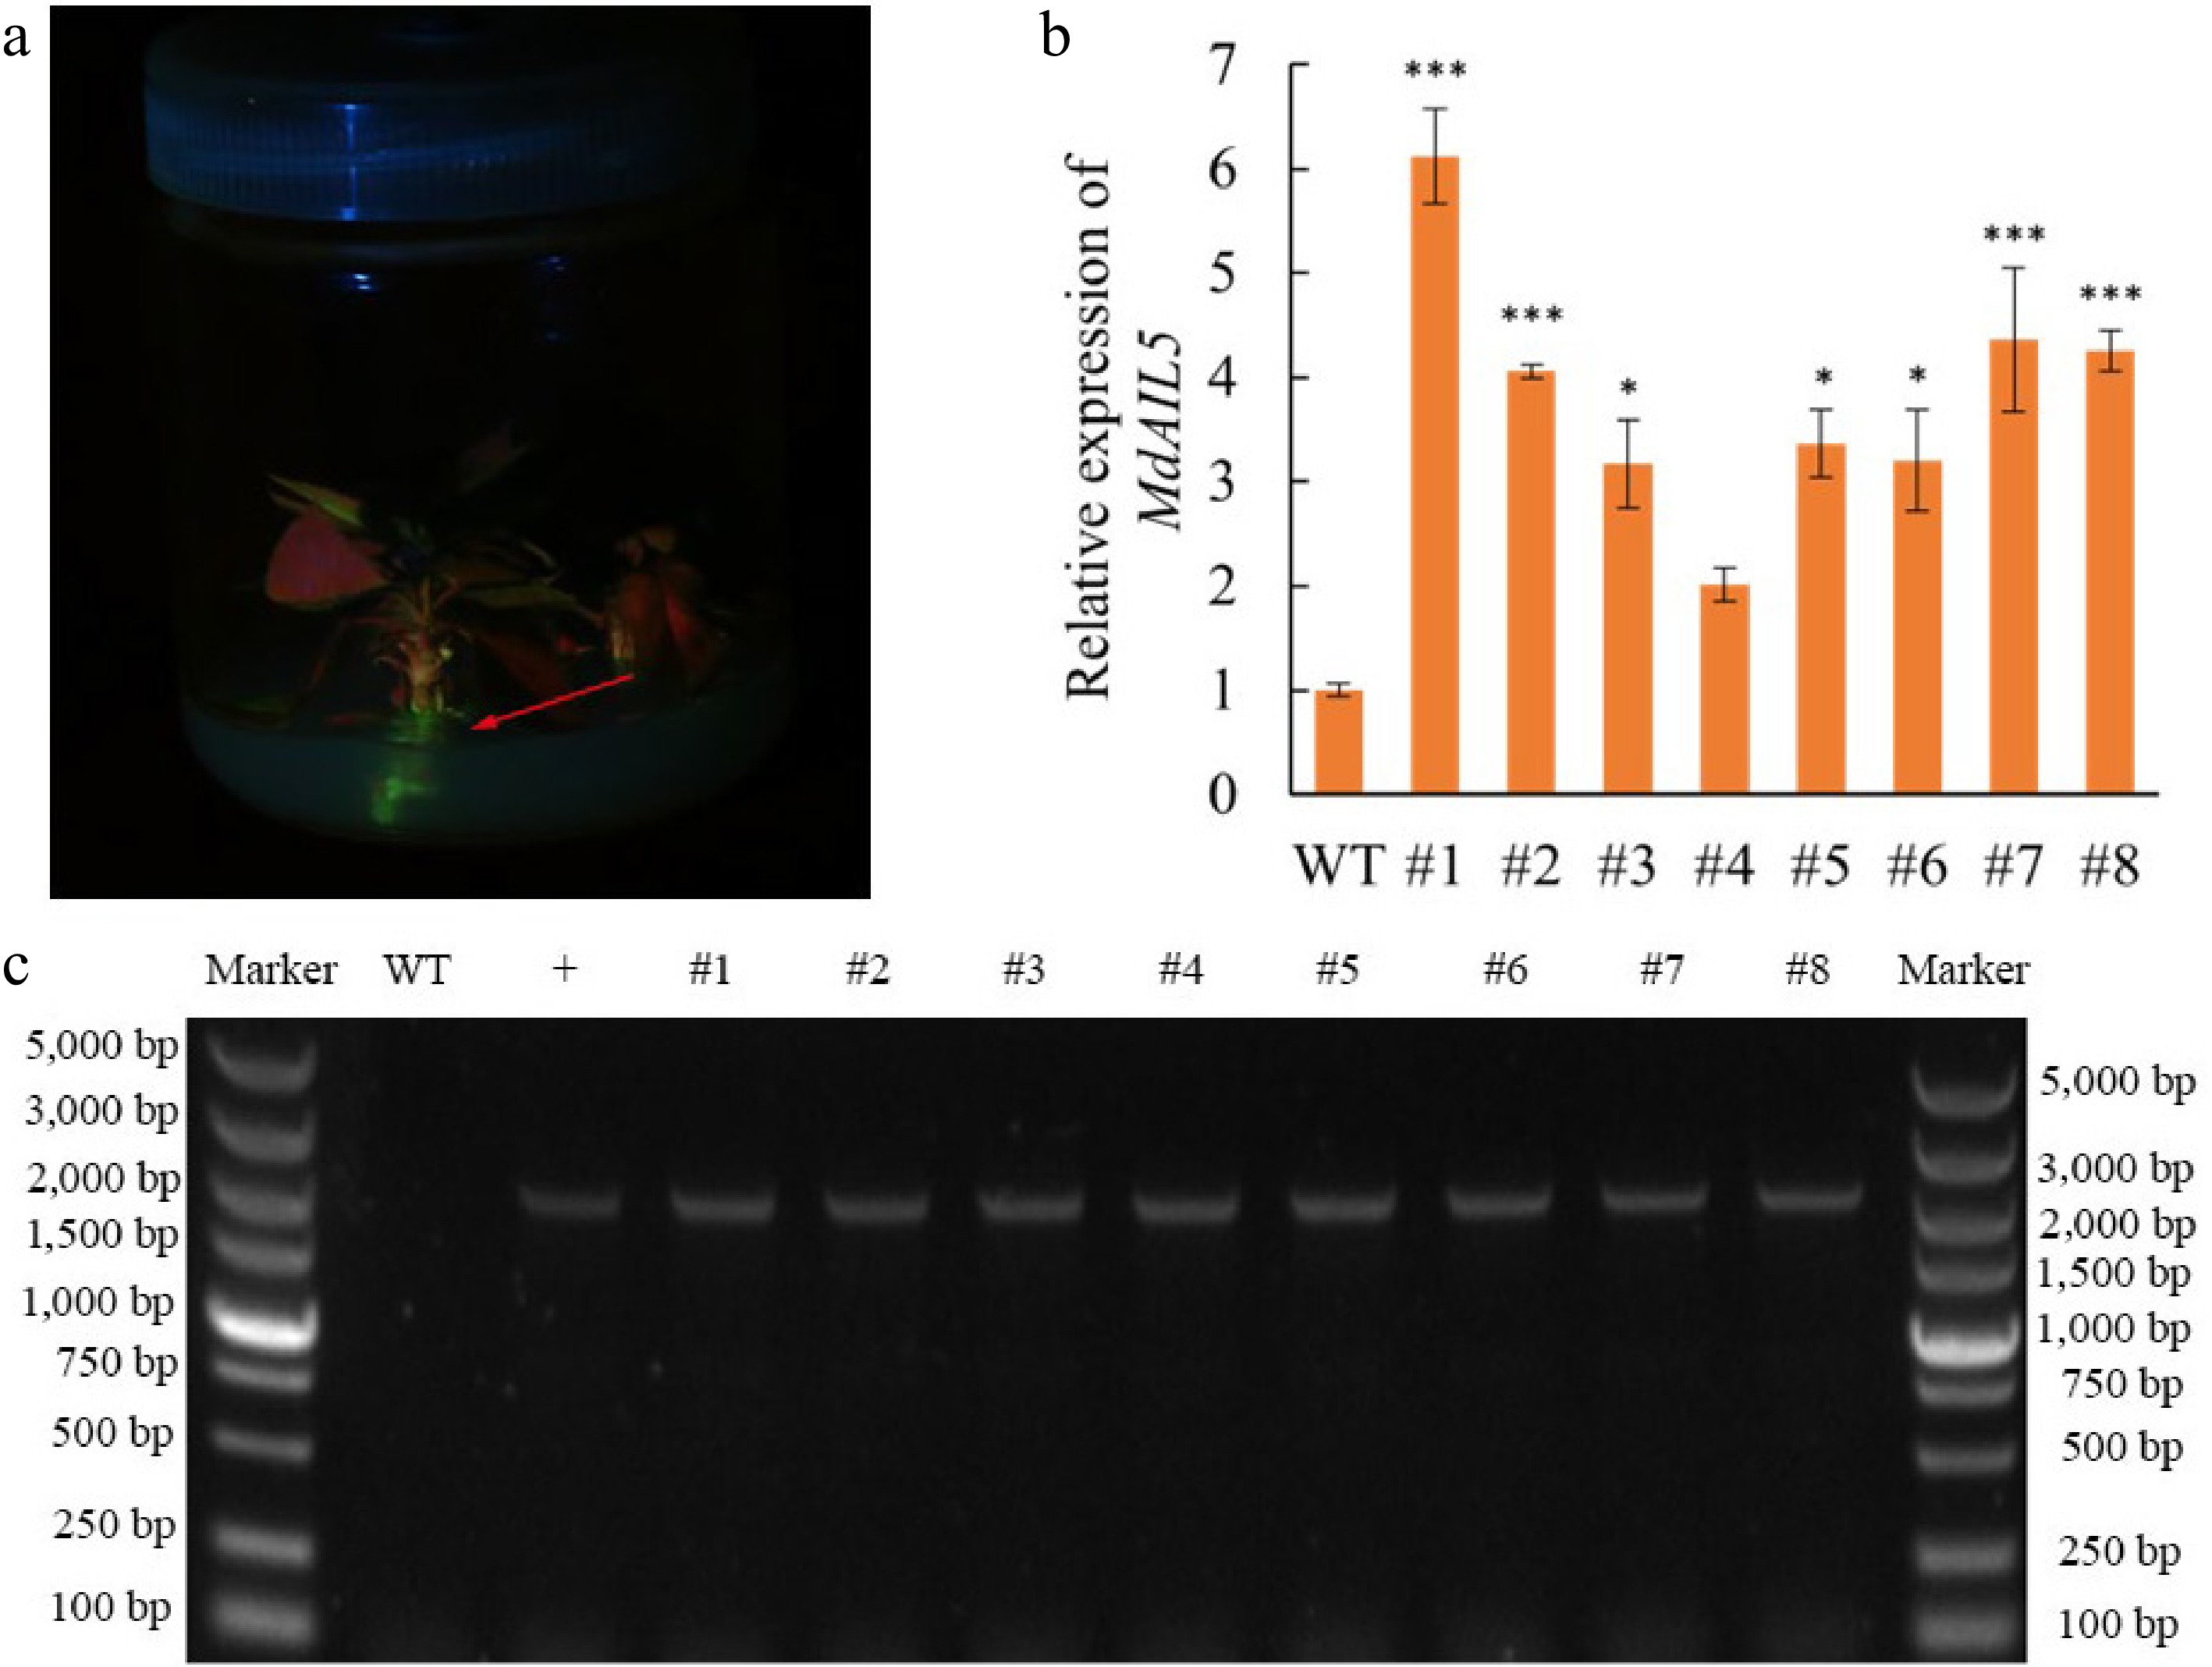
Figure 6.
Identification of transgenic buds. (a) Fluorescence detection of transgenic lines. (b) Relative expression levels of MdAIL5 transcripts in leaves of WT and #1–8 lines based on qRT-PCR. For each sample, transcript levels were normalized with those of MdActin. Relative expression levels for each gene were obtained via the 2−ΔΔCᴛ method. The value of WT-Vector was set to '1'. Asterisks indicate significantly different values (*** p < 0.001, ** p < 0.01, * p < 0.05; two-tailed t-tests). (c) Identification of MdAIL5 transgenic leaves by PCR (WT, wild-type; +, positive control; #1–8 are transgenic lines).
-
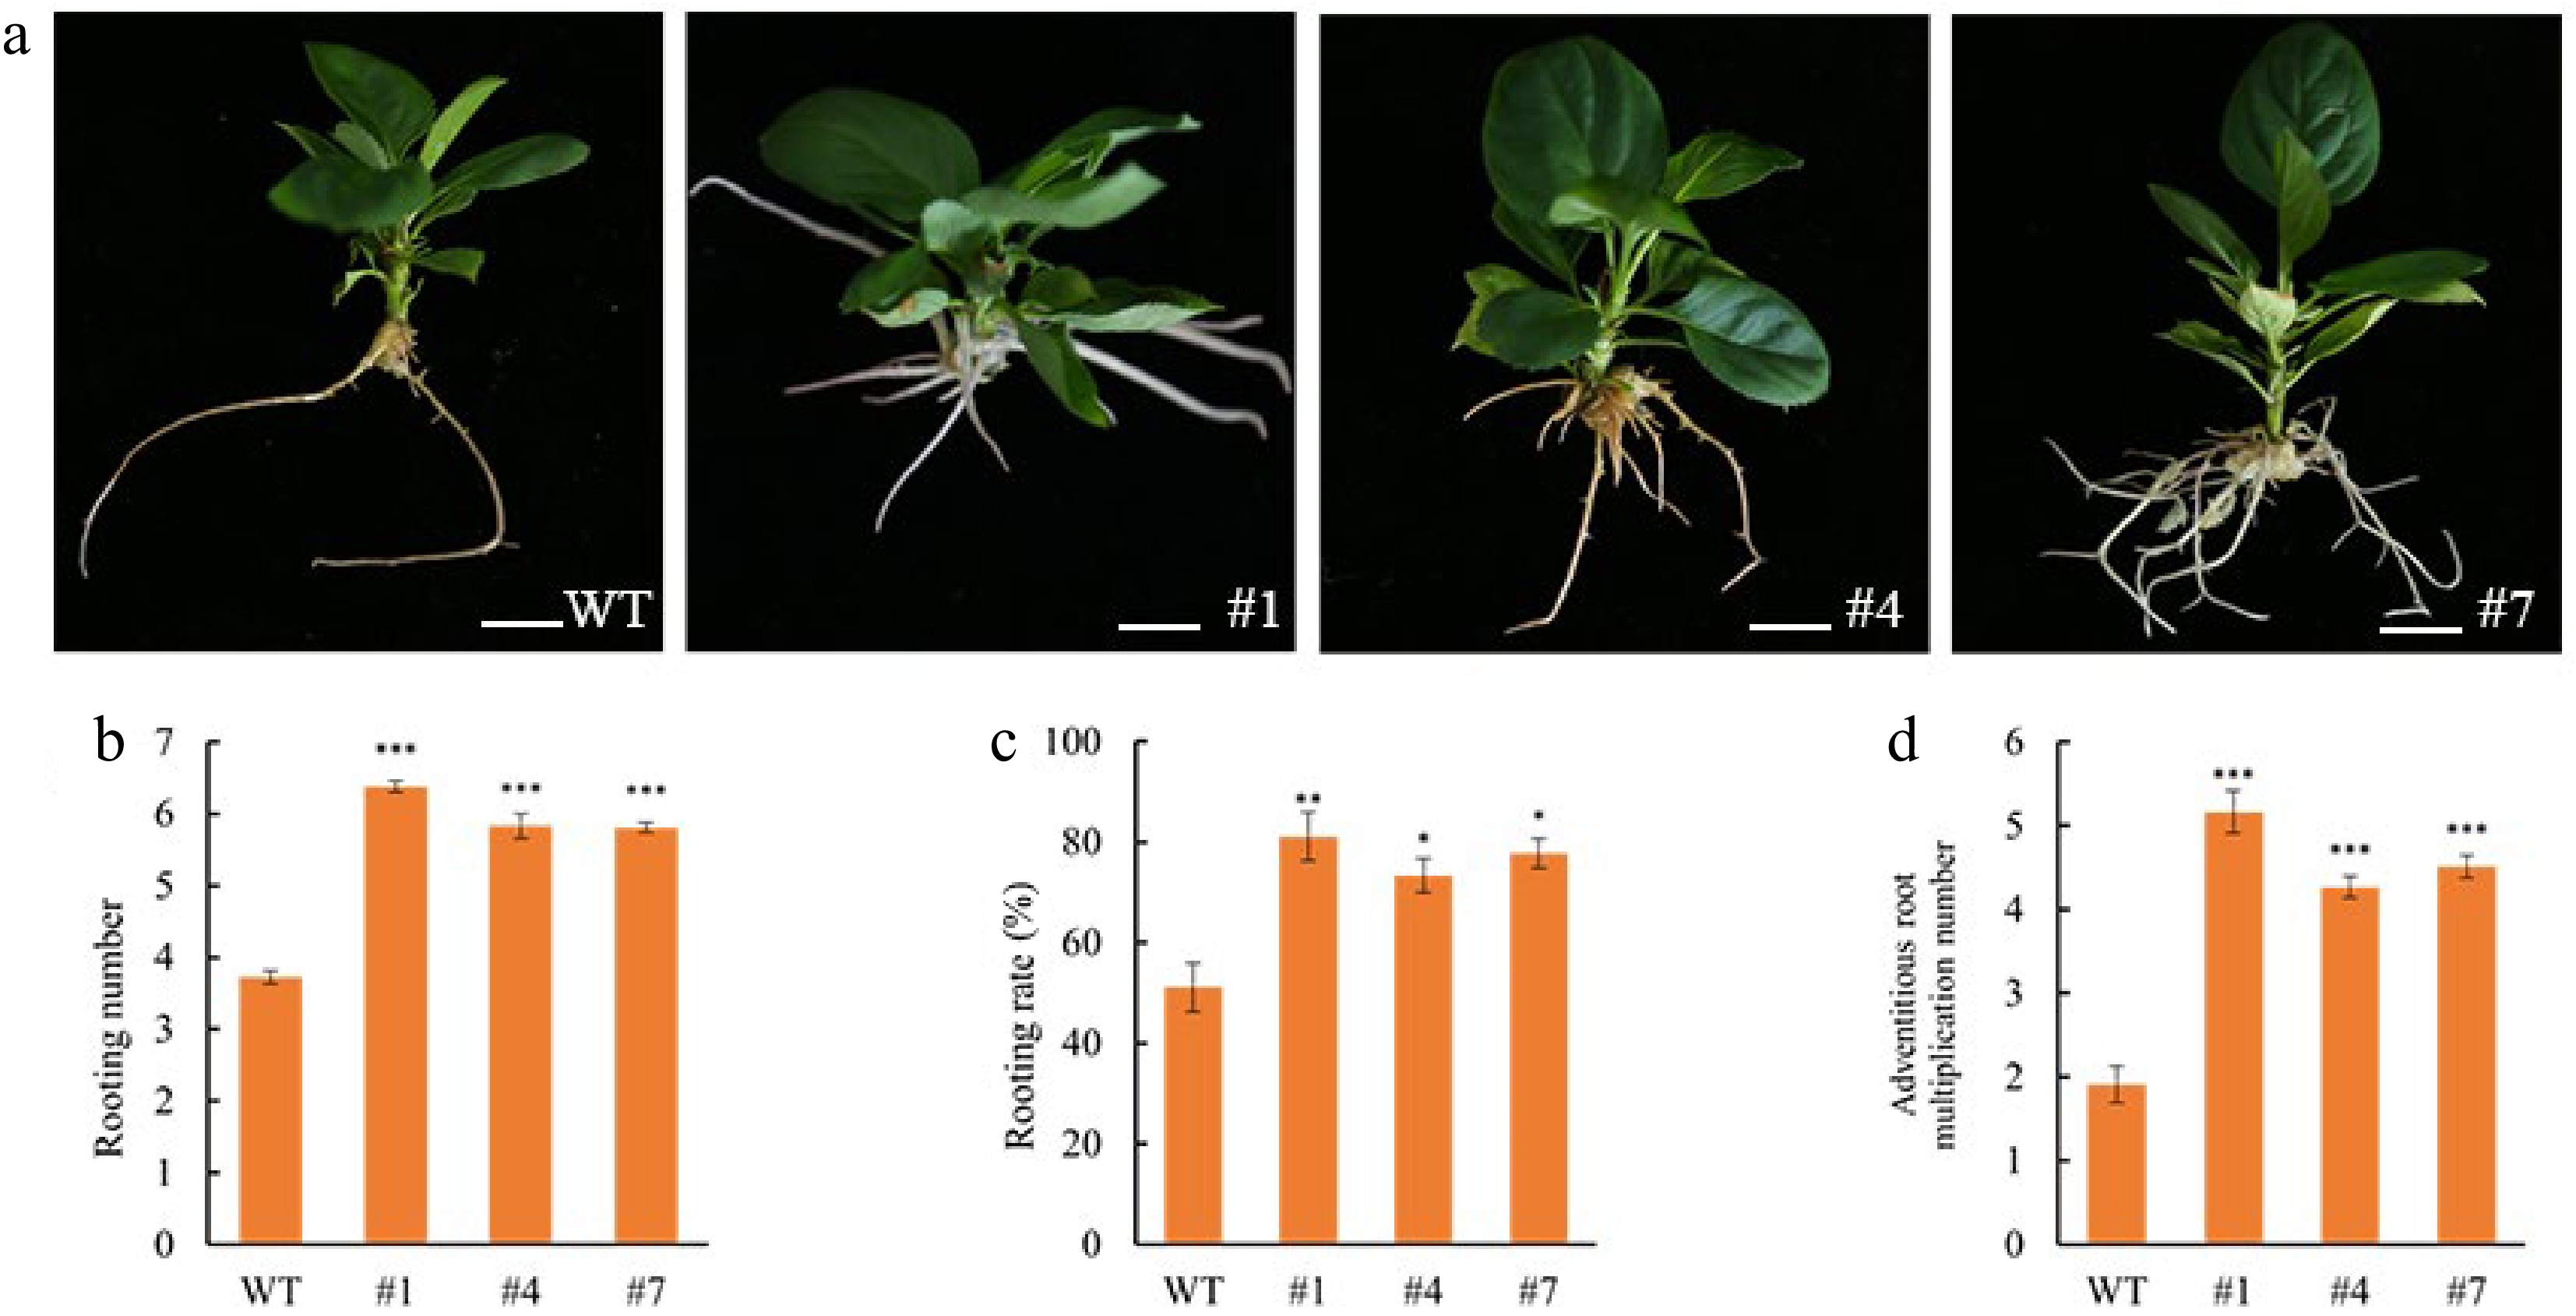
Figure 7.
Effect of MdAIL5 on Rooting of CX5 wild type and transgenic lines #1, #4, #7. (a) Overexpression of MdAIL5 and the rooting of WT apple plants were investigated. (b)–(d) the overexpression of MdAIL5 and the statistics of WT rooting number, rooting rate, and adventitious root proliferation number. The value in the figure represents the standard error of the mean value (n = 3), and the asterisk indicates that the difference is statistically significant. (*** p < 0.001, ** p < 0.01, * p < 0.05 t-test). Scale bars, 1 cm.
-
Primers Primer sequence Purpose MdAIL5-F CCTTGGAACTTTCAGCACCCA qRT-PCR MdAIL5-R TAGCGGCTCATGTCGAAGTT MdAIL5-SalI-PRI101-GFP-F CACTGTTGATACATATGCCCGTCGACATGGATTCTTCTCCTCAGAACTGG Vector construction MdAIL5-SalI-PRI101-GFP-R TCGGATCCGGTACCCCCGGGGTCGACTTCCATCCCAAAAATTGGTGT 35S-F CCTCGGATTCCATTGCC Transgenic identification 35S-R GCTTGGGGCGAAGGATAG MdActin-F TGACCGAATGAGCAAGGAAATTACT qRT-PCR MdActin-R TACTCAGCTTTGGCAATCCACATC Table 1.
Primer list.
-
Reagents Volumetric (μL) RTap 10 DNA 2 Forward primer 1 Reverse primer 1 ddH2O 6 Table 2.
PCR reaction system.
-
Reagents Volumetric 5X PrimeScript RT Master Mix 2 μL Total RNA 500 mg of RNA volume RNase free water Make up to 10 μL Table 3.
Reverse transcription system.
-
Reagents Volumetric (μL) Forward primer 0.4 Reverse primer 0.4 TB Green 10.0 cDNA 1.0 ddH2O 8.2 Table 4.
qRT-PCR reaction system.
-
Explant Time of infection Total number of explants Induction
rate (%)Transformation efficiency (%) Leaf 1 60 6.67 ± 1.67 cd 3.33 ± 1.67 b 5 60 36.67 ± 1.67 a 21.67 ± 4.41 a 10 60 16.67 ± 1.67 b 8.33 ± 1.67 b 15 60 15.00 ± 2.89 bc 6.67 ± 3.33 b 20 60 3.33 ± 1.67 d 1.67 ± 1.67 b Apical bud 1 60 1.67 ± 1.67 d 0 5 60 5.00 ± 2.89 d 3.33 ± 1.67 b 10 60 8.33 ± 1.67 bcd 6.67 ± 1.67b 15 60 1.67 ± 1.67 d 1.67 ± 1.67 b 20 60 0 0 Stem segment 1 60 0 0 5 60 5.00 ± 0 d 3.33 ± 1.67 b 10 60 1.67 ± 1.67 d 1.67 ± 1.67 b 15 60 1.67 ± 1.67 d 0 20 60 0 0 Data in the same column represented by different letters are very significantly different (p < 0.05, one-way ANOVA test). Table 5.
The effect of infection time of explant types on the induction rate of hairy roots.
-
Subculture duration (d) Total number of explants Induction rate
(%)Transformation efficiency (%) 30 60 16.67 ± 4.41 b 8.33 ± 1.67 b 40 60 38.33 ± 1.67 a 18.33 ± 1.67 a 50 60 21.67 ± 4.41 b 11.67 ± 1.67 b Different lowercase letters indicate significant differences (ANOVA Duncan test, p < 0.05). Table 6.
Effects of subculture duration on hairy root induction in CX5.
-
Strain type OD600 Total number of explants Induction rate
(%)Transformation efficiency (%) K599 0−0.2 60 6.67 ± 1.67 cd 3.33 ± 1.67 c 0.2−0.4 60 8.33 ± 1.67 cd 5.00 ± 2.89 c 0.4−0.6 60 23.33 ± 4.41 ab 16.67 ± 3.33 ab 0.6−0.8 60 36.67 ± 1.67 a 25.00 ± 2.89 a 0.8−1.0 60 16.67 ± 4.41 bc 8.33 ± 3.33 bc C58C1 0−0.2 60 0 0 0.2−0.4 60 1.67 ± 1.67 d 1.67 ± 1.67 c 0.4−0.6 60 3.33 ± 1.67 cd 1.67 ± 1.67 c 0.6−0.8 60 11.67 ± 1.67 bcd 6.67 ± 1.67 bc 0.8−1.0 60 1.67 ± 1.67 d 1.67 ± 1.67 c MSU440 0−0.2 60 0 0 0.2−0.4 60 1.67 ± 1.67 d 1.67 ± 1.67 c 0.4−0.6 60 5.00 ± 2.89 cd 3.33 ± 1.67 c 0.6−0.8 60 8.33 ± 1.67 cd 5.00 ±0 c 0.8−1.0 60 1.67 ± 1.67 d 1.67 ± 1.67 c Data in the same column represented by different letters are very significantly different (p < 0.05, one-way ANOVA test). Table 7.
Effects of A. rhizogenes strain types and bacterial concentration on hairy roots induction efficiency in CX5.
-
Total number of explants Induction
rate (%)Average (%) Transformation efficiency (%) Average (%) 30 36.67 42.22 ± 2.94 23.33 28.89 ± 2.94 30 46.67 30.00 30 43.33 33.33 Table 8.
Hairy root induction efficiency in CX5 under optimized transformation conditions.
-
Number TDZ
(mg·L−1)6-BA
(mg·L−1)IAA
(mg·L−1)Total number
of explantsCallus induction
rate (%)Germination
rate (%)Positivity
rate (%)1 0.5 0 0.1 90 73.33 ± 1.92 ab 0 0 2 1.0 0 0.1 90 85.56 ± 1.11 a 4.44 ± 1.11 a 3.33 ± 0 a 3 1.5 0 0.1 90 71.11 ± 2.22 bc 1.11 ± 1.11 ab 1.11 ± 1.11 b 4 0.5 0 0.2 90 57.78 ± 2.94 c 0 0 5 1.0 0 0.2 90 63.33 ± 3.33 bc 0 0 6 1.5 0 0.2 90 71.11 ± 4.01 bc 1.11 ± 1.11 ab 1.11 ± 1.11 b 7 0 1 0.1 90 84.44 ± 2.94 abc 0 0 8 0 2 0.1 90 87.78 ± 1.11 ab 1.11 ± 1.11 ab 1.11 ± 1.11 ab 9 0 3 0.1 90 77.78 ± 2.94 c 0 0 10 0 1 0.2 90 81.11 ± 1.11 bc 0 0 11 0 2 0.2 90 88.89 ± 2.22 a 2.22 ± 1.11 a 2.22 ± 1.11 a 12 0 3 0.2 90 82.22 ± 2.22 abc 0 0 Different lowercase letters indicate significant differences (ANOVA Duncan test, p < 0.05). Table 9.
Effects of different hormone ratios on the differentiation of hairy roots into buds.
Figures
(7)
Tables
(9)