-
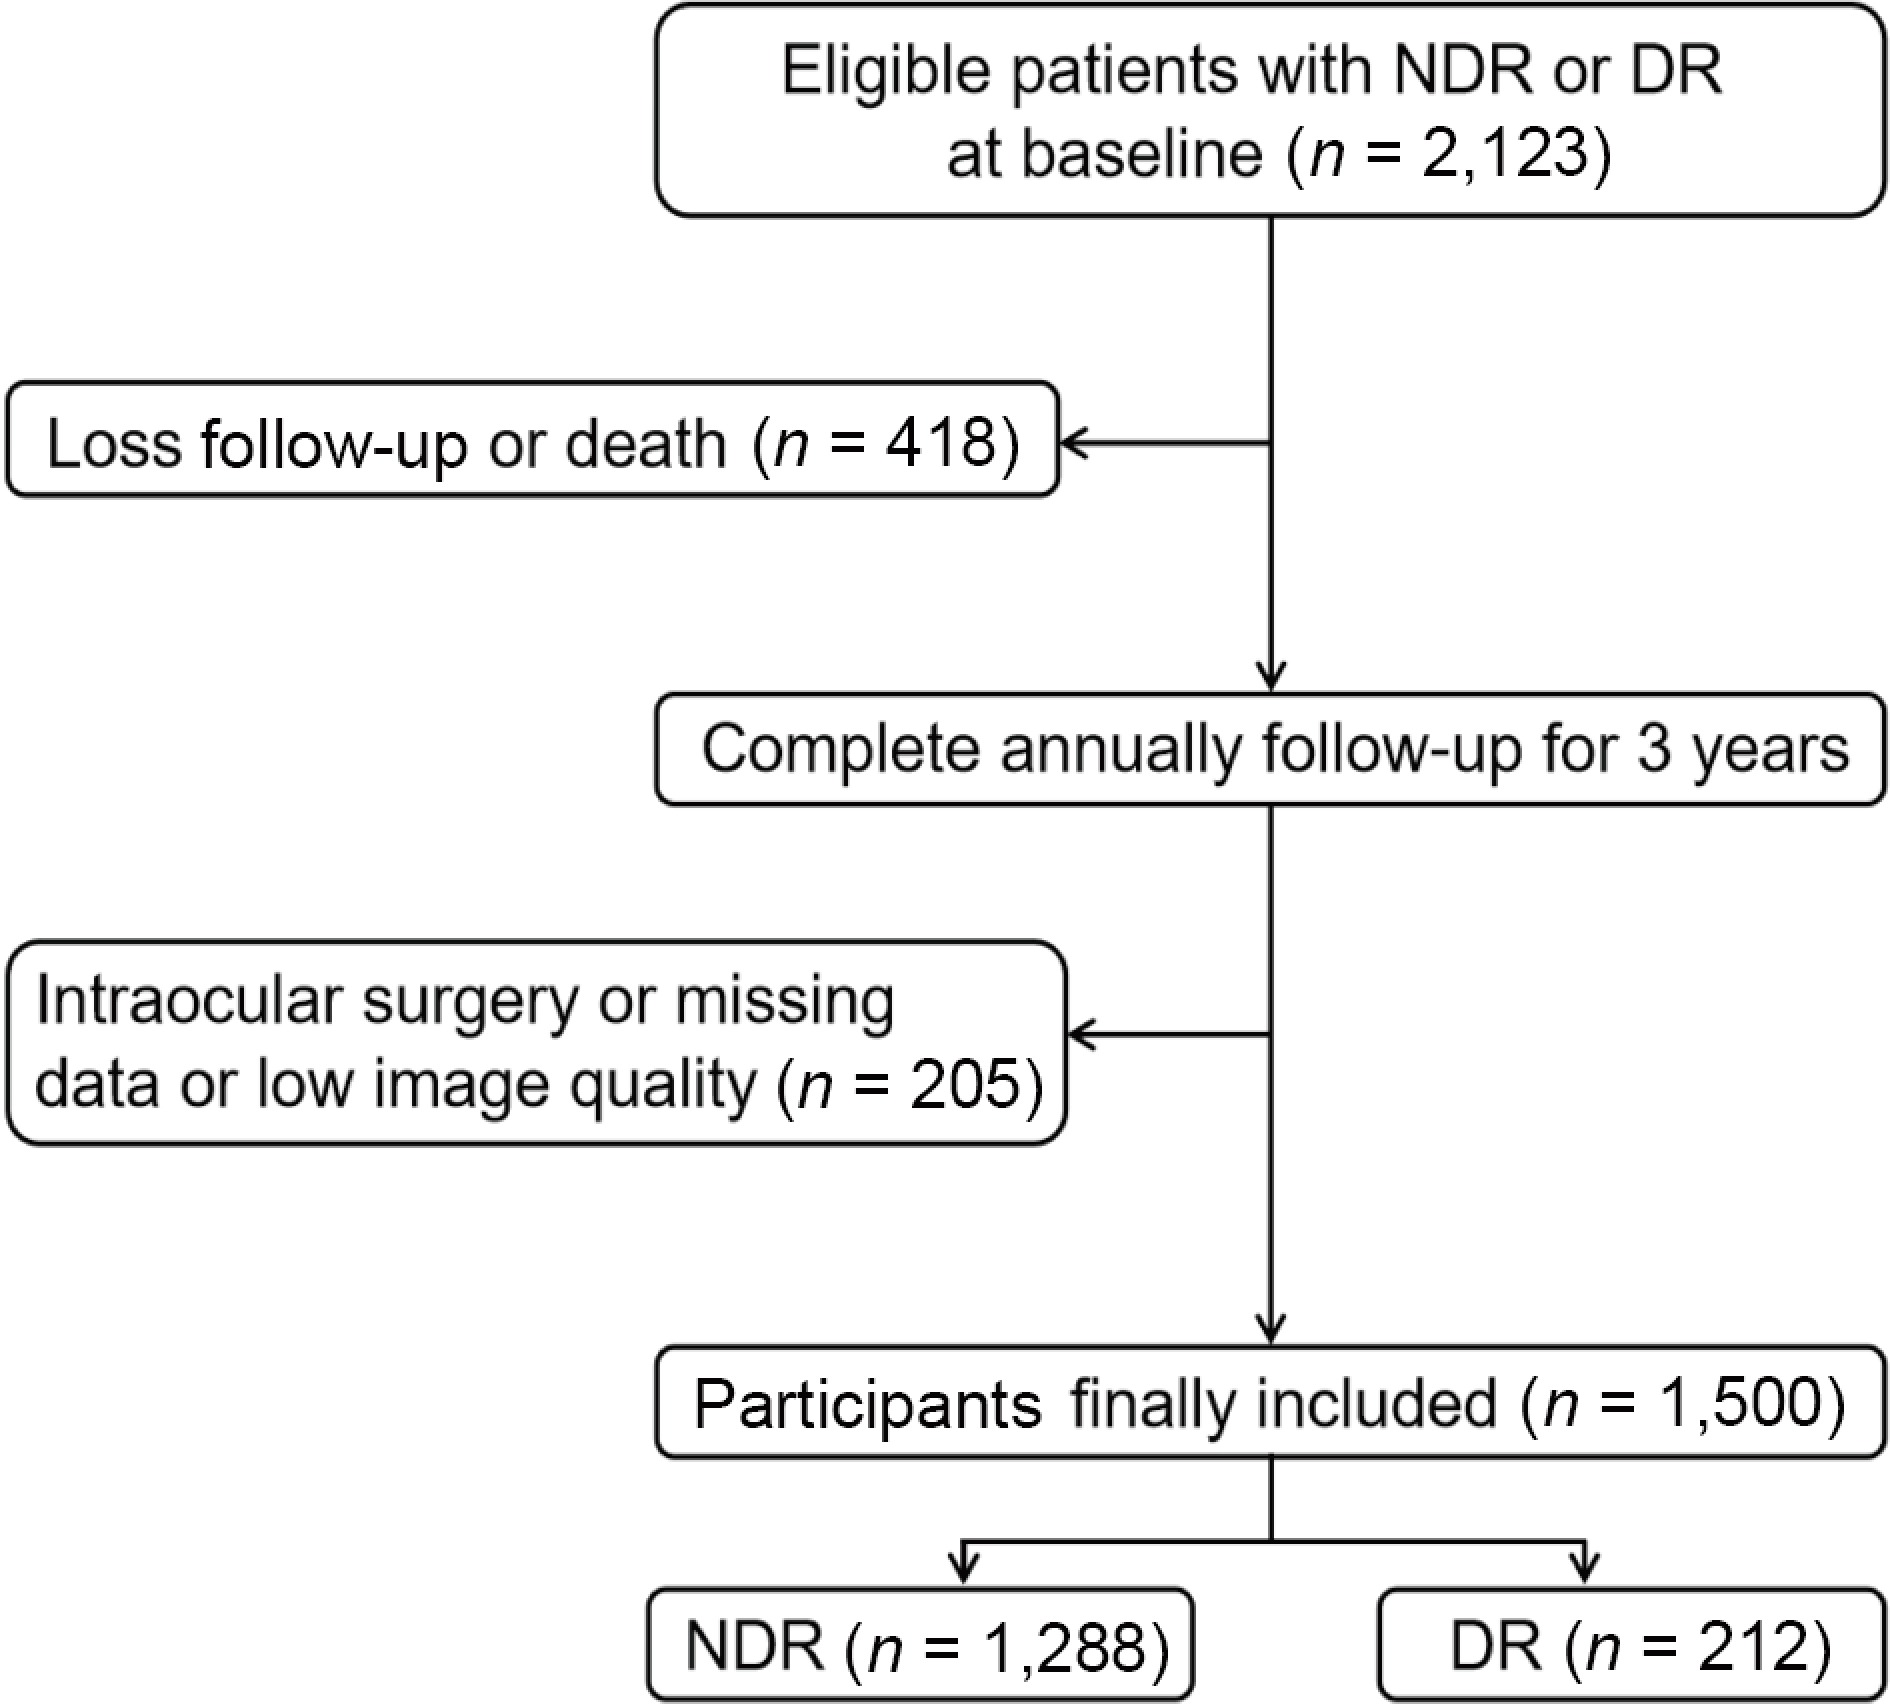
Figure 1.
Overall workflow of the cohort study. NDR, diabetic patients without retinopathy; DR, diabetic retinopathy patients.
-
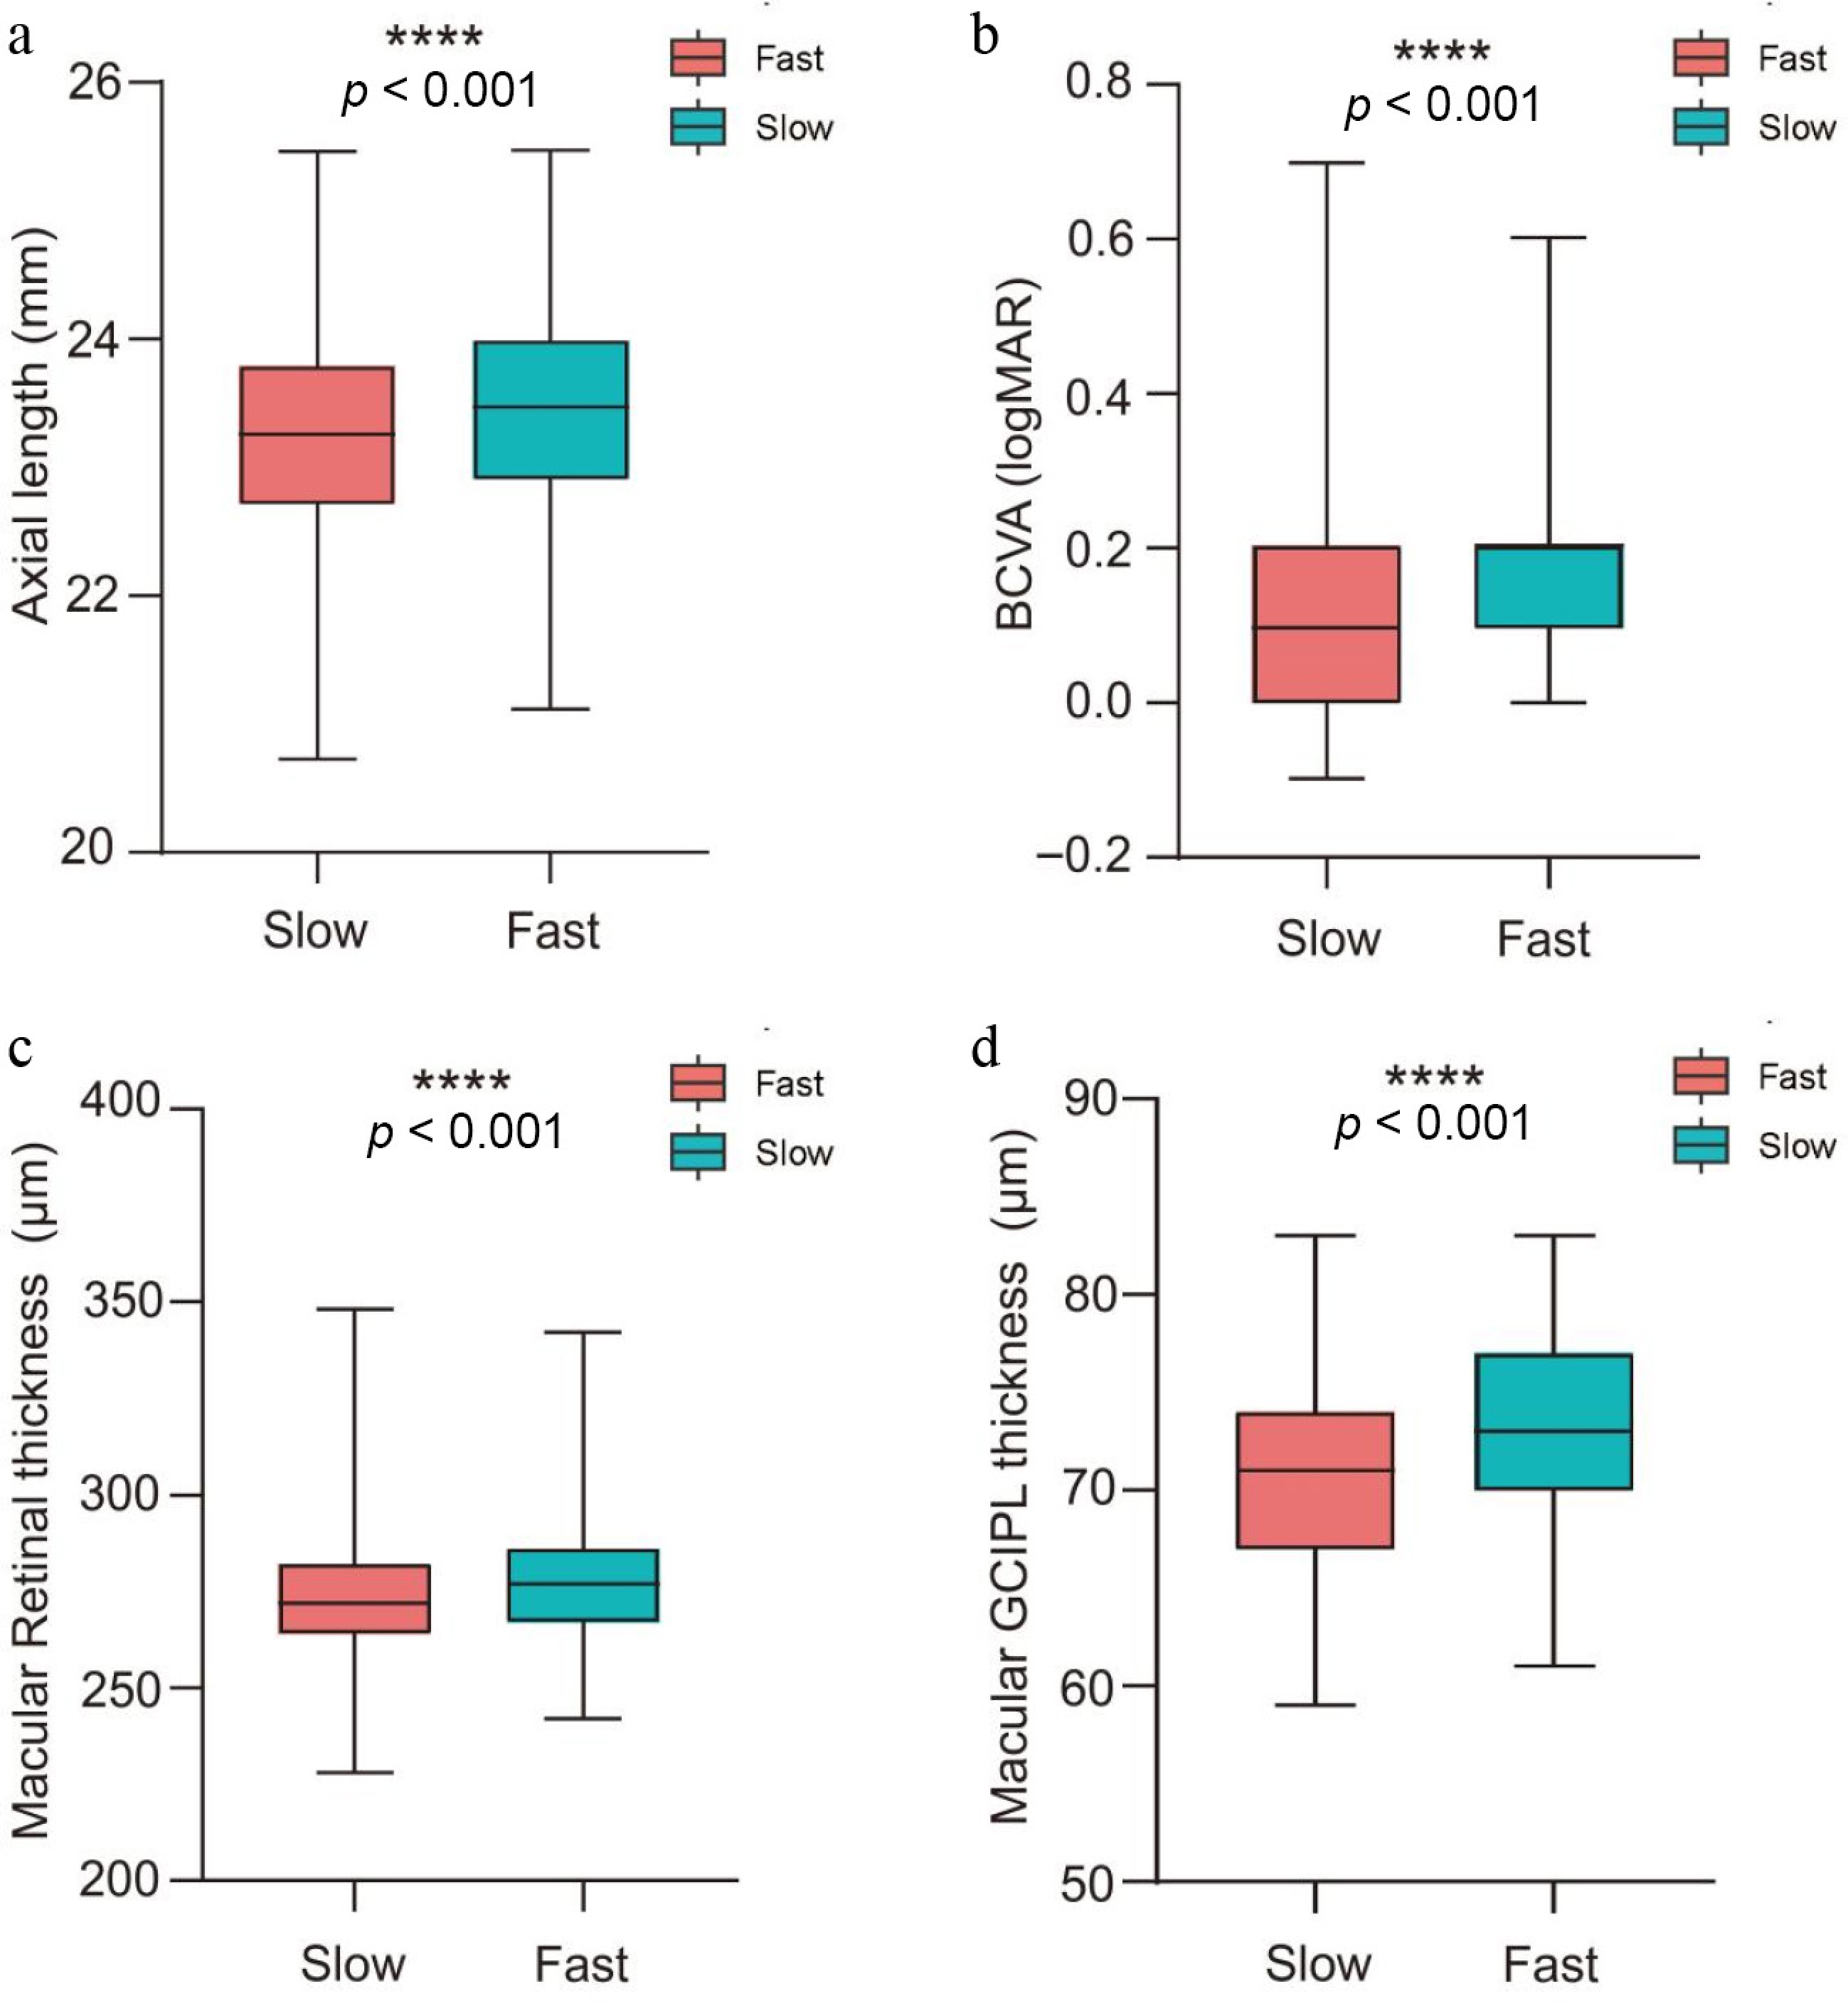
Figure 2.
The box plot of the changes in macular ganglion cell layer–inner plexiform layer thickness over time with (a) axial length, (b) BCVA, (c) macular retinal thickness, and (d) macular GCIPL thickness. The Fast group included eyes whose rate of GCIPL thinning was greater than or equal to –1 μm/year; the Slow group included eyes with a rate slower than −1 μm/year. BCVA, best corrected visual acuity; logMAR, logarithm of the minimal angle of resolution; GCIPL, ganglion cell–inner plexiform layer.
-
Characteristic Included
(n = 1,500)Excluded
(n = 623)p-value Age (year) 64.83 (7.35) 64.19 (8.19) 0.069 Female (%) 858 (57.20%) 359 (57.72%) 0.826 Body mass index (kg/m2) 24.65 (9.54) 24.81 (3.62) 0.014 Duration of diabetes (y) 8.93 (6.86) 8.46 (6.99) 0.080 Diabetic retinopathy (%) 212 (14.13%) 126 (20.26%) < 0.001 HbA1c (%) 7.03 (1.38) 7.26 (1.64) 0.015 Systolic blood pressure (mmHg) 133.44 (18.56) 134.64 (18.96) 0.116 Eye examination Axial length (mm) 23.37 (0.83) 23.37 (0.80) 0.859 Spherical 1.05 (1.63) 1.01 (1.30) 0.131 Intraocular pressure (mmHg) 15.77 (2.22) 15.86 (2.41) 0.439 BCVA (logMAR) 0.16 (0.13) 0.19 (0.15) < 0.001 Macular retinal thickness (μm) 246.82 (77.96) 255.10 (68.26) 0.283 Macular GCIPL thickness (μm) 71.64 (5.27) 72.41 (7.42) 0.008 Macular choroidal thickness (μm) 189.93 (73.34) 192.34 (75.16) 0.448 Disc area (mm2) 2.10 (0.40) 2.08 (0.42) 0.605 RNFL thickness (μm) 110.79 (13.97) 111.50 (14.25) 0.153 Blood lipids Total cholesterol (mmol/L) 4.86 (1.07) 4.87 (1.09) 0.928 Triglycerides (mmol/L) 2.32 (1.67) 2.54 (1.94) 0.019 HDL-c (mmol/L) 1.30 (0.40) 1.25 (0.38) 0.004 LDL-c (mmol/L) 3.05 (0.94) 3.07 (0.94) 0.851 Renal function eGFR (mL/min/1.73 m2) 99.07 (18.44) 98.71 (20.59) 0.729 Serum creatinine (mg/L) 71.57 (20.56) 72.98 (25.39) 0.790 Serum uric acid (μmol/L) 370.09 (100.41) 370.16 (101.91) 0.032 Microalbuminuria (mg/mL) 4.44 (25.42) 8.35 (48.98) < 0.001 HbA1c, glycosylated hemoglobin; BCVA, best corrected visual acuity; logMAR, logarithm of the minimal angle of resolution; GCIPL, ganglion cell–inner plexiform layer; RNFL, retinal nerve fiber layer; HDL-c, high-density lipoprotein cholesterol; LDL-c, low-density lipoprotein cholesterol; eGFR, estimated glomerular filtration rate. Data are presented as the mean and standard deviation, or counts and percentages. Data in bold indicate statistically significant differences (p < 0.05). Table 1.
Baseline characteristics of included and excluded participants.
-
Variable Univariate model β (95% CI) †p-value Age, per 10-year increase 0.004 (−0.089, 0.098) 0.923 Male versus female −0.078 (−0.217, 0.061) 0.269 Body mass index, per 1-SD increase −0.007 (−0.076, 0.062) 0.848 Duration of diabetes, per 1-year increase −0.004 (−0.014, 0.007) 0.463 Systolic blood pressure, per 1-SD increase −0.047 (−0.116, 0.021) 0.177 Eye examination, per 1-SD increase Axial length −0.176 (−0.244, -0.108) < 0.001 Spherical 0.068 (−0.001, 0.136) 0.054 Intraocular pressure −0.091 (−0.159, –0.022) 0.010 BCVA (logMAR) −0.202 (−0.270, –0.133) < 0.001 Macular retinal thickness −0.231 (−0.298, –0.163) < 0.001 Macular GCIPL thickness −0.343 (−0.410, –0.277) < 0.001 Macular choroidal thickness 0.005 (−0.064, 0.074) 0.889 Disc area 0.079 (−0.079, 0.163) 0.067 RNFL thickness −0.005 (−0.075, 0.064) 0.880 HbA1c, per 1-SD increase Baseline 0.029 (−0.039, 0.098) 0.403 Mean −0.038 (−0.106, 0.031) 0.283 Peak −0.062 (−0.130, 0.007) 0.078 Fluctuation −0.085 (−0.153, -0.016) 0.016 Range −0.091 (−0.160, -0.022) 0.009 Blood lipid, per 1-SD increase Total cholesterol 0.027 (−0.041, 0.096) 0.434 Triglycerides −0.019 (−0.087, 0.050) 0.597 HDL-c −0.022 (−0.091, 0.047) 0.537 LDL-c −0.014 (−0.083, 0.055) 0.689 Renal function, per 1-SD increase eGFR −0.082 (−0.151, -0.013) 0.019 Serum creatinine 0.057 (−0.012, 0.126) 0.104 Serum uric acid 0.031 (−0.038, 0.100) 0.378 Microalbuminuria −0.086 (−0.155, 0.017) 0.015 DM, diabetes mellitus; CI, confidence interval; SD, standard deviation; BCVA, best corrected visual acuity; logMAR, logarithm of the minimal angle of resolution; GCIPL, ganglion cell inner plexiform layer; RNFL, retinal nerve fiber layer; HbA1c, glycosylated hemoglobin; HDL-c, high-density lipoprotein cholesterol; LDL-c, low-density lipoprotein cholesterol; eGFR, estimated glomerular filtration rate. †p-values are from the univariate linear regression analysis. Variables with p < 0.01 remained statistically significant after Benjamini–Hochberg false discovery rate correction (q < 0.05). Data in bold indicate statistically significant differences (p < 0.05). Table 2.
Clinical characteristics factors contributing to the change in GCIPL thickness over time in DM participants as determined by univariate linear regression analysis.
-
Variable Multivariate model β (95% CI) p-value Duration of diabetes, per 1-year increase −0.003 (−0.013, 0.007) 0.582 Eye examination, per 1-SD increase Axial length −0.187 (−0.255, −0.120) < 0.001 Intraocular pressure −0.064 (−0.132, 0.004) 0.066 BCVA (logMAR) −0.201 (−0.271, −0.130) < 0.001 Macular retinal thickness −0.126 (−0.198, −0.054) 0.001 Macular GCIPL thickness −0.305 (−0.376, −0.235) < 0.001 HbA1c, per 1-SD increase Fluctuation 0.187 (−0.311, 0.684) 0.462 Range −0.237 (−0.735, 0.262) 0.351 Renal function, per 1-SD increase eGFR −0.057 (−0.128, 0.014) 0.118 Microalbuminuria −0.069 (−0.136, −0.002) 0.045 DM, diabetic retinopathy; CI, confidence interval; SD, standard deviation; BCVA, best corrected visual acuity; HbA1c, glycosylated hemoglobin; logMAR, logarithm of the minimal angle of resolution; GCIPL, ganglion cell–inner plexiform layer; eGFR, estimated glomerular filtration rate. Data in bold indicate statistically significant differences (p < 0.05). Table 3.
Clinical characteristics factors contributing to the changes in GCIPL thickness over time in DM participants as determined by multivariate linear regression analysis.
-
Variable NDR DR β (95% CI) p-value β (95% CI) †p-value Age, per 10-year increase 0.002 (−0.098, 0.104) 0.955 −0.011 (−0.033, 0.011) 0.334 Male versus female −0.114 (−0.260, 0.032) 0.127 −0.034 (−0.405, 0.337) 0.856 Body mass index 0.001 (−0.071, 0.074) 0.969 −0.131 (−0.316, 0.055) 0.167 Duration of diabetes −0.014 (−0.026, −0.003) 0.012 0.039 (0.014, 0.064) 0.003 Systolic blood pressure −0.070 (−0.143, 0.002) 0.055 0.068 (−0.117, 0.253) 0.471 Eye examination Axial length −0.164 (−0.235, 0.092) < 0.001 −0.325 (−0.508, −0.141) 0.001 Spherical 0.087 (0.015, 0.159) 0.018 0.031 (−0.159, 0.221) 0.750 Intraocular pressure −0.056 (−0.128, 0.017) 0.131 −0.072 (−0.266, 0.121) 0.463 BCVA (logMAR) −0.298 (−0.368, −0.228) < 0.001 −0.080 (−0.276, 0.116) 0.422 Retinal thickness −0.238 (−0.309, −0.167) < 0.001 −0.293 (−0.476, −0.110) 0.002 GCIPL thickness −0.327 (−0.397, −0.257) < 0.001 −0.269 (−0.452, −0.086) 0.004 Choroidal thickness 0.014 (−0.059, 0.086) 0.714 −0.038 (−0.220, 0.145) 0.686 Disc area 0.068 (−0.013, 0.149) 0.100 0.204 (−0.108, 0.517) 0.197 RNFL thickness 0.006 (−0.066, 0.079) 0.863 −0.025 (−0.211, 0.160) 0.787 HbA1c Baseline −0.043 (−0.115, 0.029) 0.241 0.403 (0.227, 0.580) < 0.001 Mean −0.129 (−0.201, −0.058) < 0.001 0.449 (0.275, 0.624) < 0.001 Peak −0.154 (−0.226, −0.083) < 0.001 0.461 (0.288, 0.634) < 0.001 Fluctuation −0.144 (−0.216, −0.073) < 0.001 0.306 (0.128, 0.484) 0.001 Range −0.148 (−0.219, −0.076) < 0.001 0.284 (0.106, 0.462) 0.002 Blood lipid Total cholesterol 0.011 (−0.061, 0.083) 0.769 0.072 (−0.111, 0.254) 0.439 Triglycerides −0.016 (−0.089, 0.056) 0.658 0.060 (−0.124, 0.244) 0.519 HDL-c −0.025 (−0.098, 0.047) 0.490 −0.084 (−0.288, 0.119) 0.415 LDL-c −0.038 (−0.110, 0.034) 0.299 0.048 (−0.136, 0.232) 0.609 Renal function eGFR −0.037 (−0.110, 0.035) 0.310 −0.072 (−0.263, 0.119) 0.458 Serum creatinine 0.007 (−0.065, 0.080) 0.840 0.090 (−0.098, 0.279) 0.347 Serum uric acid 0.009 (−0.064, 0.081) 0.813 0.081 (−0.104, 0.265) 0.390 Microalbuminuria −0.135 (−0.207, −0.063) < 0.001 0.177 (−0.076, 0.430) 0.169 NDR, diabetic patients without retinopathy; DR, diabetic patients; CI, confidence interval; SD, standard deviation; BCVA, best corrected visual acuity; logMAR, logarithm of the minimal angle of resolution; GCIPL, ganglion cell–inner plexiform layer; RNFL, retinal nerve fiber layer; HbA1c, glycosylated hemoglobin; HDL-c, high-density lipoprotein cholesterol; LDL-c, low-density lipoprotein cholesterol; eGFR, estimated glomerular filtration rate. †p-values are from the univariate linear regression analysis. Within each subgroup (NDR and DR), all variables with p < 0.05 remained statistically significant after Benjamini–Hochberg false discovery rate correction (q < 0.05). Data in bold indicate statistically significant differences (p < 0.05). Table 4.
Clinical characteristics factors contributing to the rate of thinning of the macular ganglion cell–inner plexiform layer over time in NDR and DR participants as determined by univariate linear regression analysis.
Figures
(2)
Tables
(4)