-
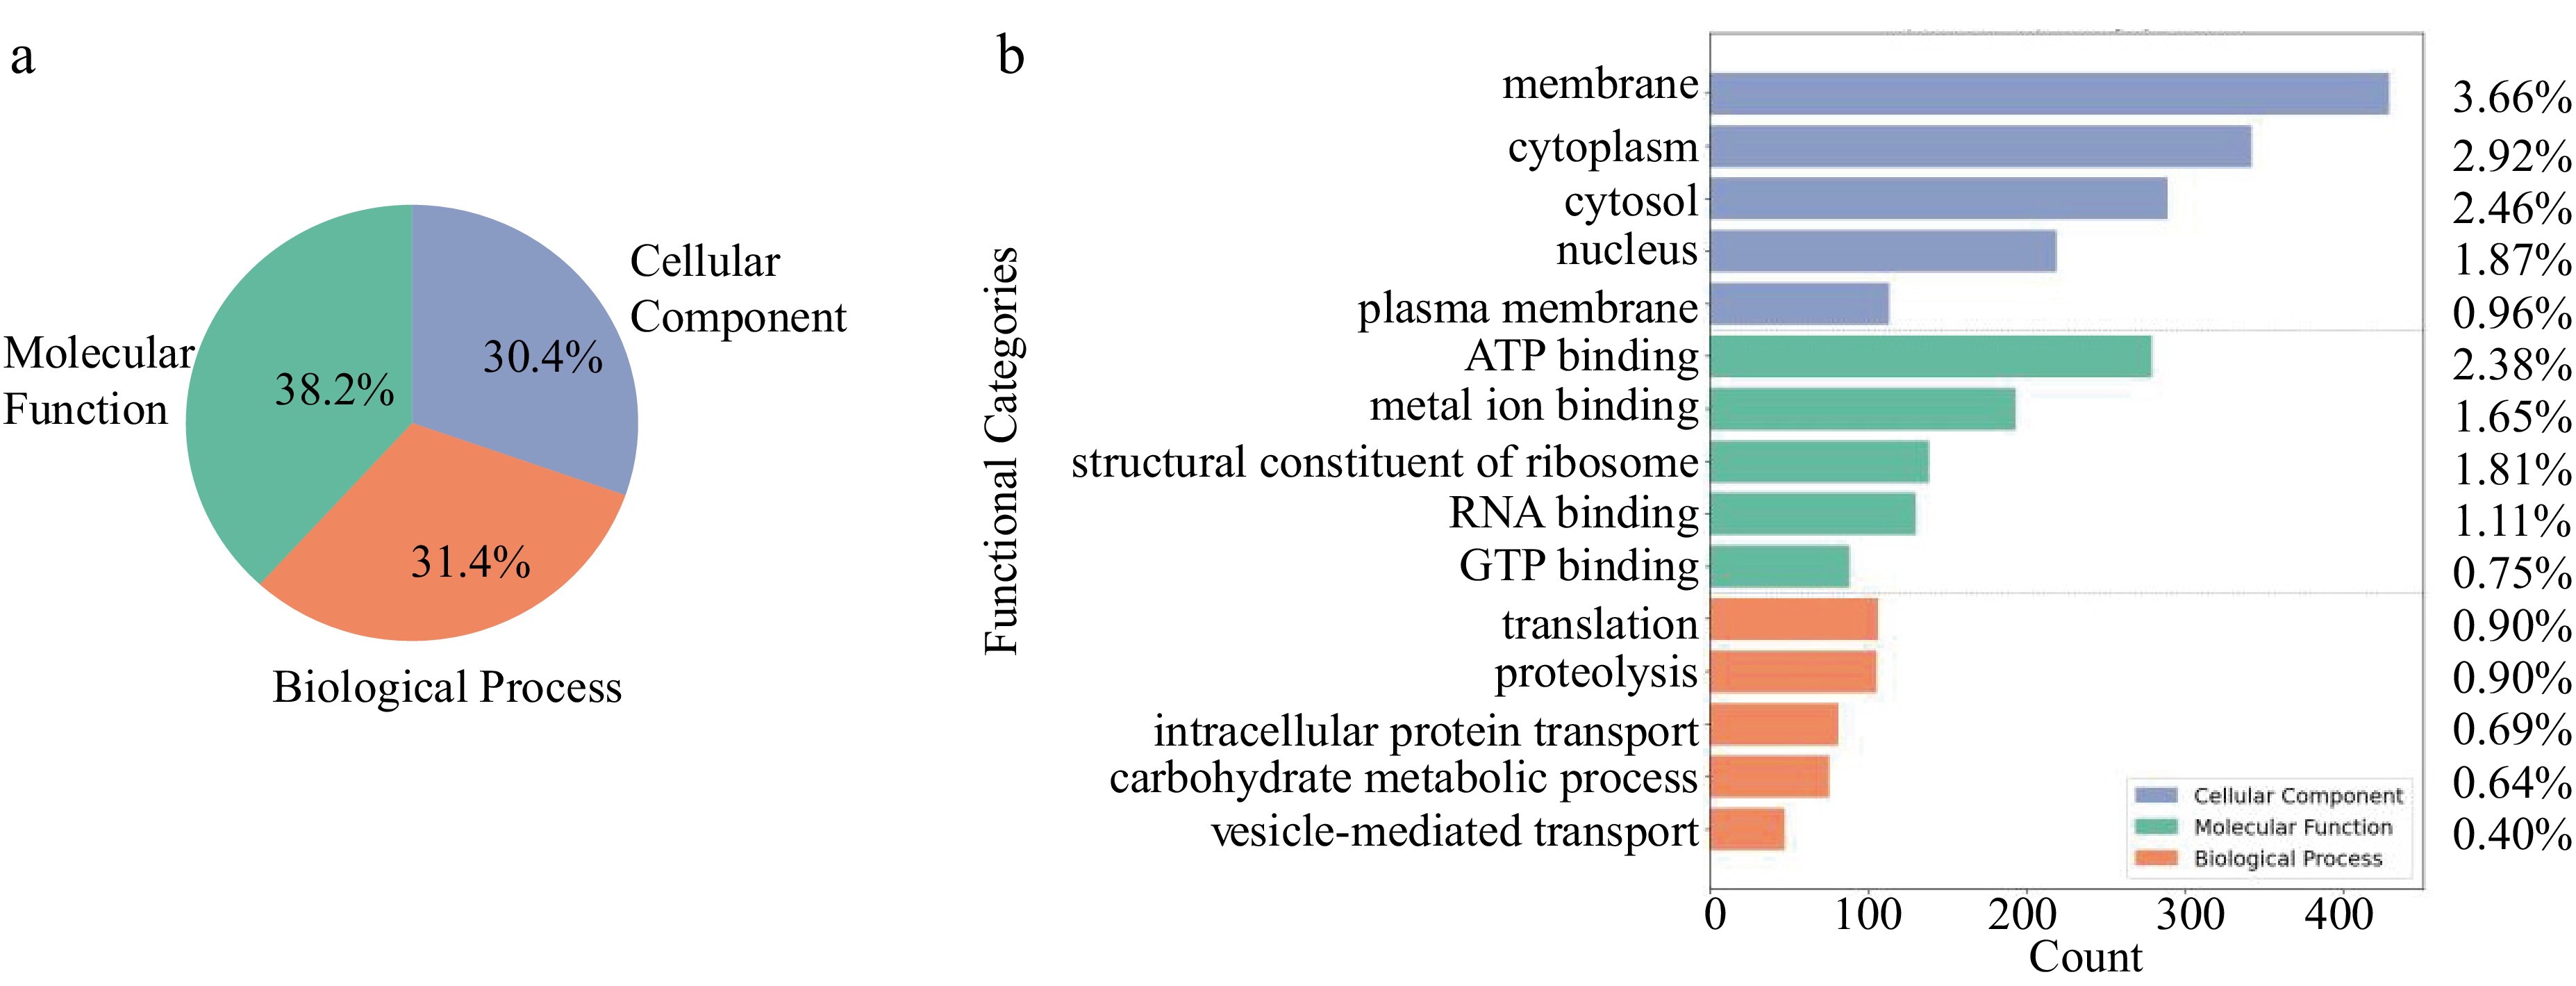
Figure 1.
Gene Ontology (GO) classification of proteins identified in the seed coat tissue of common bean. (a) Distribution of GO terms by ontology, showing the proportion of proteins assigned to the categories: Cellular Component, Molecular Function, and Biological Process. (b) Top five GO terms within each ontology ranked by frequency of annotation for each category.
-
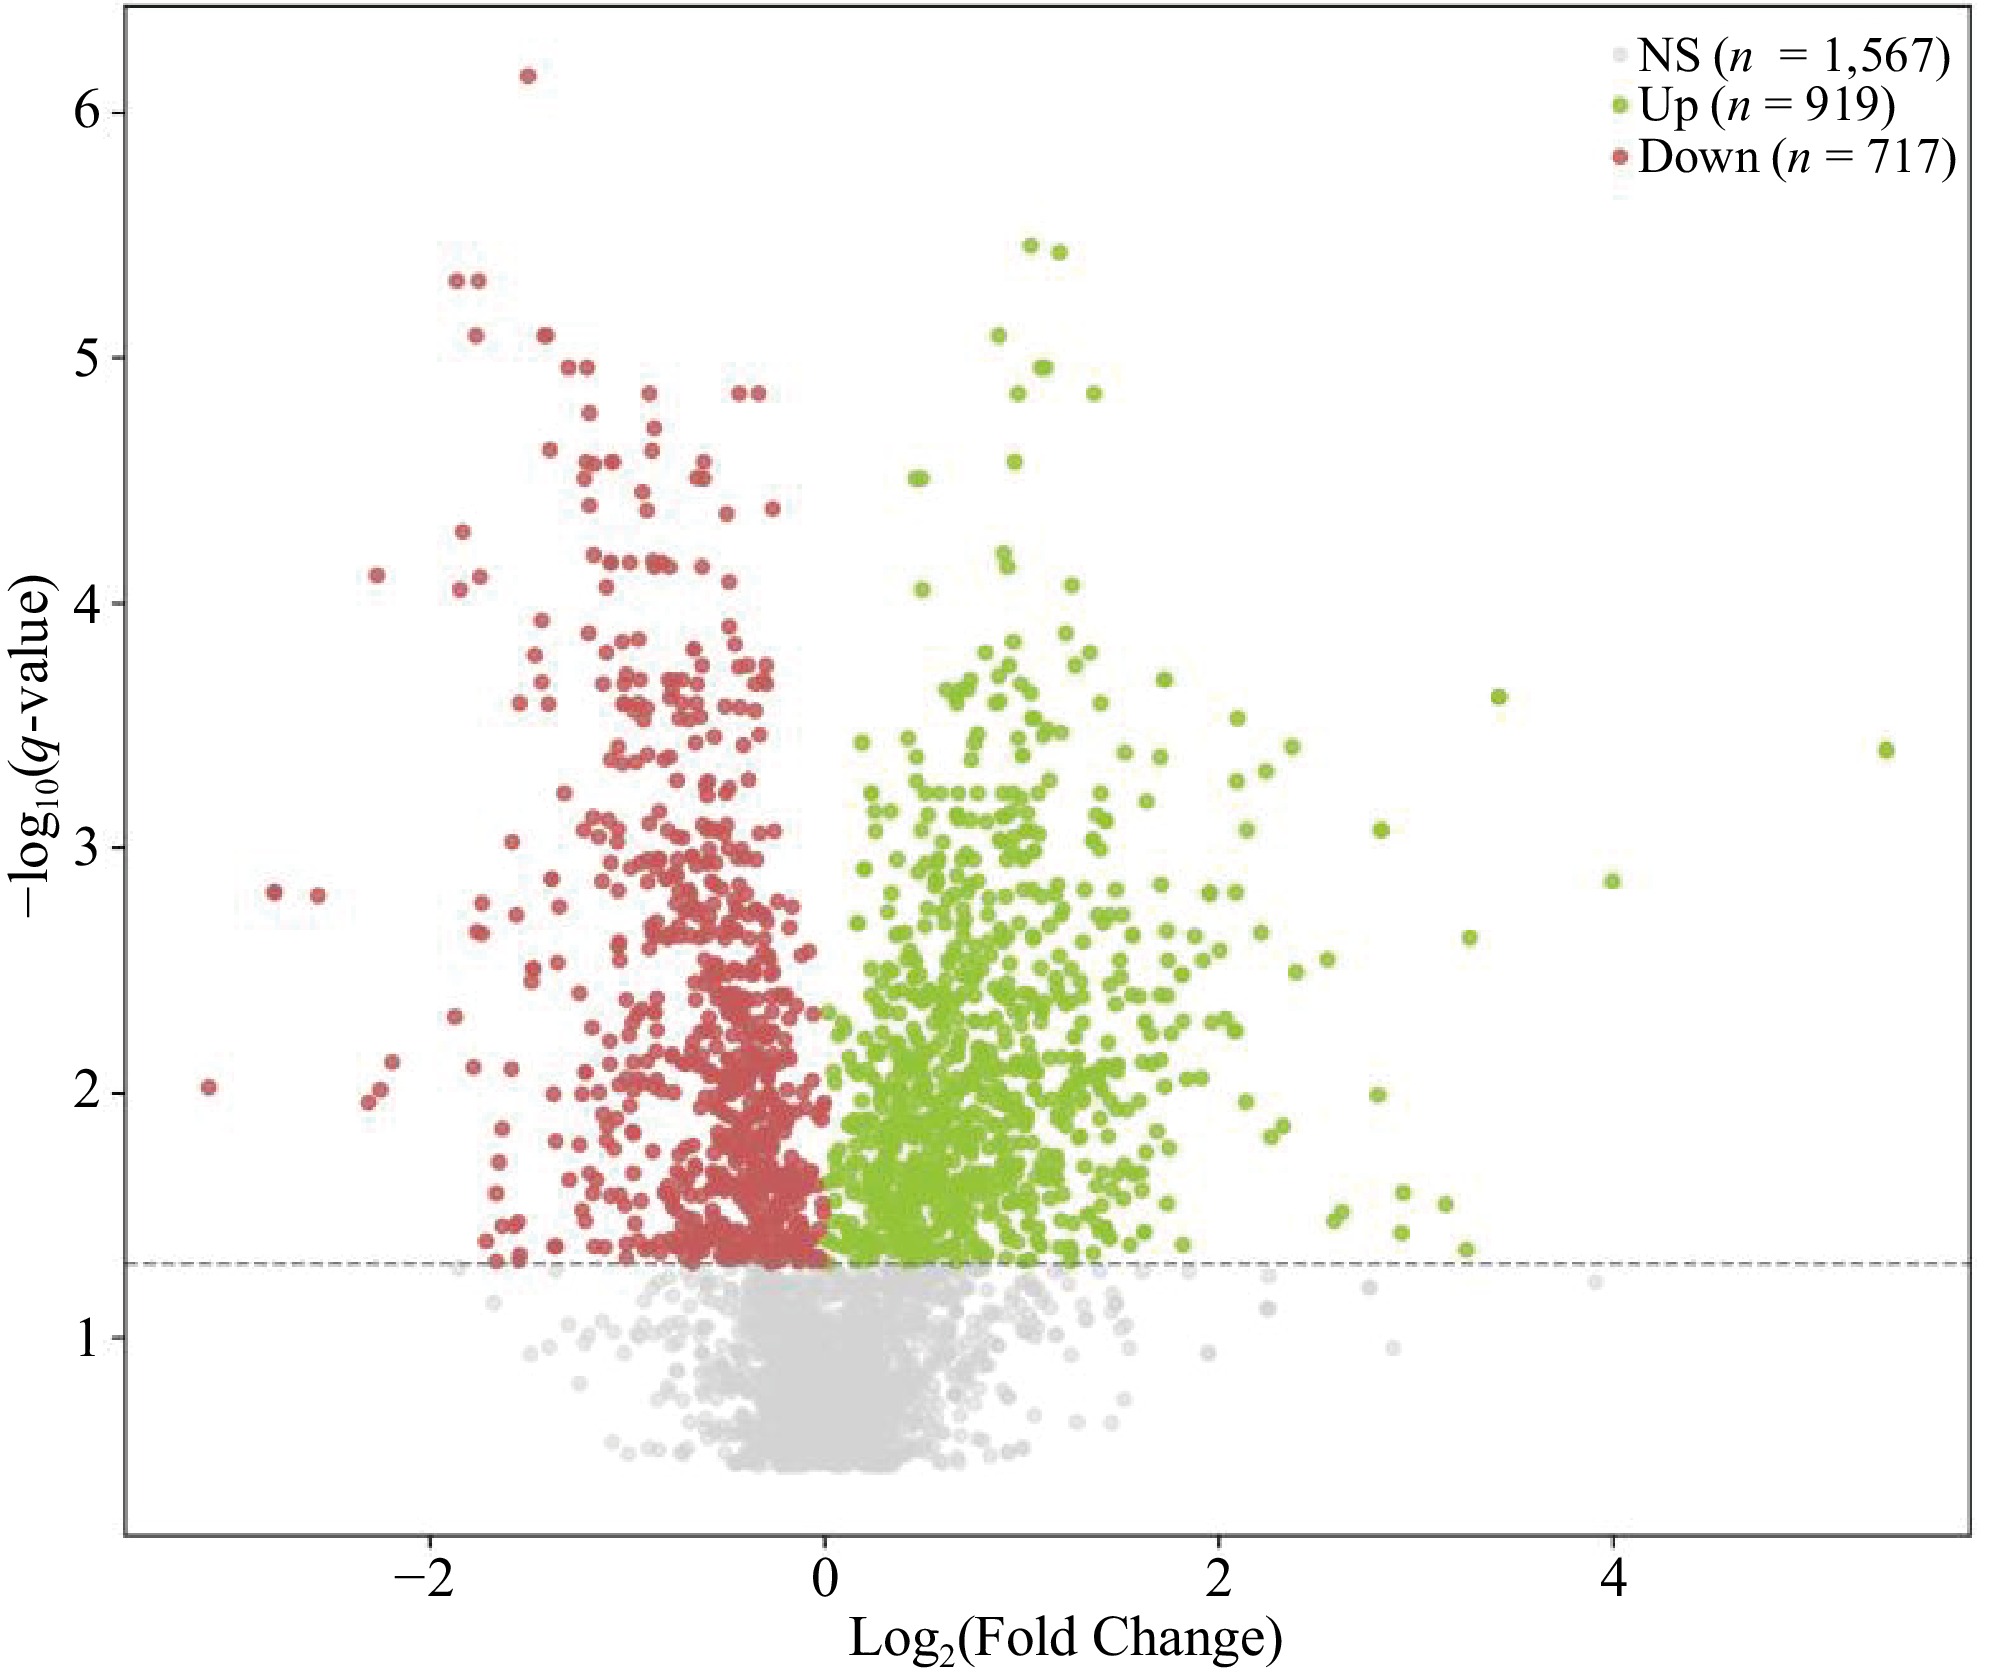
Figure 2.
Volcano plot showing the number of up- and down-regulated proteins (q-value < 0.05) in the seed coat tissue of common bean between day 0 and 4 after seed imbibition. Each point represents one protein, plotted according to its log2FC change (x-axis) and –log10 (q-value) (y-axis). Proteins with q-value ≥ 0.05 were classified as not significant (NS, gray). Among significant proteins (q-value < 0.05), those with positive log2FC were considered upregulated (green), while those with negative log2FC were considered downregulated (red). The numbers shown in the legend correspond to the count of proteins in each category. Proteomic profiles were compared using samples from four independent biological pools for each condition.
-
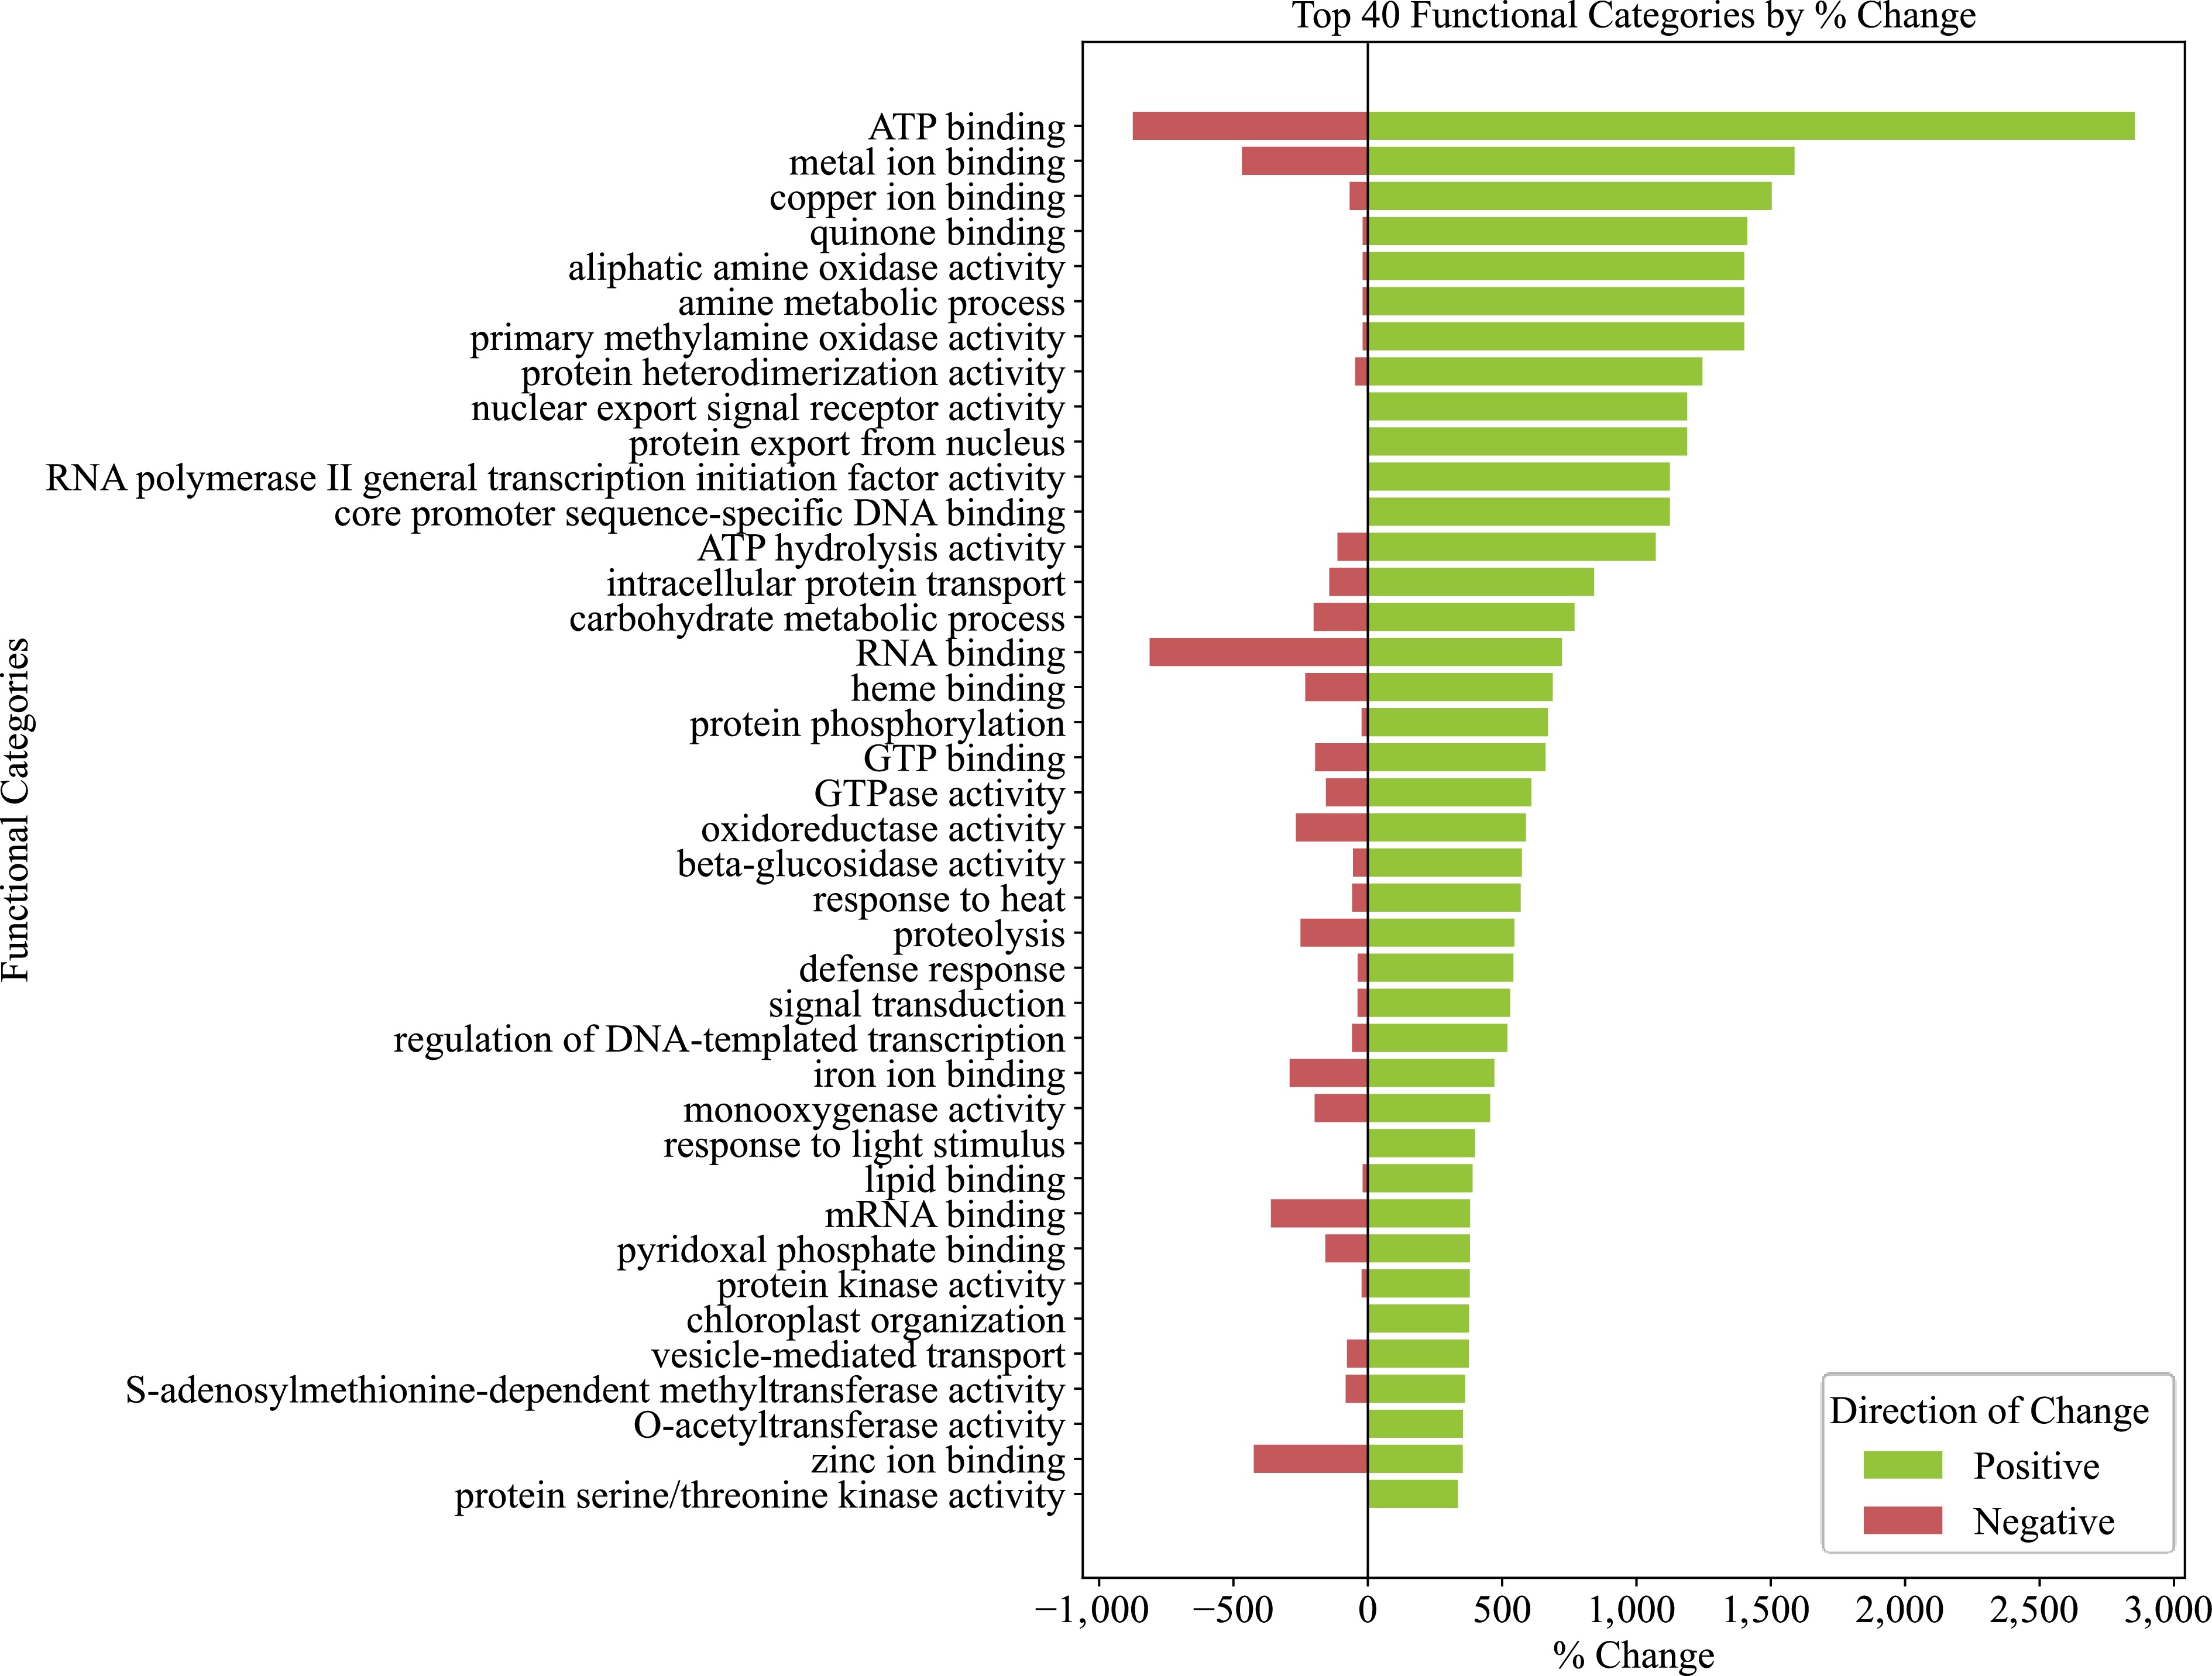
Figure 3.
Top 40 Gene Ontology (GO) functional categories showing changes in protein abundance in the seed coat of common bean between day 0 and 4 of germination. % change values represent the percentage change in protein abundance between the two times. Bars represent the summed % change for all proteins annotated to each GO term, with positive values (green) indicating overall upregulation and negative values (red) indicating overall downregulation. GO annotations were obtained from the Gene Ontology database (
http://geneontology.org ). Only categories from the Molecular Function (MF) and Biological Process (BP) domains were included. Proteins with significant change (q-value < 0.05) were retained, and the categories were ranked by total positive % change; the top 40 terms are shown. -
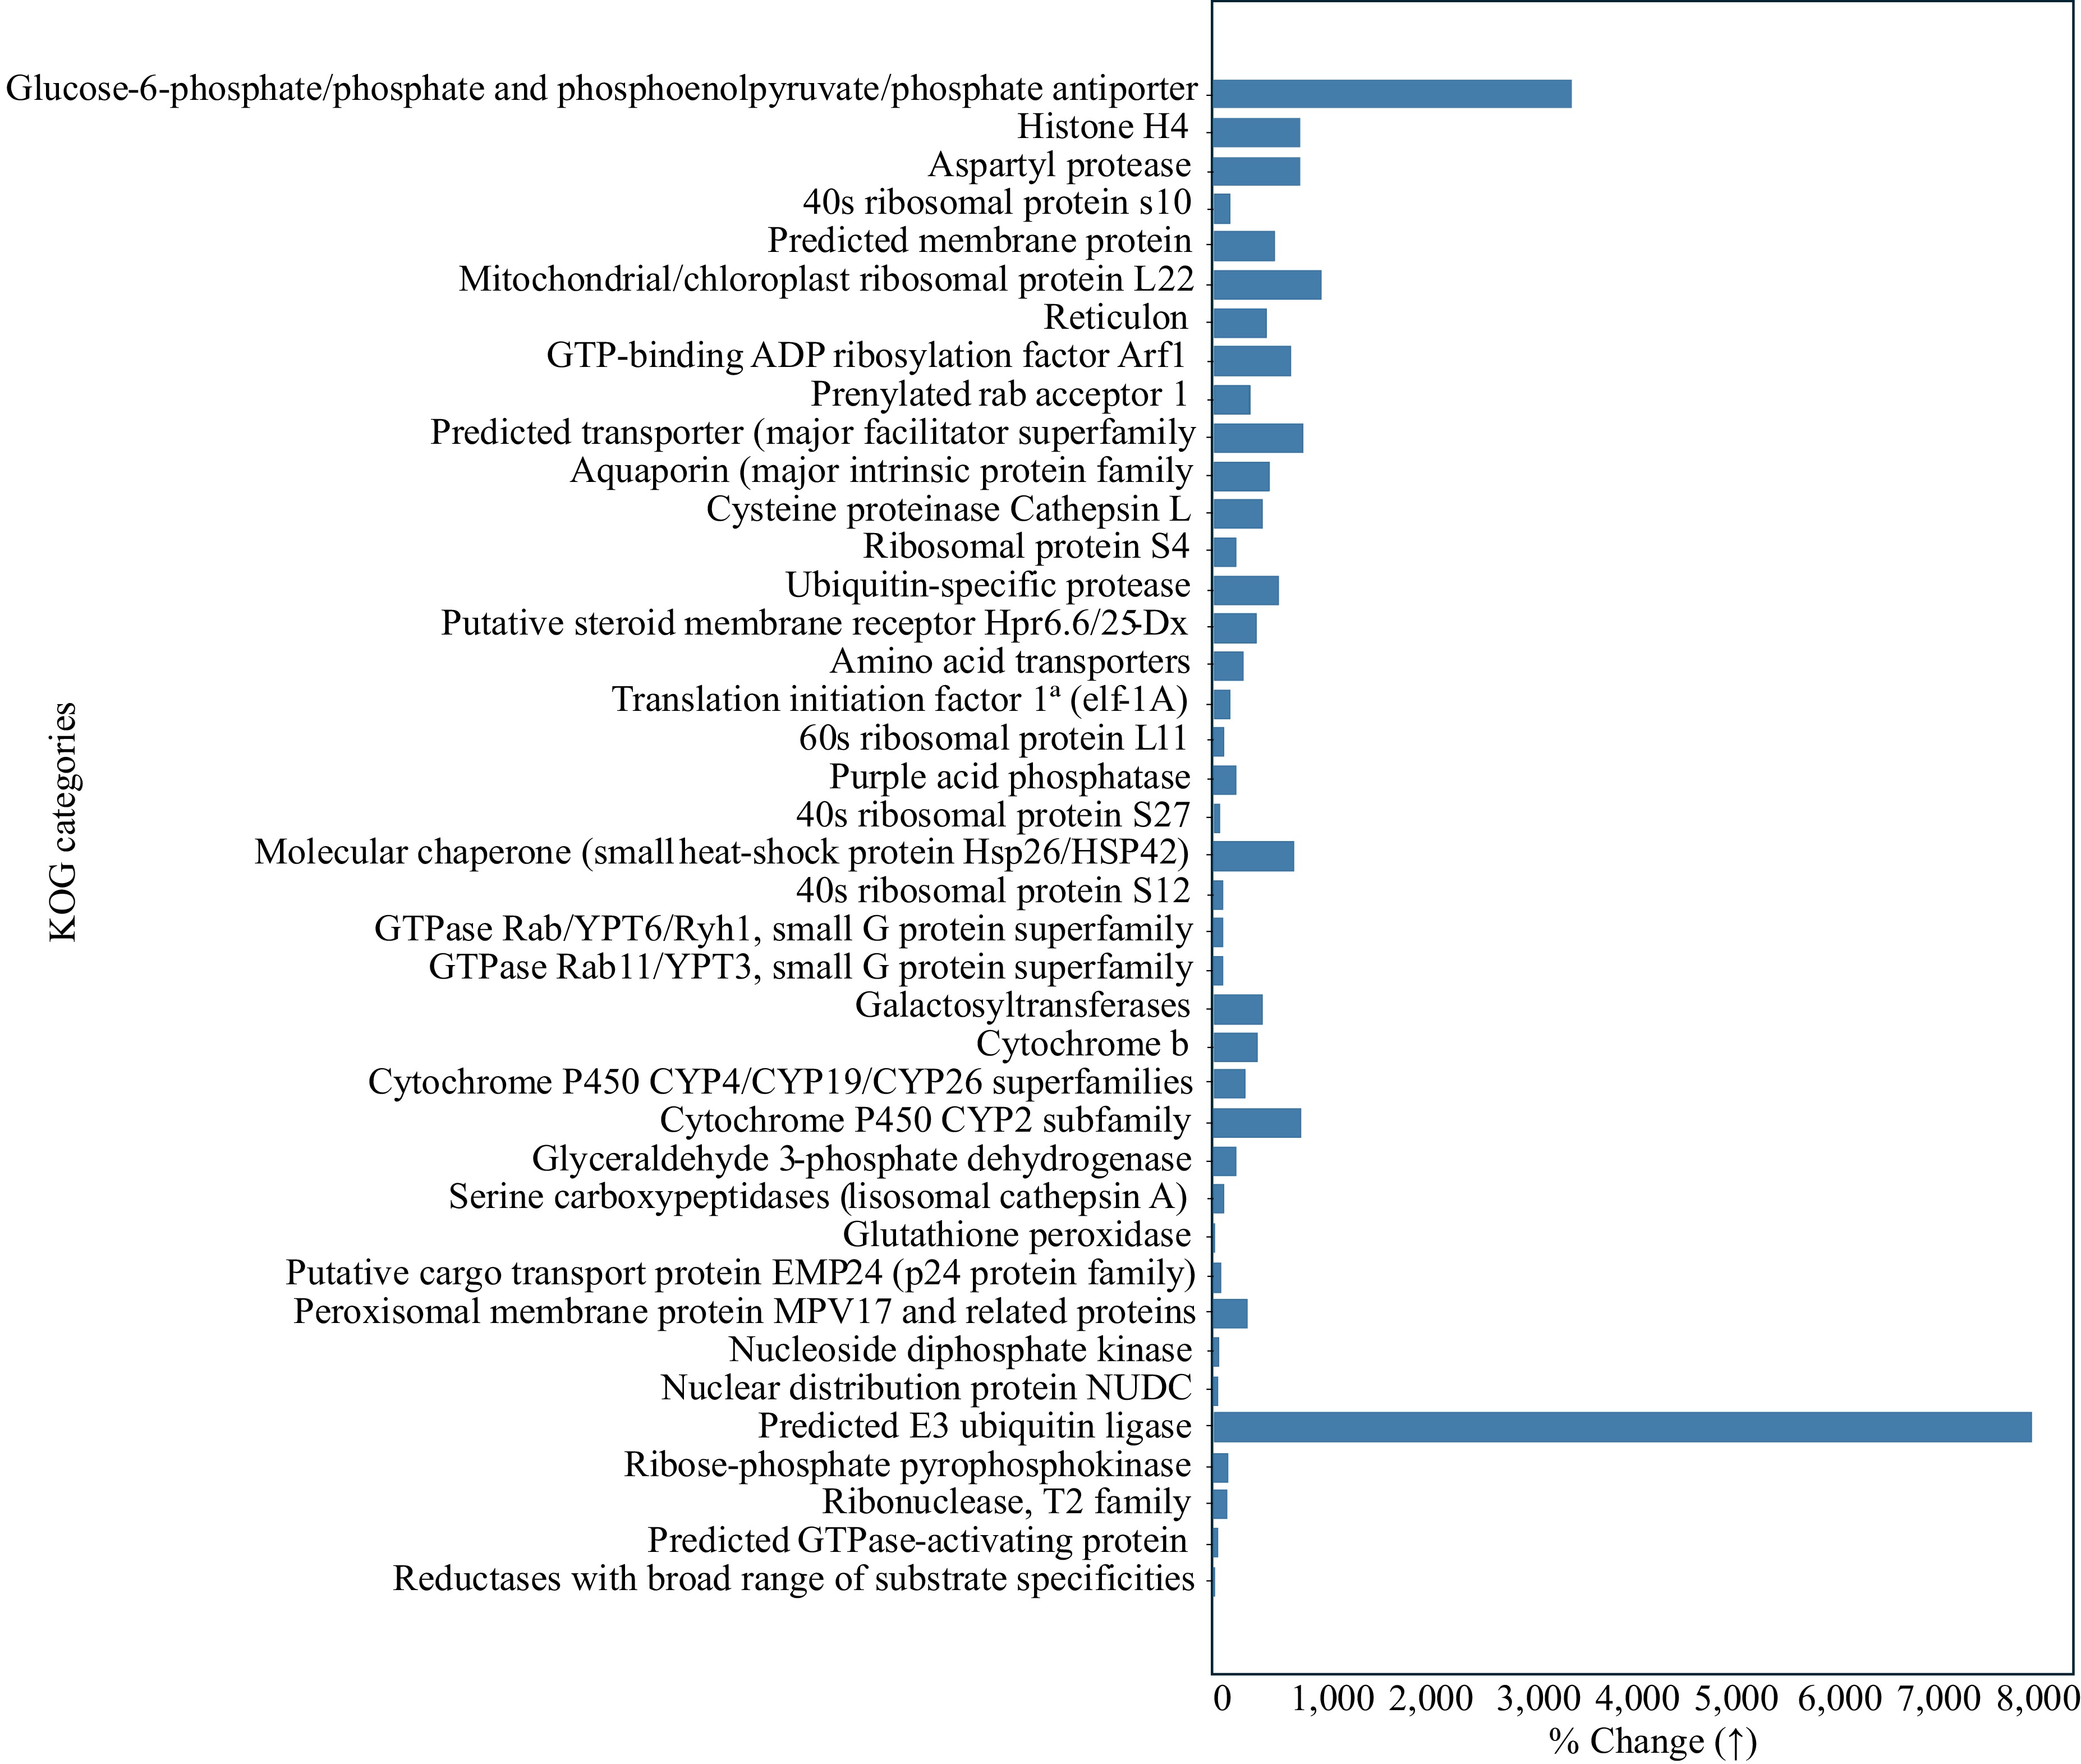
Figure 4.
Top 40 KOG categories showing increases in protein abundance in the seed coat of common bean vulgaris between day 0 and 4 after imbibition. Only proteins with positive % change were retained. When proteins were annotated with multiple KOG terms, annotations were split and evaluated pairwise with their descriptions; entries lacking a description or labeled as uncharacterized/NA were excluded. Bars represent the summed % change across all proteins assigned to each KOG description (x-axis). Categories on the y-axis are ordered by the number of contributing proteins (most proteins at the top), while bar length reflects the total % change for that category. KOG annotations were obtained from the NCBI COG/KOG resource. Only significant change proteins with a q-value < 0.05 were retained for analysis.
-
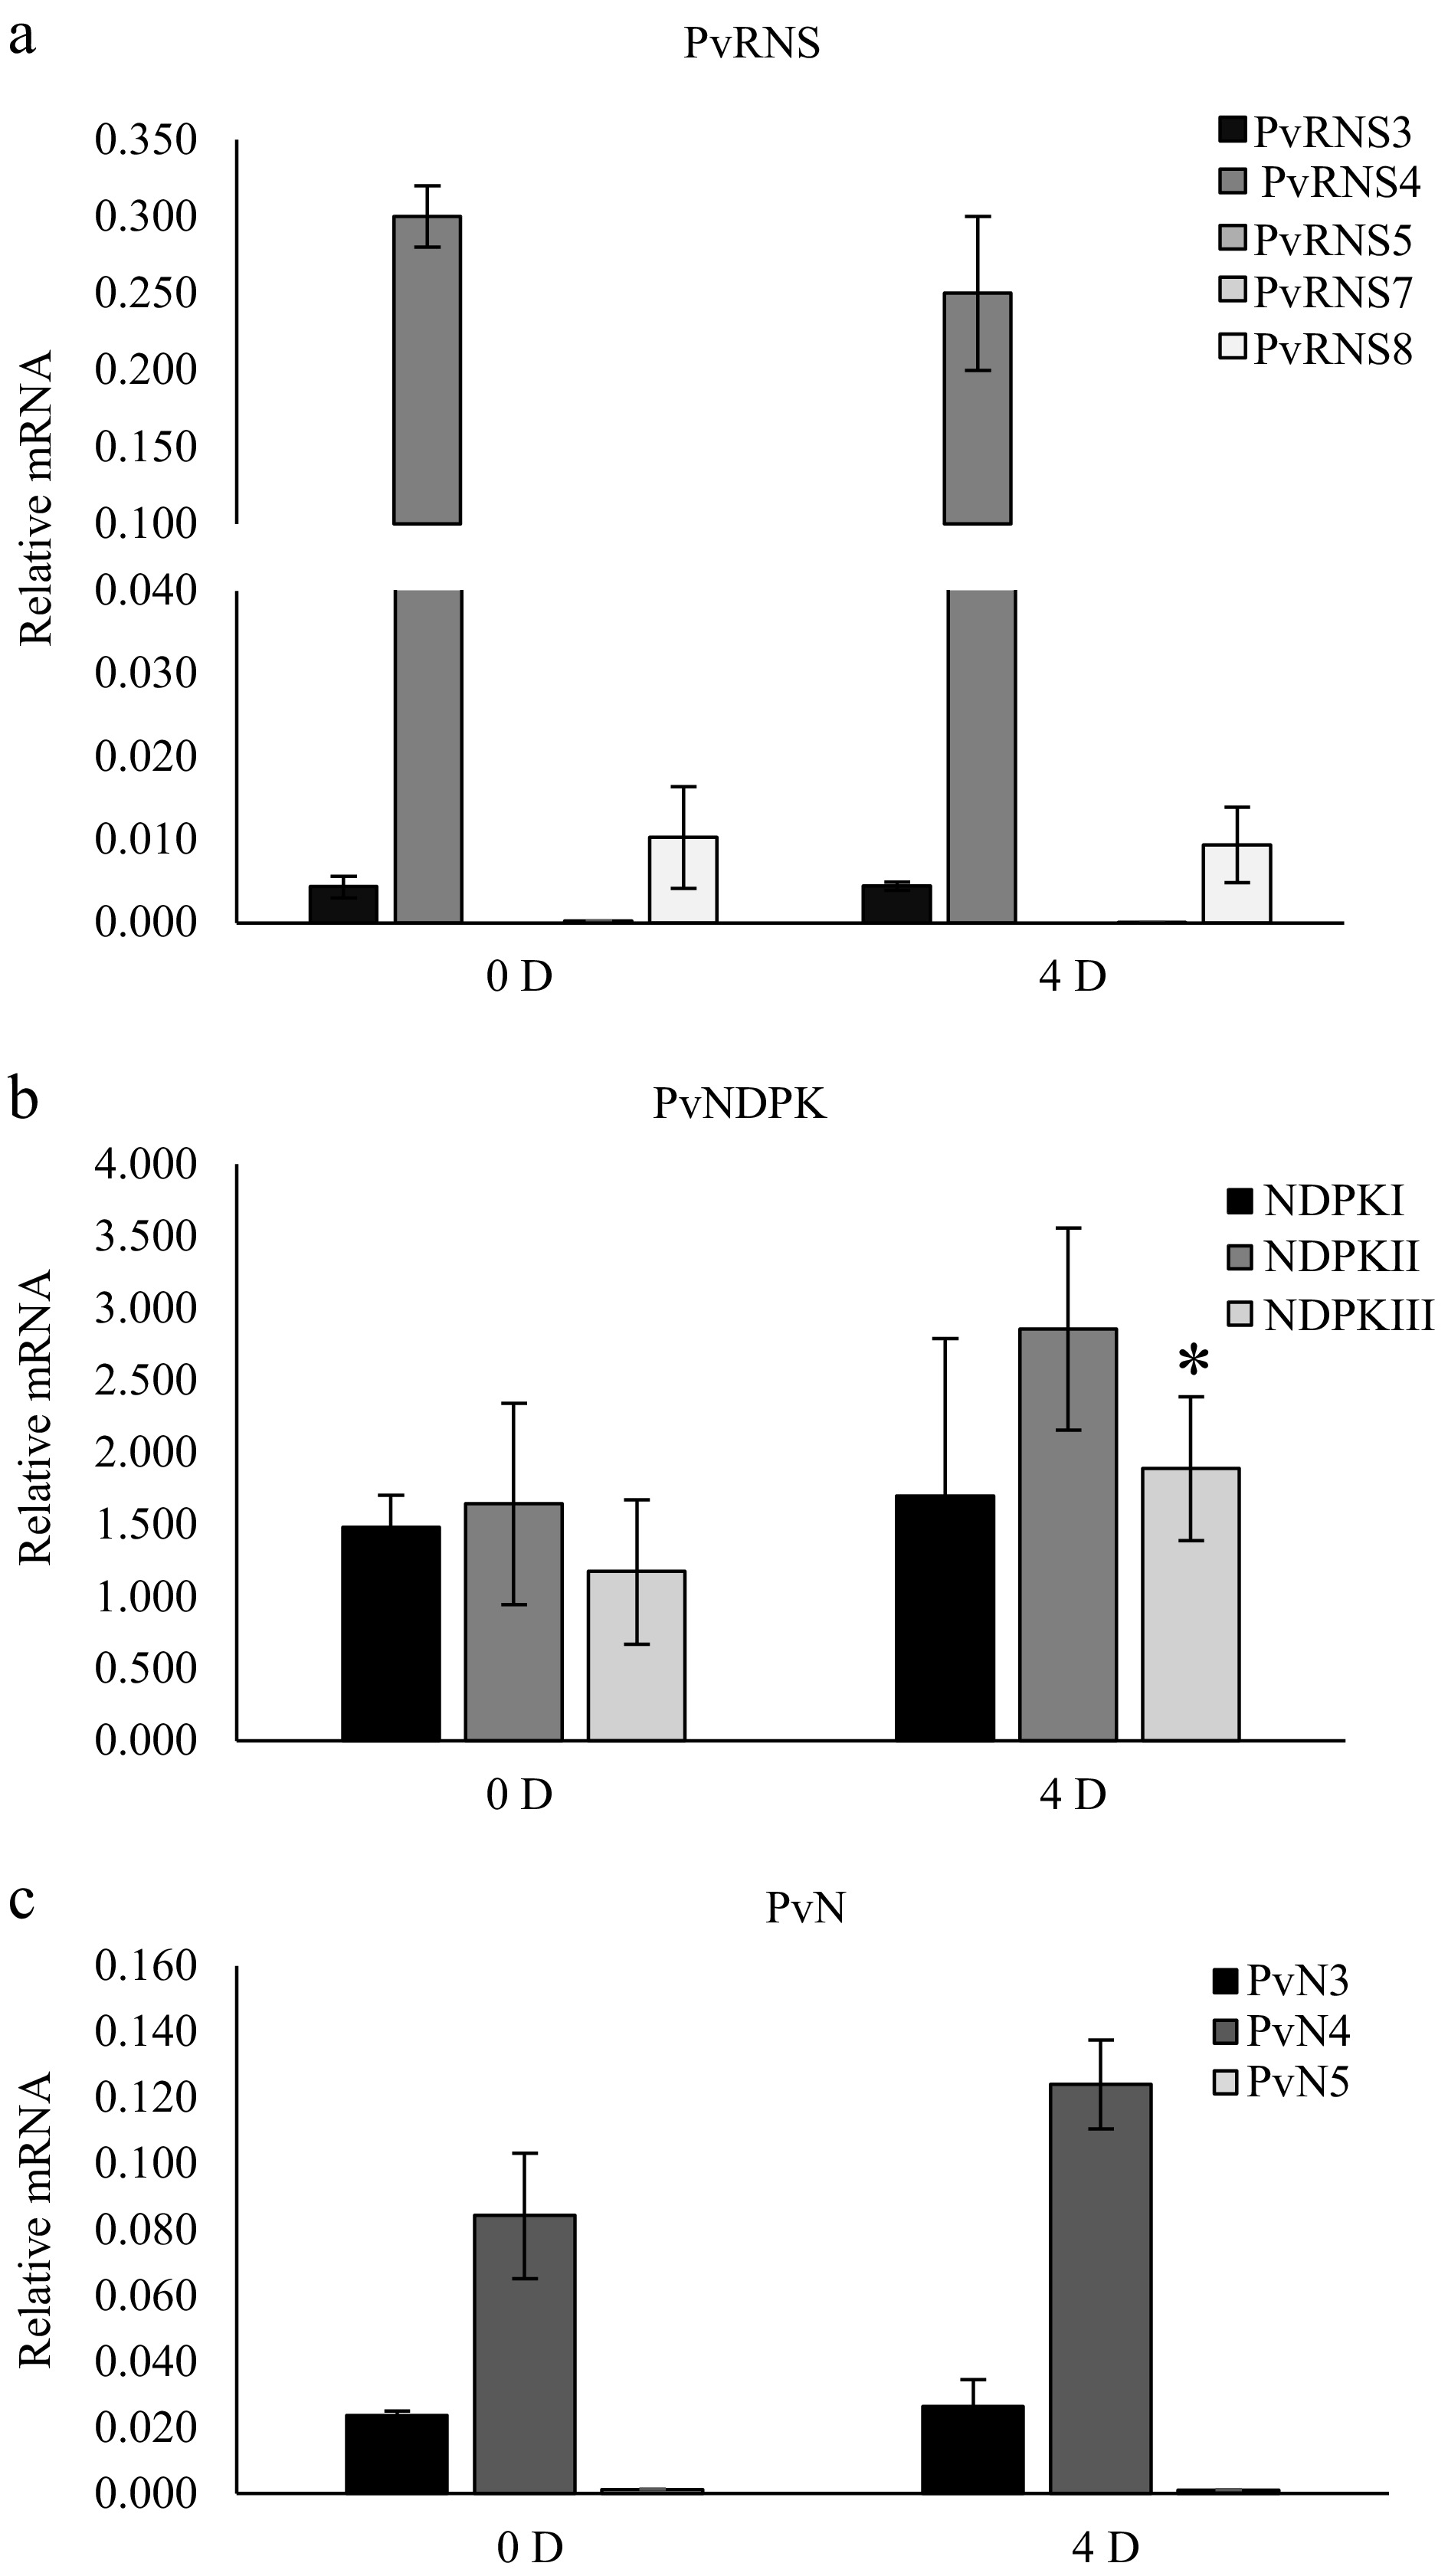
Figure 5.
Expression pattern of (a) Ribonucleases T2, (b) nucleoside diphosphate kinase, and (c) nucleases in seed coats at 0 (0 D) and 4 (4 D) d after the start of imbibition. Gene expression analysis was performed using qRT-PCR on total RNA samples extracted from the seed coat of common bean. The relative expression level was normalized using the geometric mean of two reference genes and analysed using the 2−ΔCᴛ method. Student´s t-test was performed comparing both conditions. Statistical significance levels were indicated as follows: * p < 0.05.
-
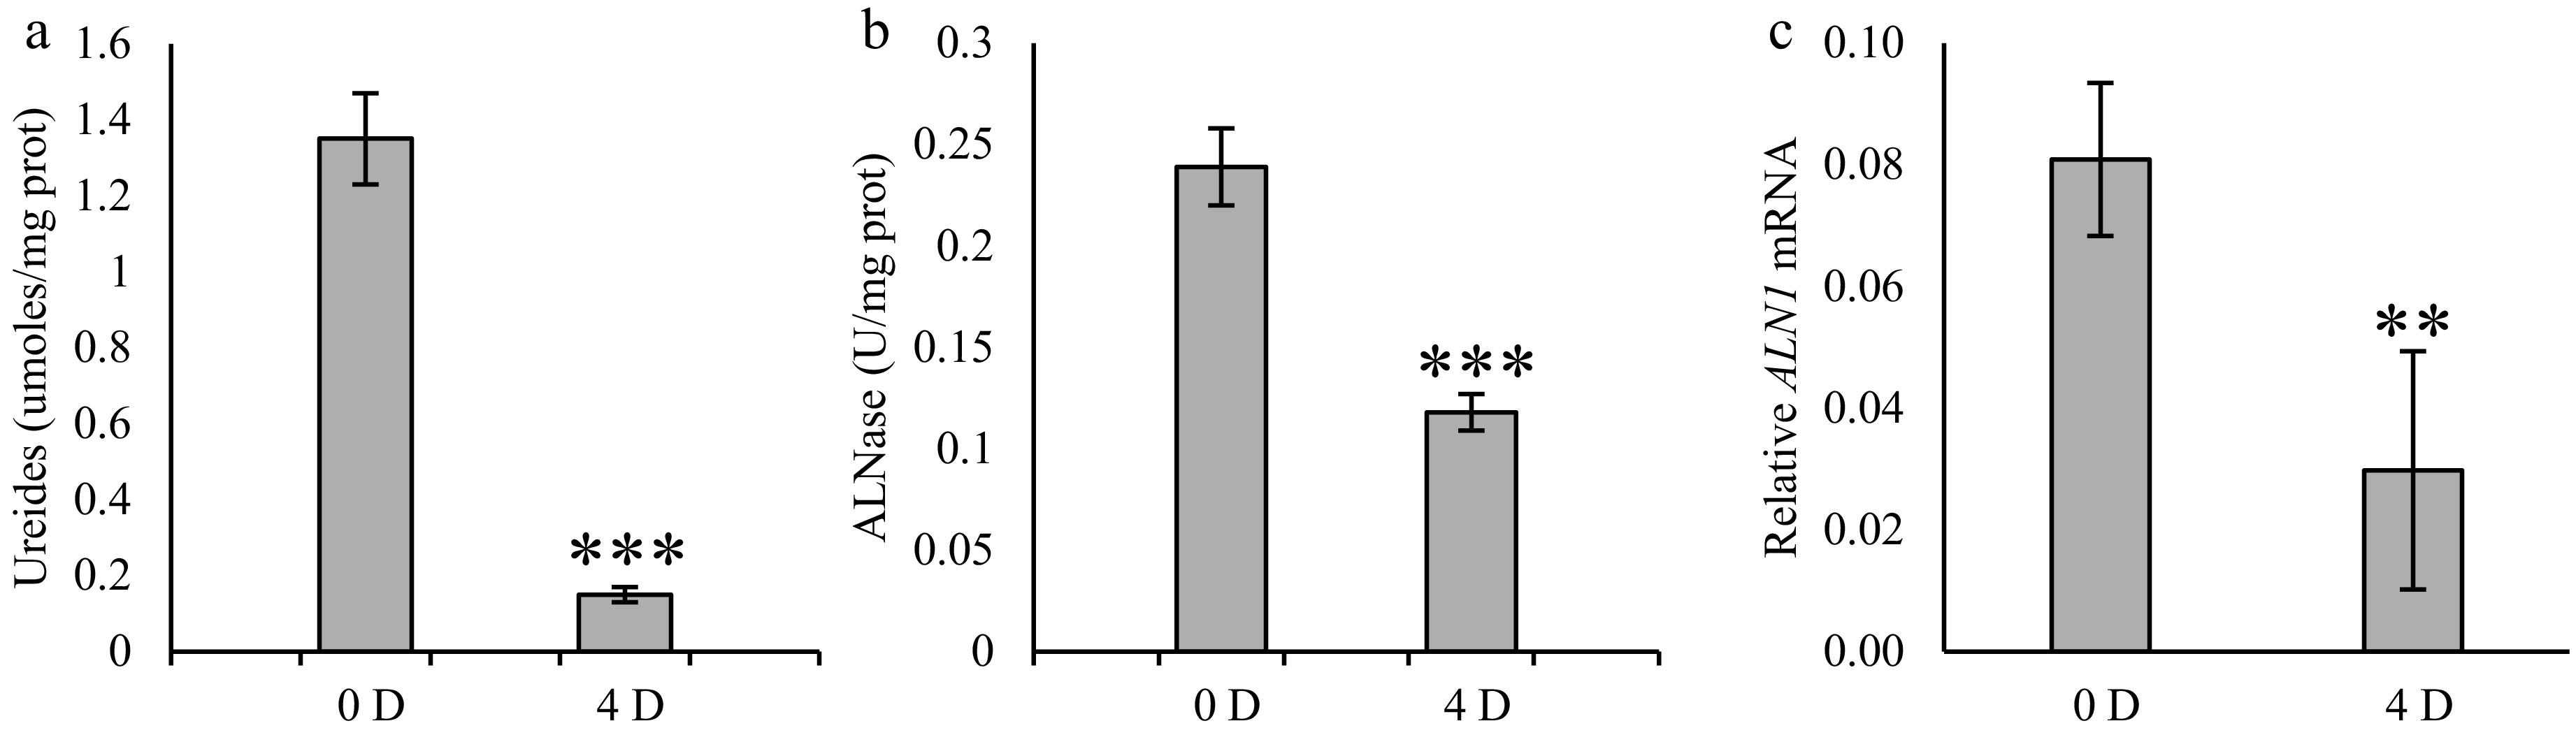
Figure 6.
Ureide content, allantoinase activity, and ALN1 gene expression in the seed coat at 0 (0 D) and 4 (4 D) d post-imbibition. Ureides were quantified and normalized to total soluble protein. (a) Allantoinase activity was determined by an enzymatic assay and expressed as specific activity. (b) ALN1 transcript levels were determined by qRT-PCR. (c) Relative expression levels were normalized to the geometric mean of two reference genes and then calculated using the 2−ΔCᴛ method. Bars represent mean values ± standard error (SE) of four biological replicates. Student's t-test was performed comparing both conditions. Statistical significance levels were indicated as follows: * p < 0.05, ** p < 0.01, and *** p < 0.001.
-
ID Protein 0 D protein quantification 4 D protein quantification Fold change q-value Ribonucleases T2 Phvul.002G084600 PvRNS3 12.49 11.05 −11.50 0.308 Phvul.010G110200 PvRNS4 37.07 35.79 −3.45 0.307 Phvul.006G112700 PvRNS5 17.84 7.66 −57.04 0.105 Phvul.006G112900 PvRNS7 577.12 1258.66 118.09 < 0.001 Phvul.006G112800 PvRNS8 37.67 50.31 33.54 0.024 Nucleoside diphosphate kinases Phvul.010G045400 PvNDPKI 93.91 77.42 −17.55 0.003 Phvul.003G208500 PvNDPKII 44.79 49.42 10.34 0.014 Phvul.002G297900 PvNDPKIII 168.90 277.90 64.54 0.001 Nucleases S1/P1 Phvul.002G223100 PvN3 11.09 9.91 −10.06 0.141 Phvul.006G190700 PvN4 15.45 32.54 110.6 0,062 Phvul.007G028400 PvN5 21.52 24.41 13.4 0.216 Table 1.
Quantification and fold change of T2-Ribonucleases, nucleases S1/P1, and NDPK. Protein quantification at 0 df after imbibition (0 D) and 4 d after imbibition (4 D) is presented as the mean of the individual quantifications obtained from four biological replicates per condition. The fold change column indicates the percentage variation (%) between 0 D and 4 D. The q-value represents the false discovery rate (FDR)-adjusted p-value for the comparison between conditions.
-
ID Protein 0 D protein quantification 4 D protein quantification Fold change q-value Phvul.004G174200 PvNTD1 21.74 23.25 6.99 0.201 Phvul.011G182400 PvNTD2 30.79 27.55 −10.52 0.114 Phvul.001G188700 PvNHS1 14.87 7.22 −51.45 0.002 Phvul.003G000600 PvNHS2 22.09 10.70 −51.55 0.002 Phvul.005G148000 XDH 6.54 6.46 −1.35 0.108 Phvul.007G234300 Uricase 67.67 71.20 5.22 0.059 Phvul.010G034000 Hydroxyisourate hydrolase 31.53 19.48 −38.28 0.032 Phvul.006G186800 ALN1 167.07 73.25 −56.15 < 0.001 Phvul.006G186700 ALN2 26.17 43.11 64.73 0.063 Table 2.
Identified proteins belonging to nucleotide catabolism. Protein abundance at 0 d after imbibition (0 D) and 4 d after imbibition (4 D) is reported as the average of measurements from four biological replicates per condition. The fold change column shows the percentage change (%) between 0 D and 4 D. The q-value corresponds to the FDR-adjusted p-value for the comparison between the two conditions.
Figures
(6)
Tables
(2)