-
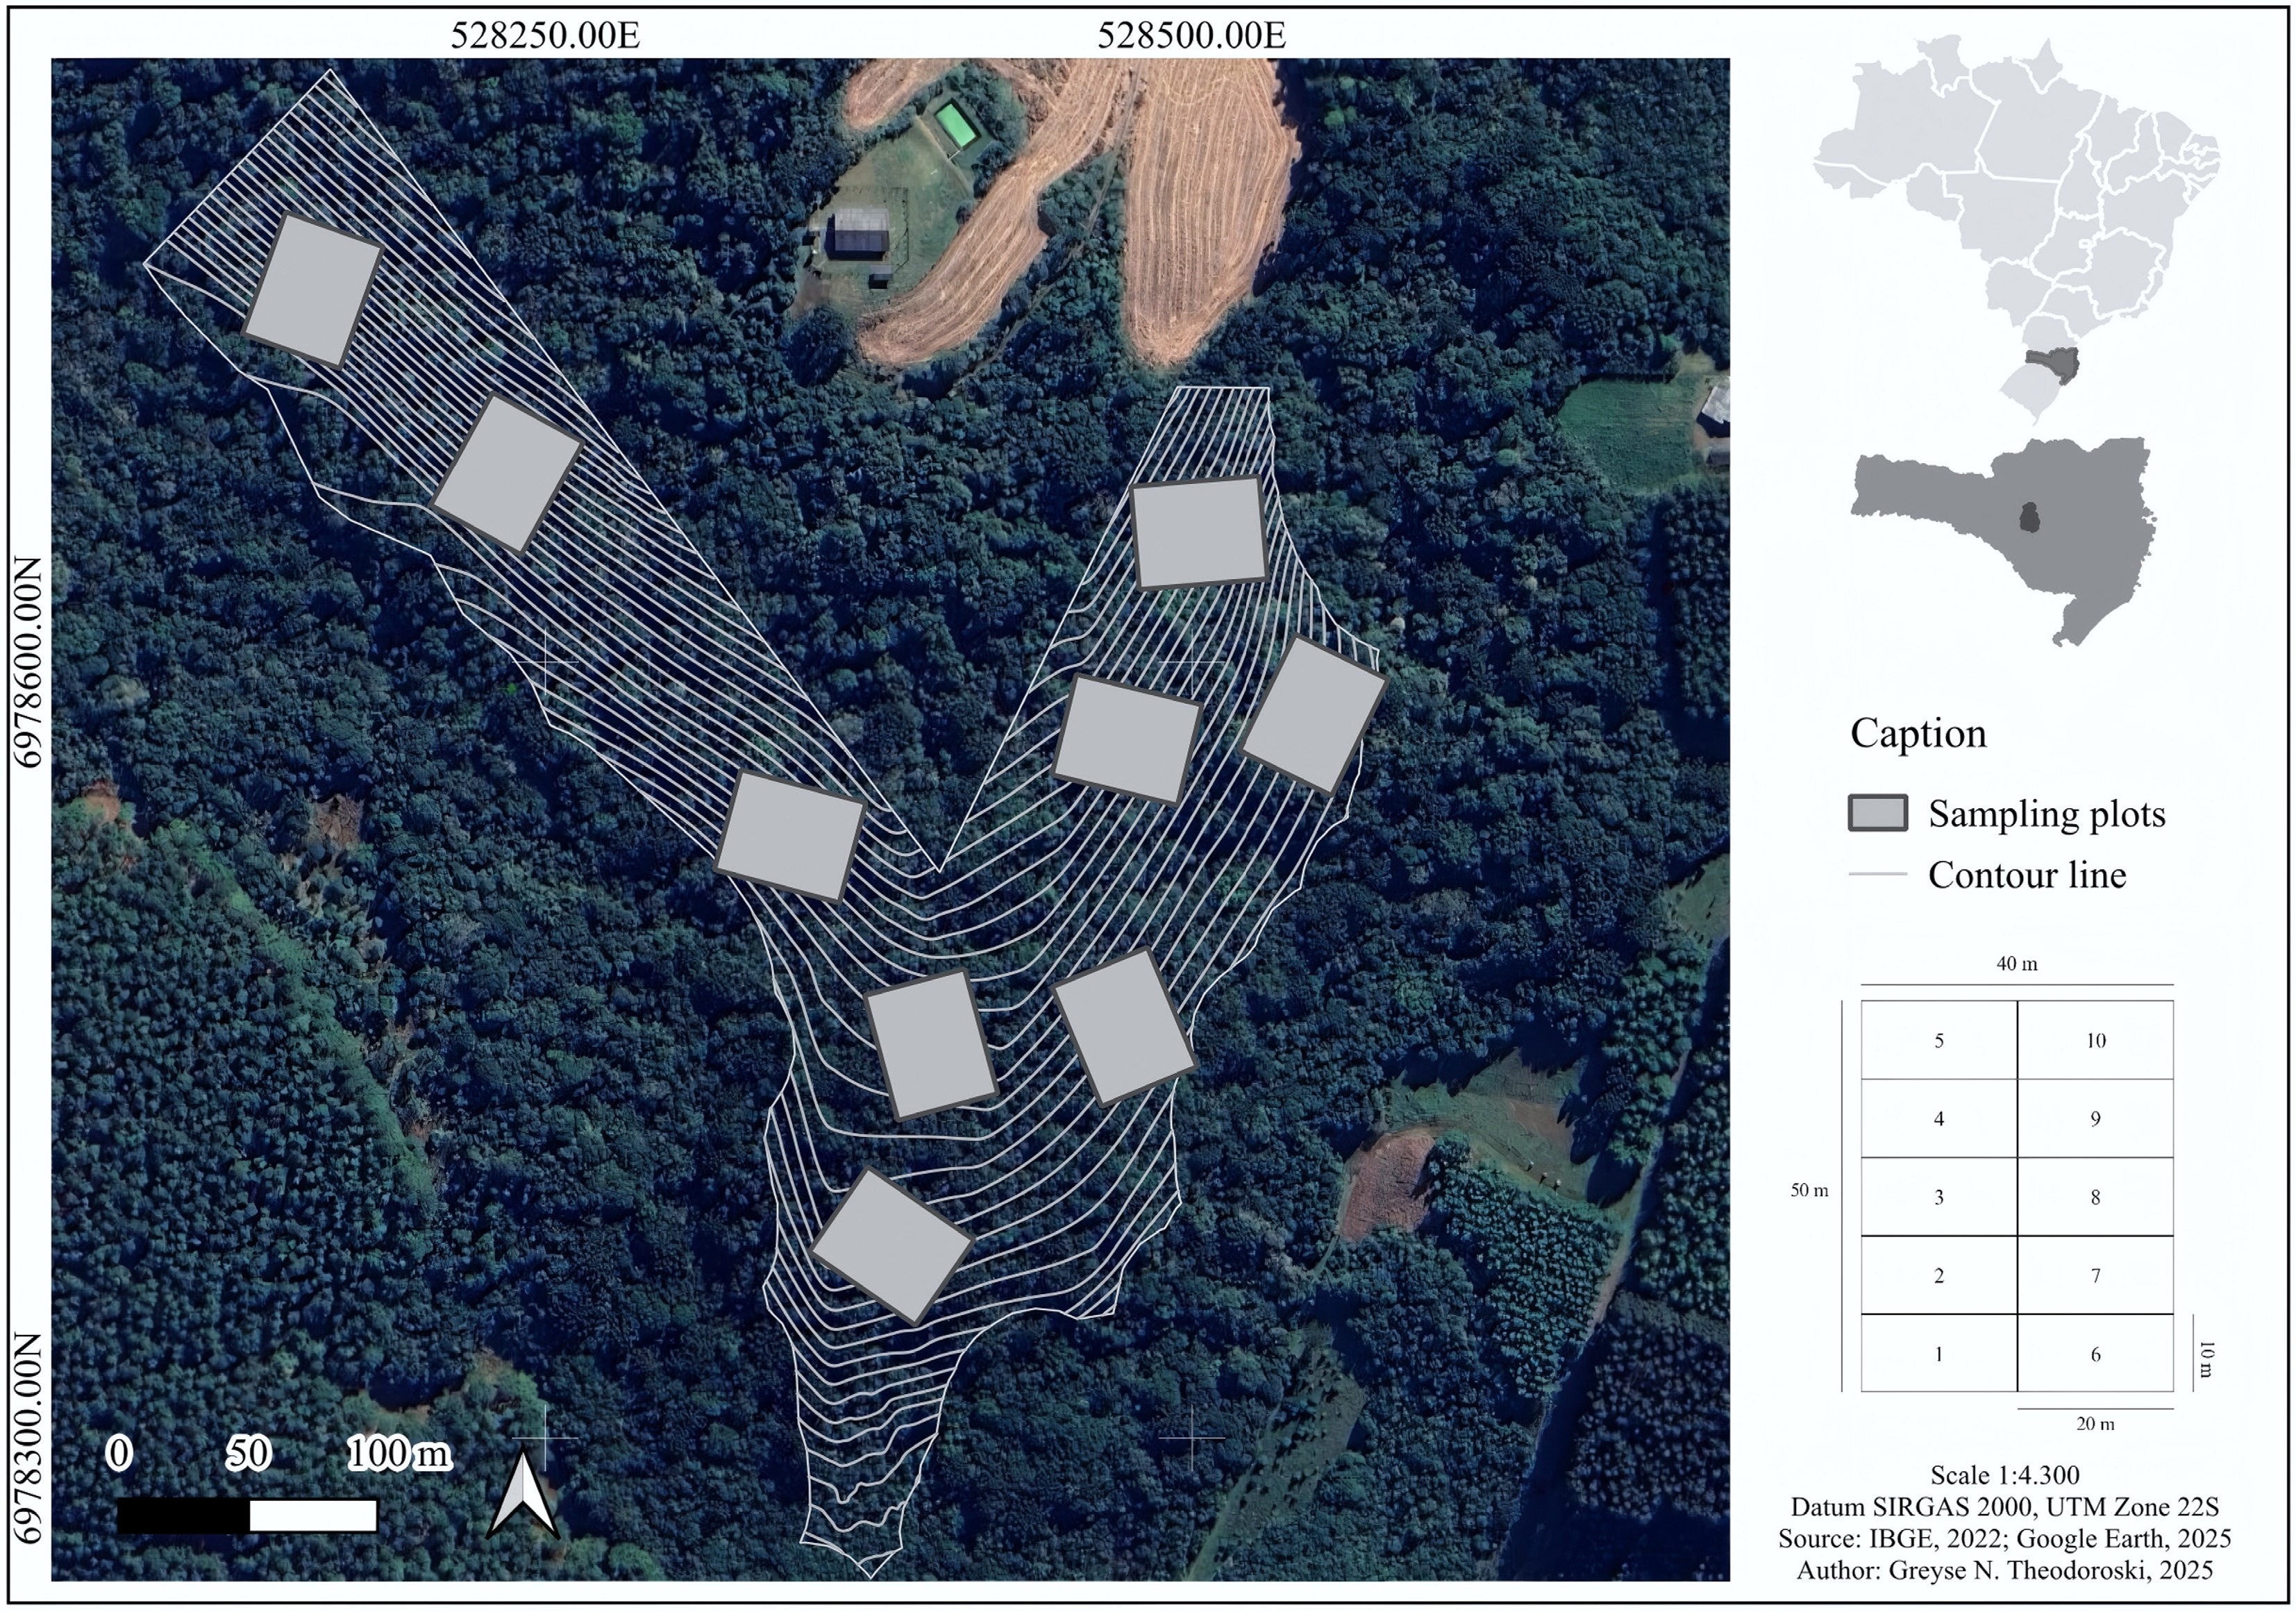
Figure 1.
Location of sampling plots in the study area, Curitibanos, Santa Catarina, Brazil. Top right: Brazil is shown in light gray and Santa Catarina state in dark gray. Center right: The county of Curitibanos in Santa Catarina. Left: field design of the sampling plots. The contour lines are spaced at 5 m.
-
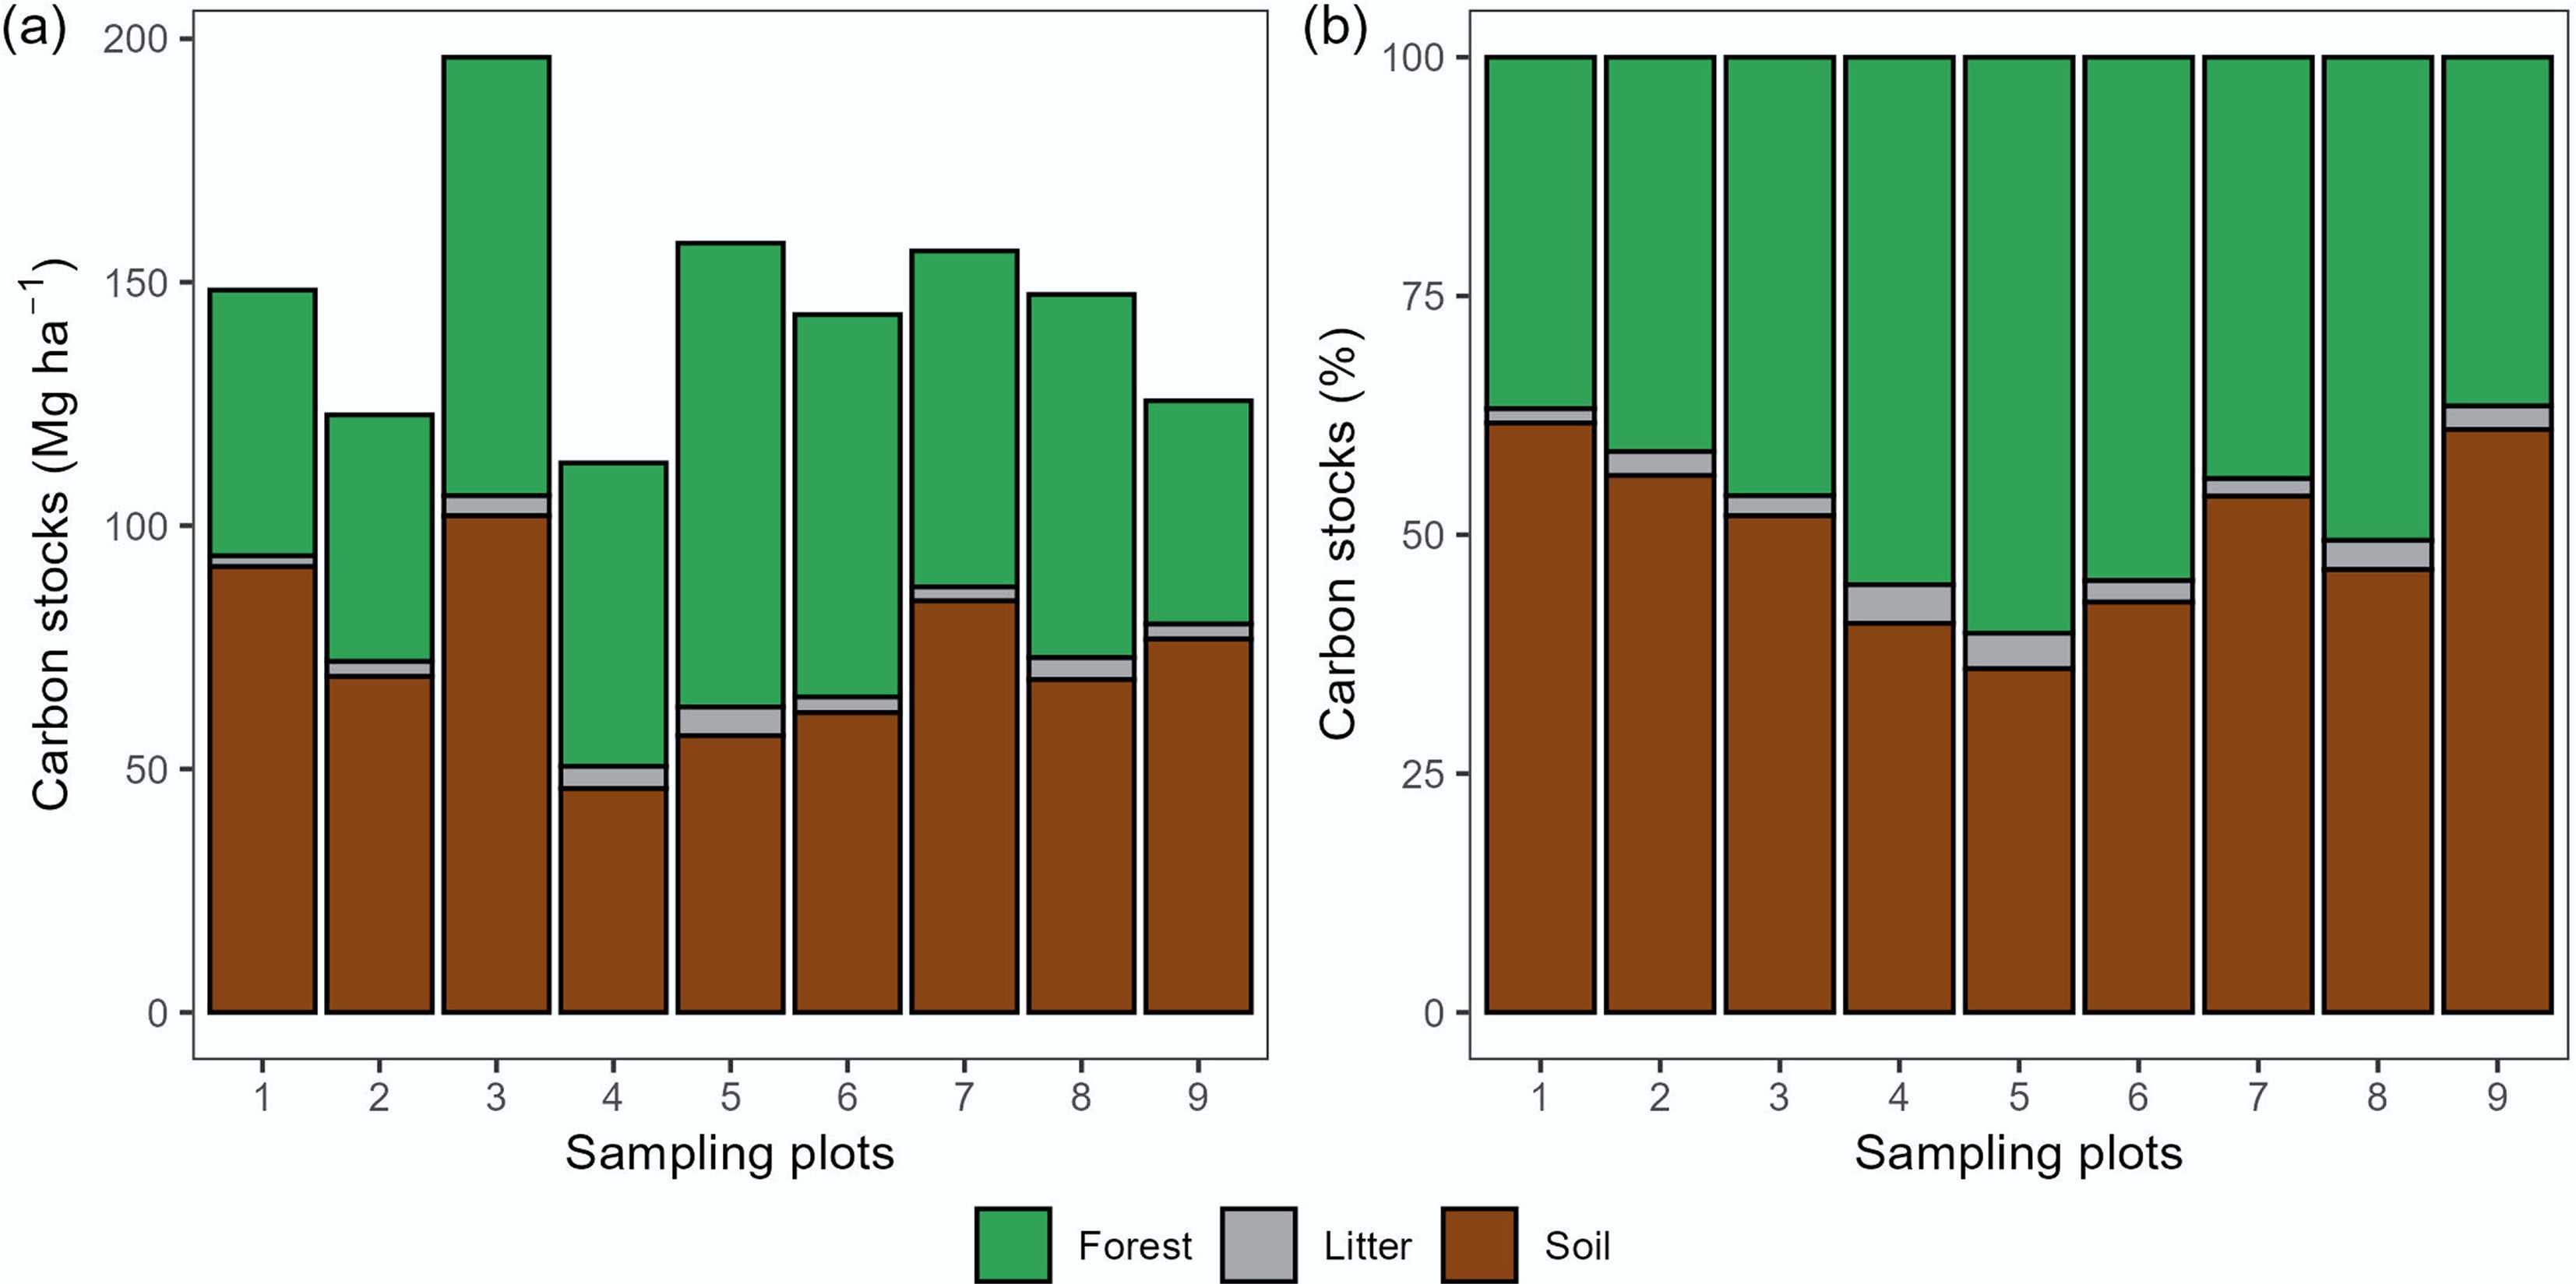
Figure 2.
Partitioning of carbon stocks in forest, litter, and soil by sampling plot in a MOF in southern Brazil.
-
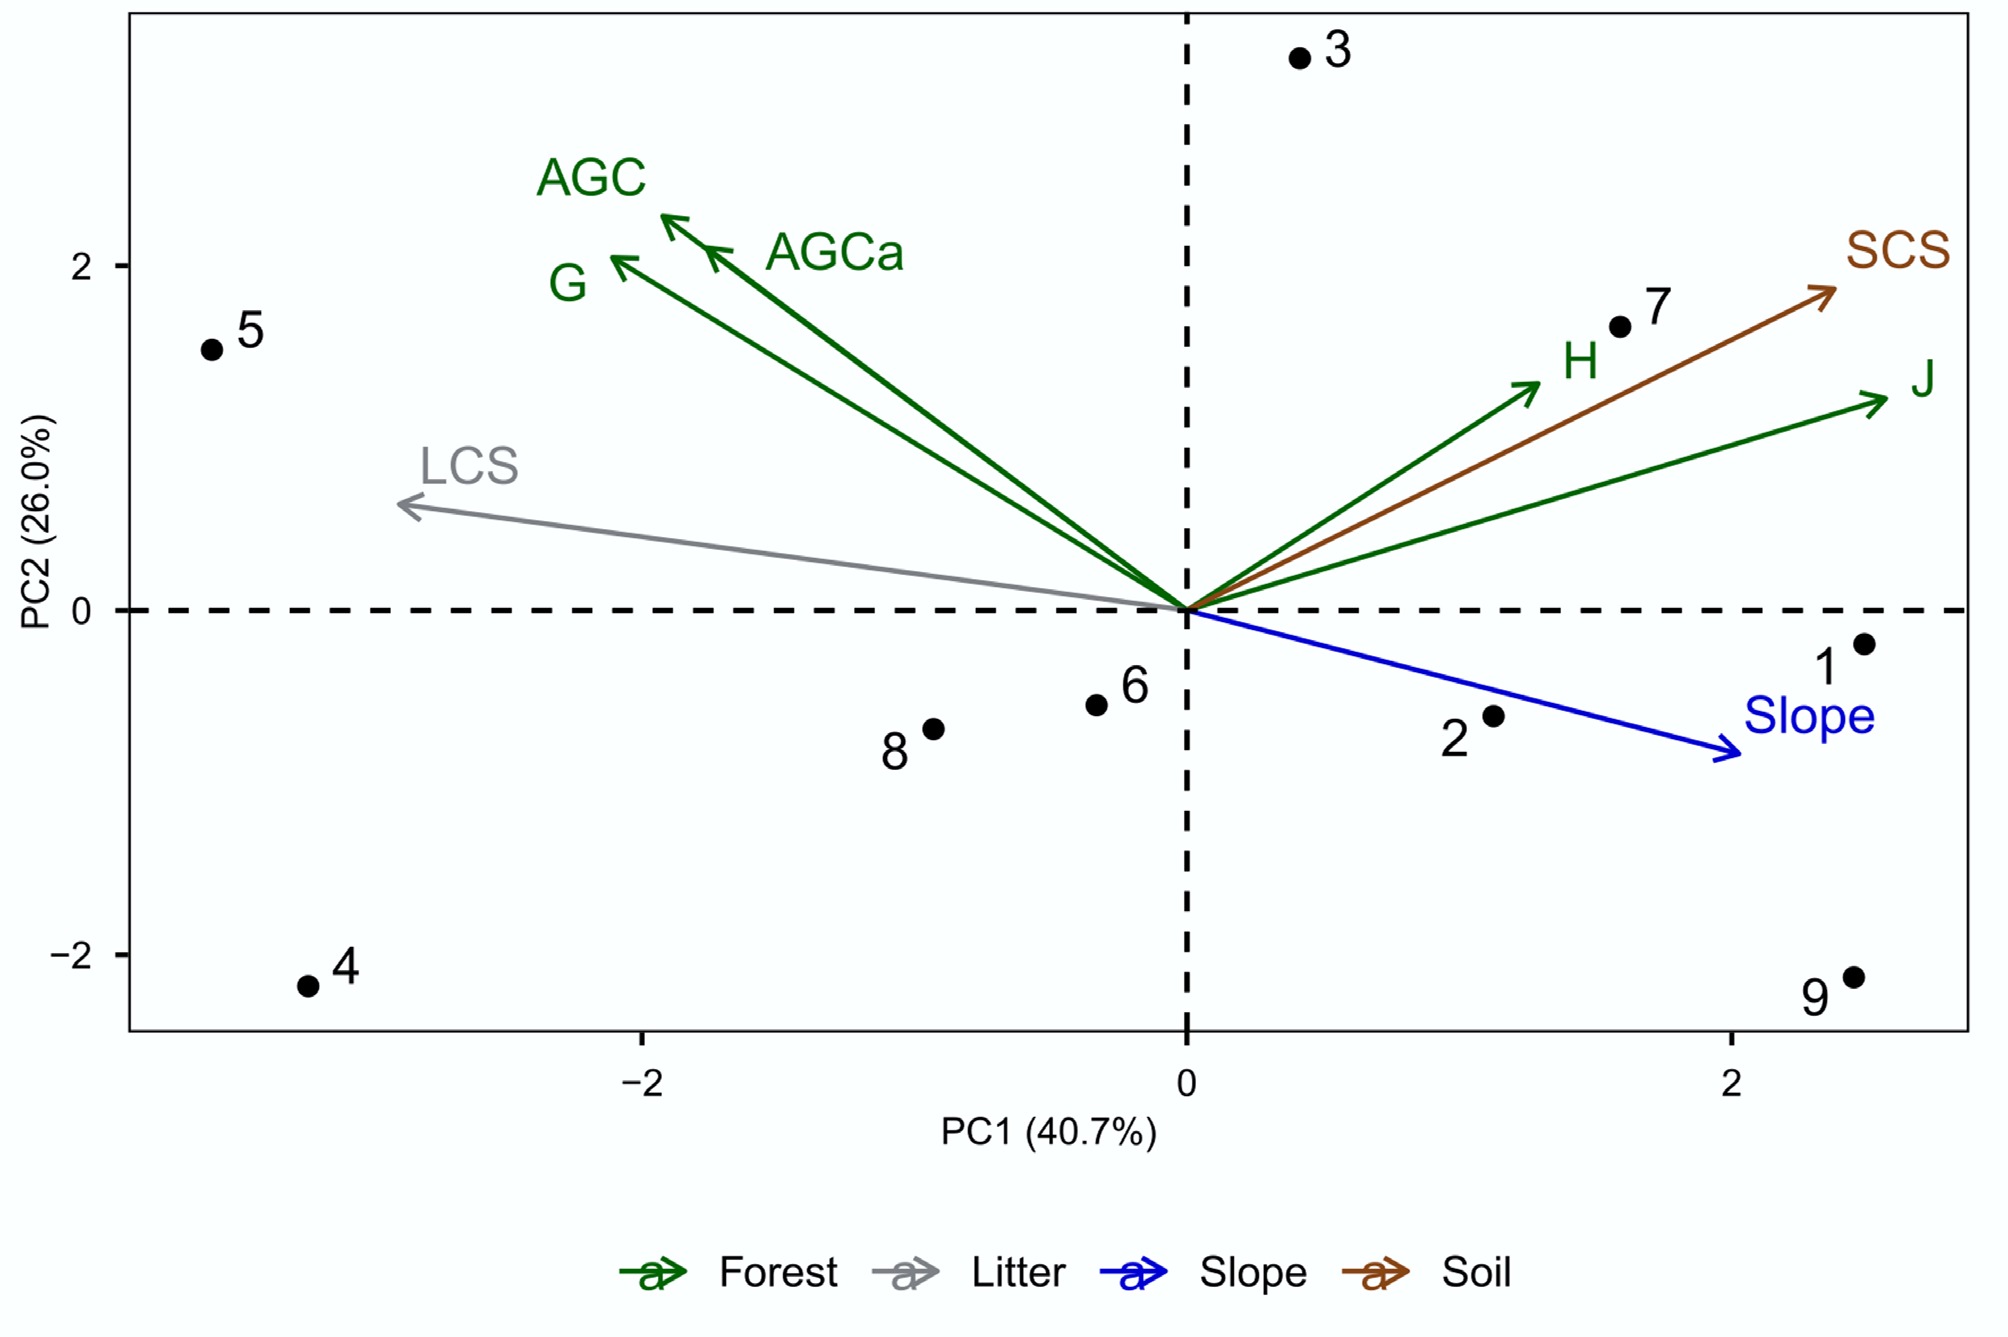
Figure 3.
Principal component analysis (PCA) for ordering the plots and variables in a MOF fragment in southern Brazil. G, stand basal area; H', Shannon's diversity index; J, Pielou's evenness index; AGC, aboveground carbon stock; AGCa, the AGC of Araucaria; LCS, litter carbon stock; SCS, soil carbon stock.
-
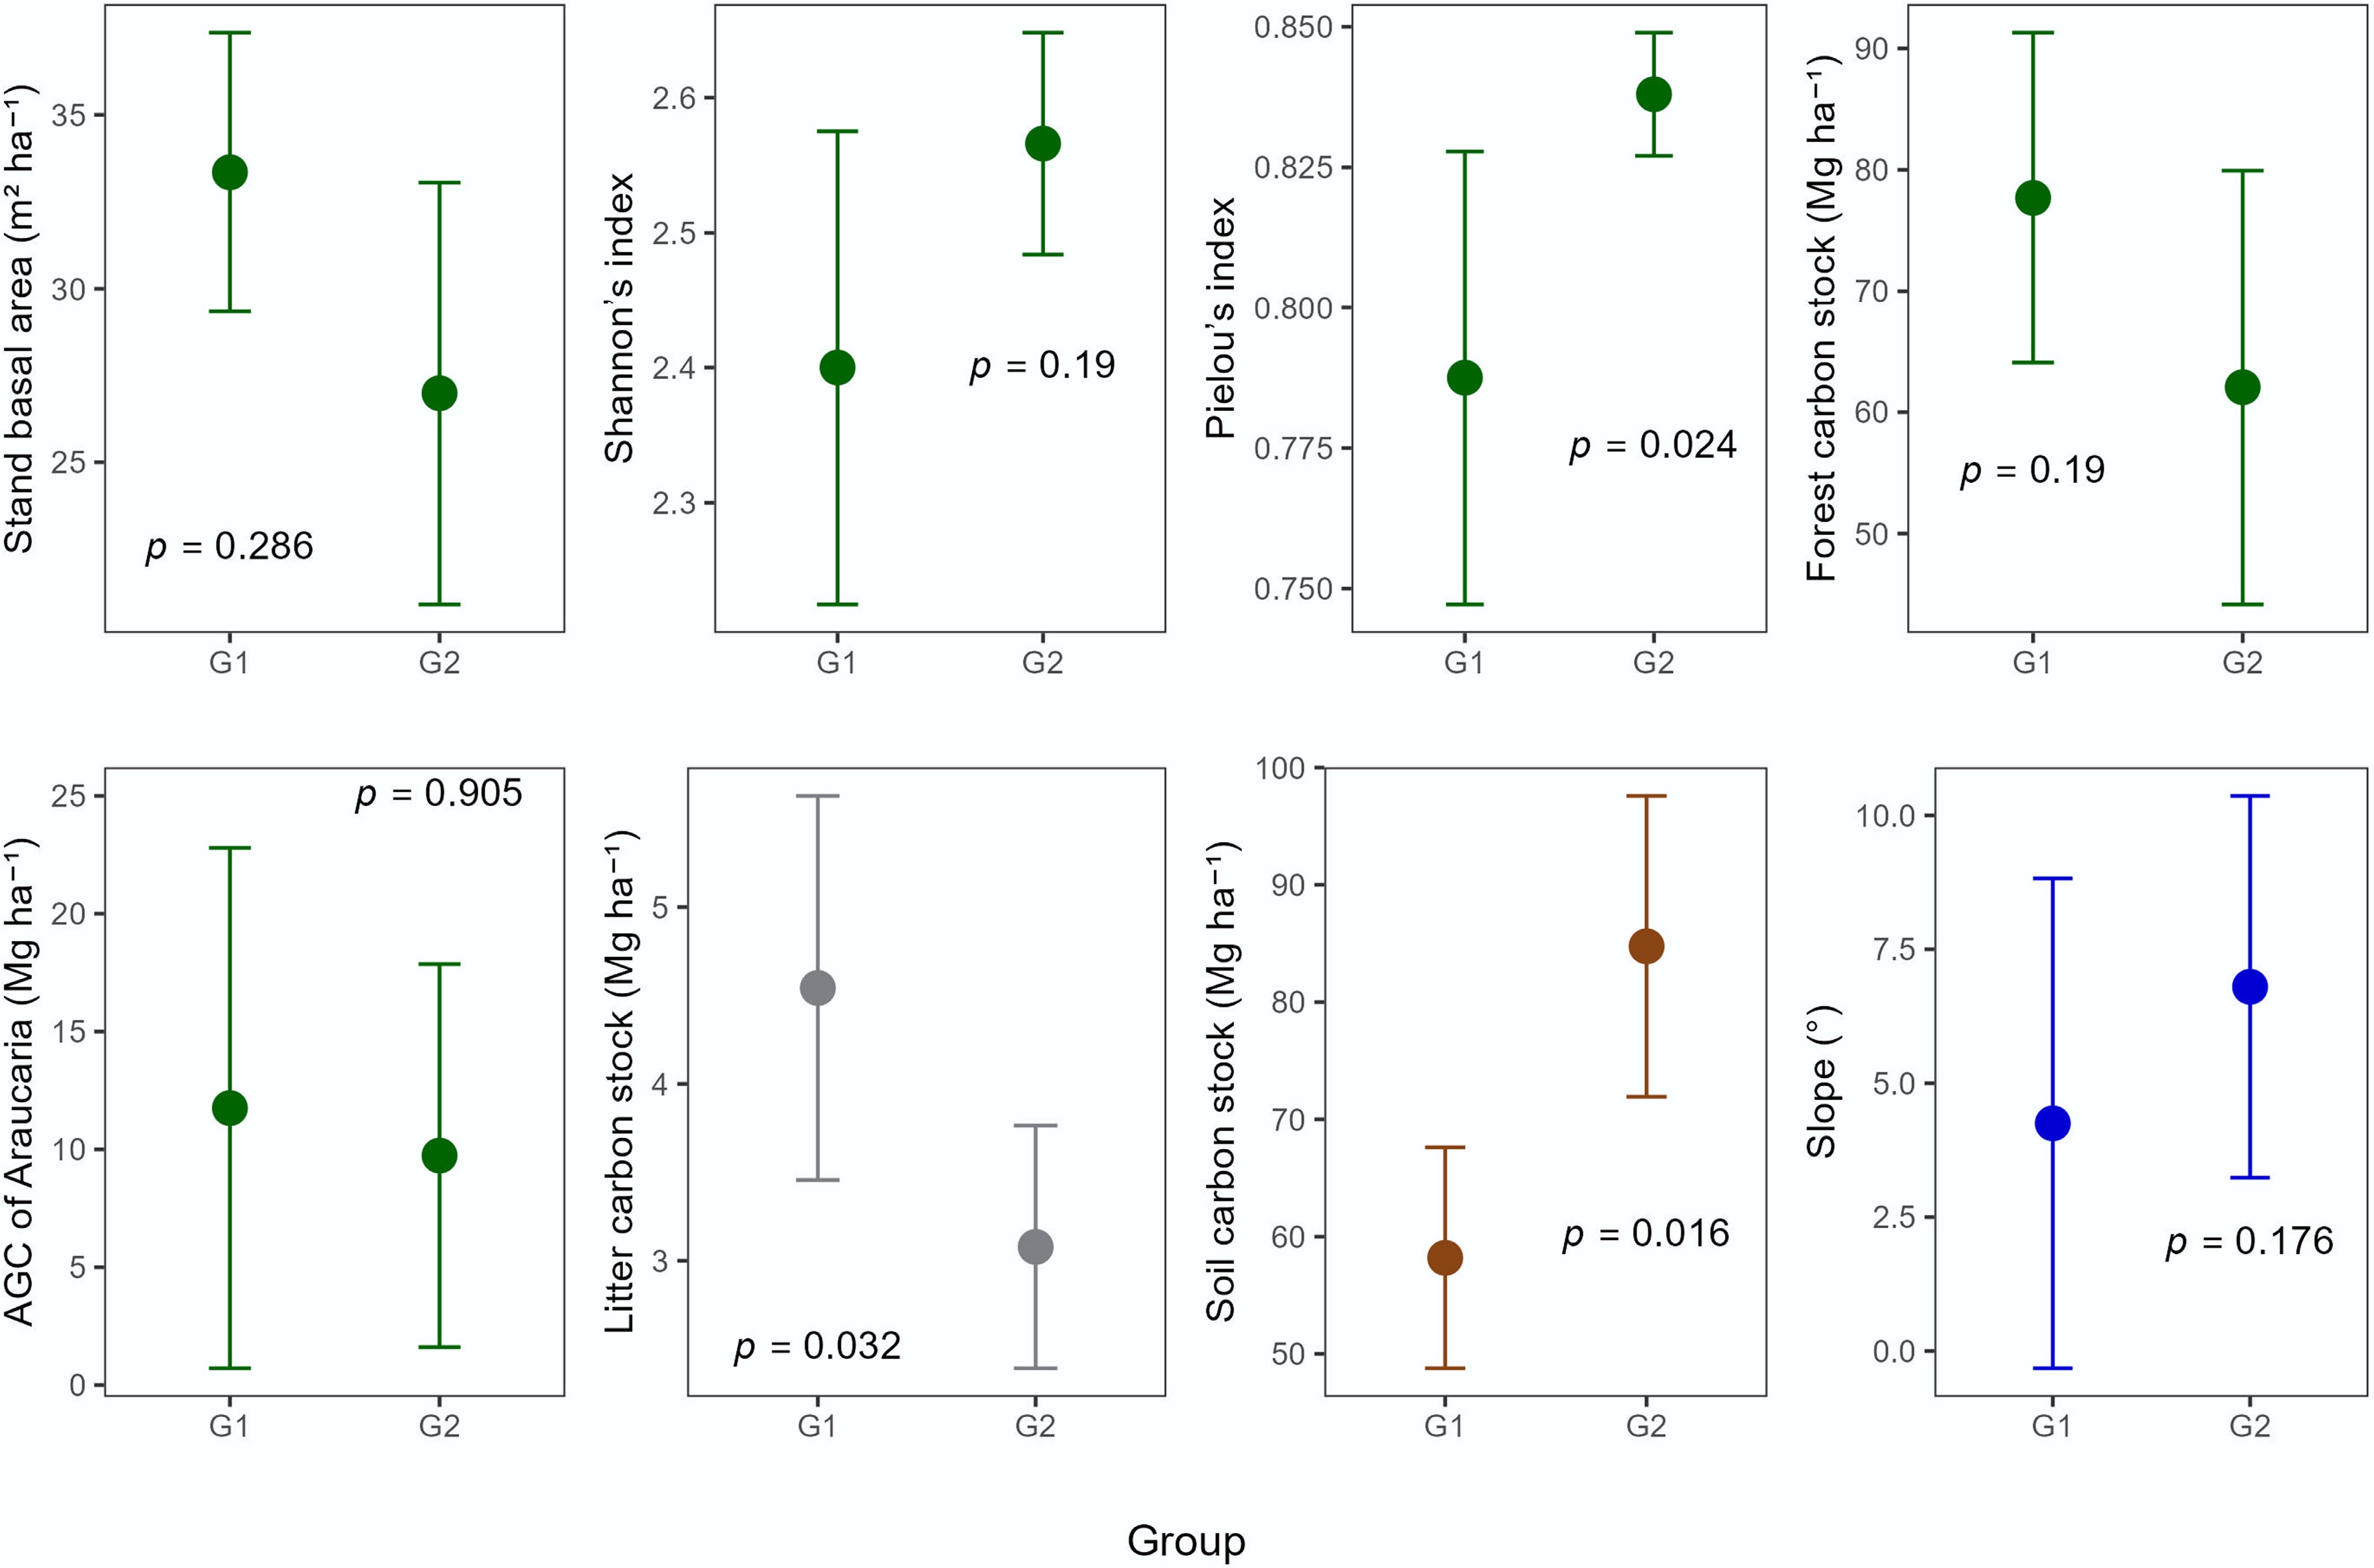
Figure 4.
Mean and standard deviation for the variables by plot groups (G1 and G2) in a MOF in southern Brazil. The p-value is based on the Mann–Whitney test at the 5% significance level. AGC, aboveground carbon stock; G1, Plots 4, 5, 6, and 8; G2, Plots 1, 2, 3, 7, and 9.
-
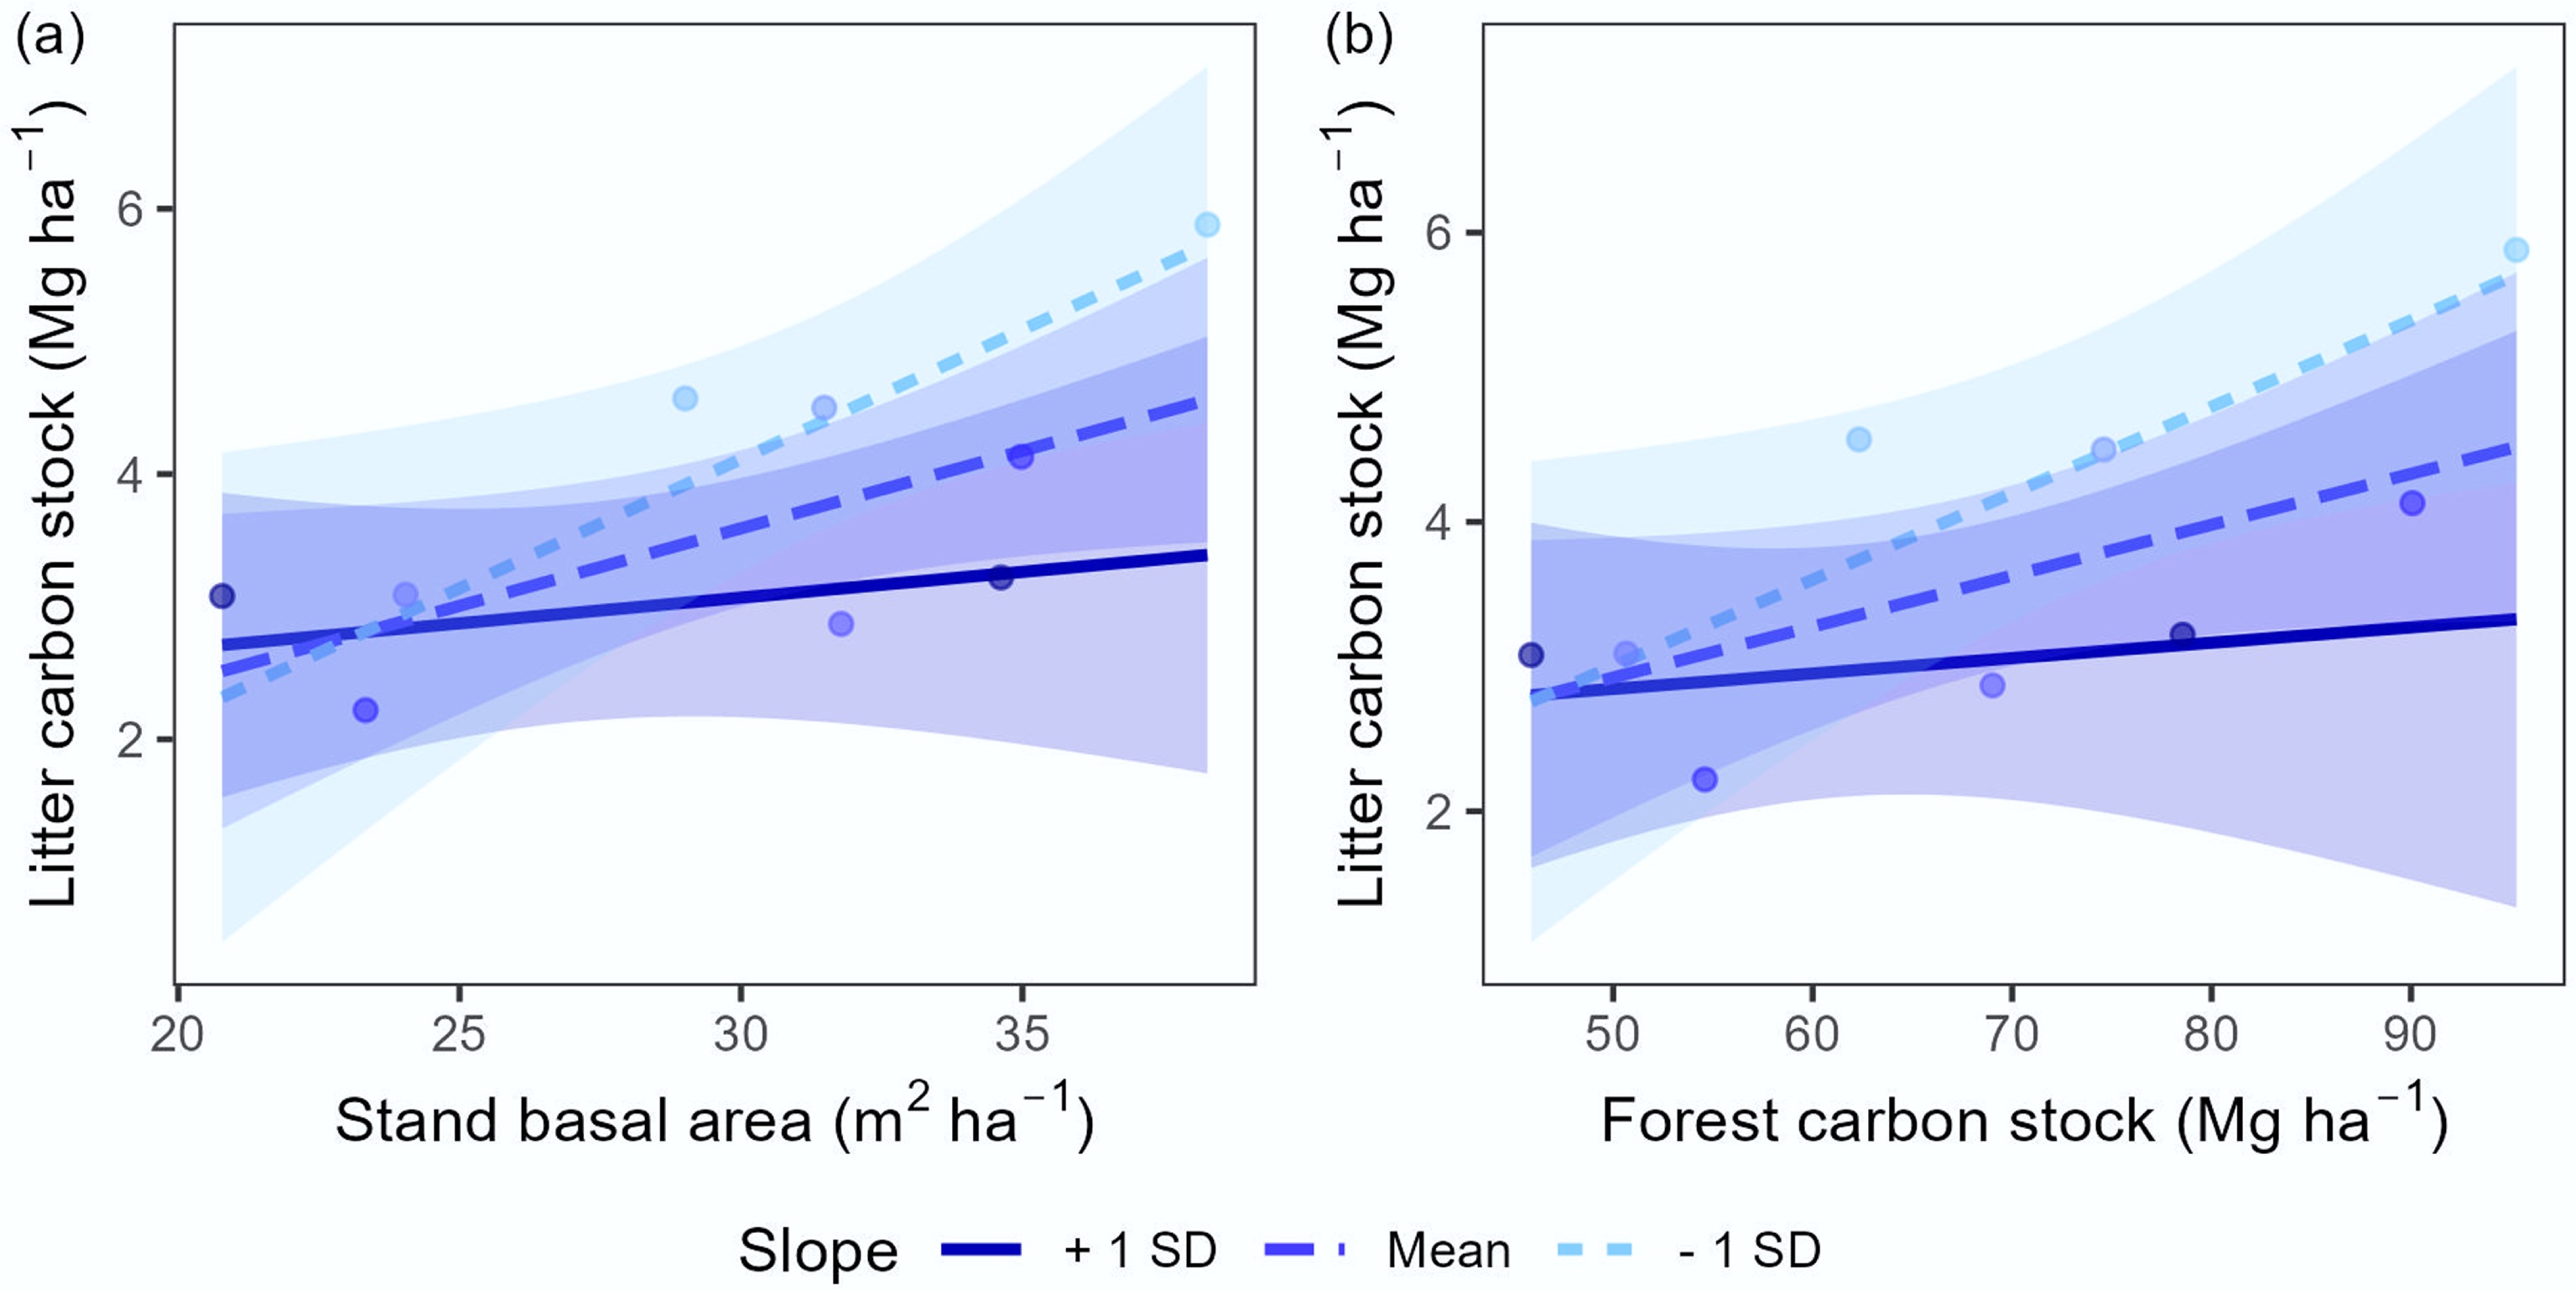
Figure 5.
Conditional effects of slope combined with (a) the stand basal area and (b) forest carbon on LCS in a MOF in southern Brazil. The shaded areas around the regression lines represent the 95% confidence intervals and SD denotes the standard deviation for the low, mean, and high slope lines.
-
Descriptor Forest structure Species diversity Carbon stocks Stand basal area Shannon's index Pielou's index Forest Araucaria Litter Soil at 0.10 m Soil at 0.20 m Soil at 0.30 m Soil total Mean 29.8 2.49 0.82 69.0 10.6 3.7 28.0 22.3 22.6 73.0 Min. 20.8 2.26 0.73 45.9 0.5 2.2 16.8 17.4 11.2 46.0 Max. 38.3 2.67 0.85 95.3 25.9 5.9 41.7 32.9 40.3 102.0 SD 6.0 0.15 0.04 17.3 8.9 1.1 10.2 5.6 9.0 17.7 CV% 20.1 6.02 4.88 25.0 84.1 30.3 36.6 24.9 39.7 24.2 RSE% 15.4 4.63 3.48 19.2 64.6 23.3 28.1 19.2 30.5 18.6 SD, standard deviation; CV%, relative coefficient of variation; RSE%, relative sampling error. Basal area is expressed in m2 ha−1 and carbon stocks in Mg ha−1. Table 1.
Summary of variables on forest structure, species diversity, and carbon stocks in a MOF fragment in southern Brazil
-
Response Predictor F Df p-value R² RSE LCS G 5.67 7 0.042 0.447 0.897 G × slope 6.26 5 0.038 0.789 0.654 AGC 6.32 7 0.040 0.474 0.875 AGC × slope 5.42 5 0.041 0.764 0.692 AGCa 4.38 7 0.074 0.385 0.946 AGCa × slope 2.99 5 0.134 0.428 0.853 SCS J 9.19 7 0.019 0.567 12.41 J × slope 2.23 5 0.2025 0.572 14.60 H' 0.835 7 0.391 0.106 17.84 H' × slope 0.531 5 0.680 0.241 19.44 LCS 2.46 7 0.161 0.260 16.23 LCS × slope 0.902 5 0.501 0.351 17.98 G, stand basal area; AGC, aboveground carbon stock; AGCa, the AGC of Araucaria; J, Pielou's evenness index; H', Shannon's diversity index; LCS, litter carbon stock; F, F-statistic; Df, the model's degrees of freedom; R², coefficient of determination; RSE, residual standard error. The p-value is for the fitted model. Table 2.
Linear models to test the effect of predictors on LCS and SCS in a MOF fragment in southern Brazil
Figures
(5)
Tables
(2)