-
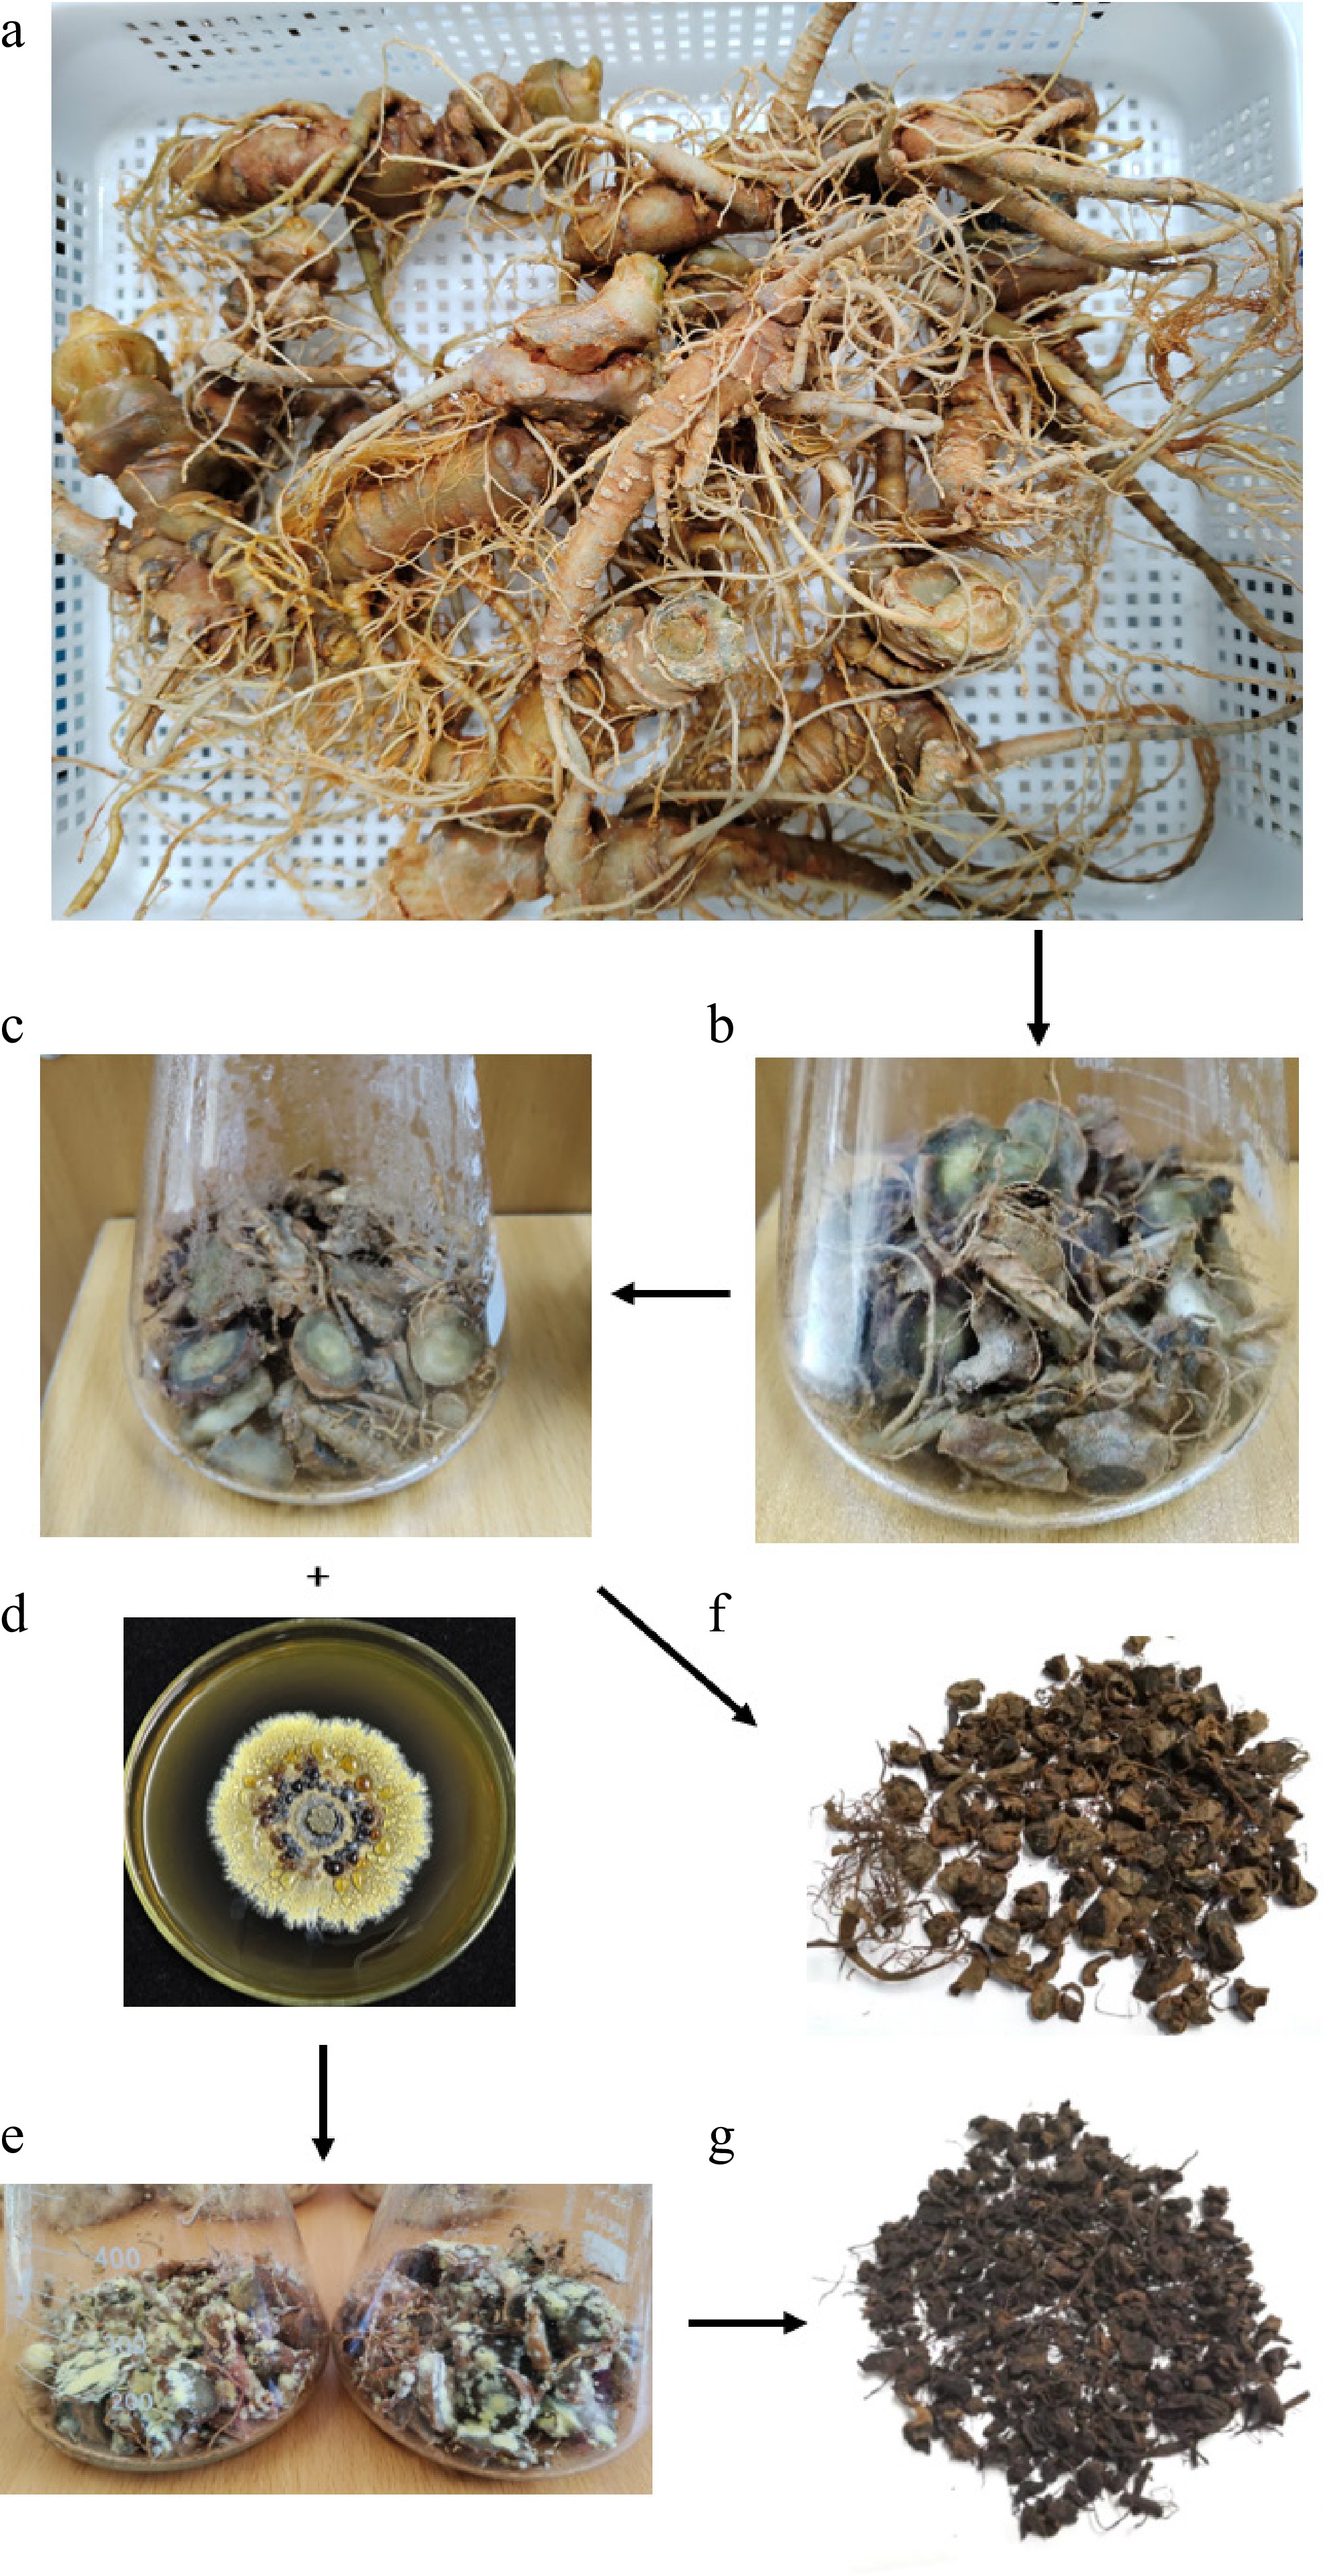
Figure 1.
The production process and characteristics of A. cristatus fermented with P. notoginseng. (a)−(g) Schematic of the production process of P. notoginseng upon A. cristatus treatment. (g) Fermented (SJ), and (f) the untreated control samples (SCK).
-
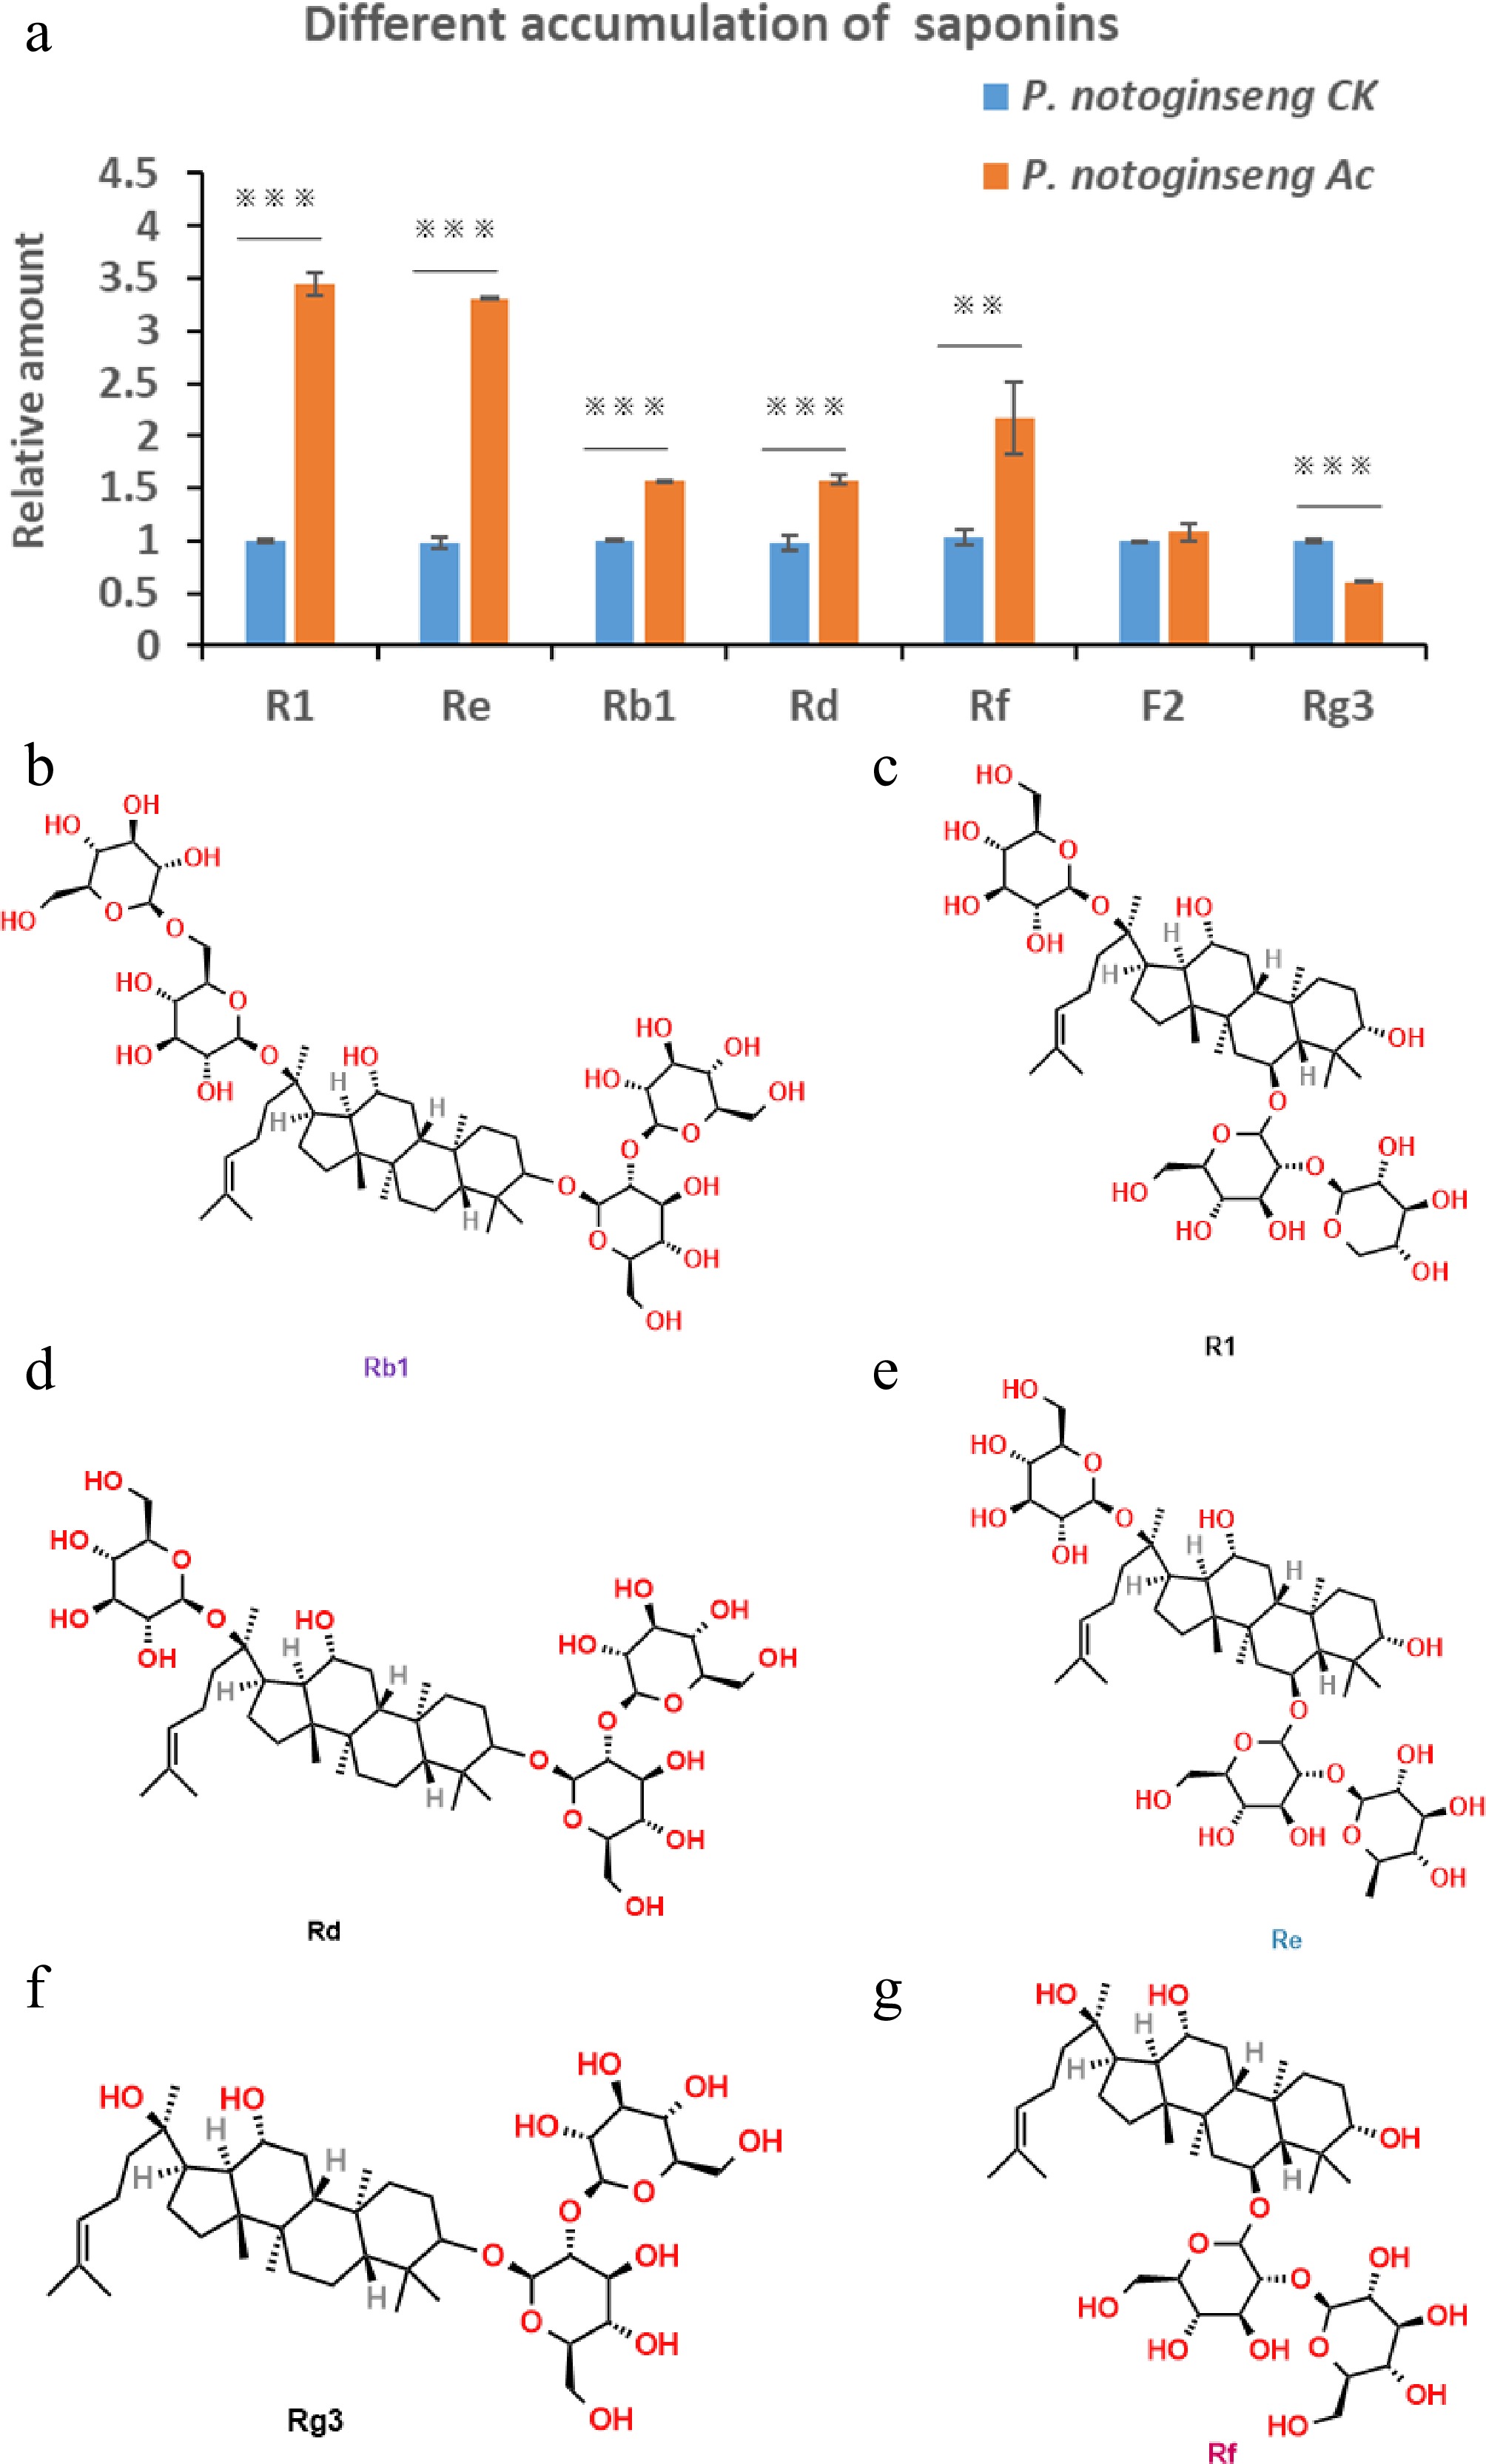
Figure 2.
Differentially accumulated Sanqi saponins in P. notoginseng CK (SCK) and P. notoginseng Ac (SJ). (a) Relative amount of selected Sanqi saponins between SCK and SJ; ** p < 0.01; *** p < 0.001. (b)−(g) Structure of indicated Sanqi saponins.
-
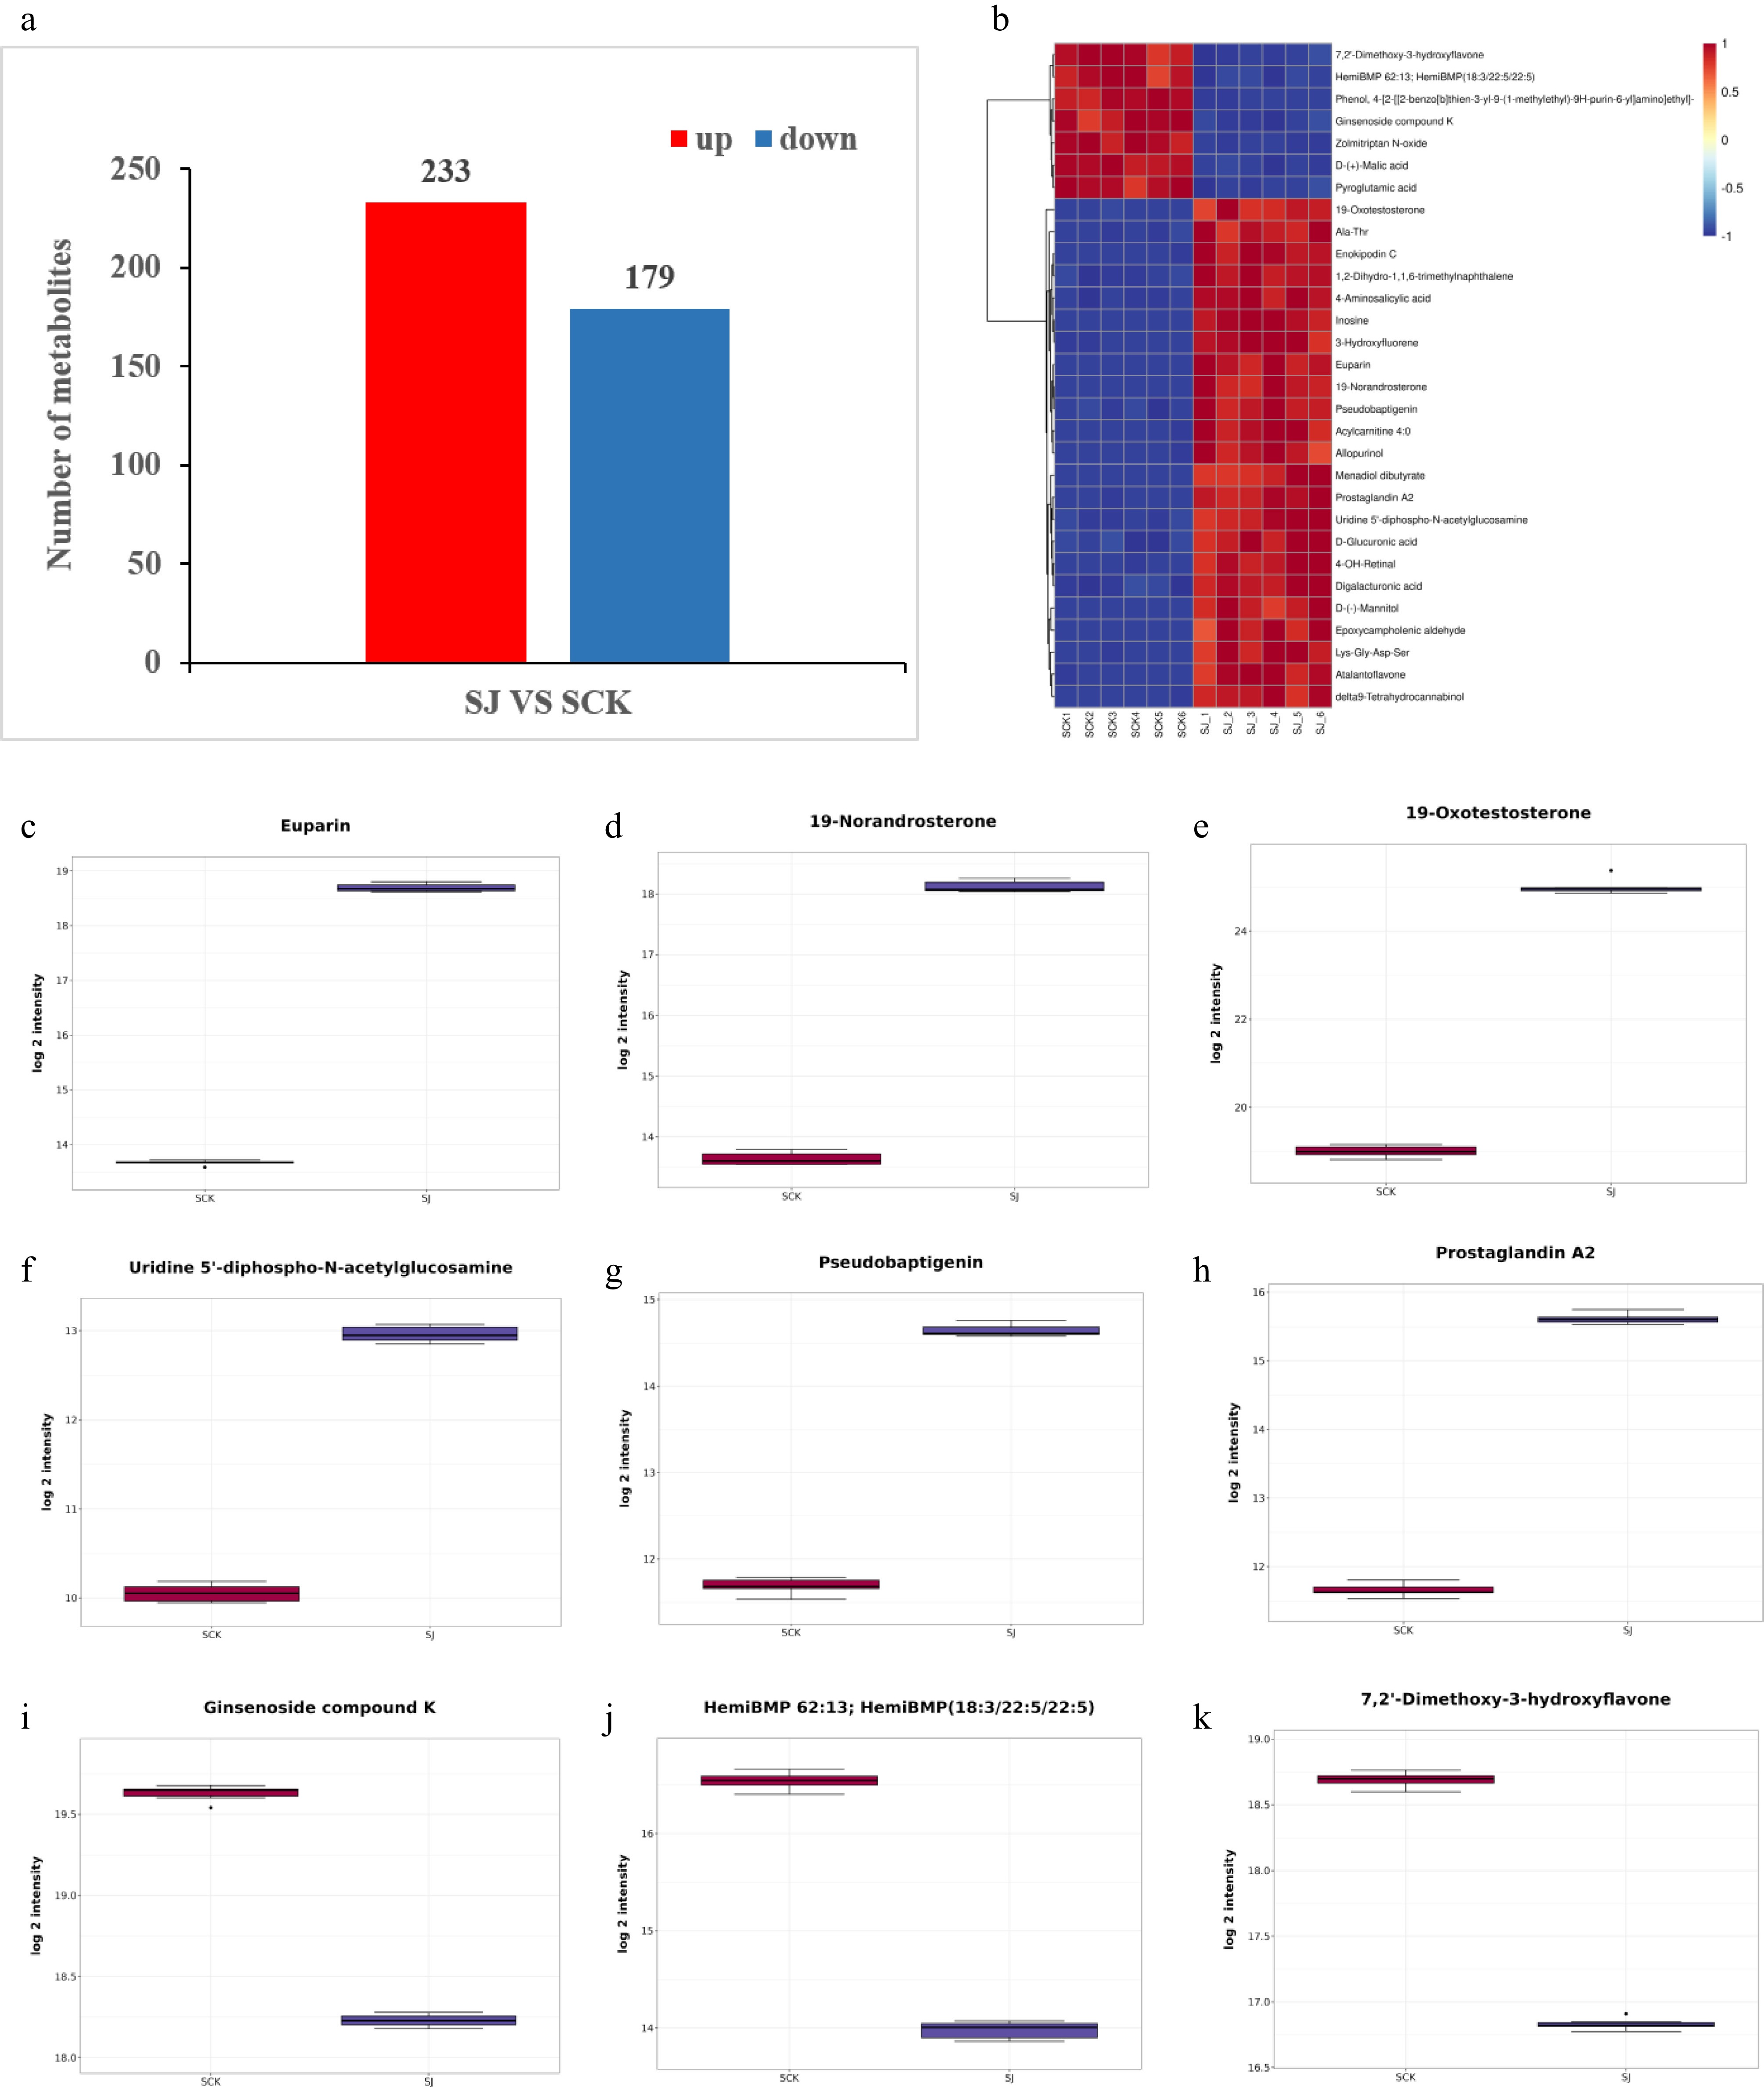
Figure 3.
Differentially accumulated metabolites in P. notoginseng during interaction with A. cristatus. (a) Numbers of differentially changed metabolites in A. cristatus treated P. notoginseng (SJ) and the untreated control (SCK). (b) The top differentially accumulated metabolites in P. notoginseng with or without A. cristatus treatment. (c)−(k) Differentially accumulated compounds in SCK and A. cristatus-treated P. notoginseng (SJ).
-
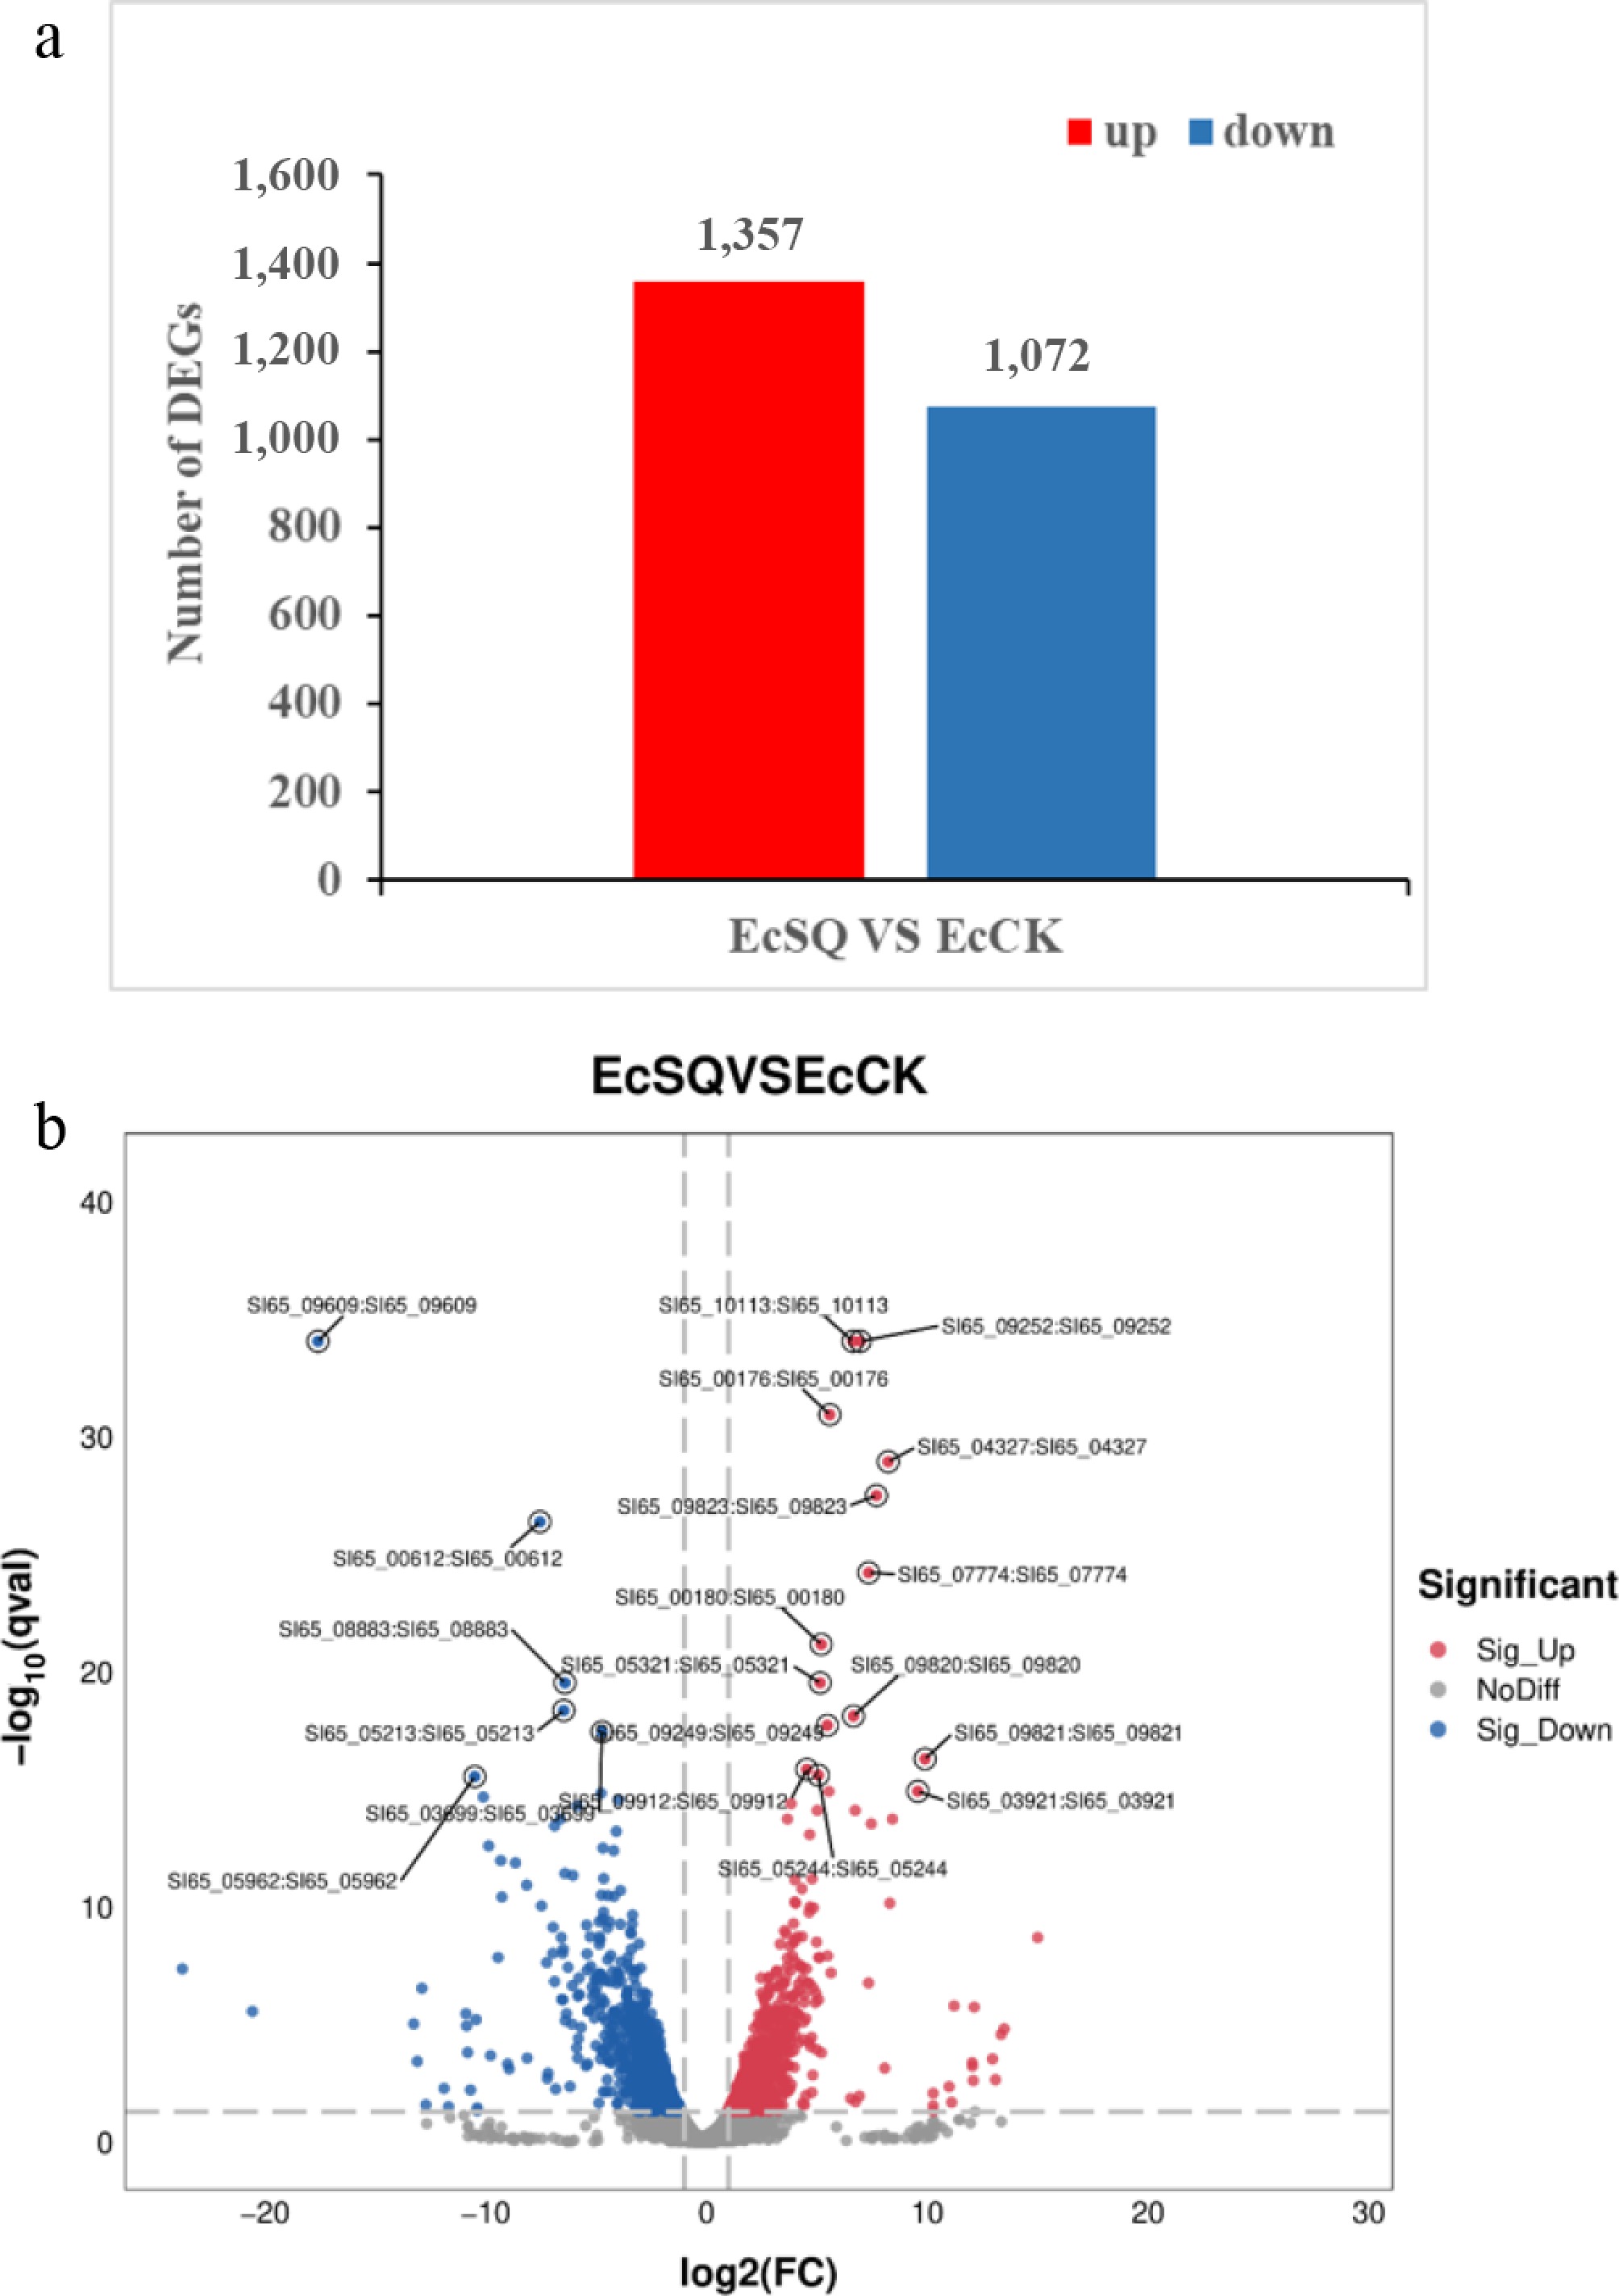
Figure 4.
Identification of the differentially expressed genes (DEGs) between EcCK and EcSQ. (a) Numbers of significantly differentially expressed genes (
$ \left| {\log }_{2} FC\right| \geq 1 $ -
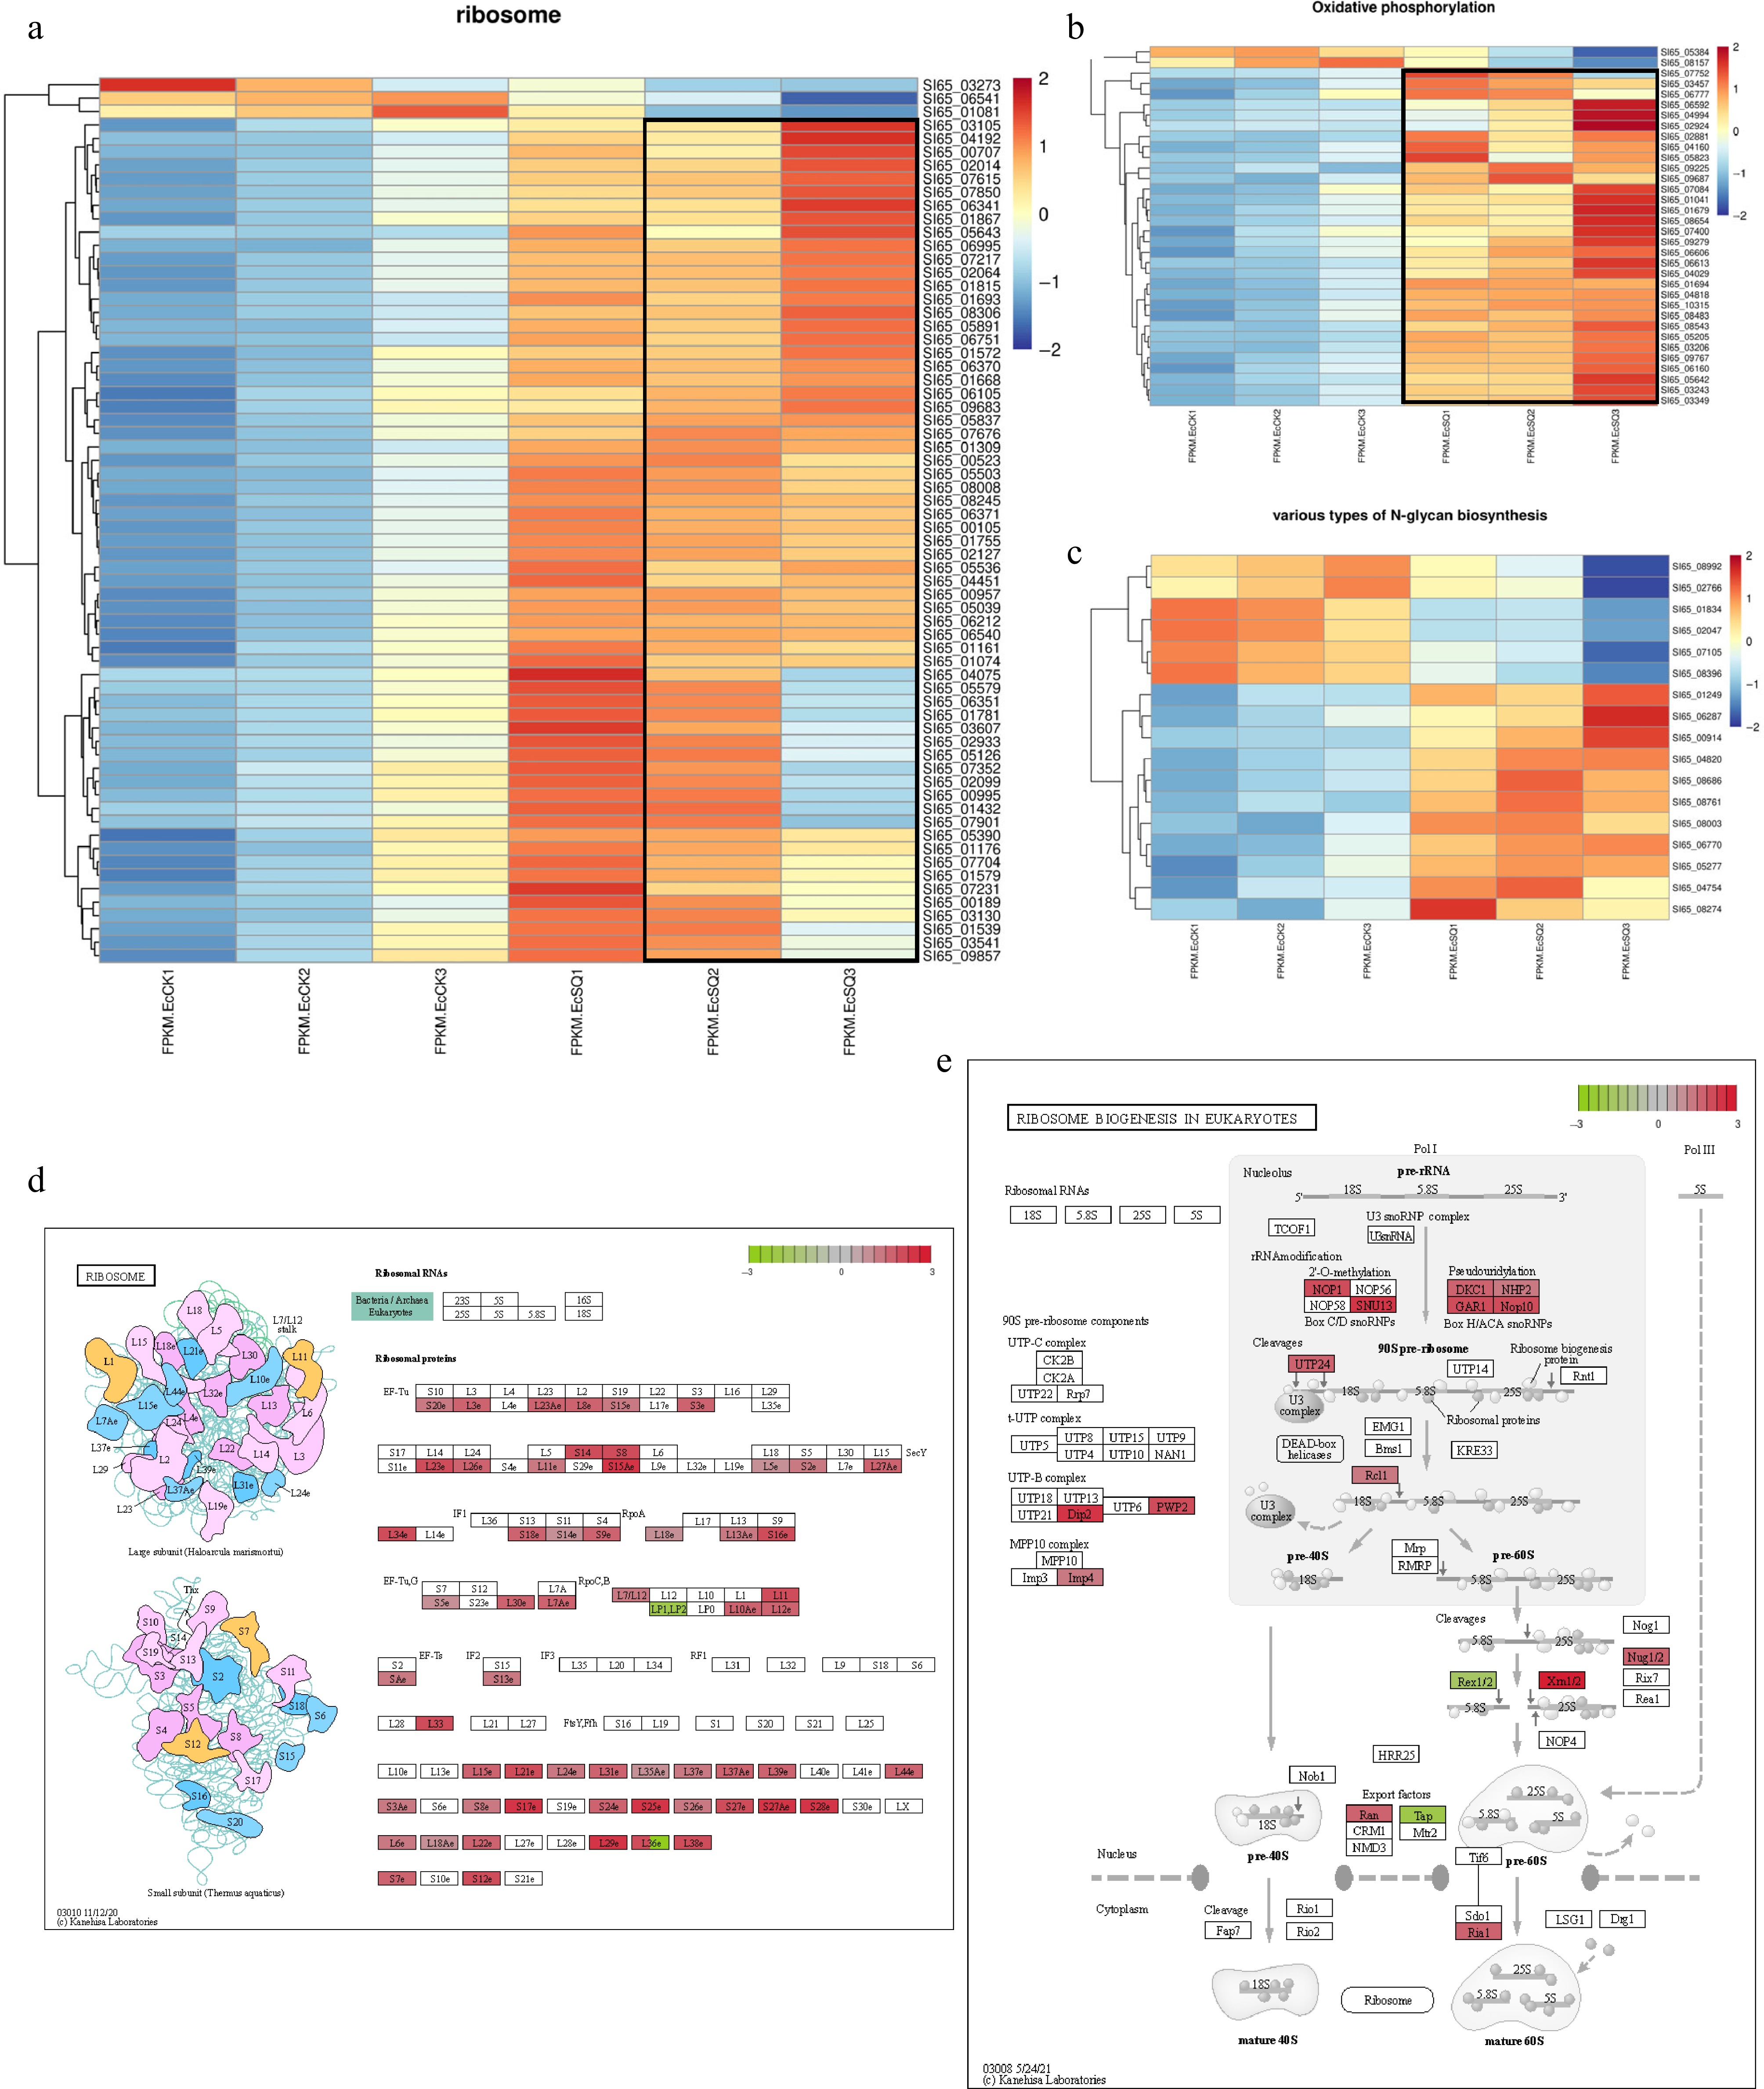
Figure 5.
Differentially expressed genes (DEGs) in A. cristatus during fermentation with P. notoginseng. (a) Heatmap analysis of DEGs in A. cristatus associated with the ribosome. (b) Heatmap analysis of DEGs in A. cristatus associated with oxidative phosphorylation. (c) Heatmap analysis of DEGs in A. cristatus involved in various type of N-glycan biosynthesis. (d) KEGG view of DEGs in ribosome pathway (map03010). (e) KEGG view of DEGs in ribosome biosynthesis pathway (map03008). KEGG pathway maps in (d) and (e)were reprinted with permission from Kanehisa Laboratories.
Figures
(5)
Tables
(0)