-
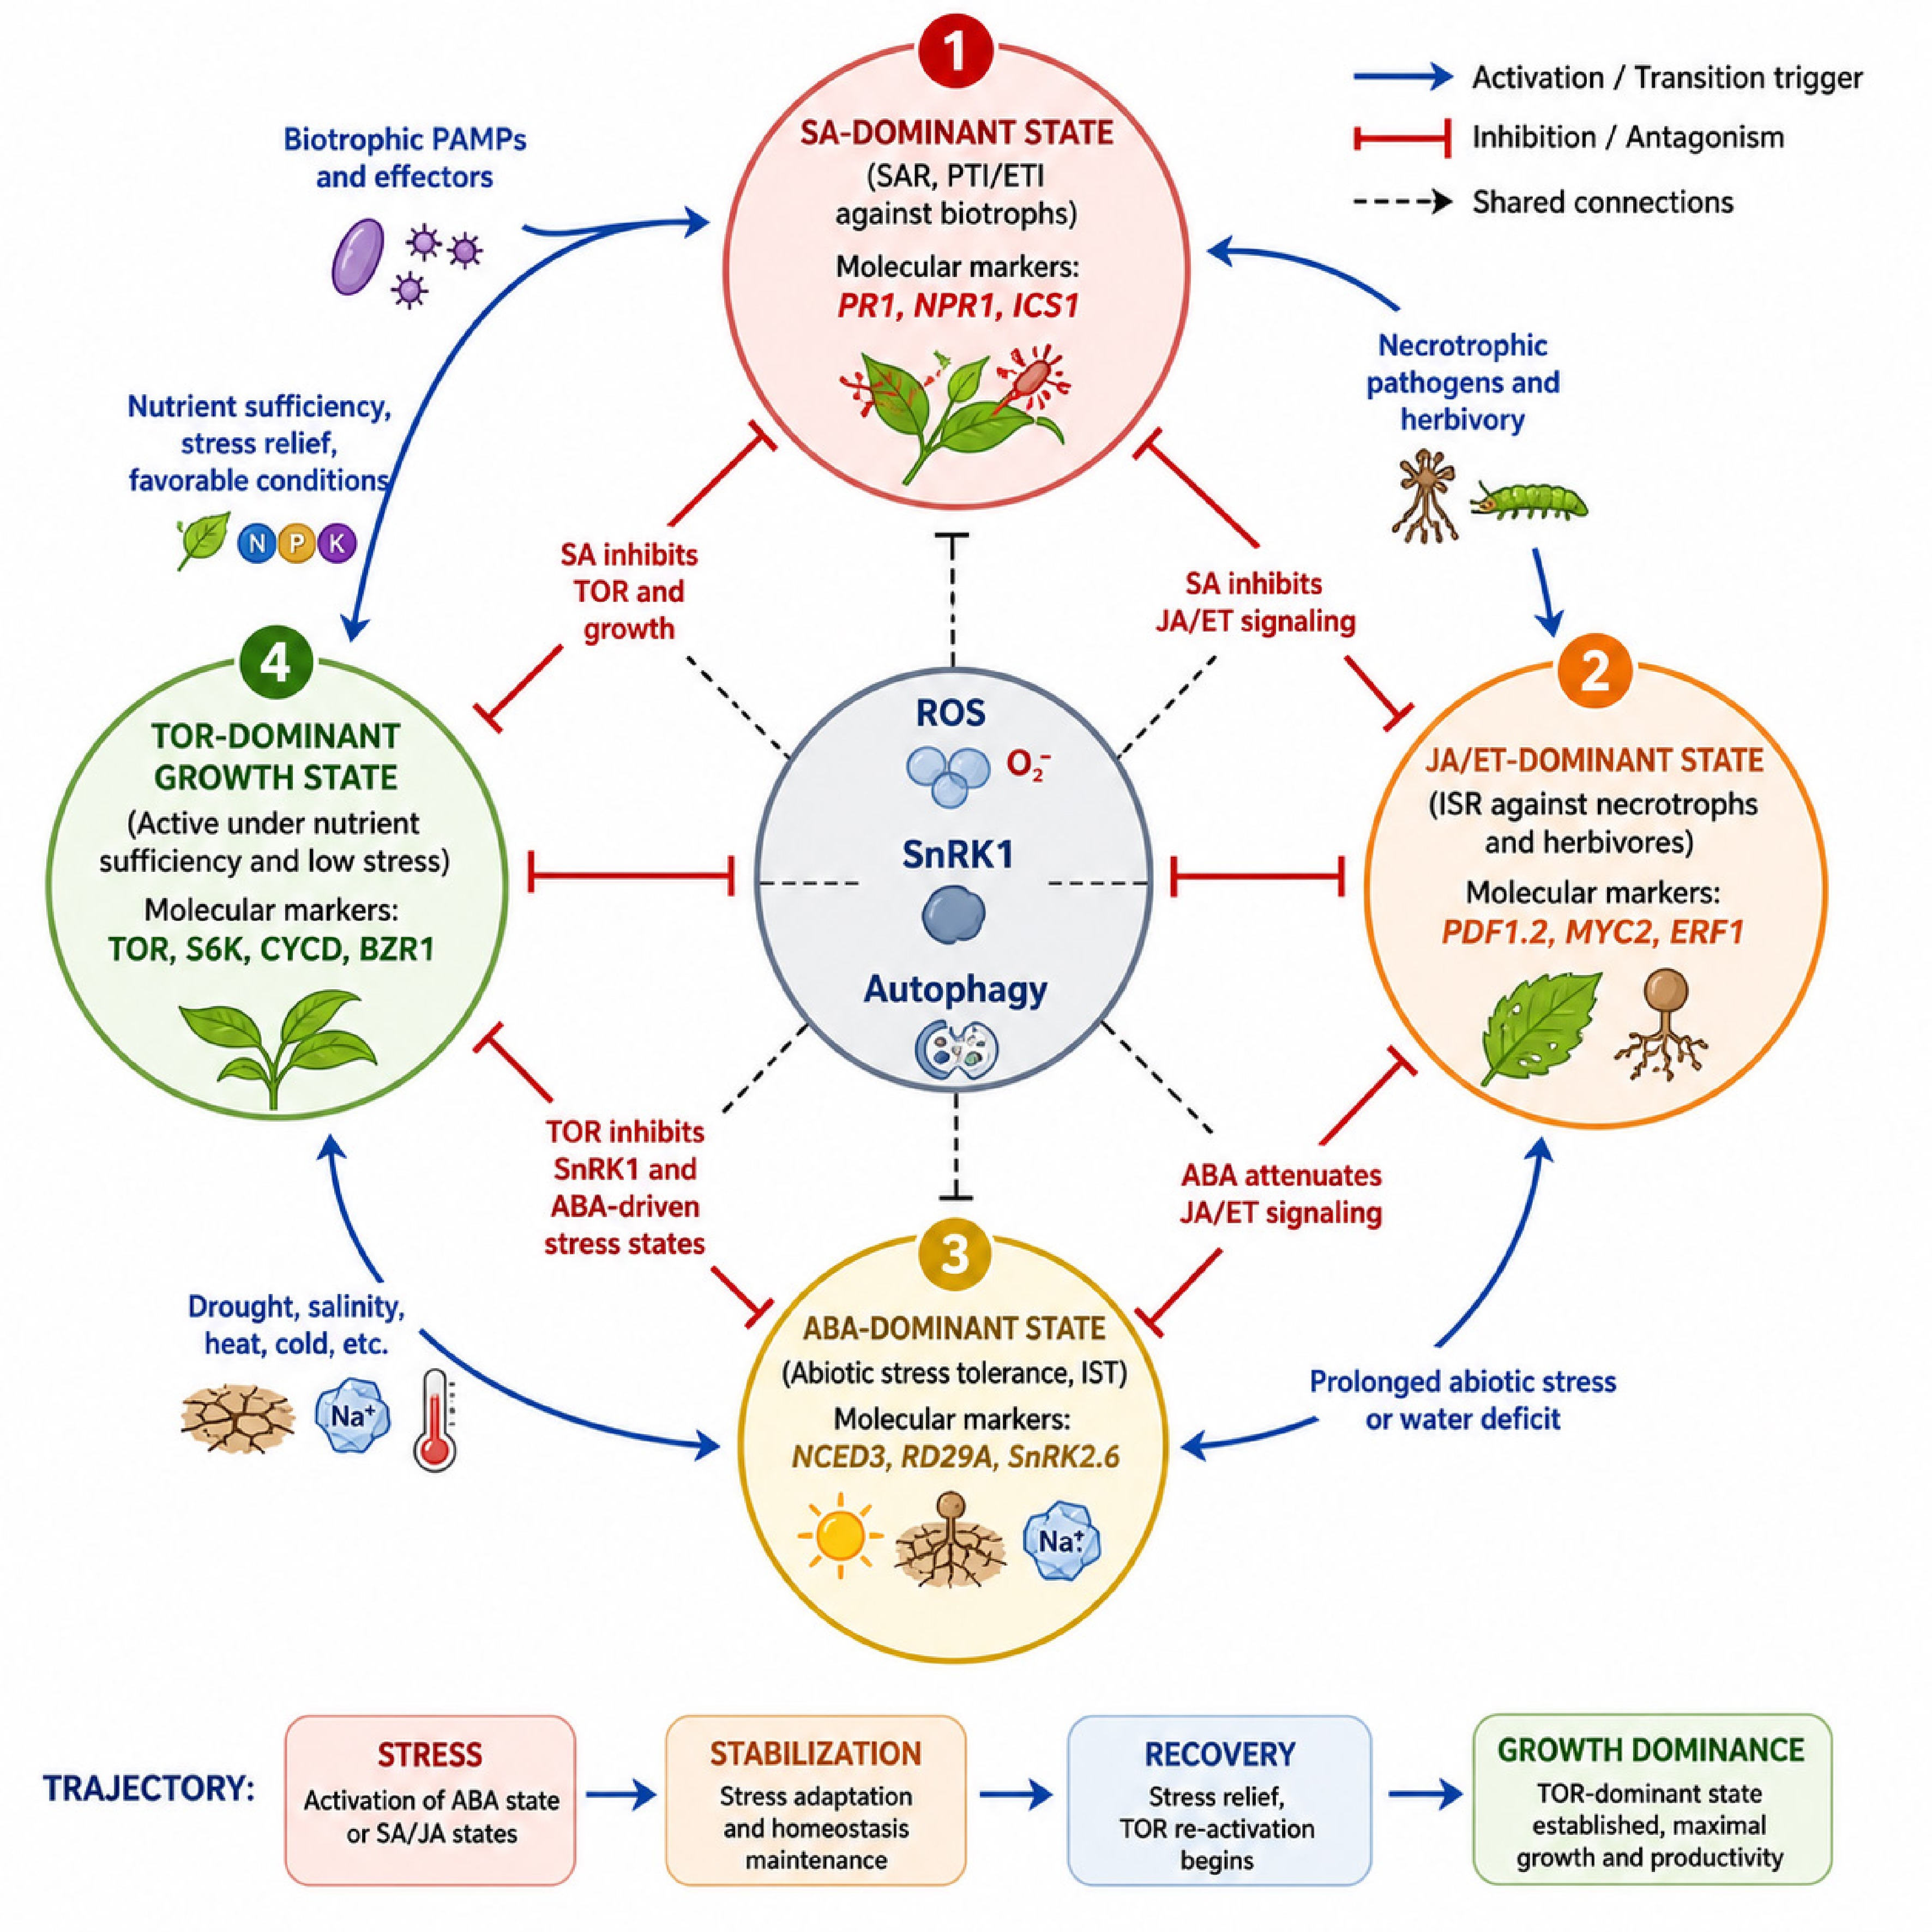
Figure 1.
The four-state multistable regulatory network of plant physiological states. A circular state diagram illustrating four interconnected and dynamically switching physiological attractor states in plants. (1) SA-dominant immune state (SAR; PTI/ETI against biotrophic pathogens) characterized by molecular markers PR1, NPR1, and ICS1, activated by biotrophic PAMPs and effector recognition. (2) JA/ET-dominant defense state (ISR against necrotrophs and herbivores) characterized by PDF1.2, MYC2, and ERF1, induced by necrotrophic infection and wounding. (3) ABA-dominant abiotic stress tolerance state (IST) marked by NCED3, RD29A, and SnRK2.6, activated under drought, salinity, and heat stress conditions. (4) TOR-dominant growth state, characterized by TOR, S6K, CYCD, and BZR1, prevailing under nutrient sufficiency and optimal environmental conditions. Transitions between states are indicated by directed arrows representing environmental and endogenous triggers, including pathogen-associated molecular patterns (PAMPs) inducing SA activation, drought and salinity triggering ABA signaling, and nutrient repletion promoting TOR-mediated growth recovery. Antagonistic regulatory interactions are depicted using blunt-ended inhibitory arrows, including SA–JA/ET antagonism, ABA-mediated suppression of SA signaling, and TOR-mediated inhibition of SnRK1- and stress-associated pathways. The overall system follows a dynamic trajectory of Stress → Stabilization → Recovery → Growth Dominance, passing through stress-adaptive states (ABA or SA/JA/ET) and returning to TOR-controlled growth under favorable conditions. A central regulatory hub integrates ROS signaling, SnRK1 energy sensing, and autophagy, acting as a shared coordination node across all four states. The inhibitory JA → TOR interaction is included based on available evidence, although the underlying molecular mechanism requires further clarification in primary studies[13].
-
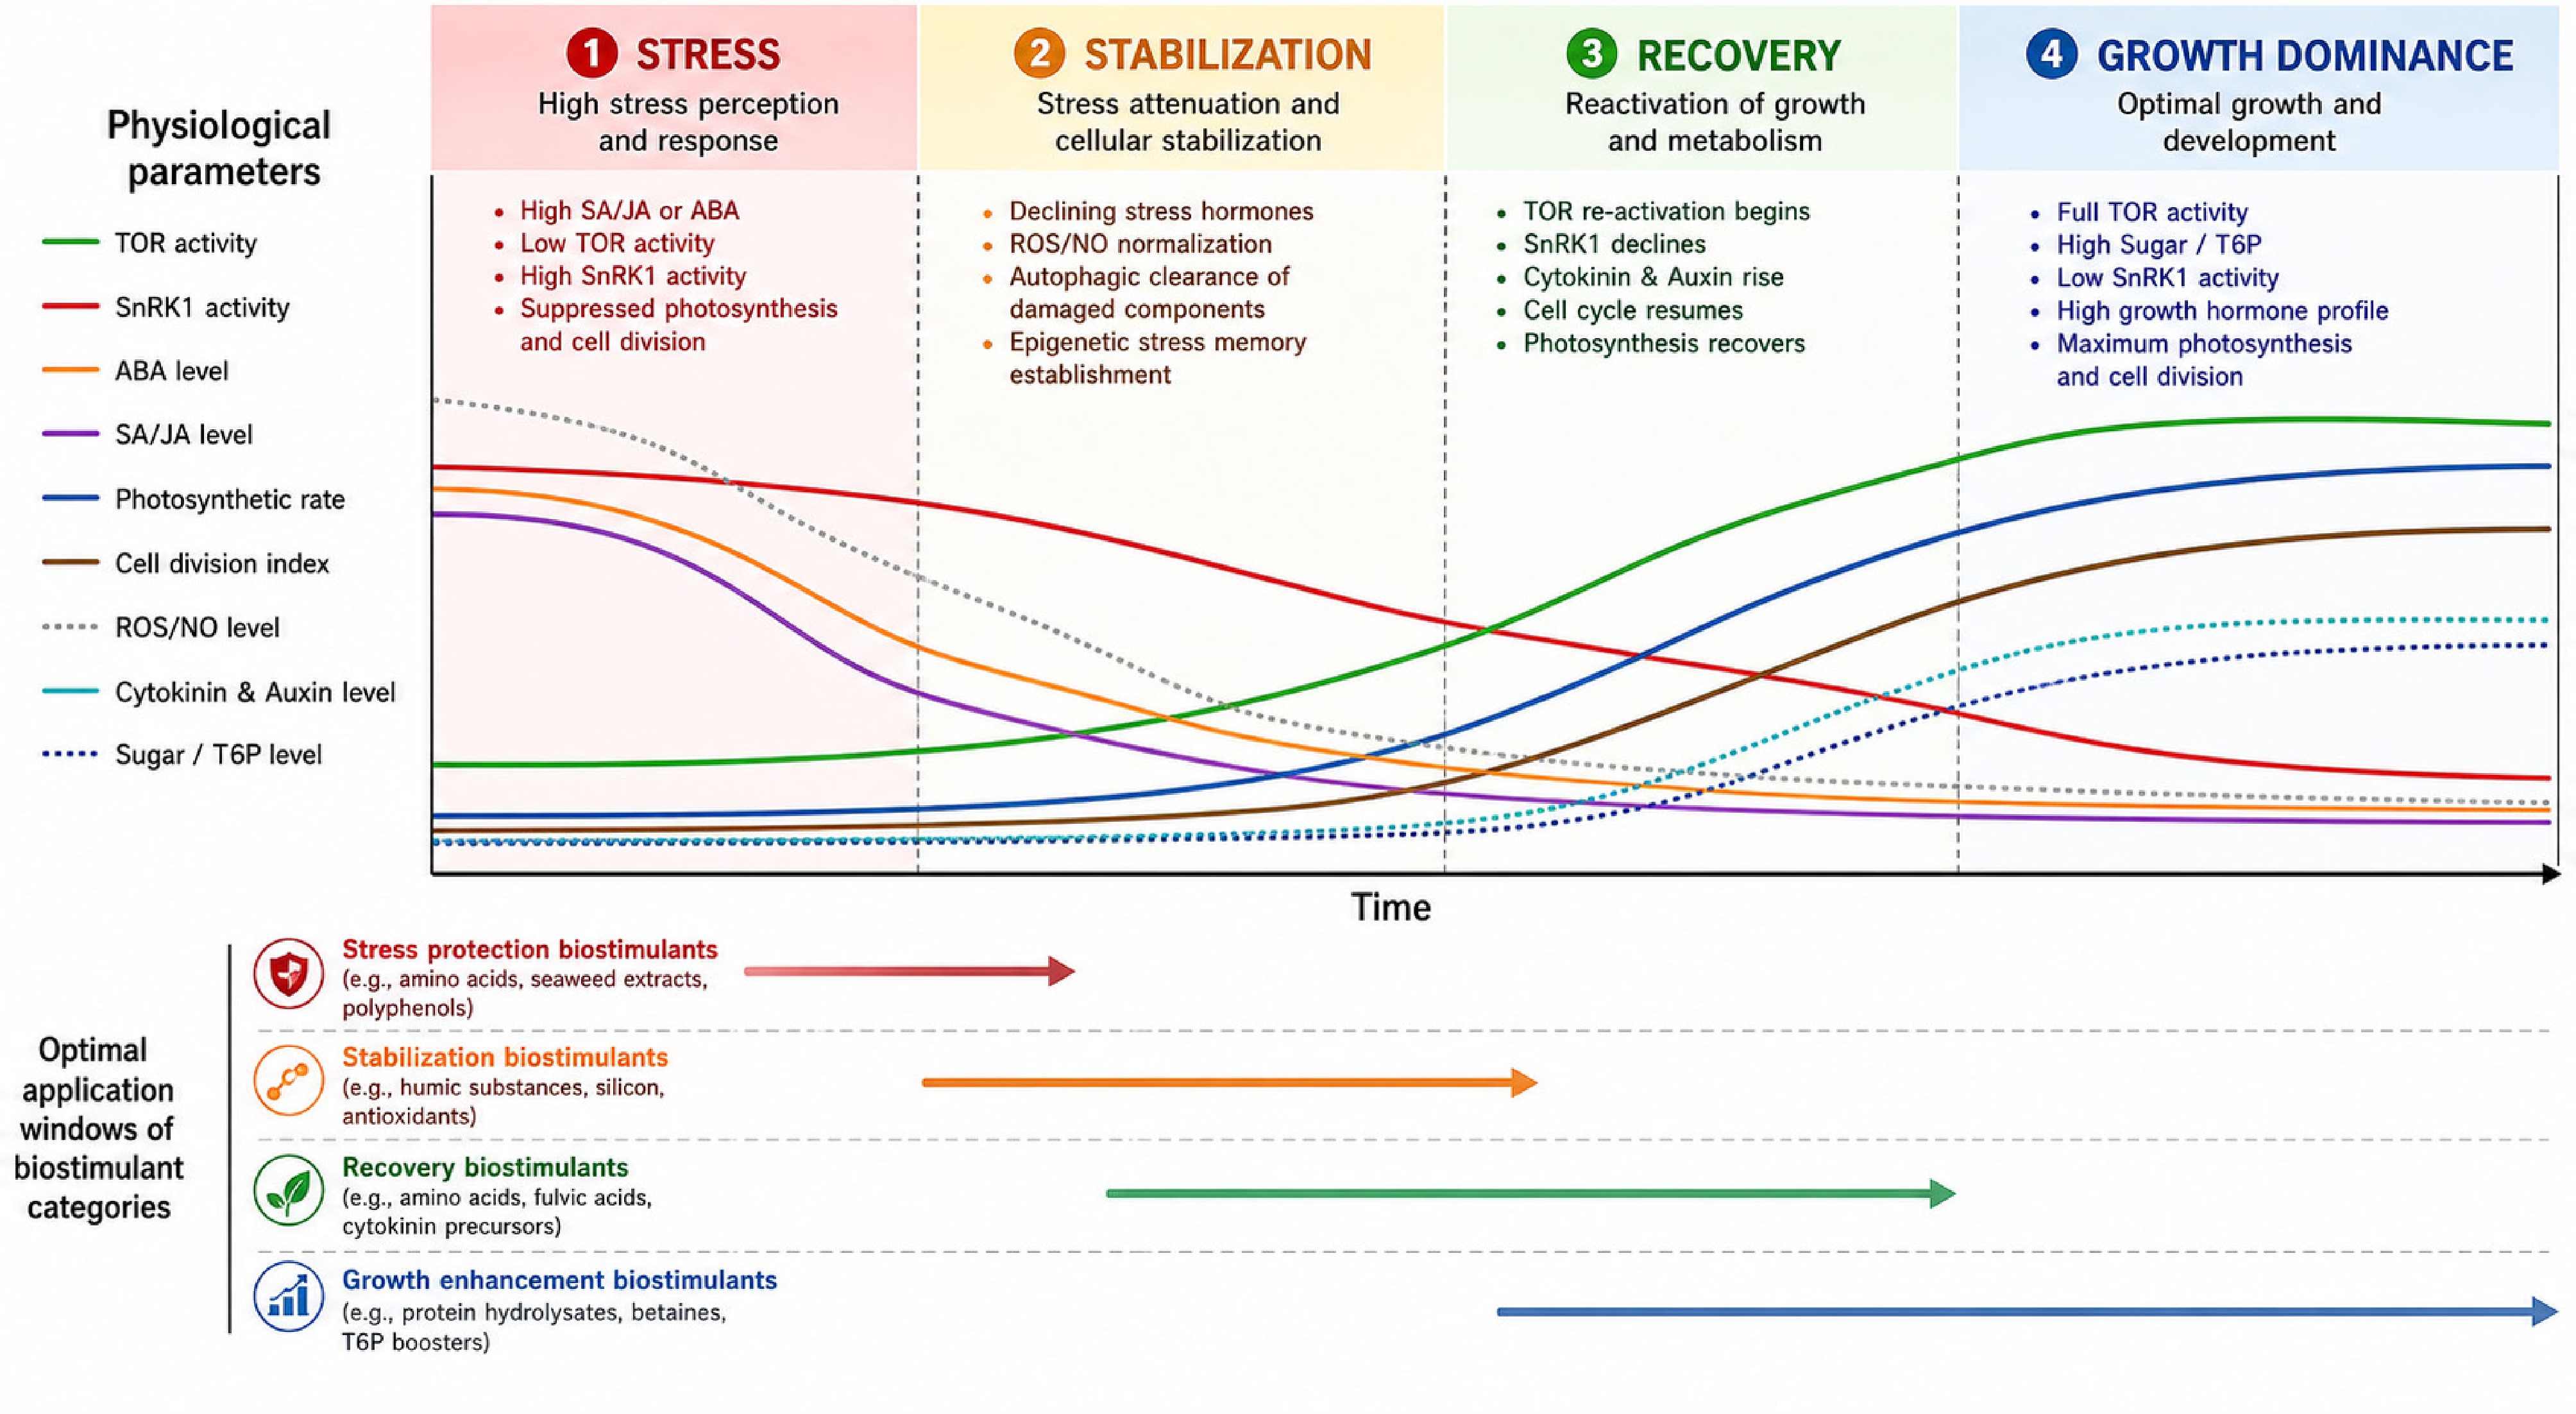
Figure 2.
The Stress–Stabilization–Recovery–Growth Dominance trajectory. A time-axis schematic illustrating the dynamic transition of key physiological and signaling parameters in plants, including TOR kinase activity, SnRK1 activity, ABA and SA/JA hormone levels, photosynthetic rate, and cell division index, across four sequential adaptive phases. During phase 1 (Stress), elevated ABA and SA/JA levels coincide with high SnRK1 activity, suppressed TOR signaling, and reduced photosynthesis and cell proliferation. Phase 2 (Stabilization) is characterized by a gradual decline in stress hormones, normalization of ROS/NO balance, activation of autophagic clearance of damaged cellular components, and establishment of epigenetic stress memory. In phase 3 (Recovery), TOR signaling is progressively reactivated, SnRK1 activity declines, and increasing cytokinin and auxin levels drive resumption of the cell cycle and recovery of photosynthetic capacity. Phase 4 (Growth Dominance) represents a fully re-established anabolic state with maximal TOR activity, elevated sugar/T6P signaling, suppressed SnRK1, high growth-promoting hormone levels, and peak photosynthetic and mitotic activity. Vertical color-coded bands denote each phase, while colored arrows beneath the time axis indicate optimal application windows for different classes of biostimulants aligned with physiological state transitions.
-
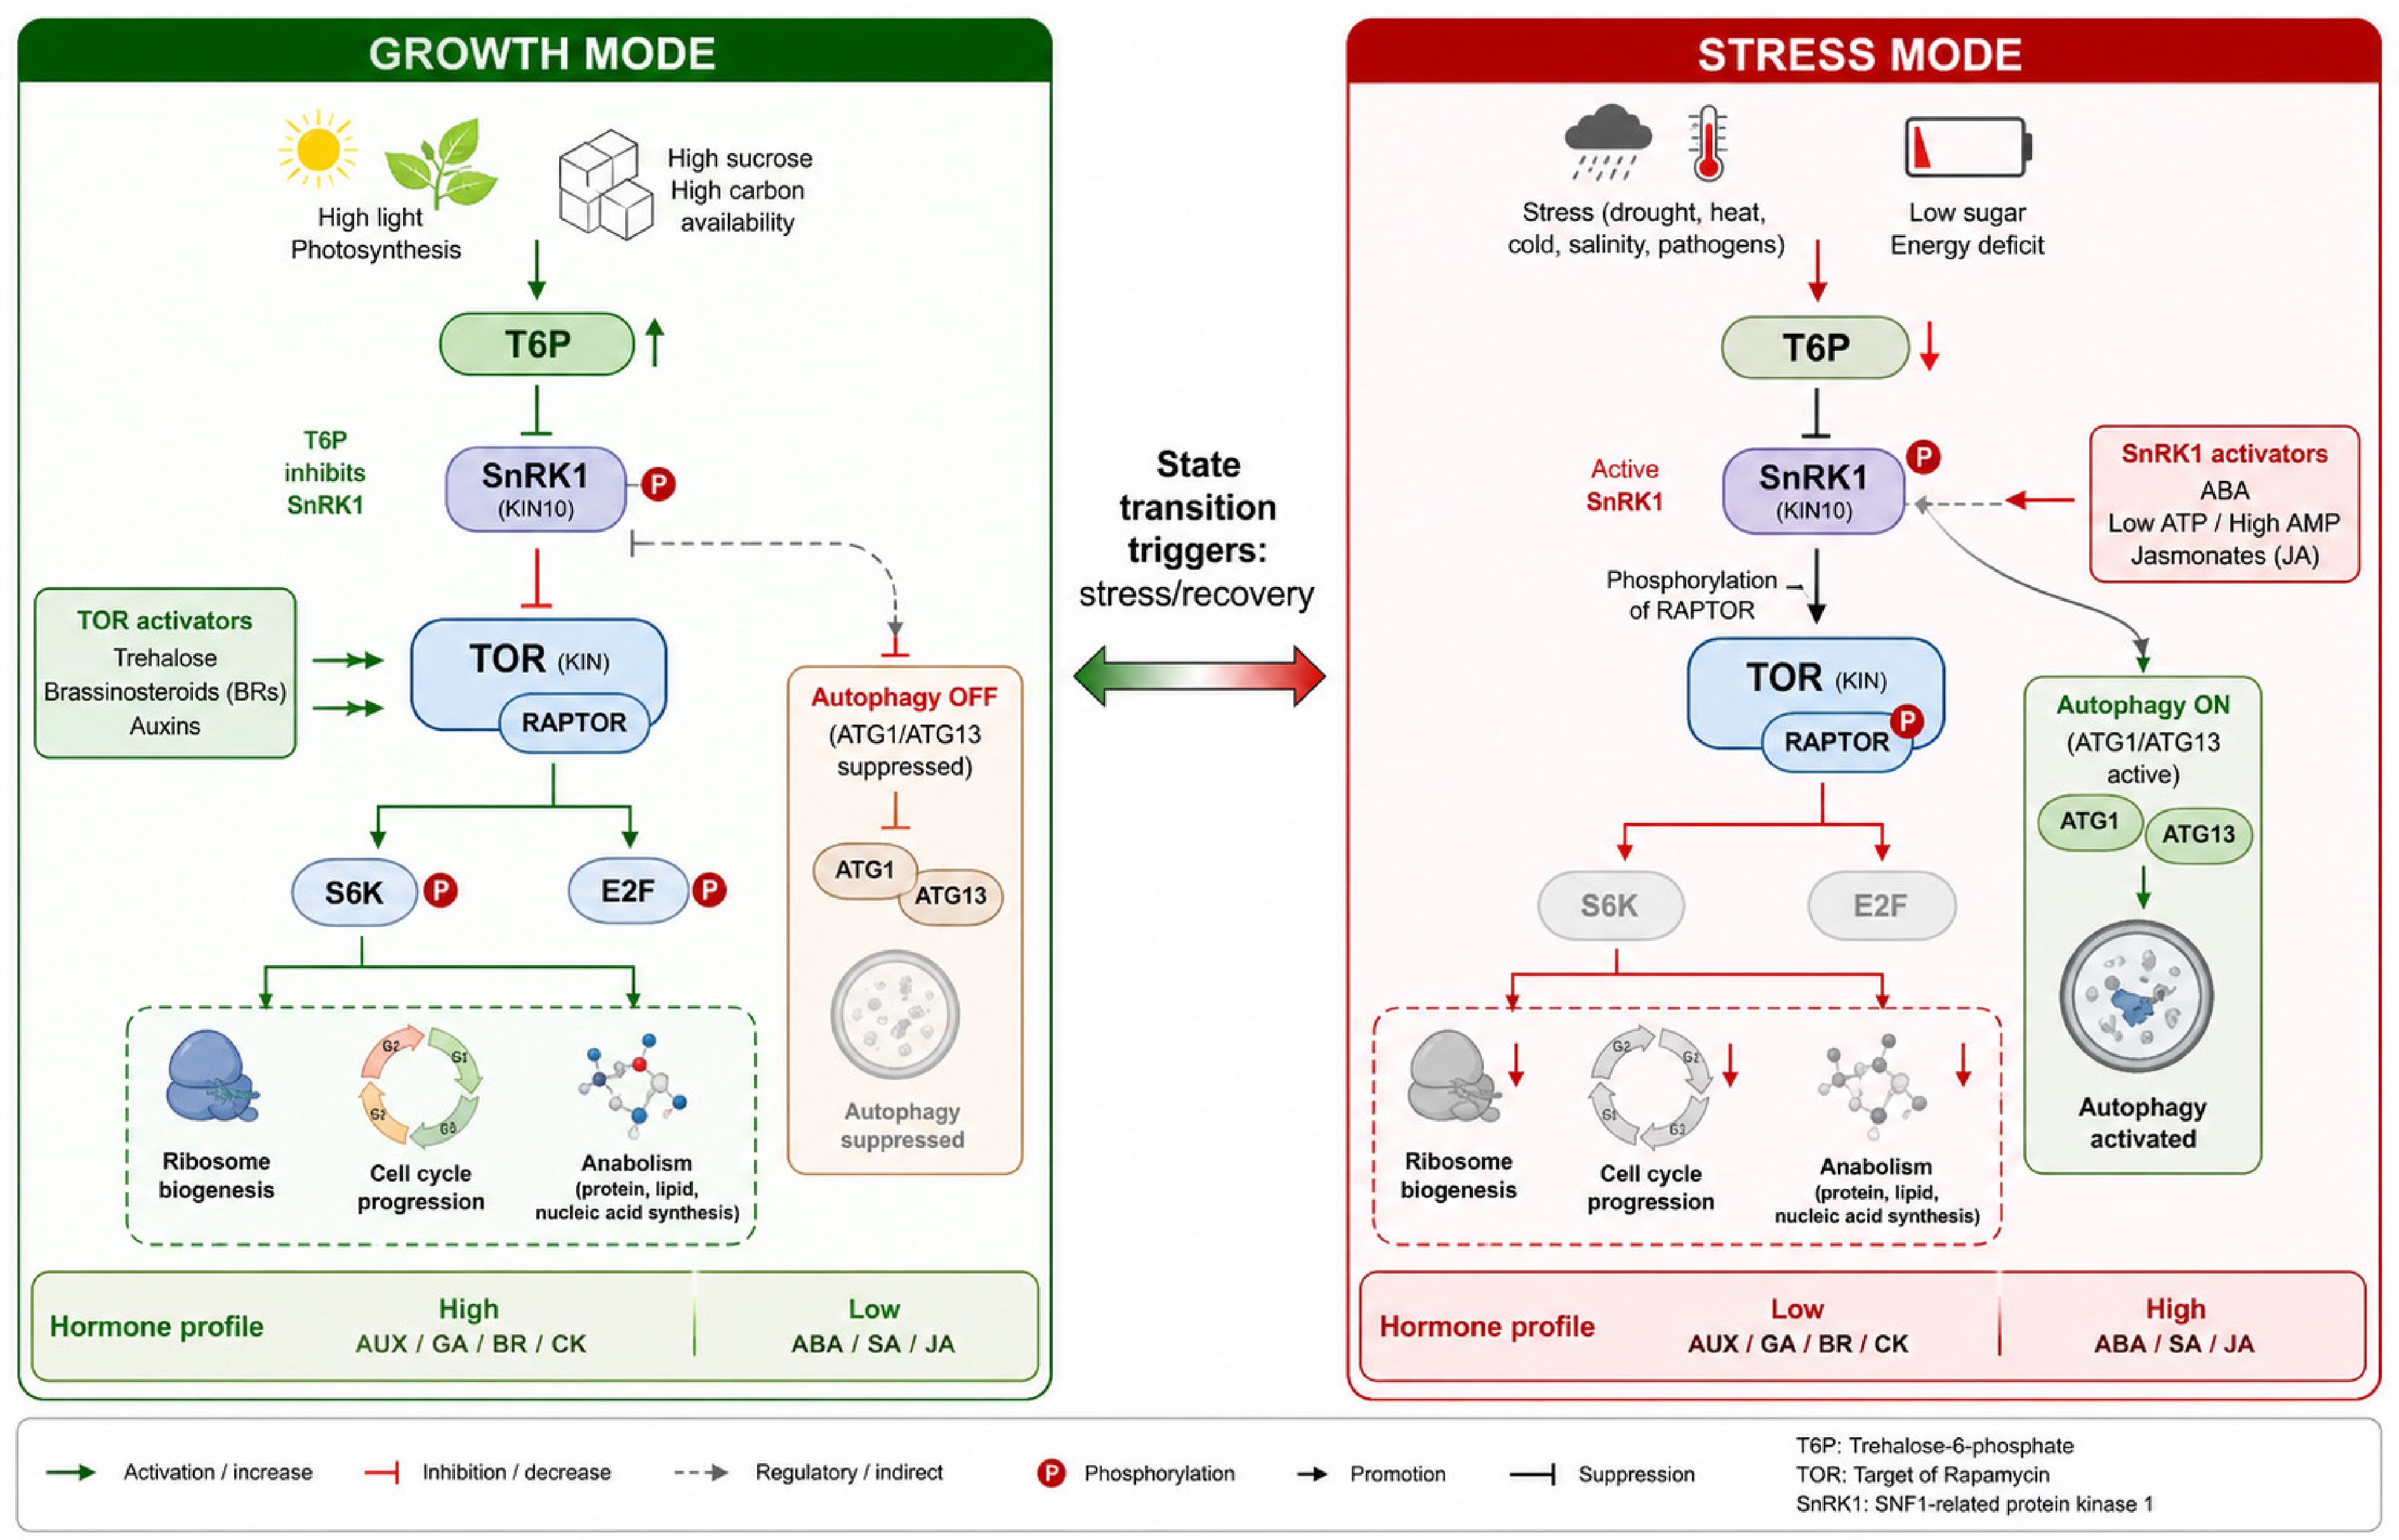
Figure 3.
TOR–SnRK1–T6P molecular switch regulating growth and stress adaptation in plants. Schematic two-panel representation of the metabolic and signaling switch between growth and stress modes. Left panel (growth mode): Under conditions of high sucrose availability and light input, trehalose-6-phosphate (T6P) accumulates, leading to inhibition of SnRK1 and activation of TOR kinase. Activated TOR promotes phosphorylation of S6K and E2F, thereby stimulating ribosome biogenesis, cell cycle progression, and anabolic metabolism. Autophagy is suppressed through inhibition of the ATG1/ATG13 complex. Hormonal profile is characterized by elevated auxins (AUX), gibberellins (GA), brassinosteroids (BR), and cytokinins (CK), with reduced abscisic acid (ABA), salicylic acid (SA), and jasmonic acid (JA). Right panel (stress mode): Under low sugar/energy availability or environmental stress, T6P levels decrease, resulting in activation of SnRK1 and repression of TOR signaling via RAPTOR phosphorylation. Downstream targets S6K and E2F are inactive, leading to suppression of growth-related processes. Autophagy is activated through ATG1/ATG13 complex induction. Hormonal balance shifts toward elevated ABA, SA, and JA, while growth-promoting hormones are reduced. A central bidirectional arrow indicates reversible state transitions driven by 'stress–recovery signals'. Positive regulatory inputs to TOR include trehalose signaling, BR, and AUX, whereas SnRK1 activation is promoted by ABA, low ATP/AMP ratio, and jasmonates. All major molecular components and signaling nodes are explicitly labeled.
-
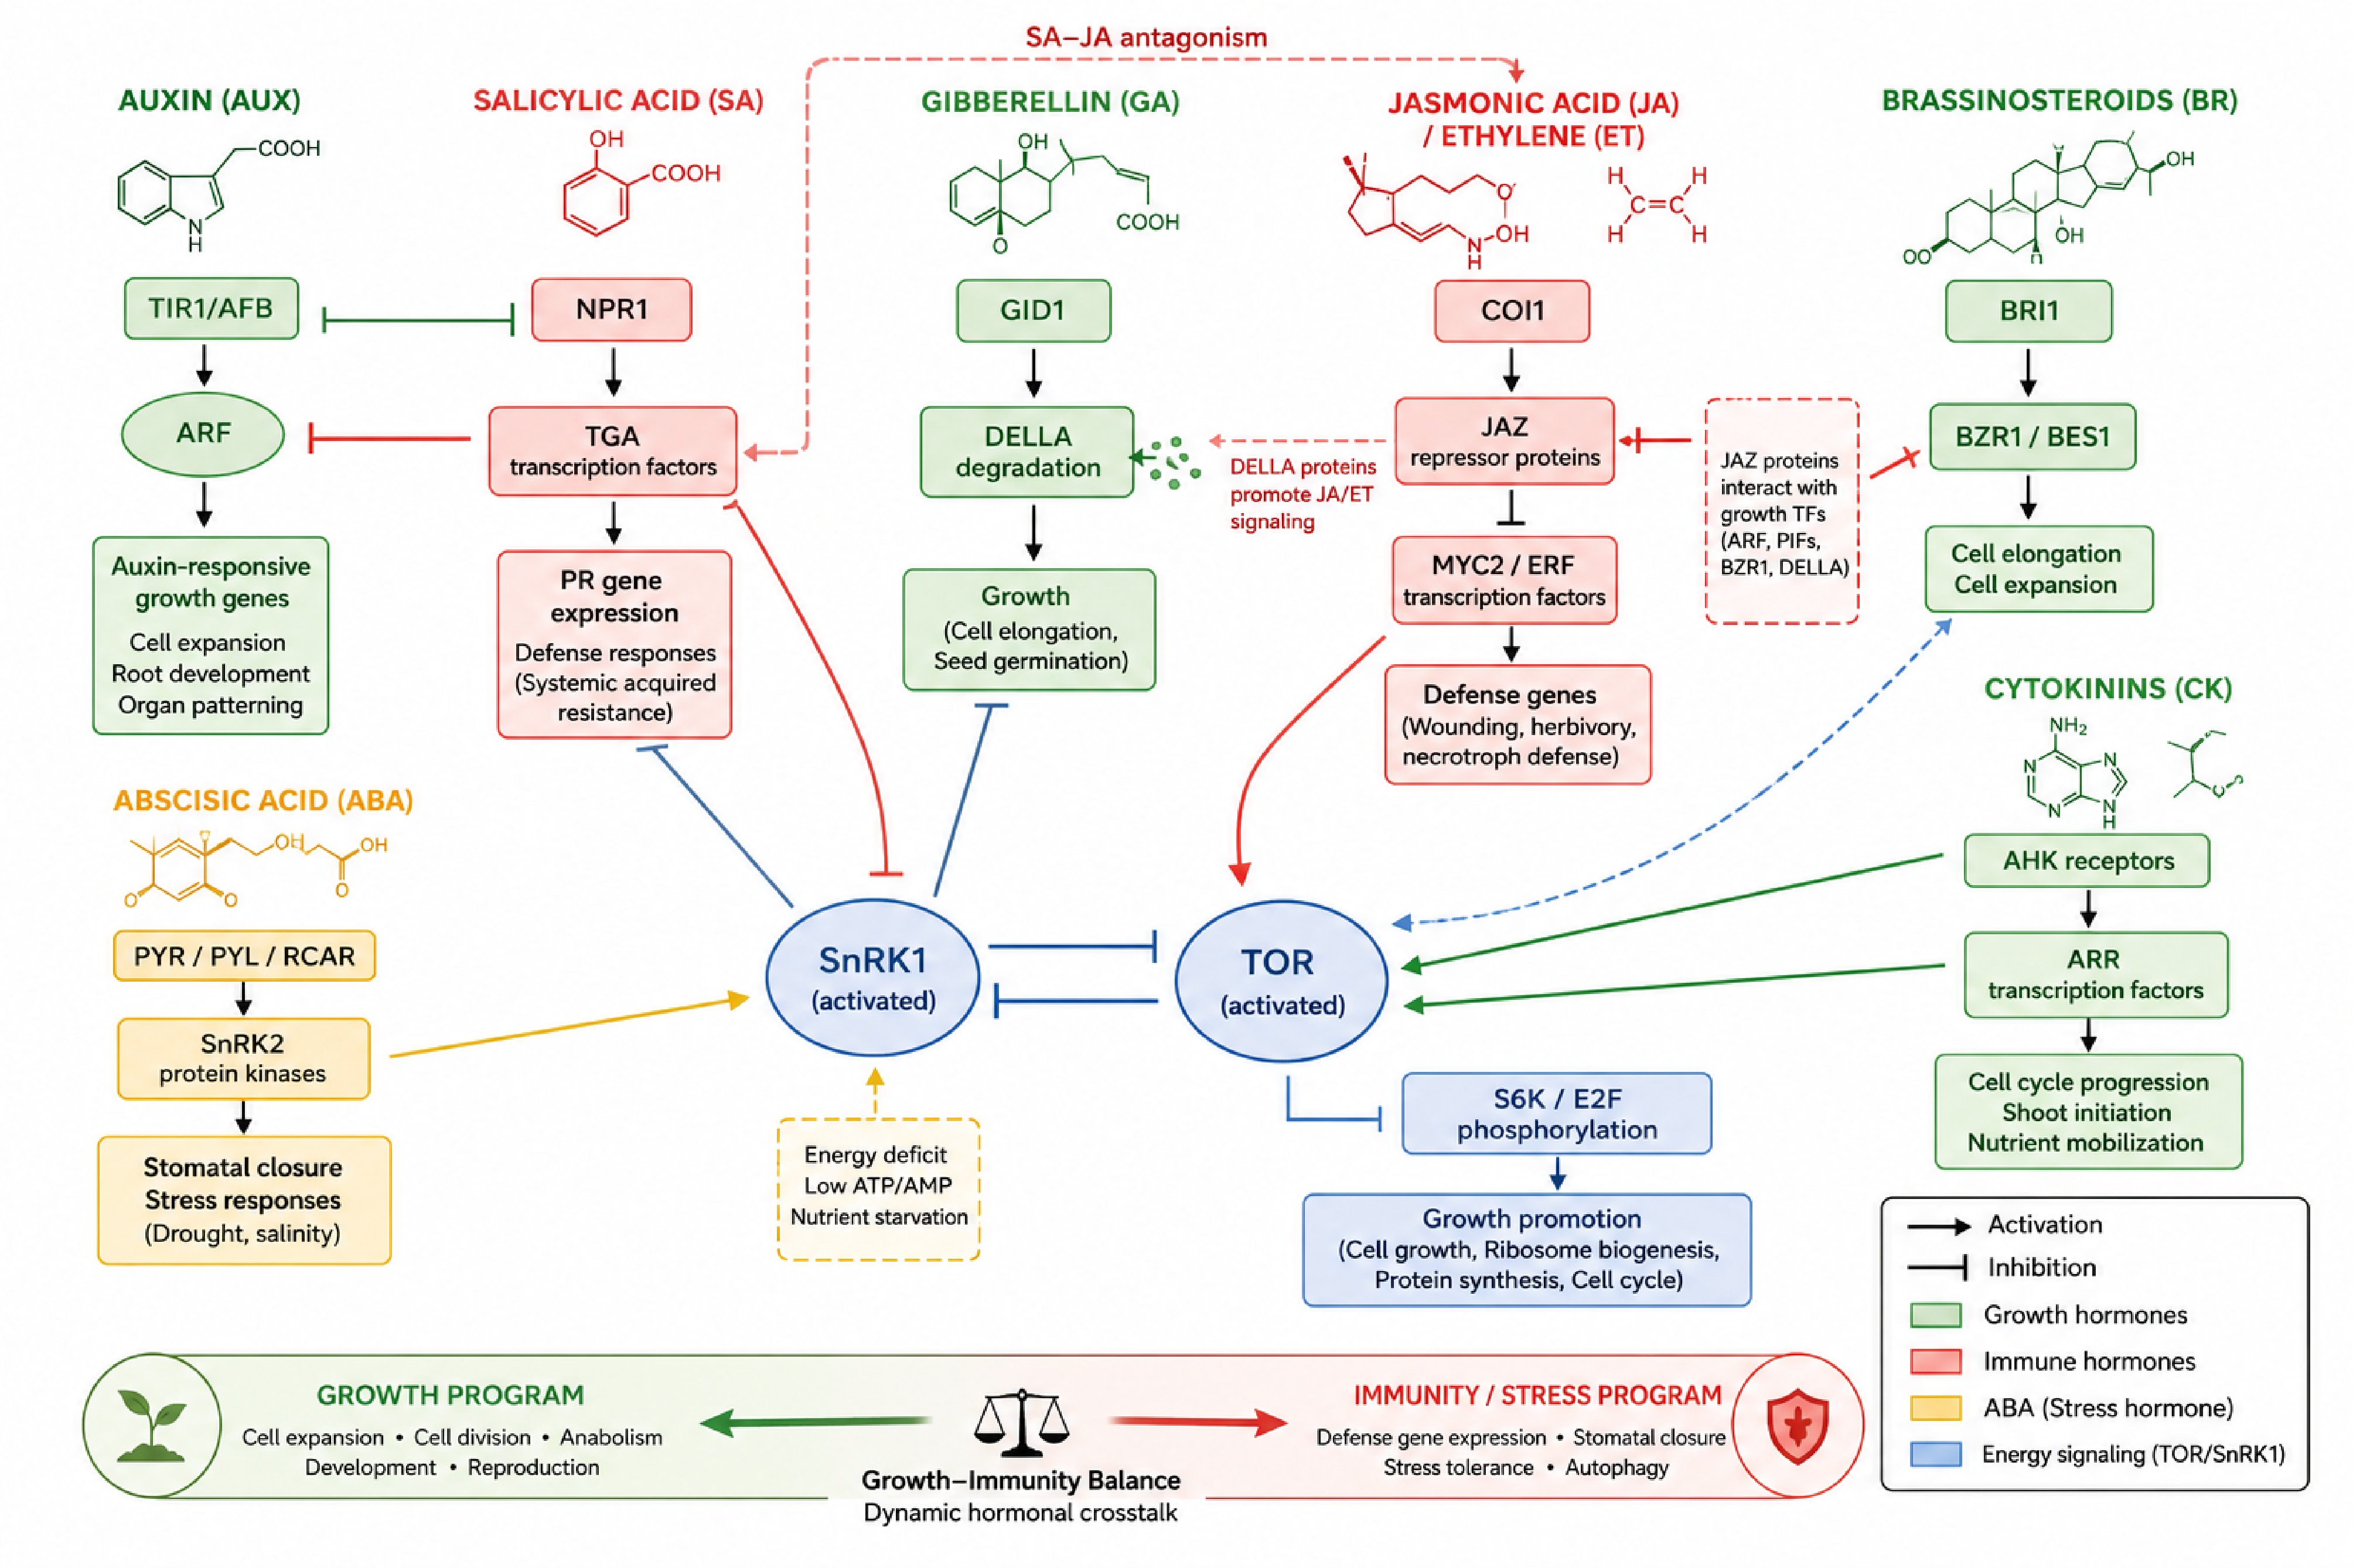
Figure 4.
The hormonal crosstalk network governing the growth–immunity balance. Schematic network illustrating major phytohormonal interactions within the SA–JA/ET–ABA–TOR/SnRK1 regulatory framework that integrates plant growth, development, and immune responses. Key regulatory modules include: (1) salicylic acid (SA) signaling via NPR1/TGA leading to PR gene expression; (2) auxins (AUX) signaling through ARF promoting growth-related gene expression, with mutual antagonism where SA suppresses ARF activity and AUX suppresses NPR1-mediated immune signaling; (3) gibberellins (GA) perception via GID1 resulting in DELLA protein degradation and growth promotion, while DELLA proteins also enhance JA/ET signaling; (4) jasmonic acid/ethylene (JA/ET) signaling via COI1–JAZ–MYC2 regulating defense gene expression, with JAZ proteins interfacing with growth-related transcription factors; (5) brassinosteroids (BR) signaling via BRI1–BZR1 promoting cell elongation and TOR activation; (6) cytokinins (CK) signaling via AHK–ARR supporting cell cycle progression and TOR-mediated growth regulation; (7) abscisic acid (ABA) signaling via PYR/PYL–SnRK2 regulating stomatal closure and activating SnRK1 under stress conditions; (8) central energy signaling through TOR promoting growth via S6K/E2F, while SnRK1 mediates stress responses and antagonistically suppresses TOR activity. Interactions are depicted with directional arrows indicating activation and blunt-ended lines indicating inhibition. Hormonal groups are color-coded as follows: growth-promoting hormones (green), immune/stress-related hormones (red/orange), ABA signaling (yellow), and central energy regulators TOR/SnRK1 (blue).
-
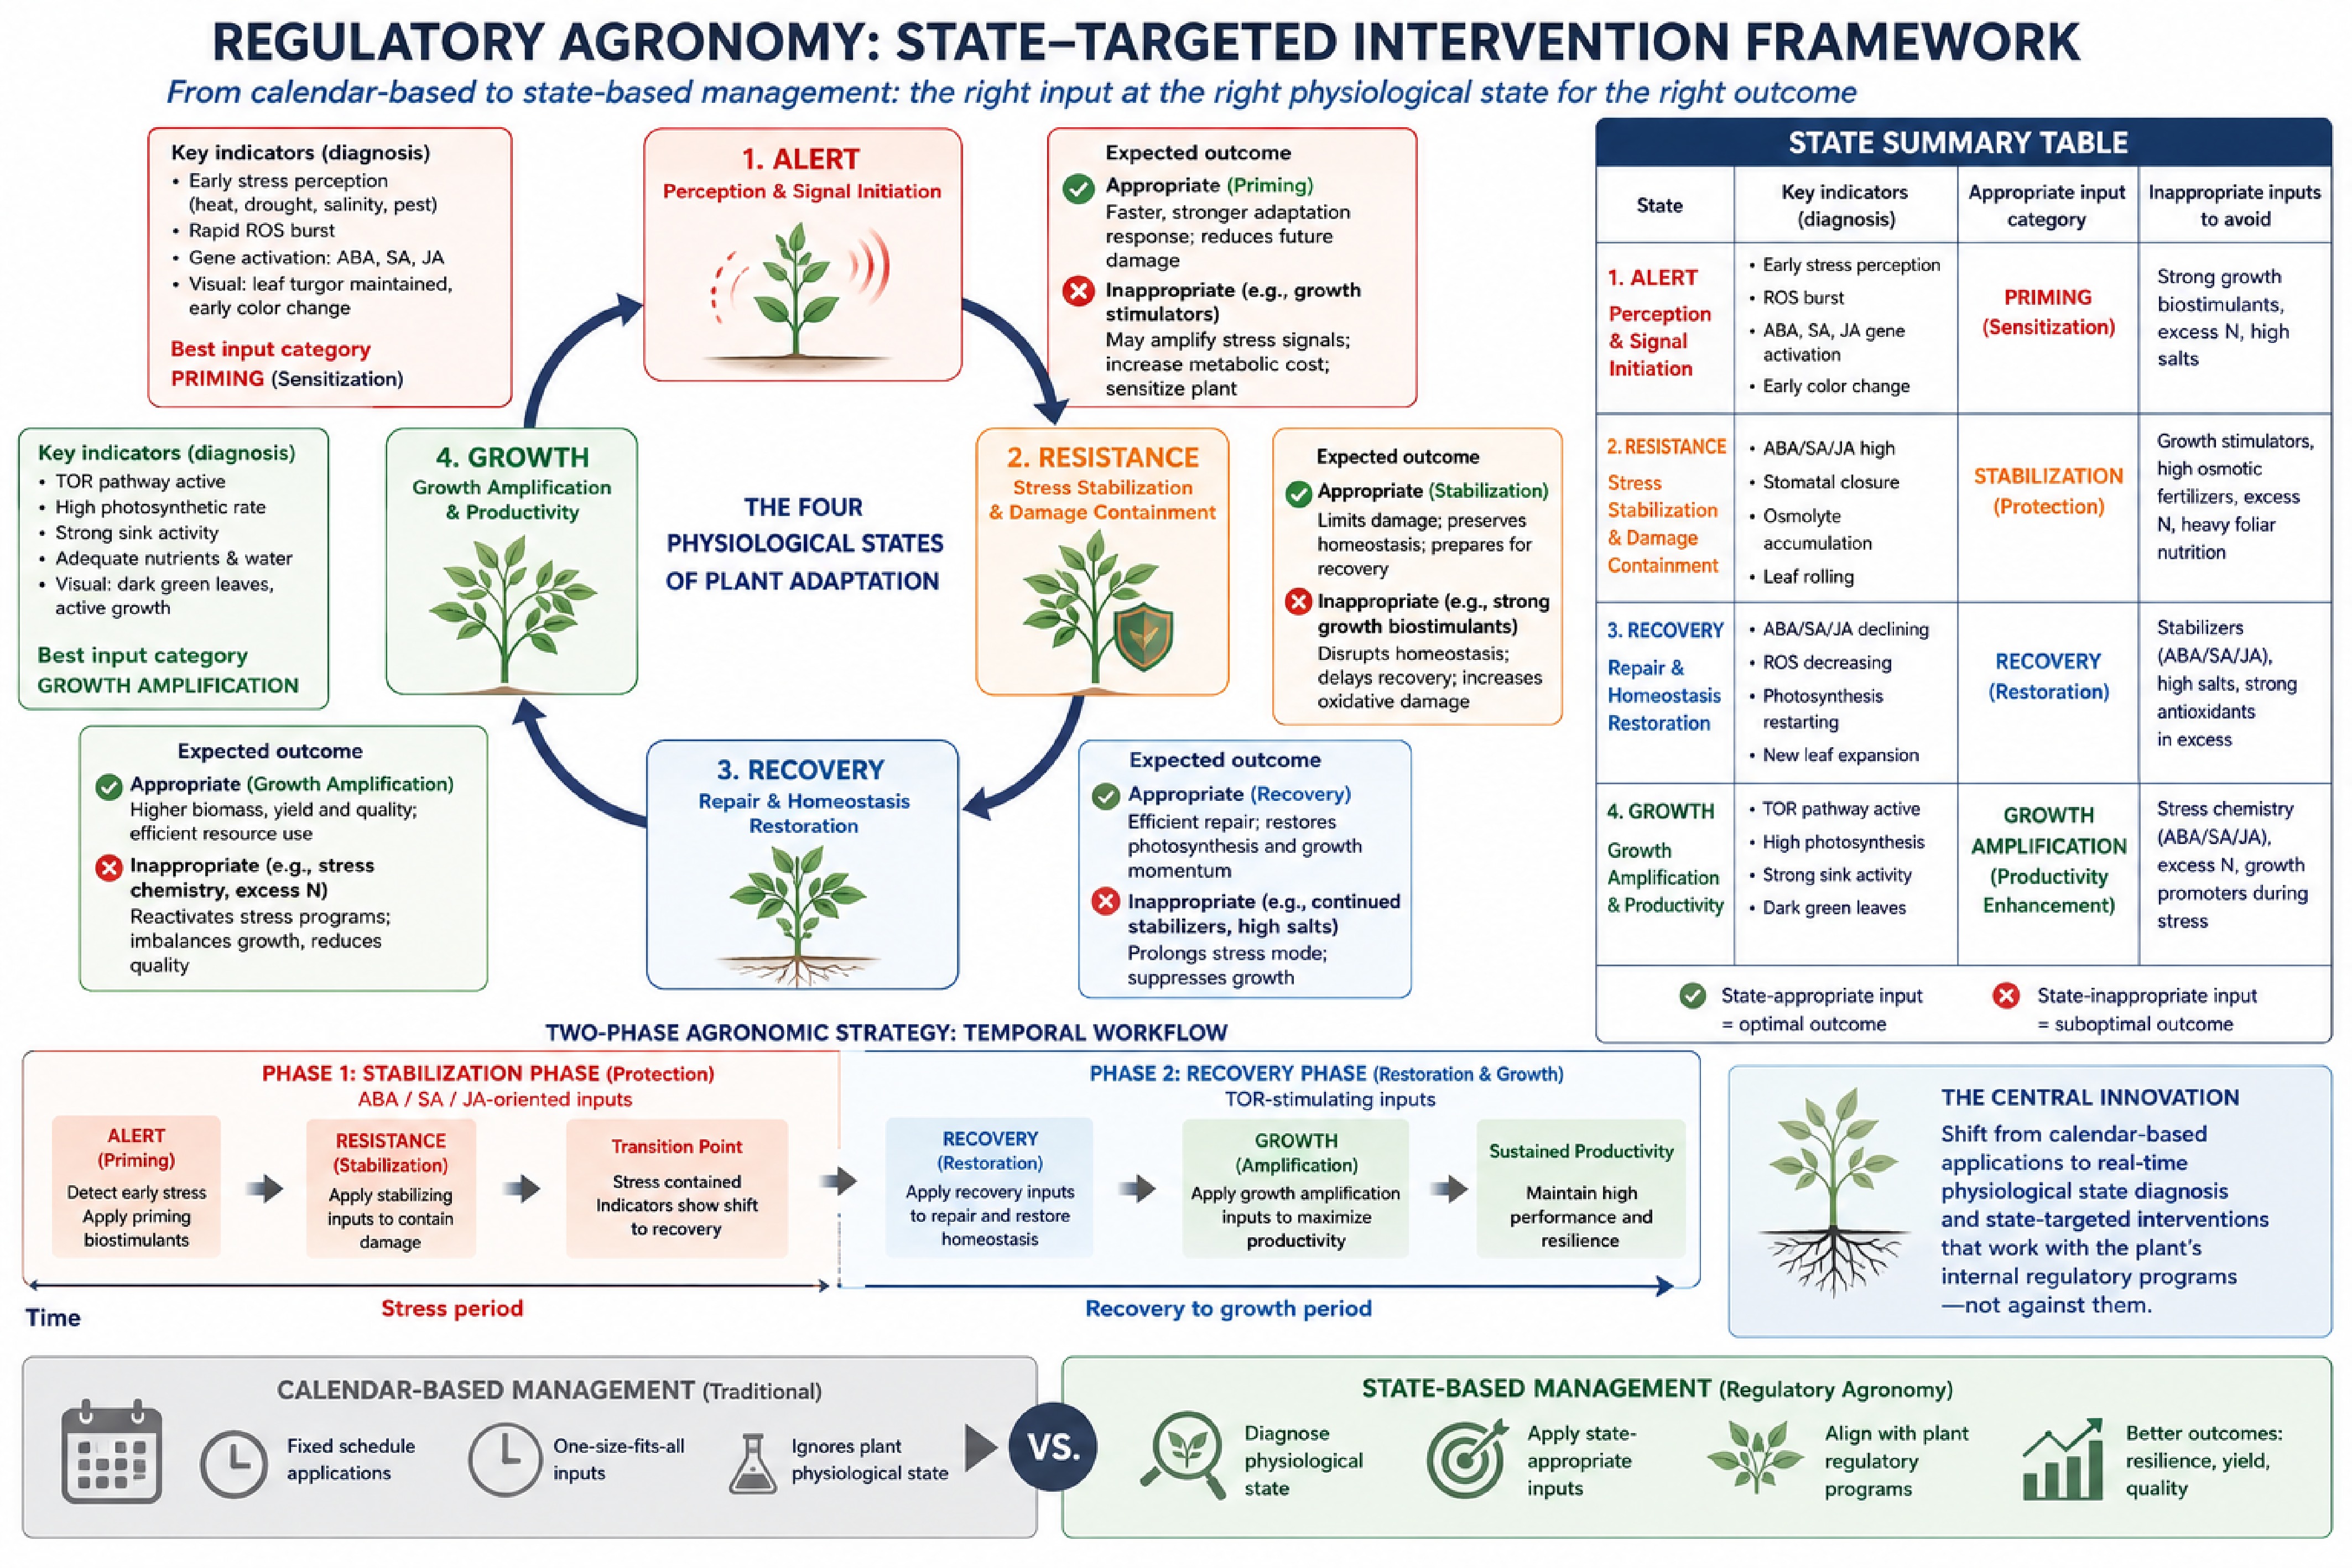
Figure 5.
Regulatory Agronomy (the concept of immune–metabolic crop management): a state-targeted intervention framework. Schematic representation of the Regulatory Agronomy decision-making framework based on state-dependent physiological diagnostics and targeted biostimulant application. The central cycle illustrates four plant physiological states: alert, resistance, recovery, and growth; each associated with characteristic diagnostic indicators, recommended input categories (priming, stabilization, recovery, or growth amplification), and the predicted outcomes of state-appropriate vs inappropriate interventions. The lower panel presents a two-phase agronomic workflow, including a stabilization phase supported by ABA/SA/JA-oriented inputs and a recovery phase supported by TOR-stimulating inputs. The framework highlights the transition from conventional calendar-based management to dynamic, state-based agronomic decision-making as the core innovation of Regulatory Agronomy (Immune–metabolic crop management).
-
State Dominant hormonal features Energy status/TOR–SnRK1 Molecular markers Metabolic characteristics Key genes/key references SA-dominant (SAR/PTI/ETI) ↑SA; ↓AUX, GA, CK ↓TOR; ↑SnRK1; low ATP flux NPR1, PR1, ICS1, TGA factors ↑Phenolics, ↑lignin, ↓sugar allocation to growth NPR1, ICS1, SID2; Ngou et al.[6]; Khablak et al.[9] JA/ET-dominant (ISR/necrotrophic) ↑JA, ↑ET; ↓GA; DELLA stabilised Moderate ↓TOR; partial SnRK1 activation PDF1.2, MYC2, ERF1, JAZ proteins ↑Glucosinolates, ↑phytoalexins; ↓elongation COI1, MYC2, ERF1; Wasternack & Hause[7] ABA-dominant (IST/abiotic stress) ↑ABA; ↓CK, AUX ↓TOR (SnRK1-dep. and -indep.); ↑SnRK1 NCED3, RD29A, SnRK2.6, RAB18 ↑Proline, ABA catabolism; stomatal closure; ↓photosynthesis NCED3, PYR/PYL, SnRK2.6; Zhu[8] TOR-dependent
growth-dominant↑AUX, GA, BR, CK; ↓ABA, SA, JA ↑TOR (TORC1 active); ↓SnRK1; ↑T6P; high ATP TOR, S6K1/2, E2F, CYCD, BZR1, ARF ↑Sucrose, ↑amino acids, ↑NADPH; ↑anabolism; ↑ribosome biogenesis TOR, S6K, DELLA; De Vleesschauwer et al.[13] Table 1.
Summary of proposed regulatory attractor states: characteristic features, markers, and key primary references.
Figures
(5)
Tables
(1)