-
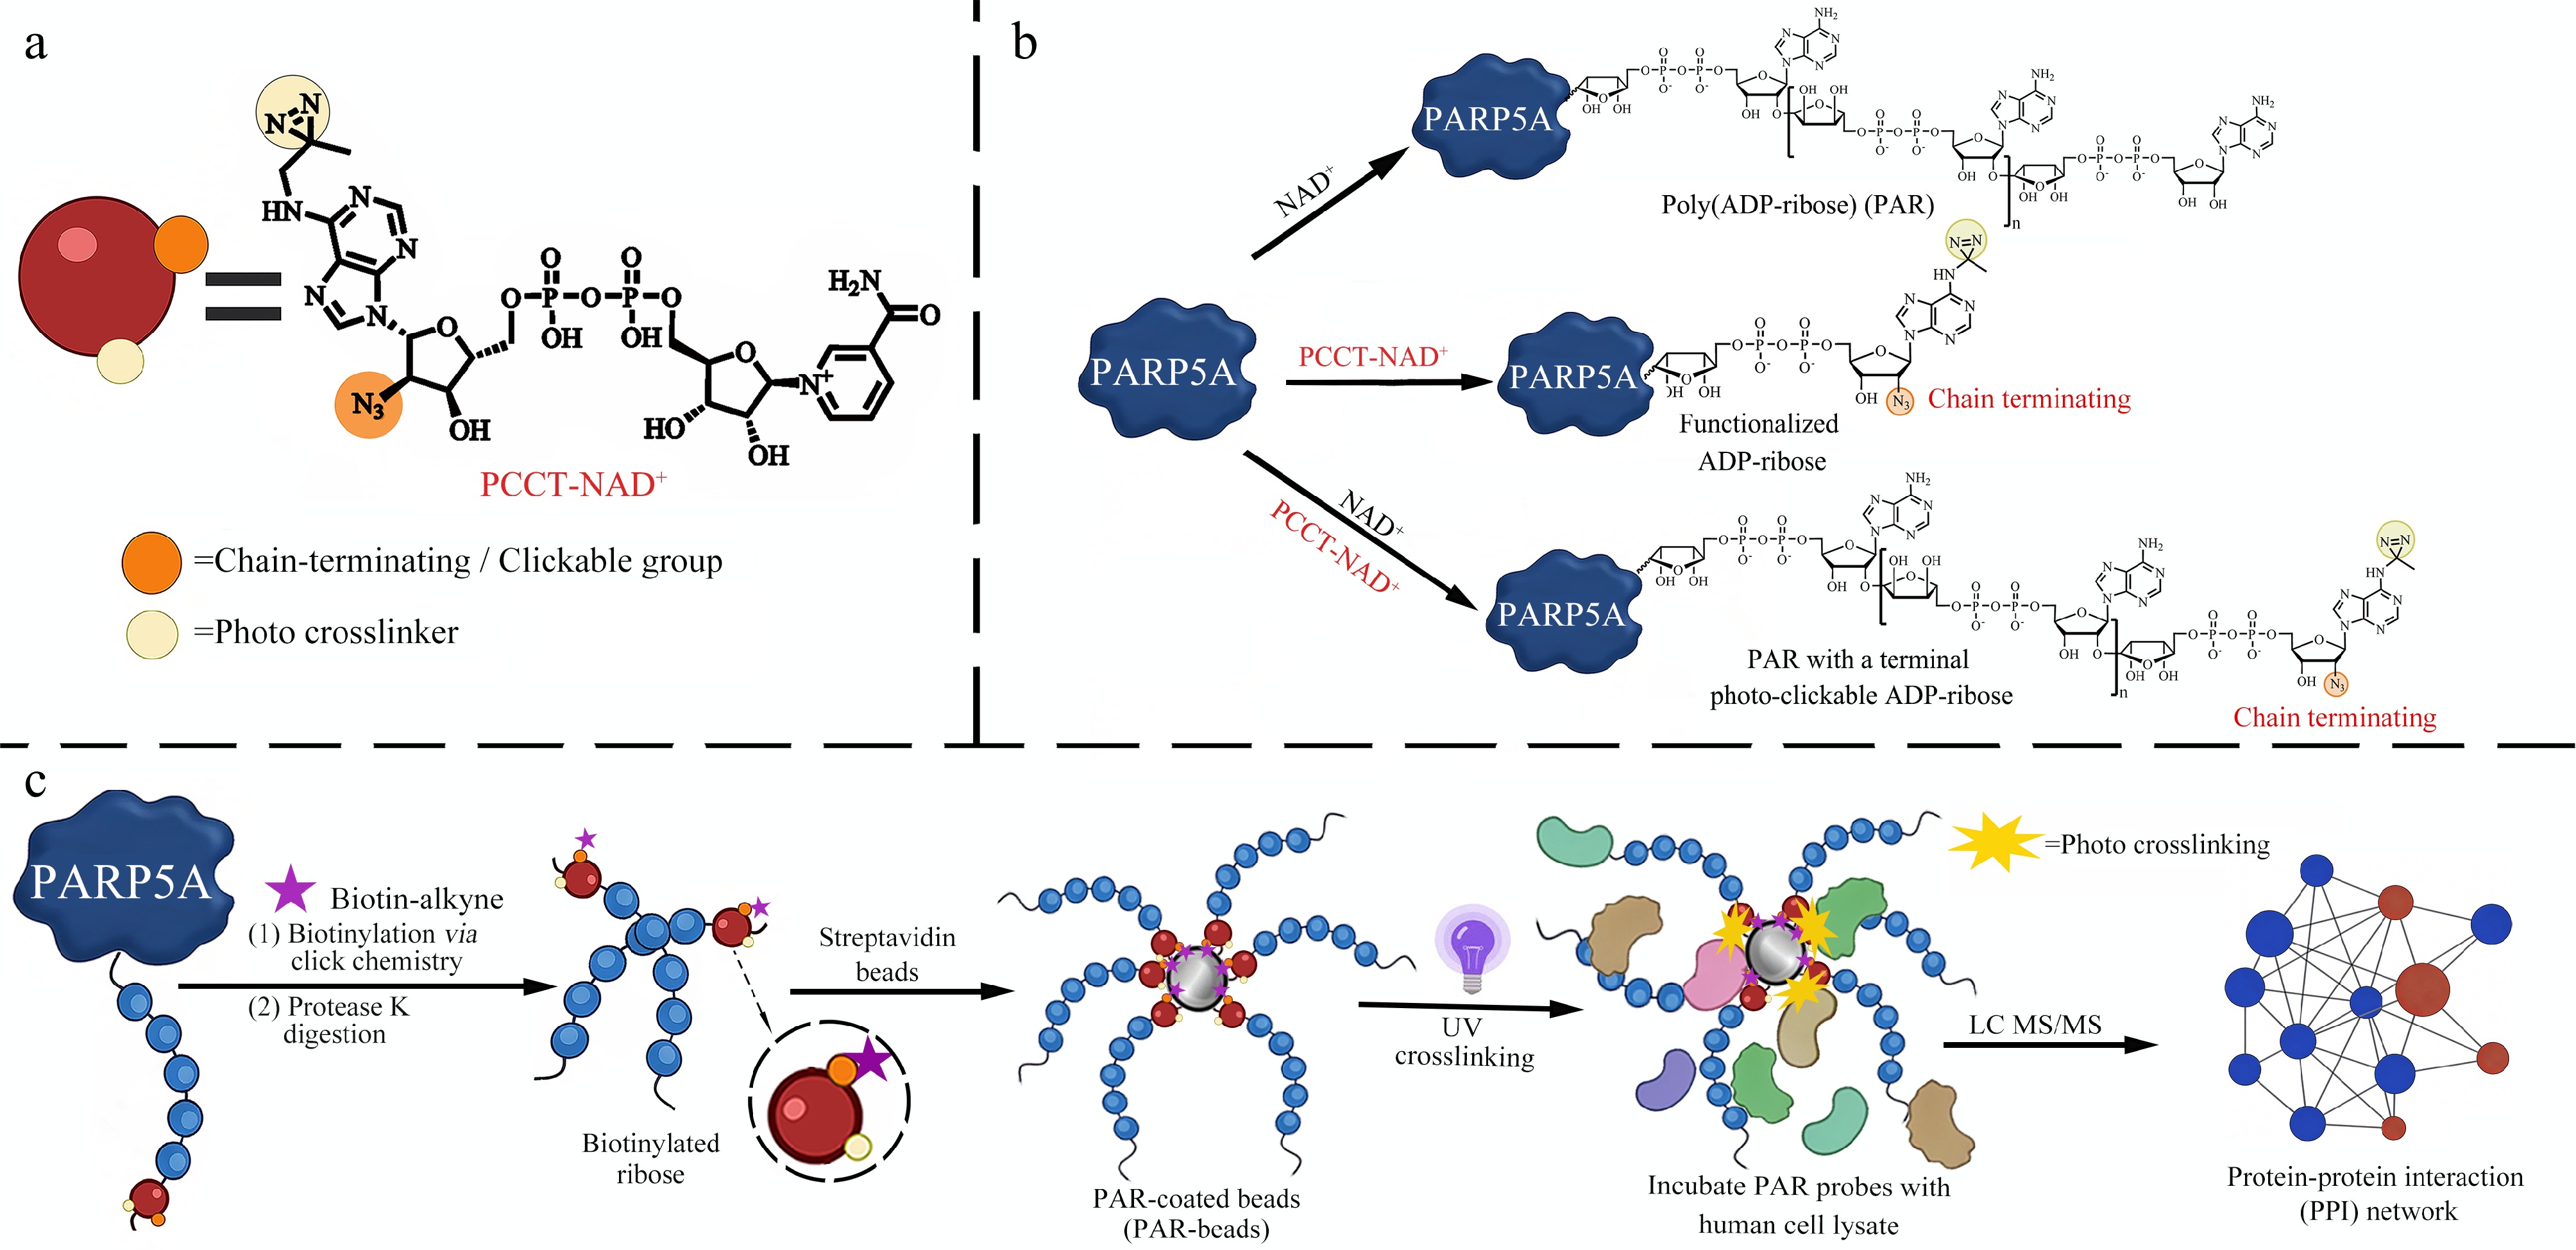
Figure 1.
Design and application of the PCCT-NAD+ probe for PAR interactome profiling. (a) Chemical structure of PCCT-NAD+. (b) ADP-ribosylation catalyzed by PARP5A using NAD+, PCCT-NAD+, or a mixture of NAD+ and PCCT-NAD+. (c) Workflow for PAR interactome profiling: functionalized PAR polymers are immobilized onto magnetic beads, followed by photo-crosslinking with cell lysates to enable efficient and unbiased capture of PAR-interacting proteins under native interaction contexts.
-
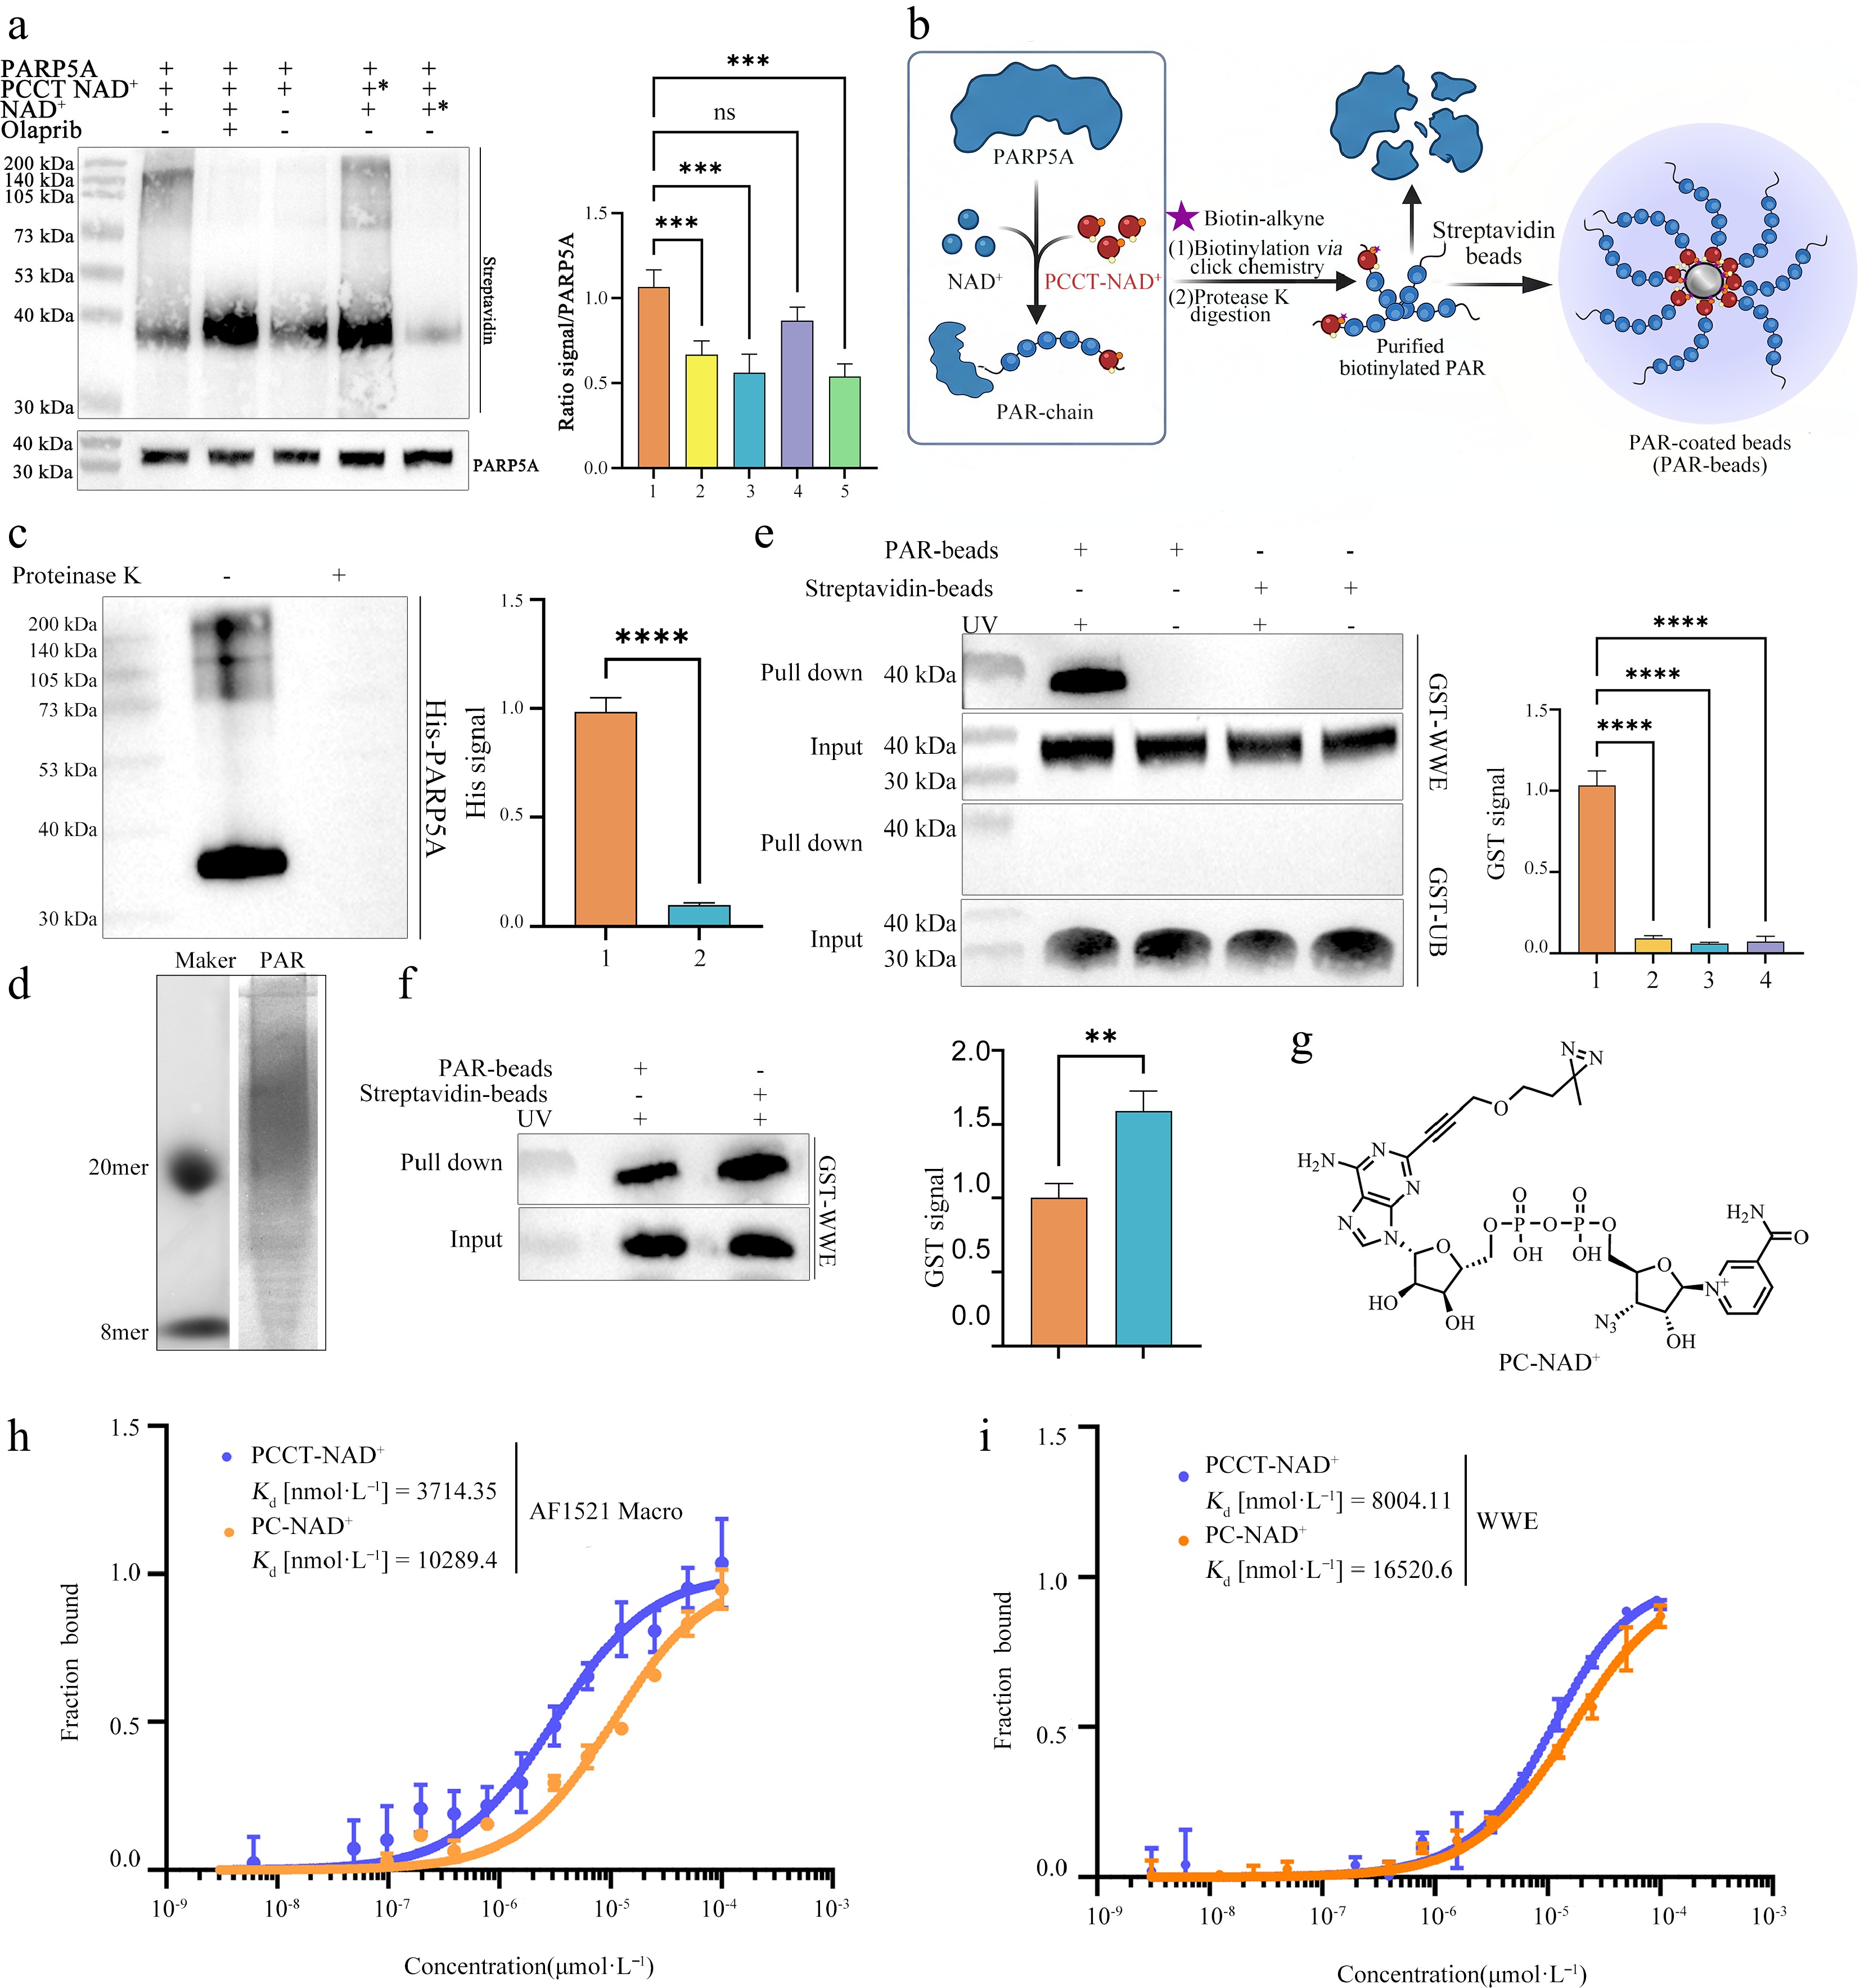
Figure 2.
Construction and functional validation of a bead-immobilized, photo-crosslinkable PAR platform derived from PCCT-NAD+ for specific capture of PAR-binding proteins. (a) In vitro PAR synthesis reactions were performed using recombinant PARP5A (10 μmol•L−1) incubated with NAD+ (1 mmol•L−1) or/and PCCT-NAD+ (0.2 mmol•L−1) at 30 °C for 2 h. Control conditions were included to evaluate NAD+ dependence, inhibition by the PARP inhibitor olaparib (100 μmol•L−1), and the effect of delayed substrate addition. Conditions marked with an asterisk (*) indicate that the indicated component (PCCT-NAD+ or NAD+) was added after an initial 2-h incubation. Following the reactions, samples were subjected to click chemistry at 37 °C for 2 h. Reaction products were resolved by SDS-PAGE and analyzed by streptavidin blotting to detect PCCT-NAD+-labeled PAR polymers. PARP5A was detected as a loading control (lower panel). Right panel shows densitometric quantification of streptavidin signals in the left panel normalized to PARP5A input. (b) Schematic workflow: PAR polymers were synthesized by PARP5A using NAD+ and PCCT-NAD+, followed by proteinase K digestion to remove PARP5A and purify protein-free PAR. The resulting PAR was then covalently immobilized on magnetic streptavidin beads for subsequent interactor capture. (c) Immunoblot analysis of samples before and after proteinase K treatment (100 μg·mL−1, 60 °C, 30 min) using an anti-His antibody to monitor removal of His-tagged PARP5A (left). Right, densitometric quantification of His signal (**** P < 0.0001). (d) Native PAGE analysis showing the chain length distribution of purified PAR polymers. (e) Photo-cross-linking of PAR-beads with model interacting proteins. A 50 μL sample of PAR-beads was incubated with 50 μg GST-WWE for 10 min, followed by 365 nm UV irradiation for 15 min. After overnight incubation at 4 °C, samples were analyzed by immunoblotting with anti-GST-HRP under different PAR/UV conditions. Top, GST-WWE as a PAR reader; bottom, GST-Ub as a non-binder control; right, densitometric quantification (**** P < 0.0001). (f) Assessment of binding efficiency enhancement by bead immobilization. Residual GST-WWE remaining in the supernatant after incubation with PAR-beads or free PAR was detected by immunoblotting with an anti-GST-HRP conjugate (left). Densitometric quantification of residual supernatant GST signal (right). (** P < 0.01). (g) Chemical structure of the previously reported photo-crosslinkable NAD+ analog PC-NAD+. (h), (i) MST binding curves showing the interaction of two target proteins with PAR polymers derived from PCCT-NAD+ (blue) and PC-NAD+ (orange). (h) AF1521 Macro binding to PCCT-NAD+-derived PAR (orange, Kd = 10,289.4 nmol•L−1) and PC-NAD+-derived PAR (blue, Kd = 3,714.35 nmol•L−1). (i) WWE domain binding to PCCT-NAD+-derived PAR (orange, Kd = 16,520.6 nmol•L−1) and PC-NAD+-derived PAR (blue, Kd = 8,004.11 nmol•L−1). Data are presented as mean ± SD, n = 3, ns, not significant, *** P < 0.001. P values were calculated using a two-tailed unpaired Student's t-test.
-
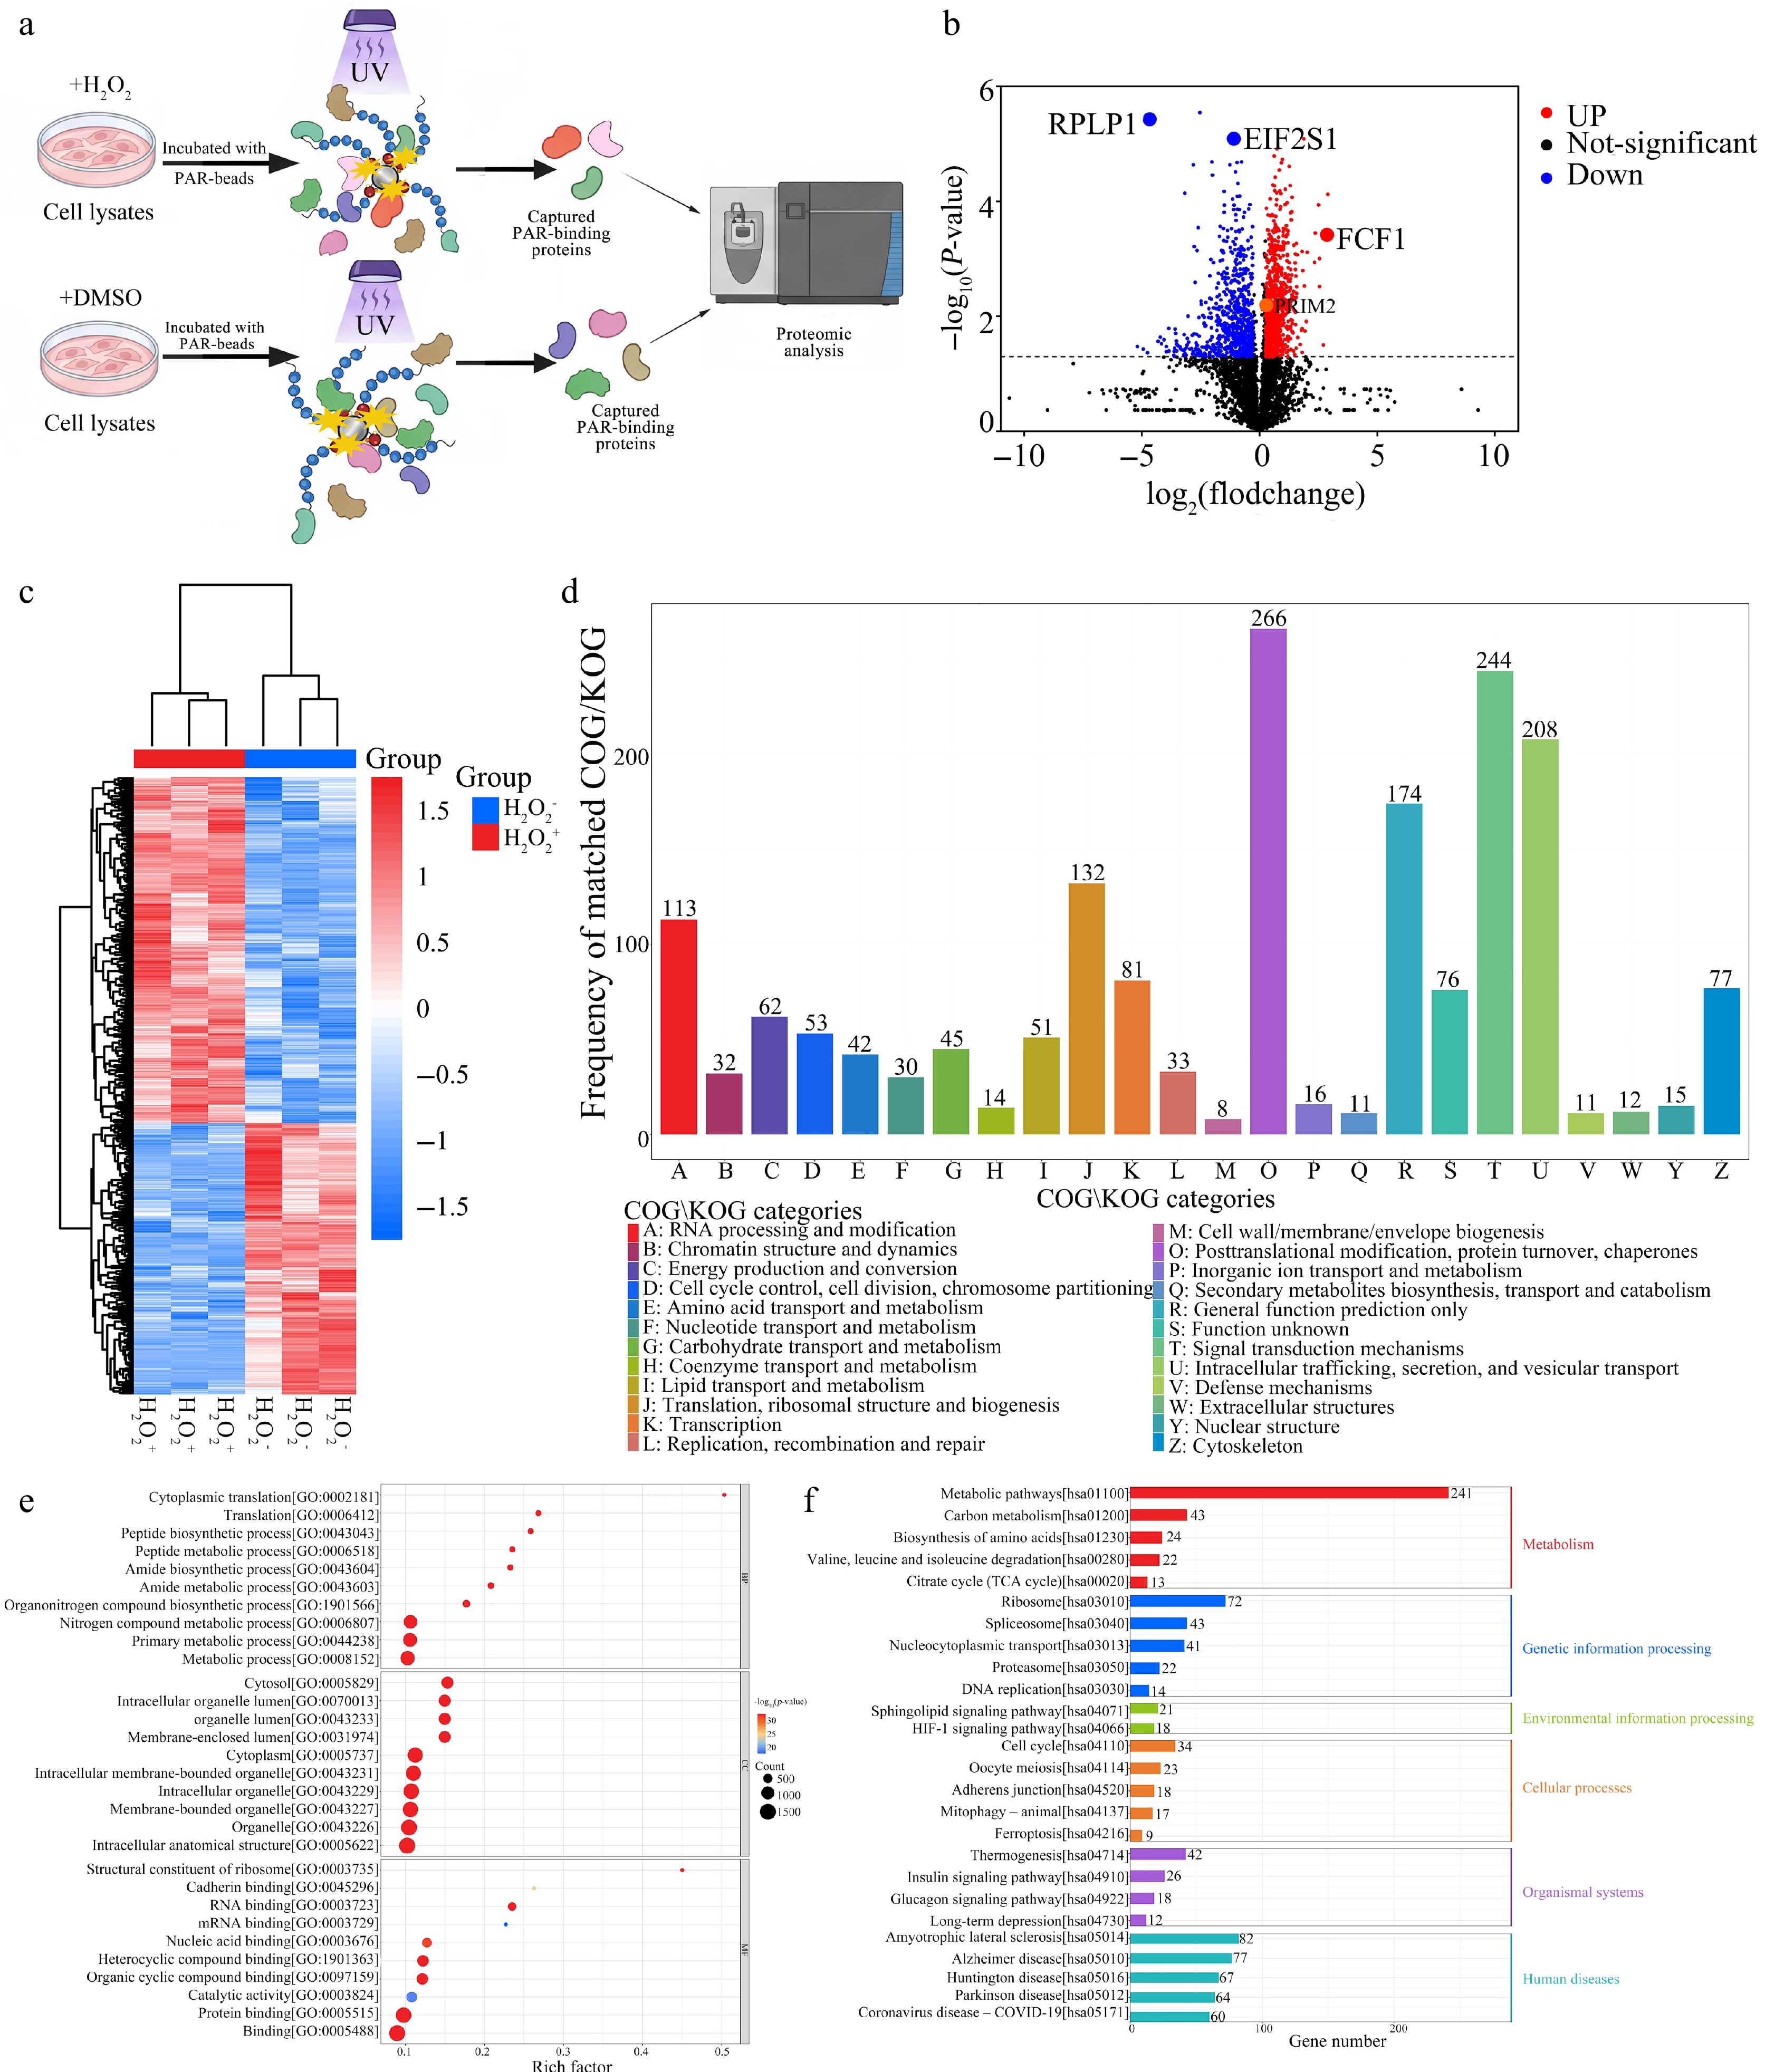
Figure 3.
Proteomic profiling of the PAR-associated interactome under oxidative stress reveals widespread remodeling of protein synthesis and proteostasis networks. (a) Schematic workflow for systematic characterization of PAR-associated interactome remodeling under oxidative stress. Cell lysates from H2O2- or DMSO-treated samples were incubated with PAR-coated beads, followed by UV-assisted photo-crosslinking, stringent washing, on-bead tryptic digestion, and quantitative proteomic analysis by DIA-MS. (b) Volcano plot showing differential enrichment of PAR-interacting proteins in H2O2-treated cells relative to DMSO vehicle control based on three independent biological replicates. Statistical cutoffs were set to FC ≥ 1.2 or FC ≤ 0.83 and adjusted P < 0.05 (multiple-testing corrected); selected candidates (RPLP1, EIF2S1, FCF1, PRIM2) are labeled. (c) Hierarchical clustering heatmap of significantly changed PAR-interacting proteins across control and H2O2 conditions, illustrating global remodeling of the PAR-associated interaction landscape. (d) COG/KOG functional classification of significantly changed PAR-interacting proteins. The bar chart displays the distribution of enriched proteins across major functional categories. (e) Gene Ontology (GO) enrichment analysis of significantly changed PAR-interacting proteins. Dot plots depict enriched terms in Biological Process (BP), Cellular Component (CC), and Molecular Function (MF) domains. (f) KEGG pathway enrichment analysis of significantly changed PAR-interacting proteins. Selected enriched pathways are shown.
-
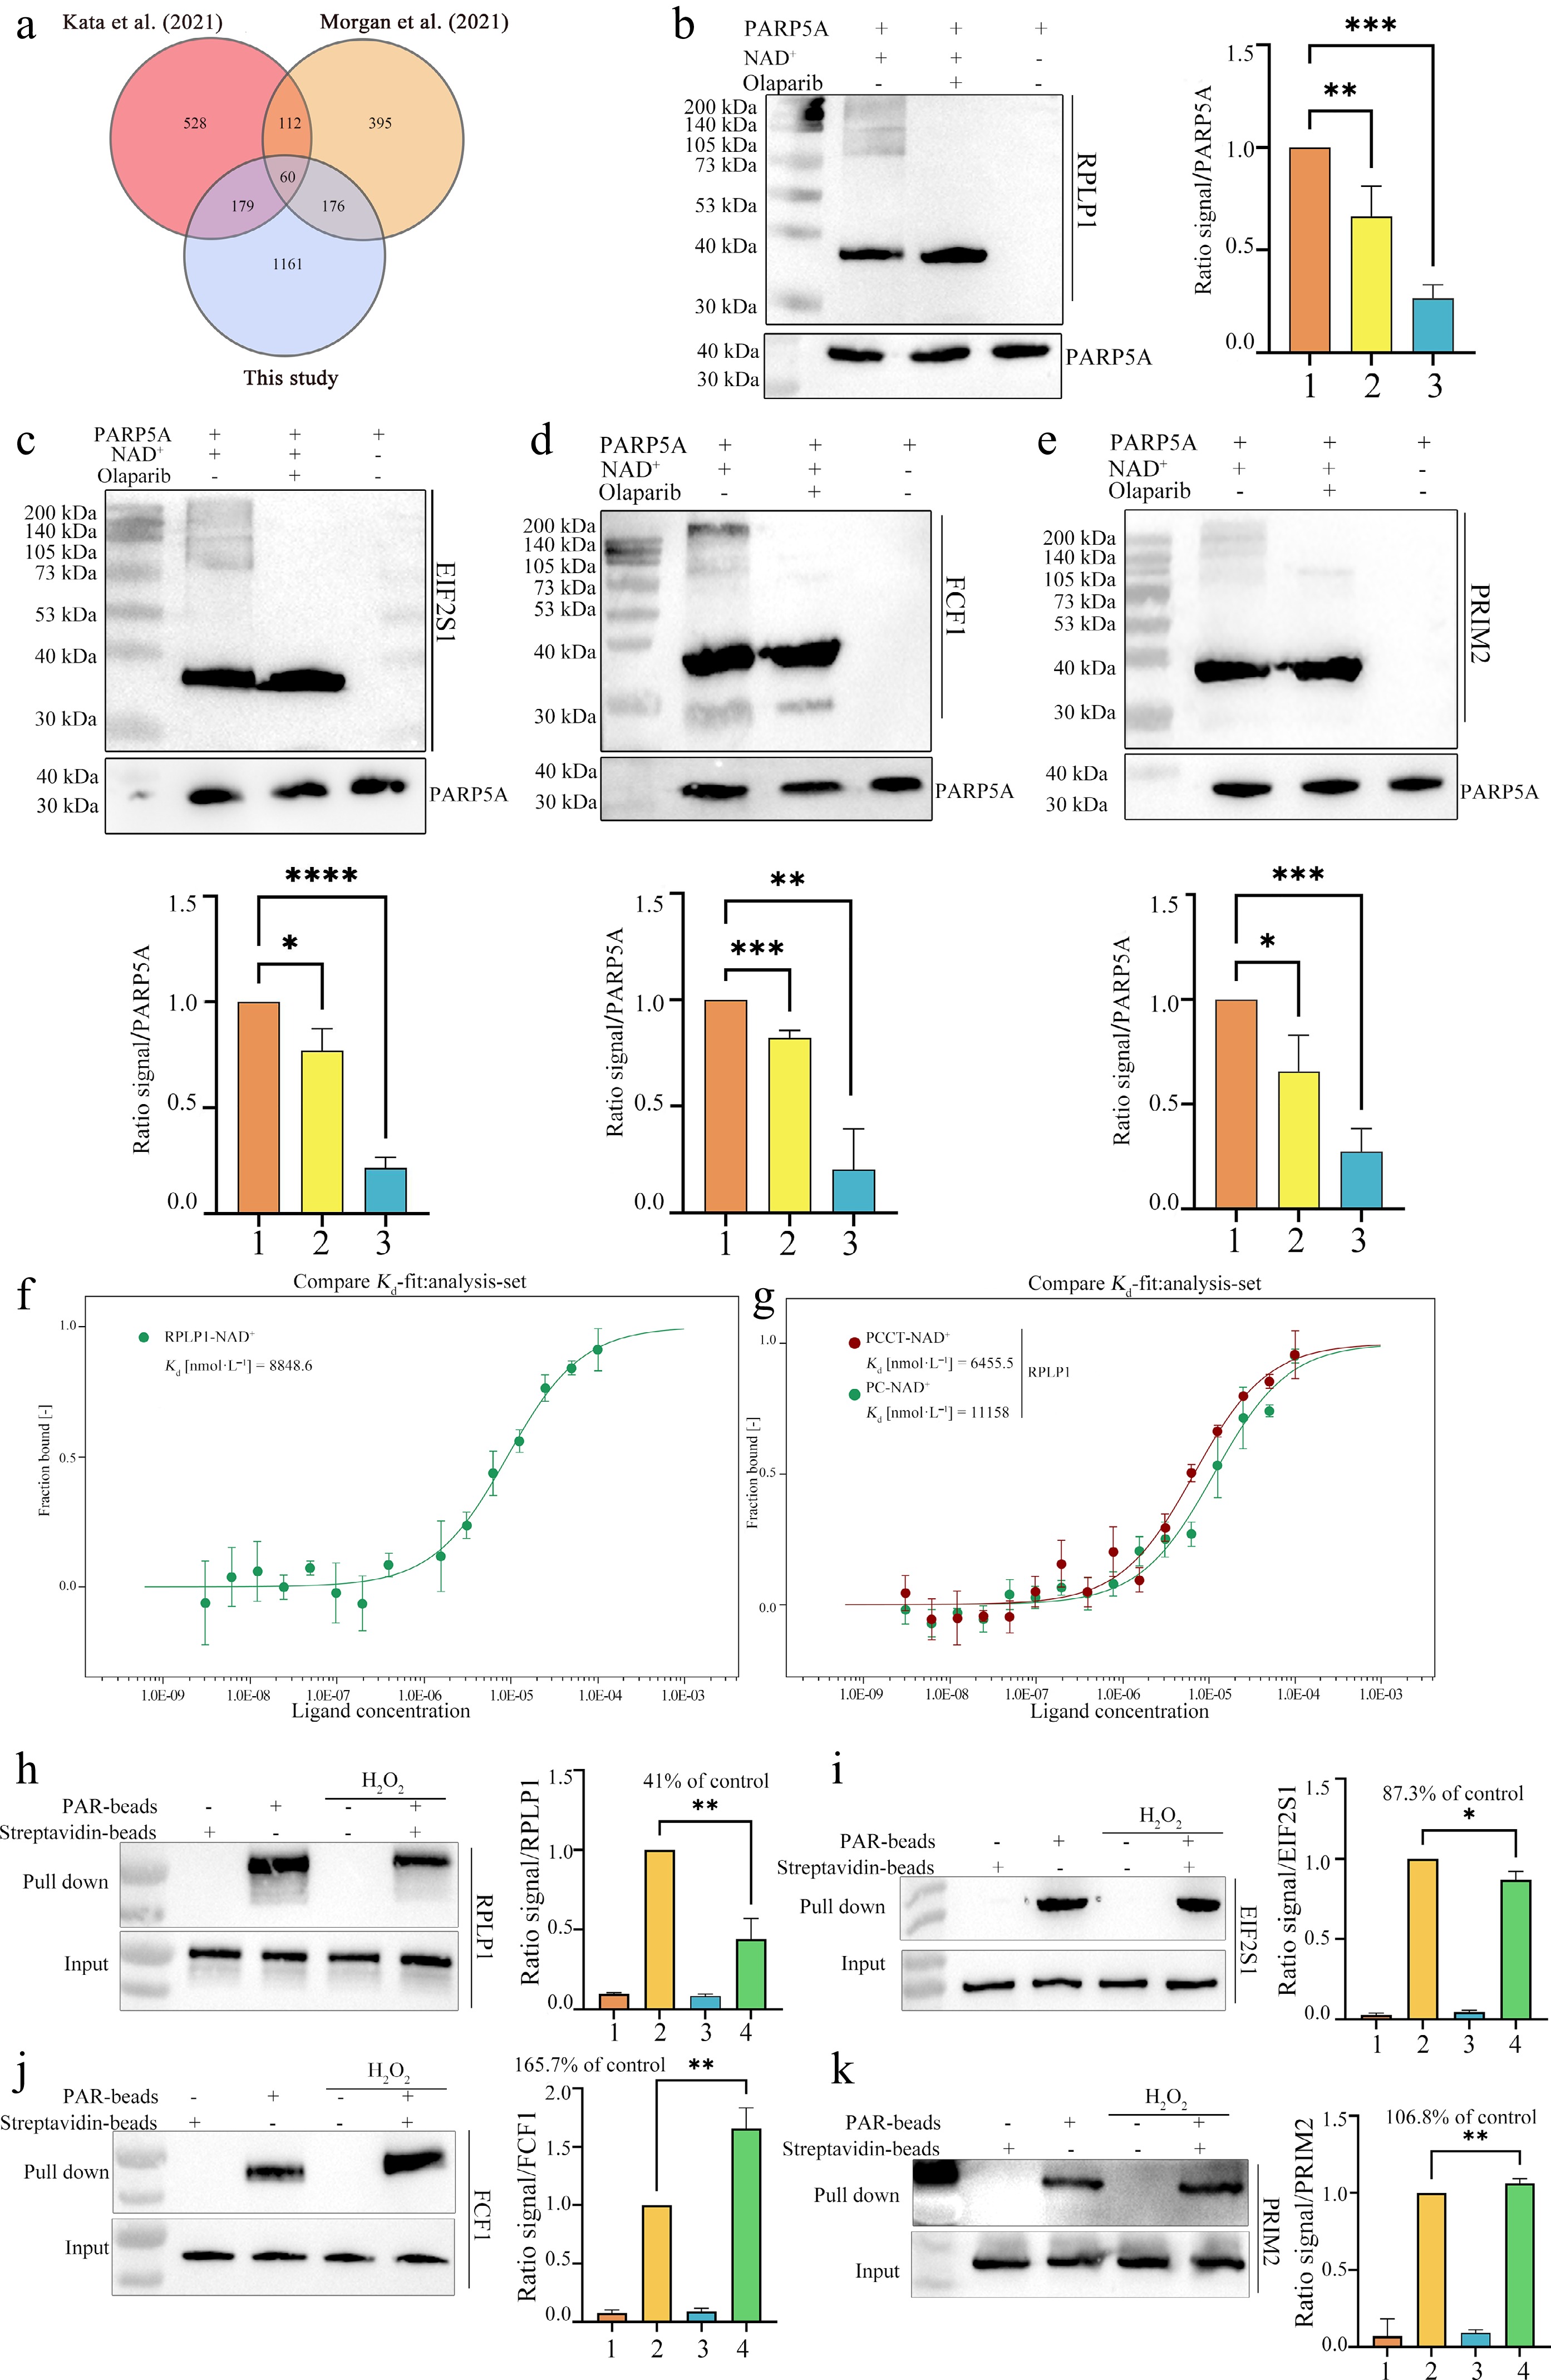
Figure 4.
Validation of representative PAR-interacting proteins identified by the bead-immobilized photo-crosslinkable PAR platform. (a) Venn diagram comparing PAR-interacting proteins identified in this study with those reported in two previously published PAR-centric proteomic datasets (Kata et al.[26]; Morgan et al.[27]). (b)−(e) In vitro PAR overlay assays validating the direct PAR-binding capacity of selected candidates. PAR polymers were synthesized using recombinant PARP5A (10 μmol•L−1) with NAD+ (1 mmol•L−1) in the absence (lane 1) or presence (lane 2) of the PARP inhibitor olaparib (100 μmol•L−1); PARP5A alone served as a negative control (lane 3). Reaction products were resolved by SDS-PAGE, transferred to membranes, and incubated with purified candidate proteins (20 μmol•L−1). Bound proteins were detected by immunoblotting using antibodies against (b) RPLP1 or (c) GST-tag for GST-tagged fusion proteins EIF2S1-GST, (d) FCF1-GST, and (e) PRIM2-GST. PARP5A inputs are shown as loading controls (lower panels). Bottom, densitometric quantification of overlay signals normalized to loading controls. (f), (g) Microscale thermophoresis (MST) binding assays of recombinant RPLP1 with PAR derived from (f) native NAD+ and (g) NAD+ analogs. (f) Binding curve of RPLP1 to PAR derived from native NAD+, with a measured dissociation constant (Kd) of 8,848.6 nmol•L−1. (g) Binding curves of RPLP1 to PAR derived from PCCT-NAD+ (red, Kd = 6,455.5 nmol•L−1) and PC-NAD+ (green, Kd = 11,158 nmol•L−1). (h)–(k) PAR-beads pull-down assays assessing the direct PAR-binding activity of endogenous RPLP1, EIF2S1, FCF1, and PRIM2 under oxidative stress. Lysates from control and H2O2-treated cells were incubated with PAR-coated beads or control streptavidin beads. Bound proteins were detected by immunoblotting, with input samples representing total protein. Bar graphs show densitometric quantification of pull-down signals normalized to the corresponding input, expressed as relative binding activity compared to the untreated control (set to 100%). The remaining PAR-binding activity after H2O2 treatment is indicated. Data are presented as mean ± SD, n = 3. * P < 0.05, ** P < 0.01, *** P < 0.001, **** P < 0.0001, one-way ANOVA followed by Dunnett's post hoc test.
-
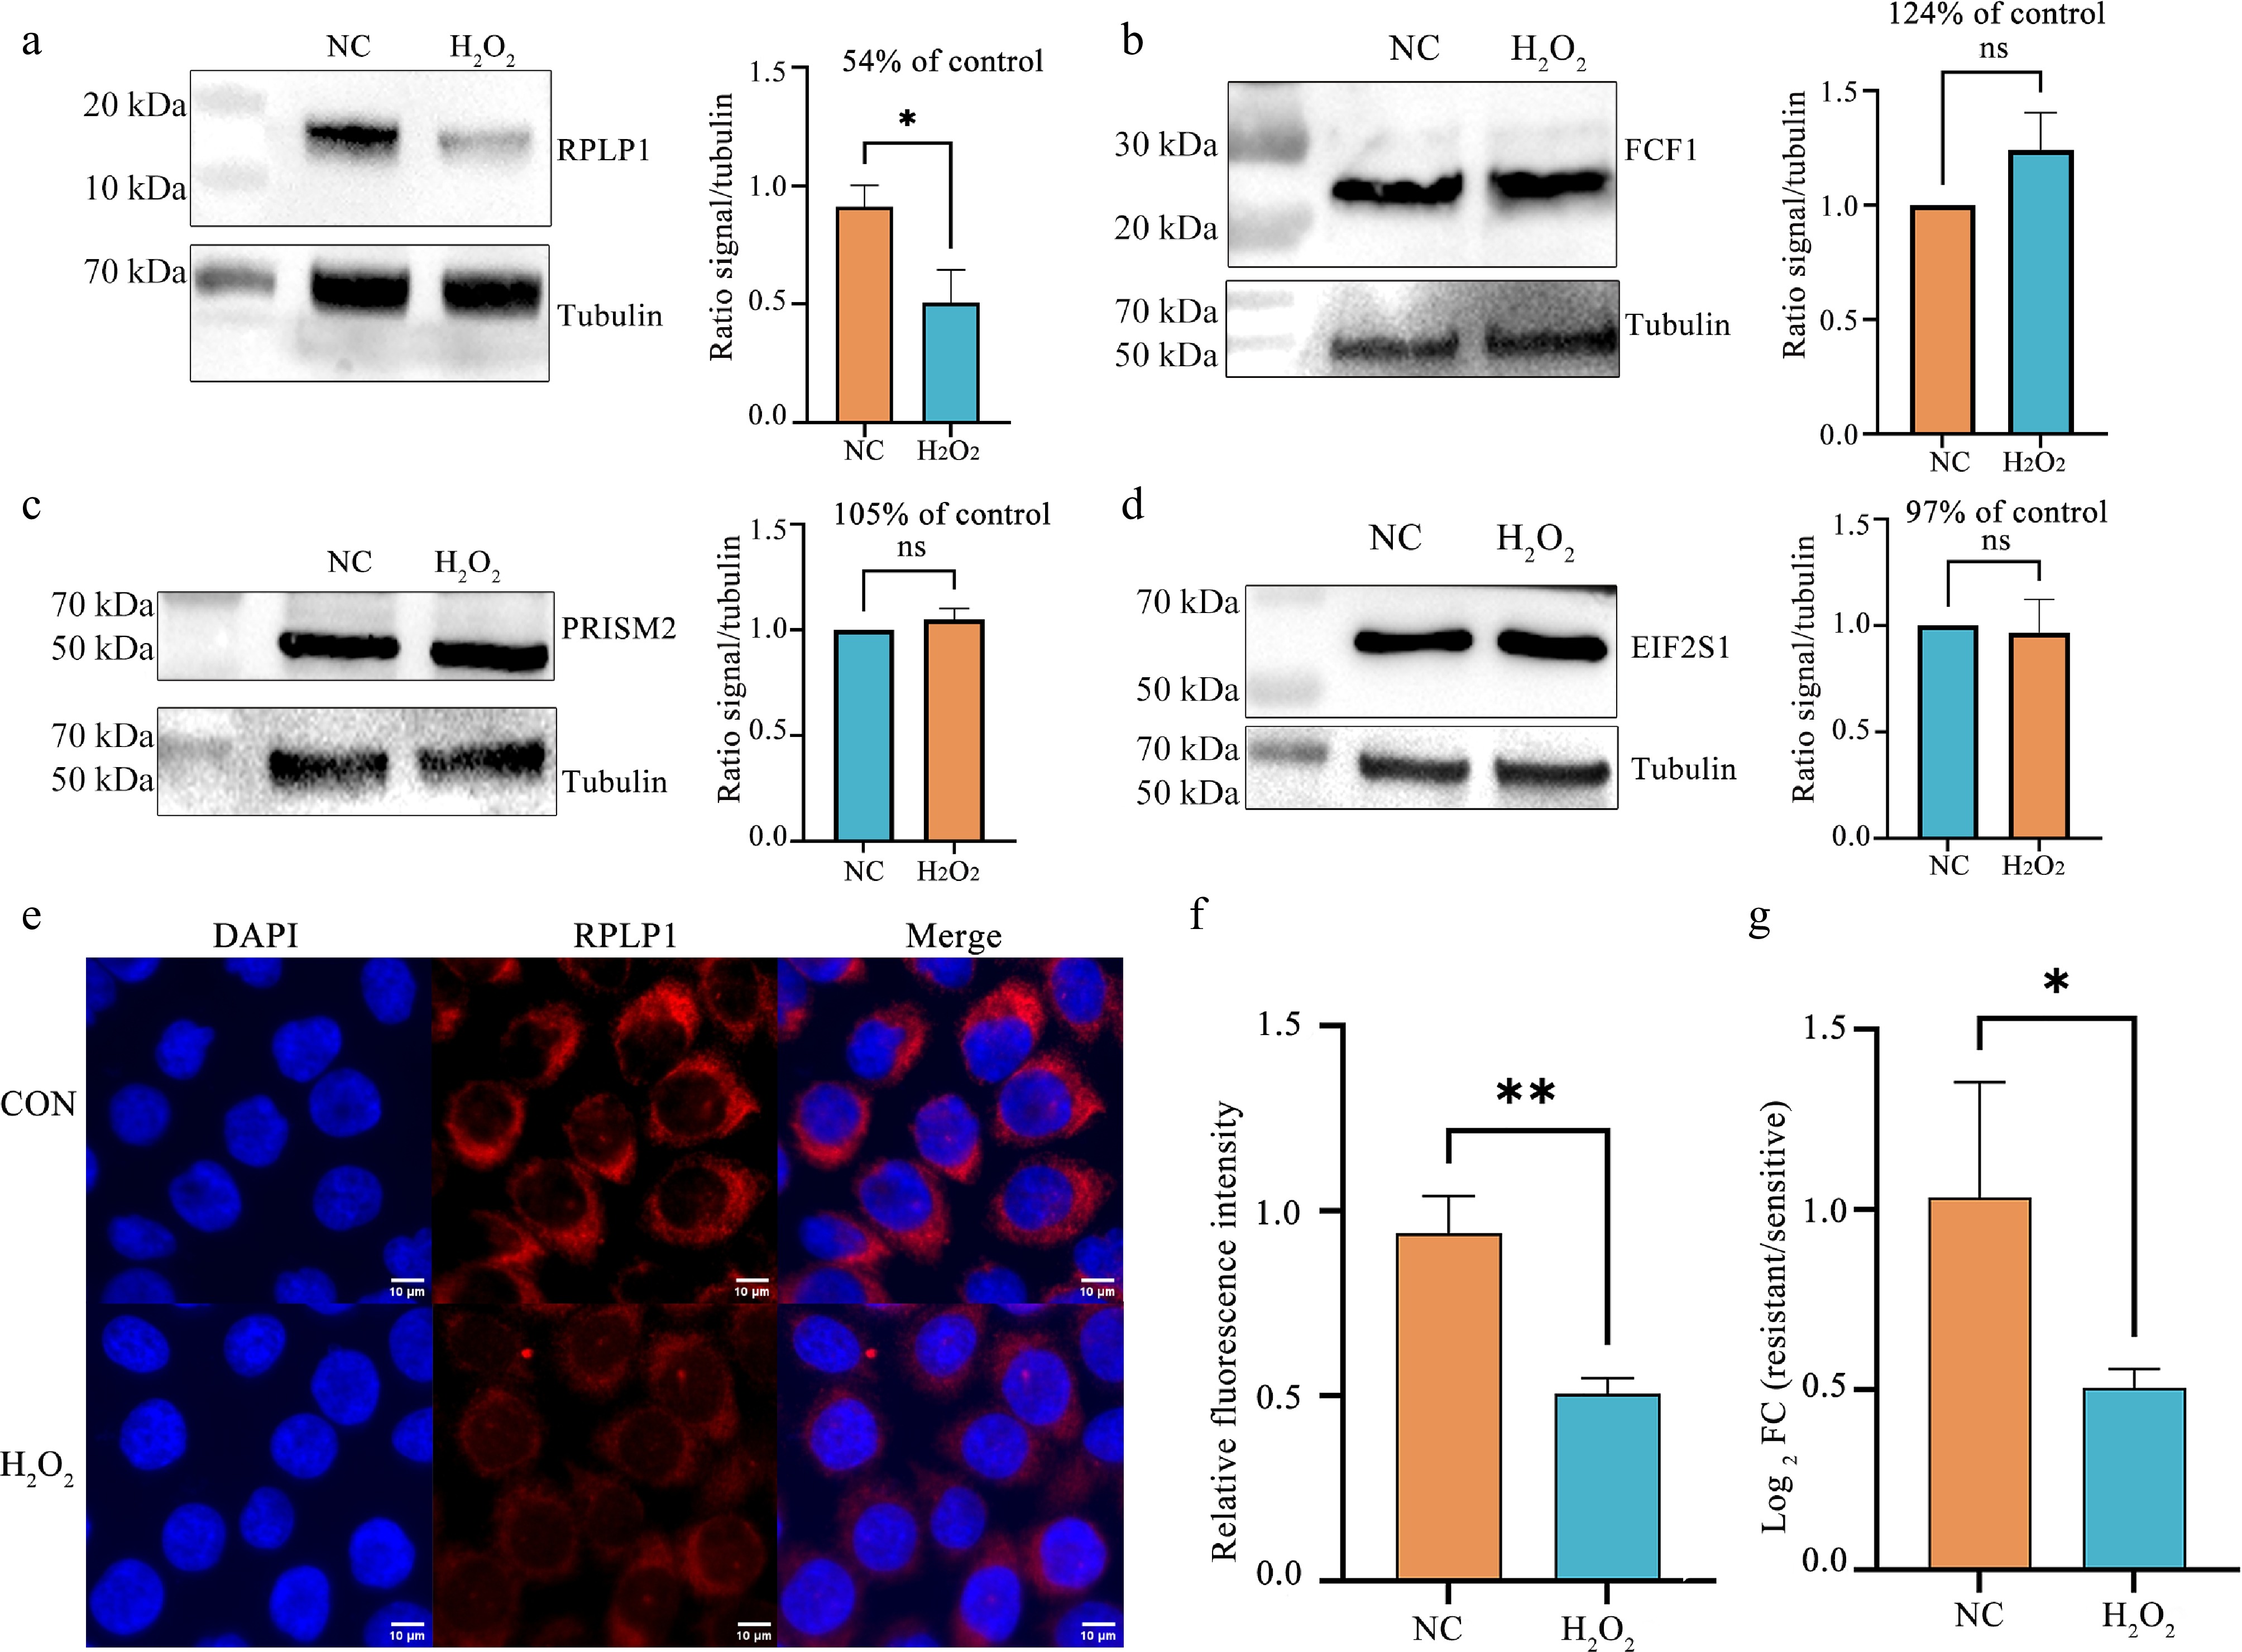
Figure 5.
Validation of oxidative stress-induced changes in selected PAR-interacting proteins and RPLP1 expression. (a)−(d) Immunoblot analysis of (a) RPLP1, (b) FCF1, (c) PRISM2, and (d) EIF2S1 protein levels in DMSO-treated control (NC) cells and cells exposed to H2O2 (500 μmol•L−1, 2 h). Tubulin was used as a loading control. Densitometric quantification of protein levels was normalized to tubulin. * P < 0.05 (two-tailed unpaired Student's t-test). (e) Confocal immunofluorescence images showing nuclear staining (DAPI, blue) and endogenous RPLP1 (red) in DMSO-treated control cells and cells exposed to H2O2 (500 μmol•L−1, 2 h). Scale bar, 10 μm. (f) Quantification of relative cellular RPLP1 fluorescence intensity from images in (a). Data are presented as mean ± SD (n ≥ 80 cells per condition). ** P < 0.01 (two-tailed unpaired Student's t-test). (g) RT-qPCR analysis of RPLP1 mRNA levels following H2O2 treatment (500 μmol•L−1, 2 h). Relative expression was calculated using the 2−ΔΔCᴛ method, with values normalized to the DMSO control group (set to 1.00). Data are presented as mean ± SD, n = 3. Statistical significance was assessed on ΔCᴛ values using a two-tailed unpaired Student's t-test (* P < 0.05).
Figures
(5)
Tables
(0)