-
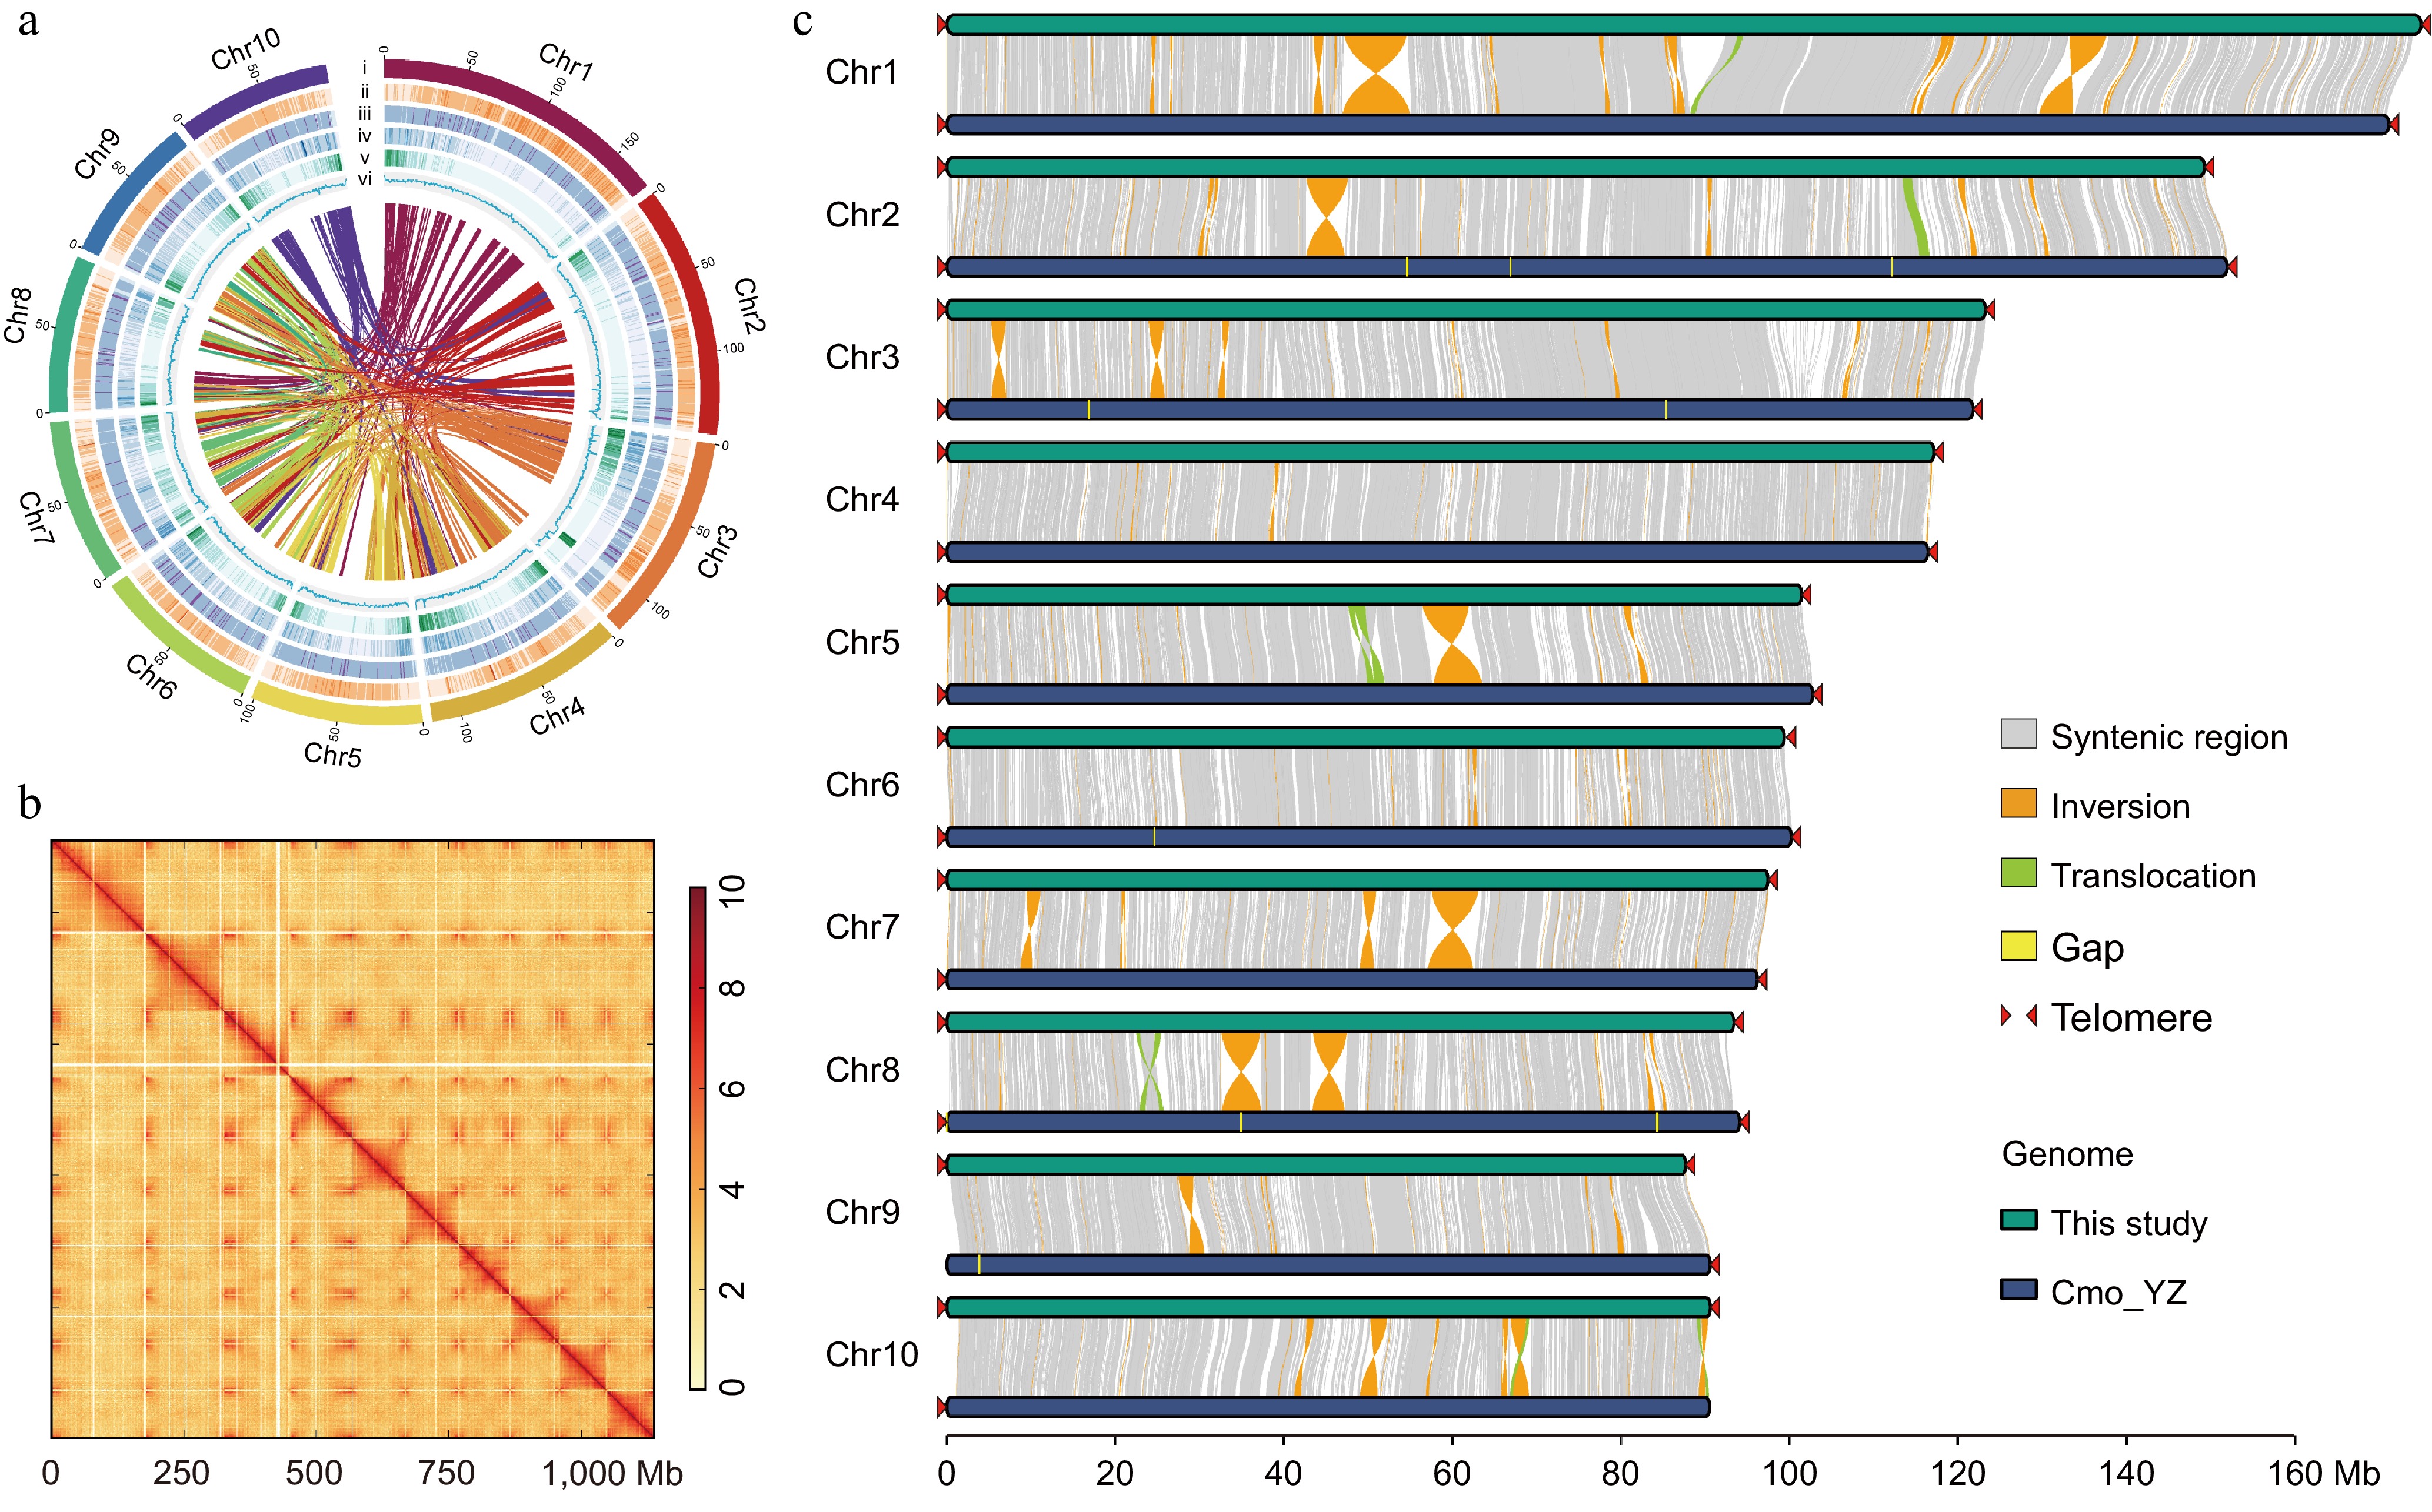
Figure 1.
Assembly of the C. monnieri genome. (a) The circos plot of features across the chromosomes of C. monnieri. Tracks i–vi represent the chromosomes, LTR/Gypsy, LTR/Copia, DNA-TEs, gene, and GC content, respectively. (b) Heatmap displaying whole-genome Hi-C interaction frequencies for C. monnieri. The intensity of the interactions is represented by colors shading from yellow (low) to red (high). (c) Collinearity mapping between this study (top) and Cmo_YZ[11] (bottom). Gray ribbons connect collinear regions between the two genomes. Gap regions are represented by yellow blocks in Cmo_YZ assembly. The triangles at the ends of chromosomes indicate the identified telomeric repeat sequences.
-
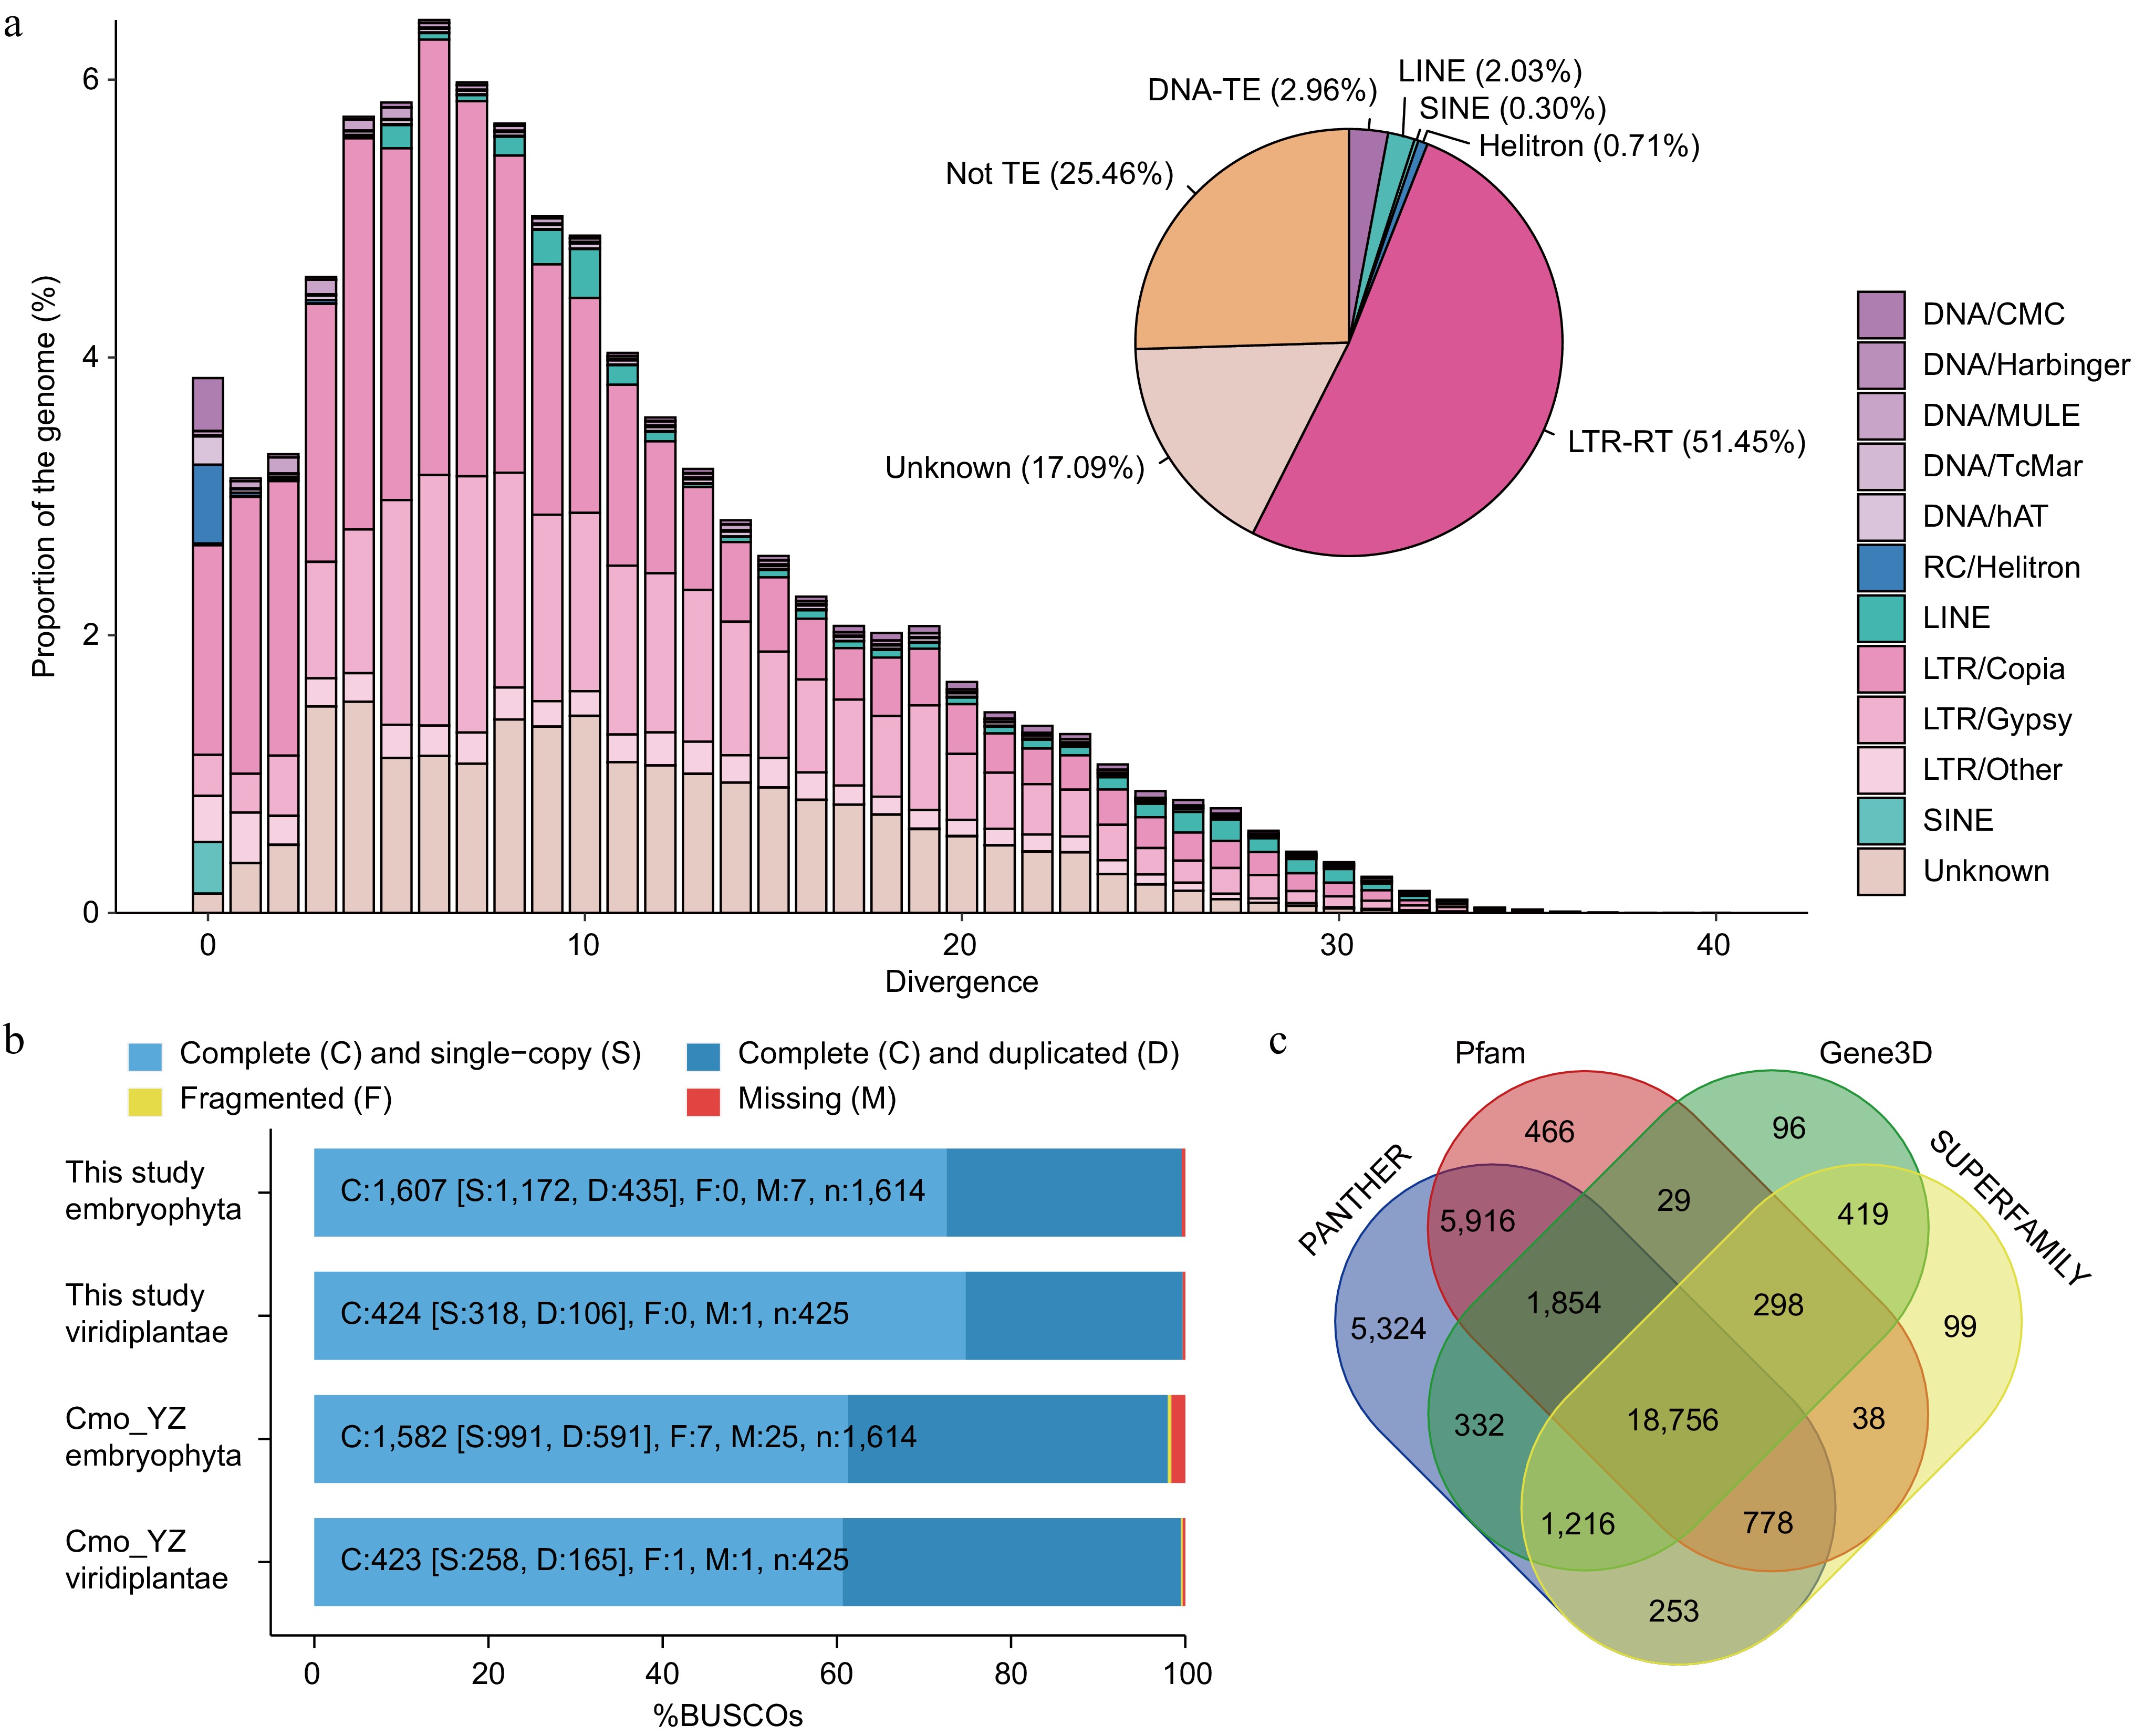
Figure 2.
Characterization of TEs and protein-coding genes in the C. monnieri genome. (a) A repeat landscape of the C. monnieri genome. The x-axis (divergence) represents the Kimura 2-parameter distance between individual repeat elements and their corresponding consensus sequences. The inset pie chart illustrates the percentage of TEs within the whole genome. (b) BUSCO completeness for the different datasets. (c) Venn diagram of the annotation results from different databases.
-
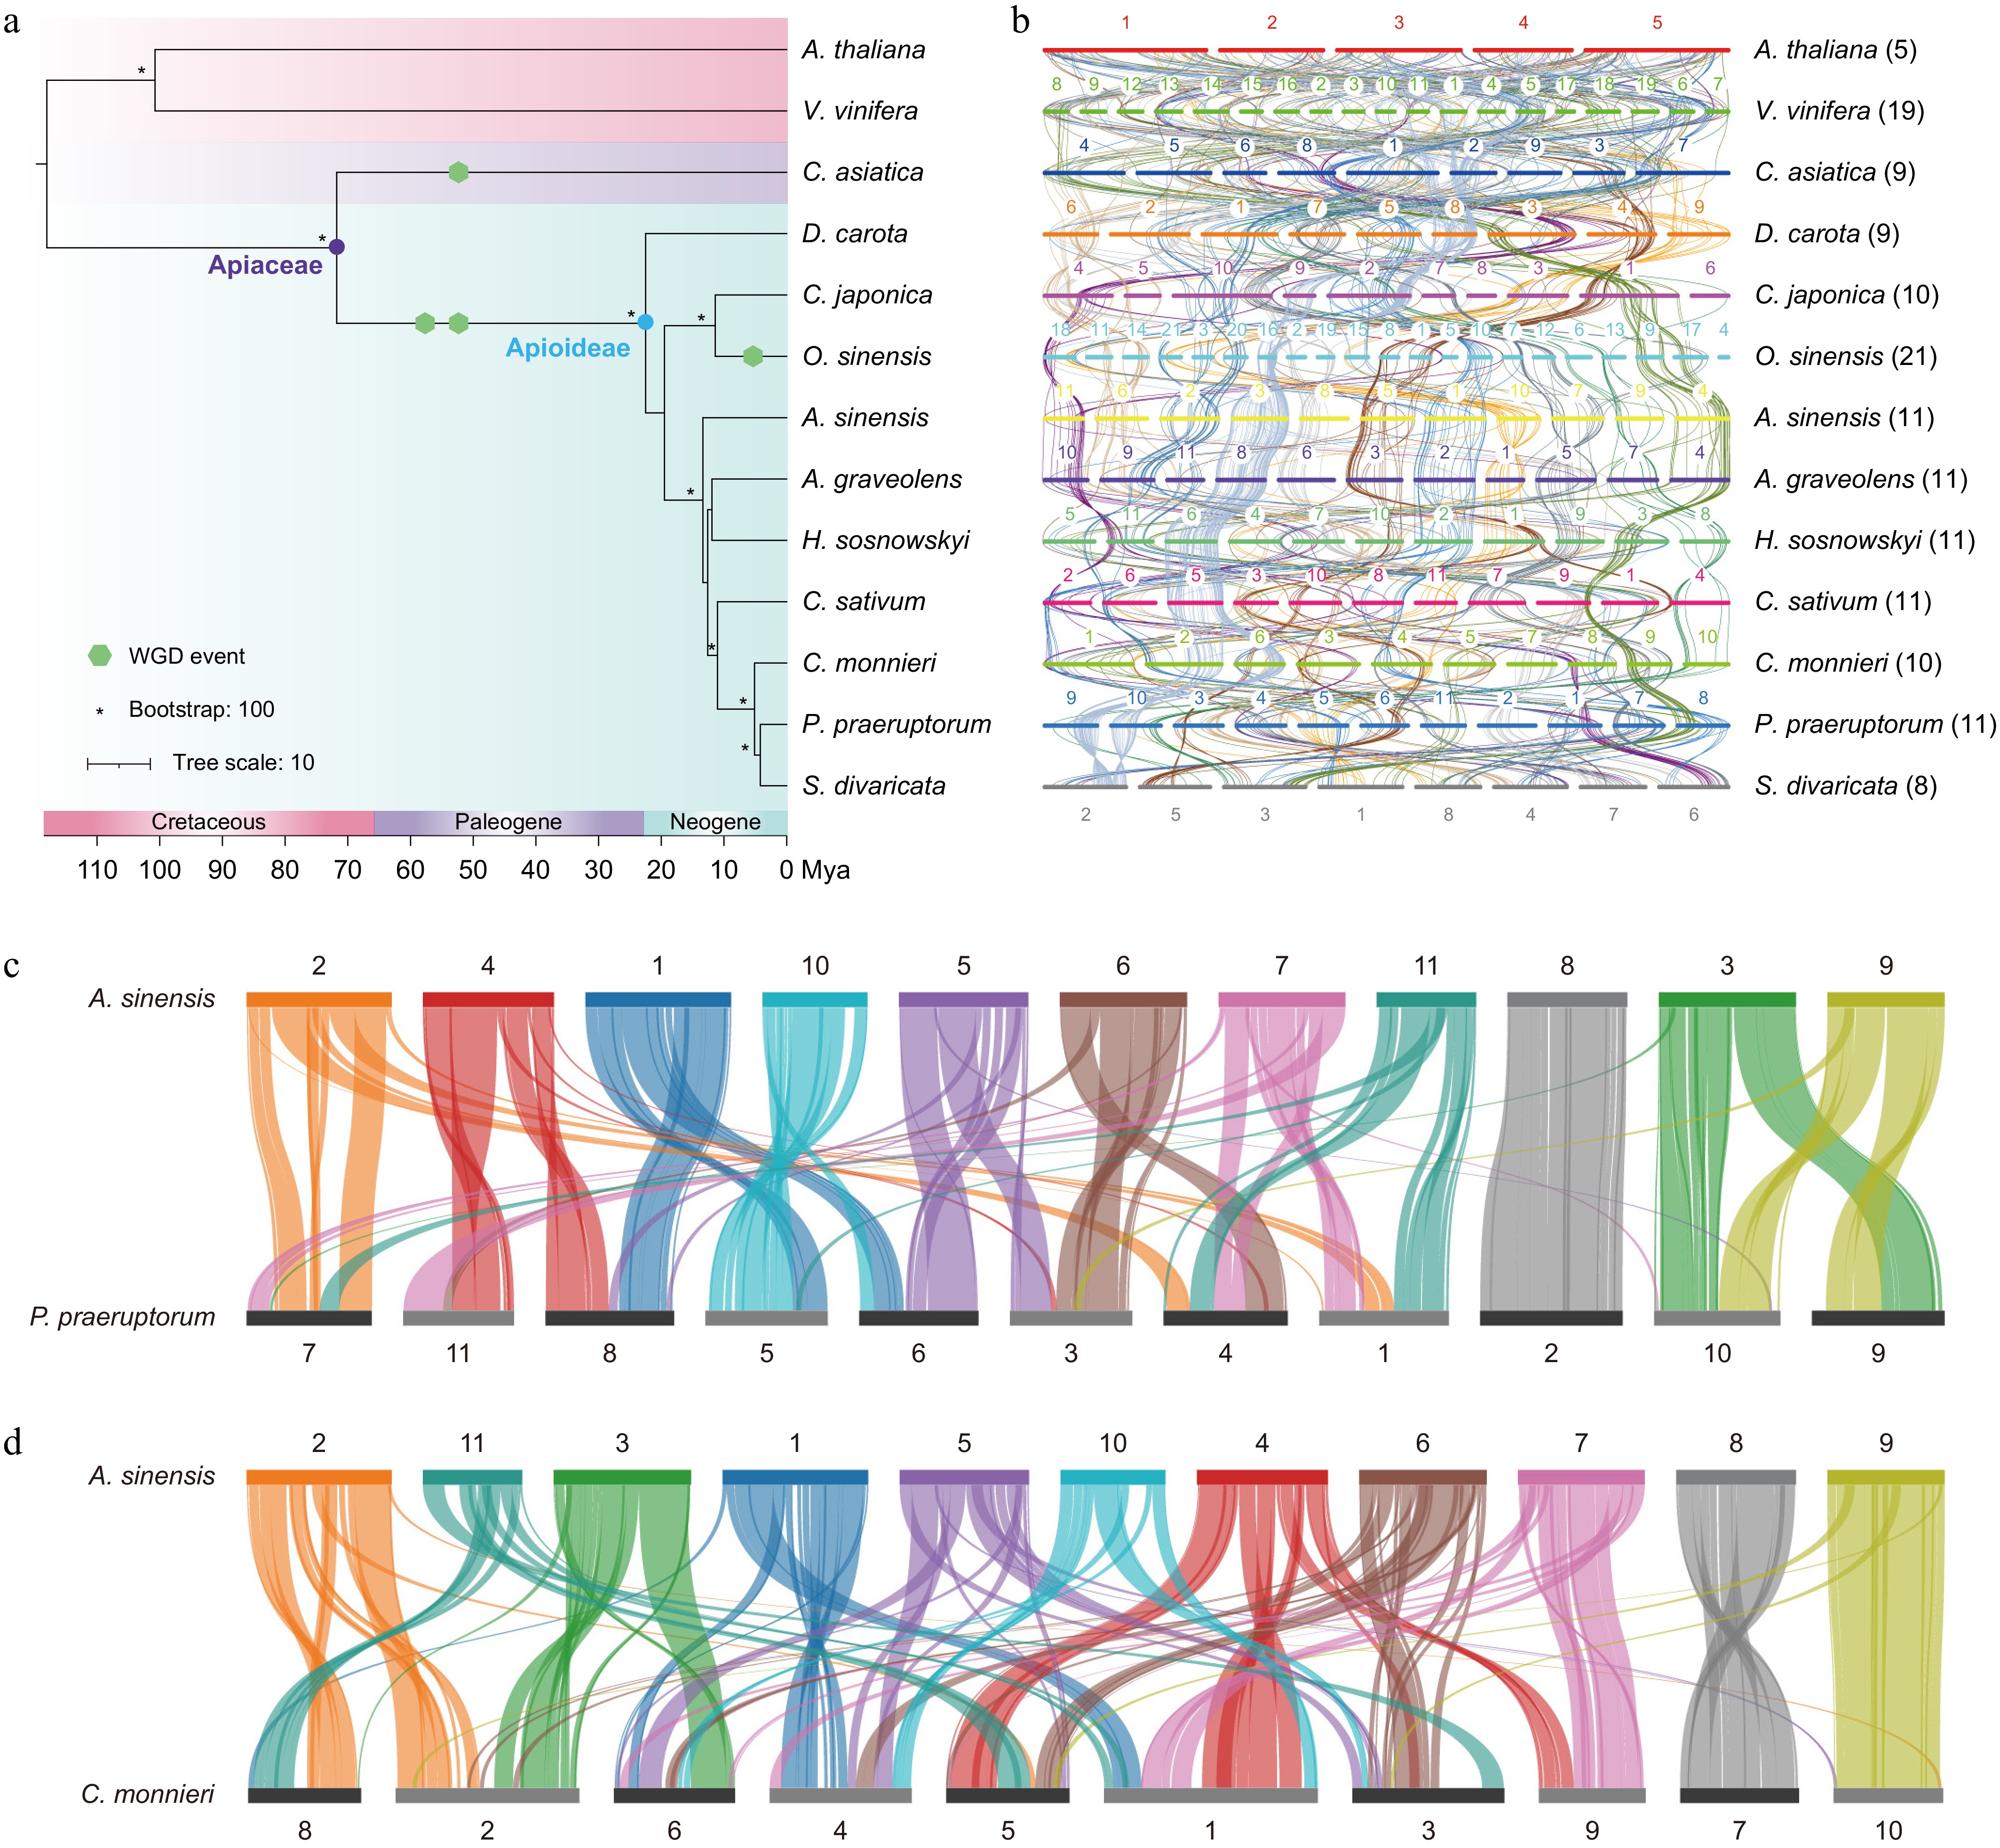
Figure 3.
Genome evolution of C. monnieri and Apiaceae. (a) Phylogenetic analysis of C. monnieri and other Apiaceae lineages. (b) Syntenic analysis of the Apiaceae species. (c) Synteny blocks between A. sinensis and P. praeruptorum. (d) Synteny blocks between A. sinensis and C. monnieri. For (c) and (d), the colored ribbons represent syntenic blocks identified by MCScanX and visualized using SynVisio. Numbers indicate chromosome identification numbers (IDs).
Figures
(3)
Tables
(0)