-
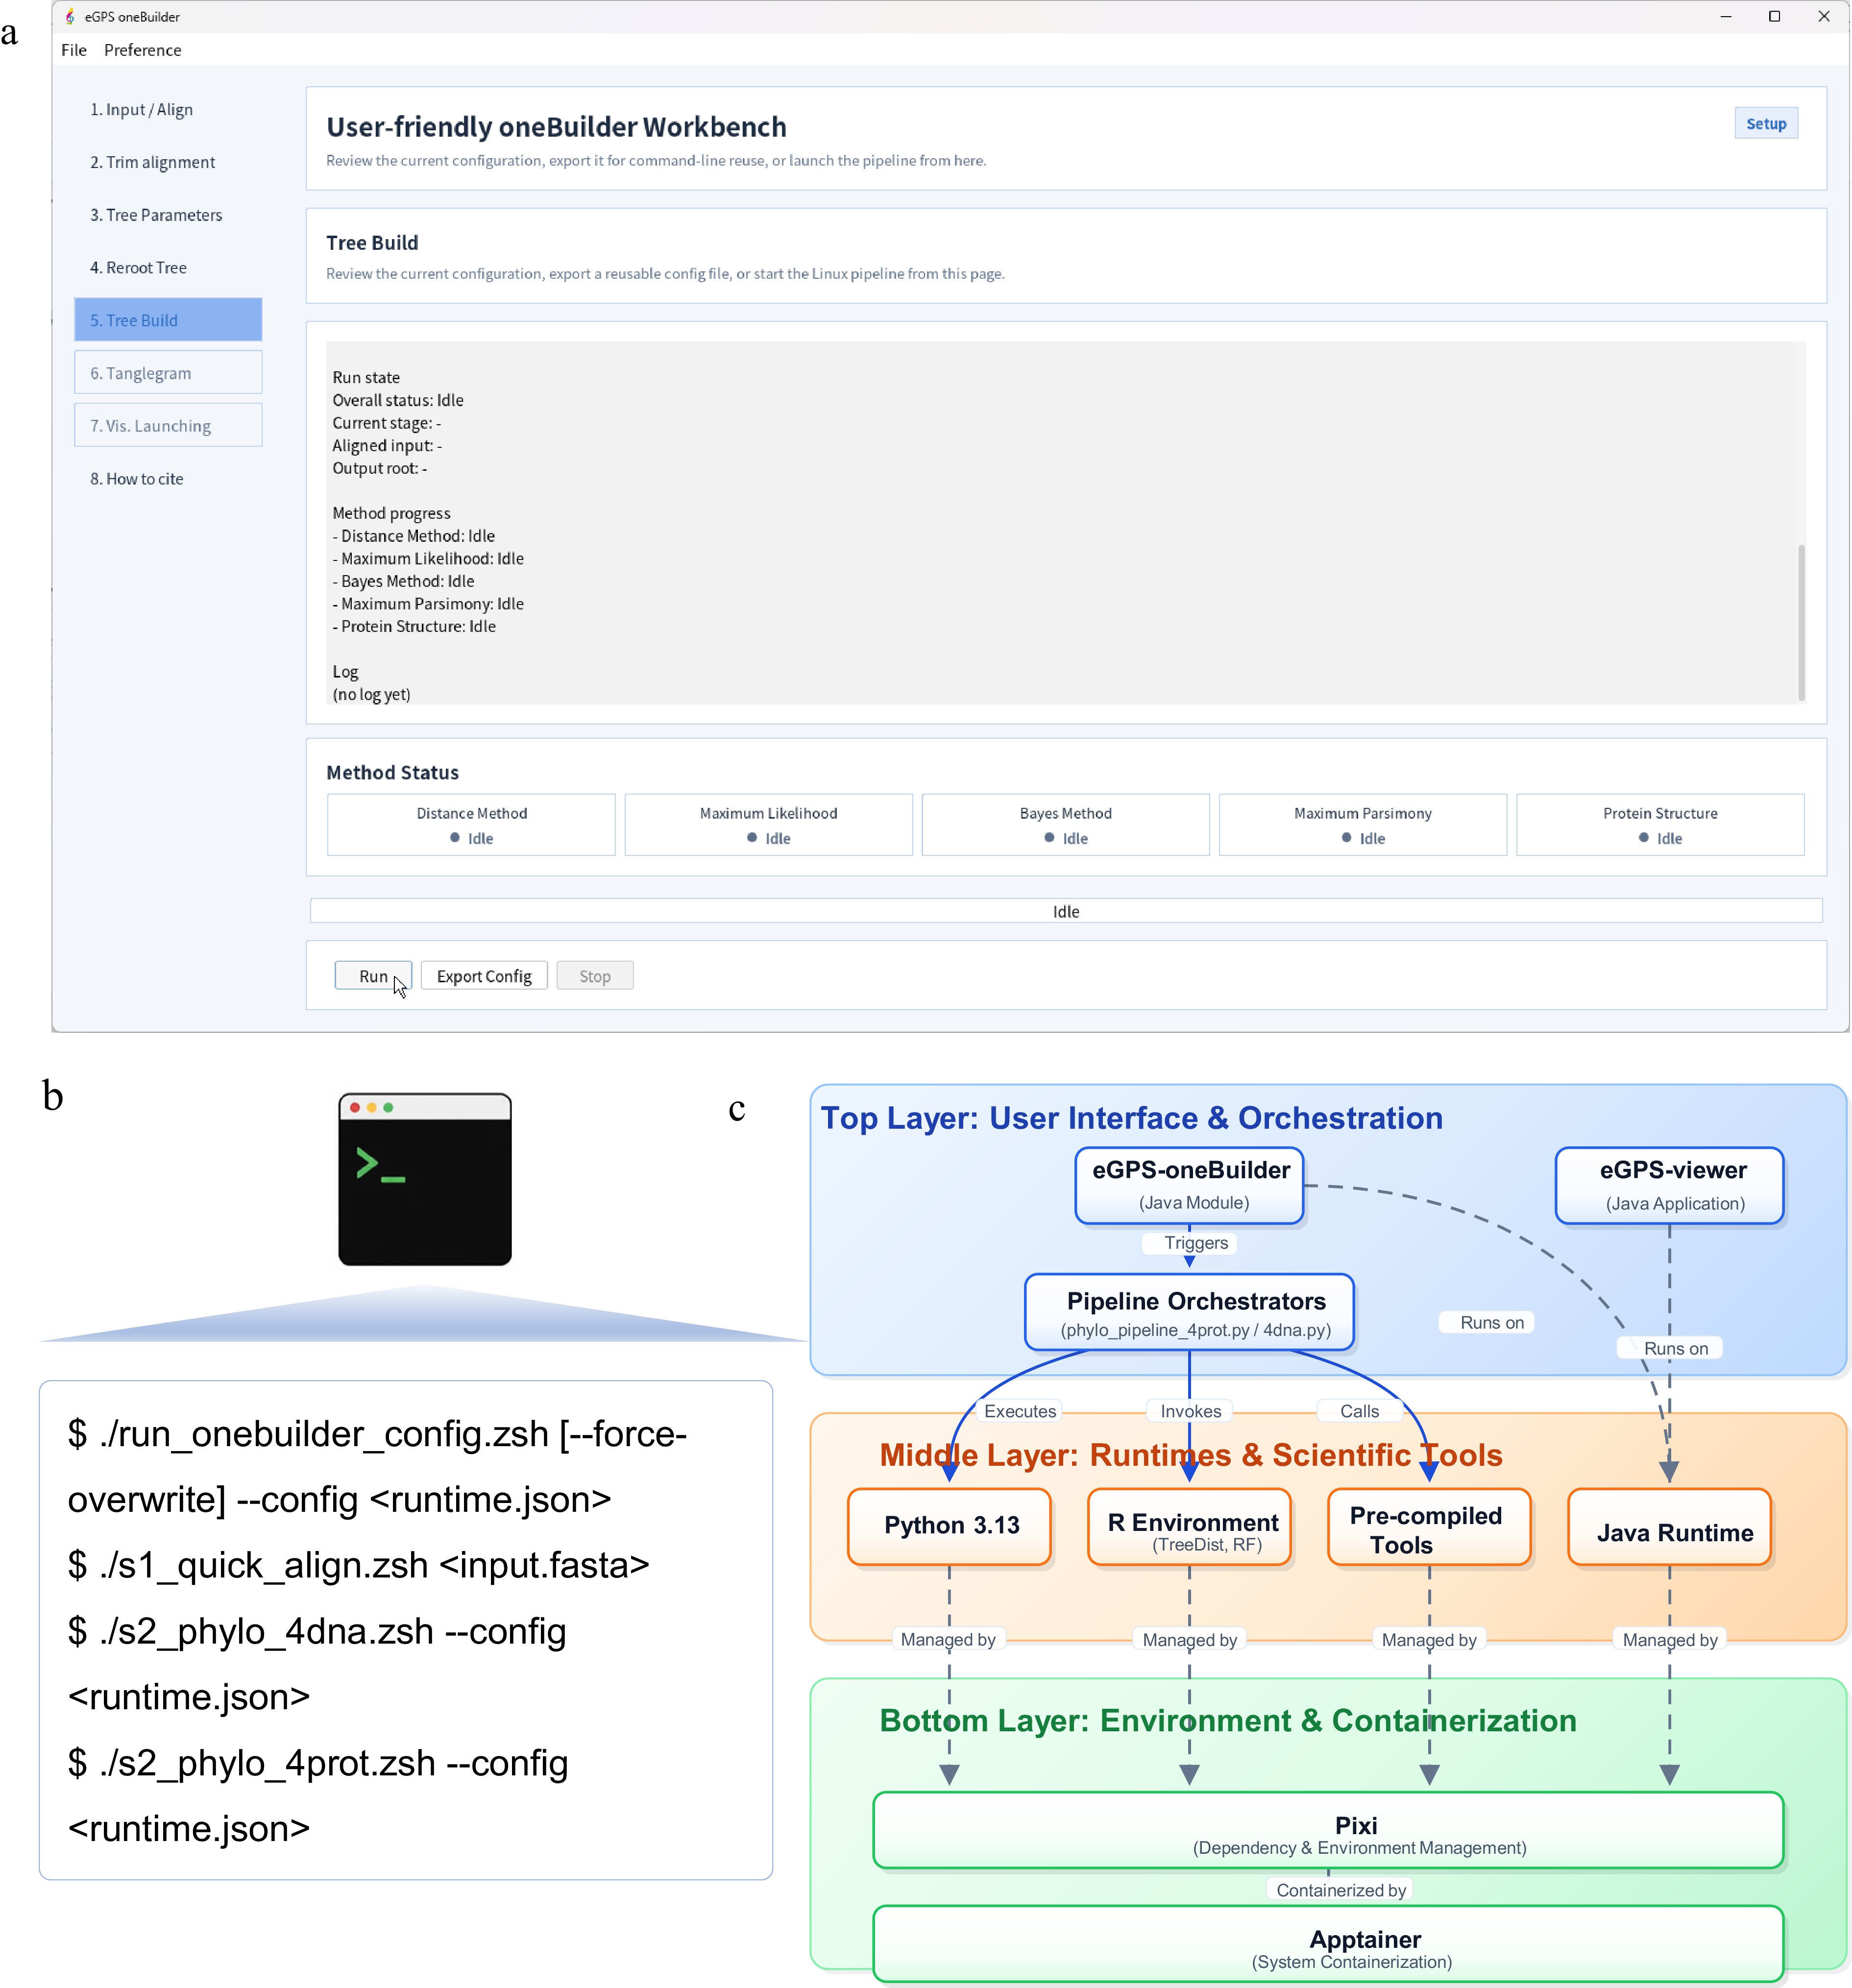
Figure 1.
Overview of the user-friendly oriented design of a reproducible one-stop GUI-CLI bridge workflow. (a) eGPS-oneBuilder GUI organizes input/alignment, parameter configuration, tree building, and downstream visualization in a guided tabbed workflow. The steps are organized as liner workflows, and the tab 'Tree Build' demonstrates the core step of the tree-building method with broad methodological paradigms: distance-based, parsimony, likelihood-based, and Bayesian approaches. For protein sequences, the protein structure-based clustering tree is also supported. (b) GUI-selected settings are exported as a reusable runtime JSON file and replayed by command-line scripts. The command-line interface is allowed for bioinformaticians. Users can save the configuration from the GUI and replay the analysis without intervention. Thus, the eGPS-oneBuilder implements a reproducible one-stop GUI-CLI bridge. Please see the 'Application to human WNT and FZD paralogs' section for a practical application scenario. (c) The software solves the installation pinpoint by invoking the apptainer (
https://apptainer.org ) and pixi (https://pixi.prefix.dev/latest ) technology. The architecture of the software is structured into three layers: a top layer for user interfaces and workflow orchestration (eGPS-oneBuilder runs one), a middle layer providing essential runtimes (Java, Python, R) and analytical tools, and a bottom layer ensuring reproducible environments via Pixi and Apptainer. The dashed line means direct runs on or program dependencies, while the round rectangles represent the entities of packages. eGPS-oneBuilder is run on Linux, while the eGPS-viewer is portable and not limited to the results of eGPS-oneBuilder. -
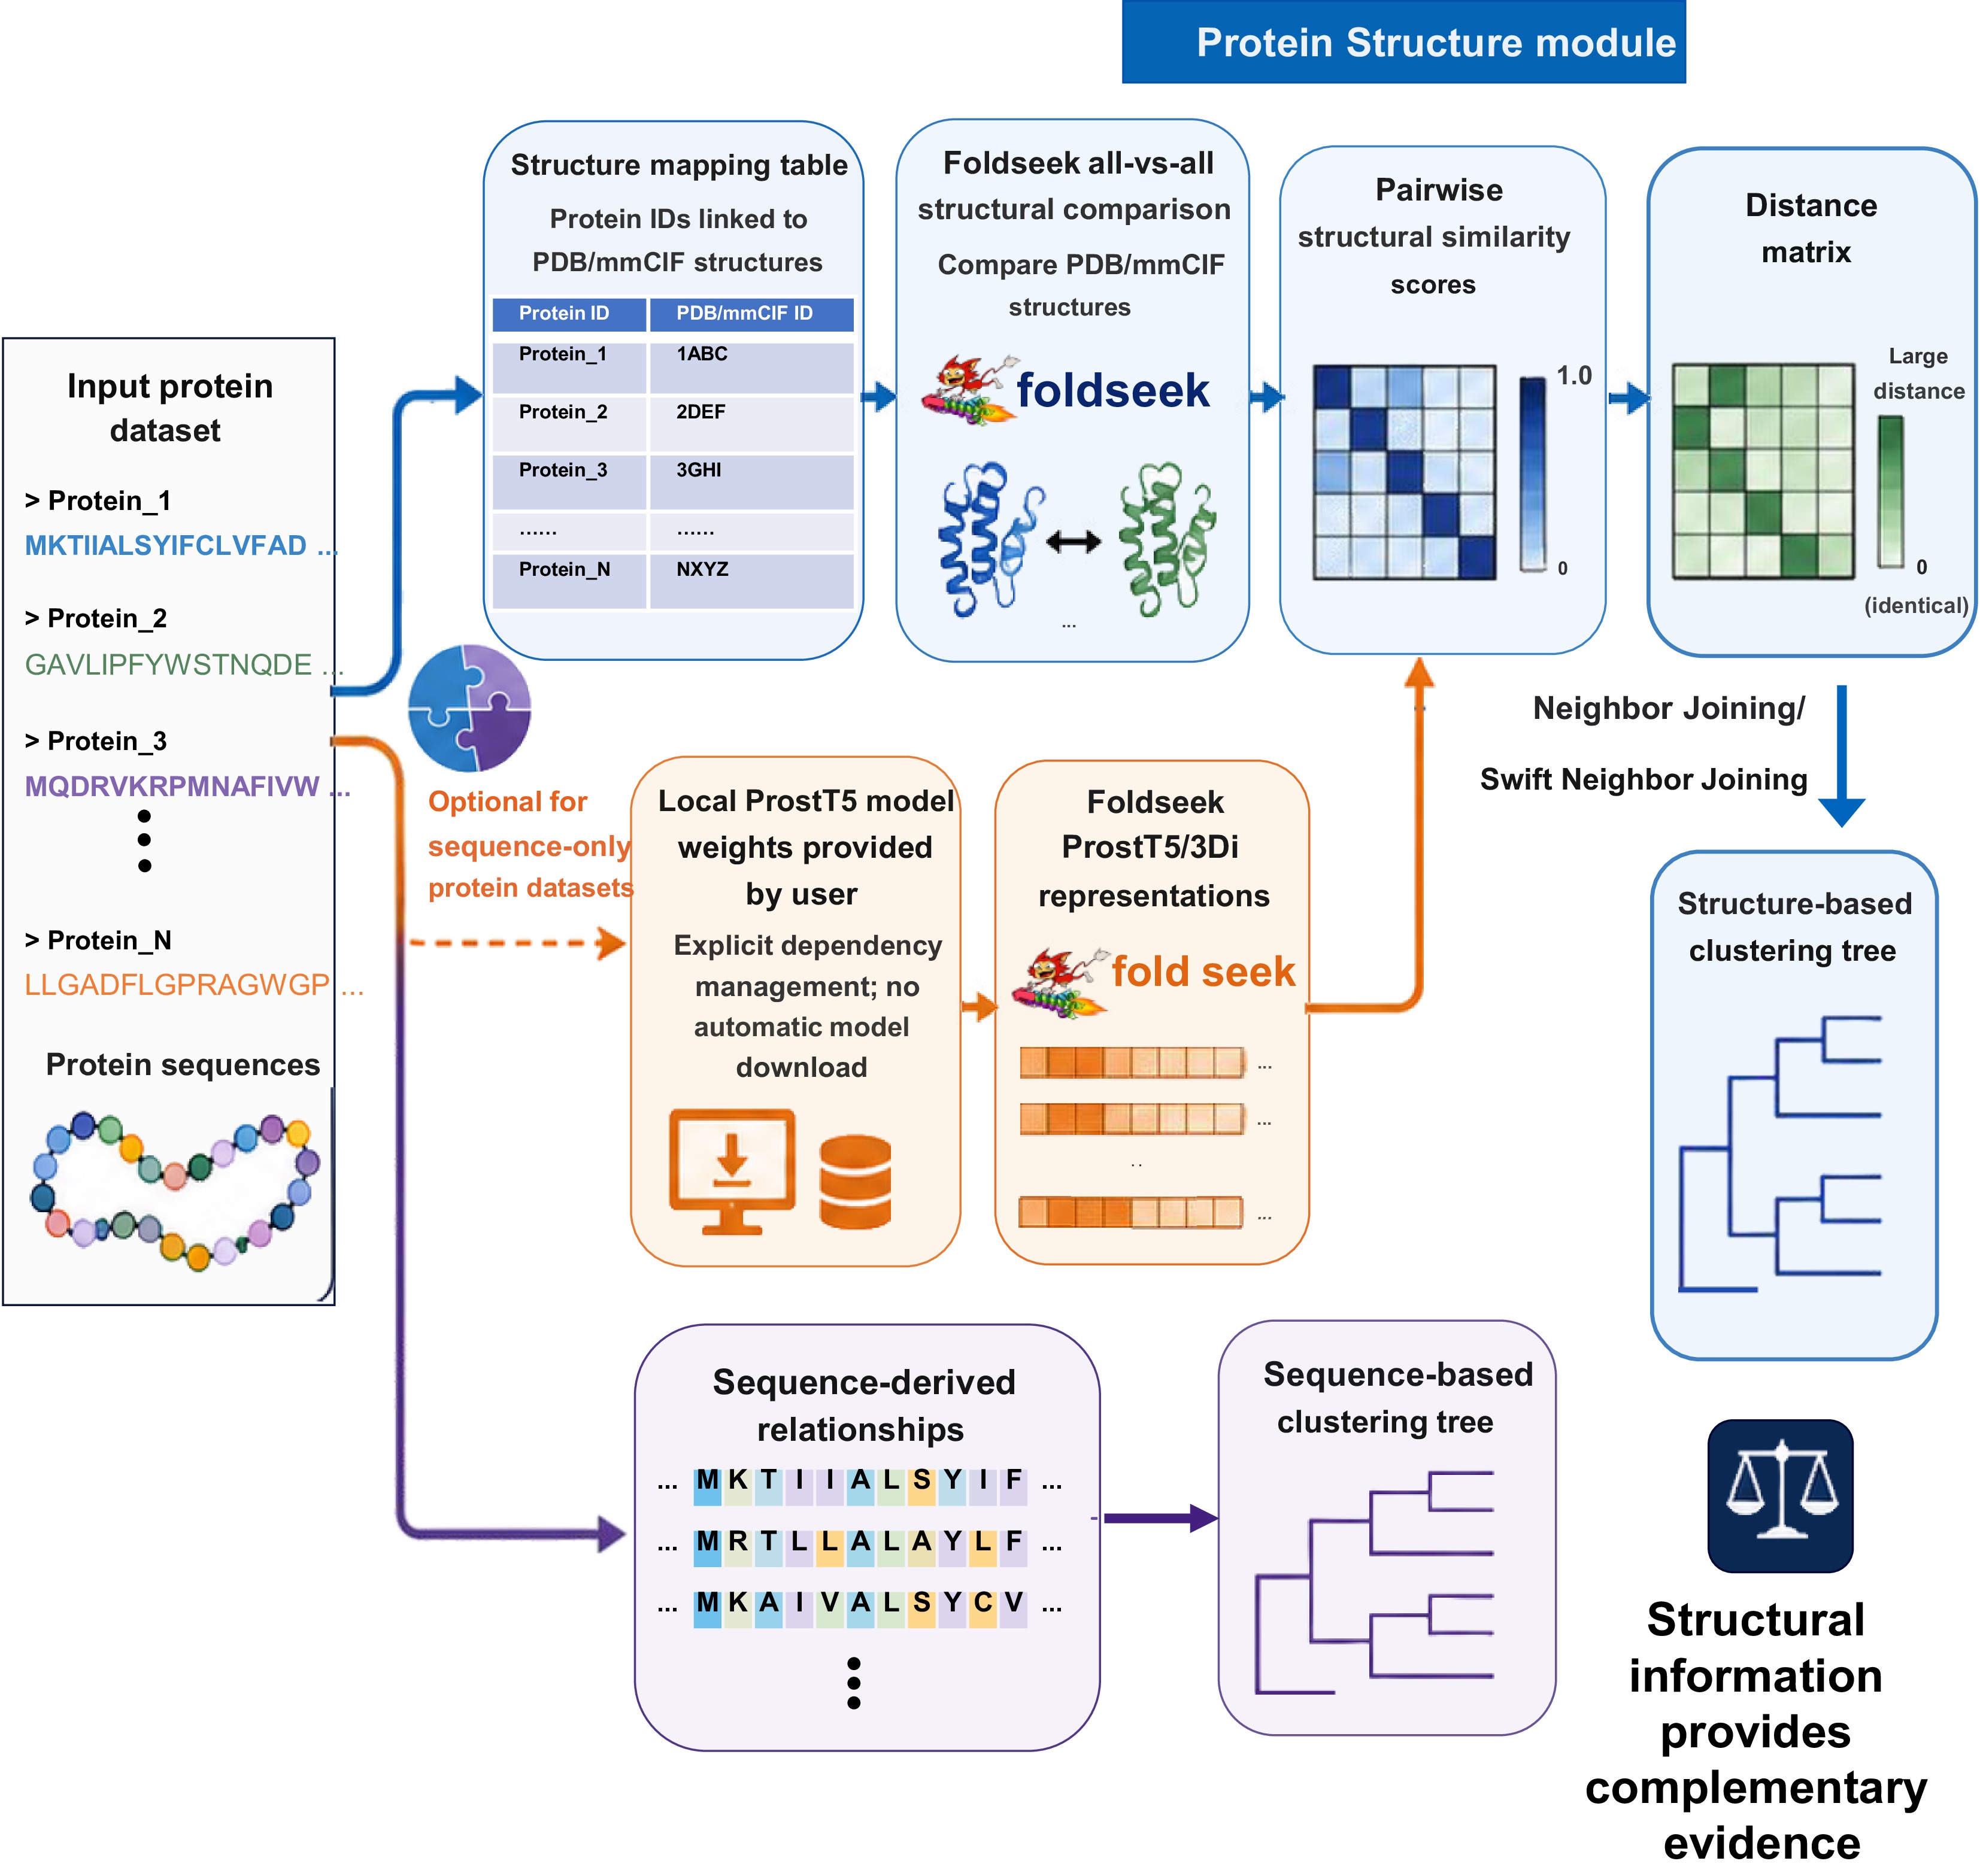
Figure 2.
Protein structure-informed hierarchical clustering analysis pipeline. Top: the Protein Structure module links protein sequences to PDB/mmCIF or AlphaFoldDB structures, performs all-vs-all structural comparison with Foldseek to produce pairwise structural similarity scores, converts structural similarity into a distance matrix, and constructs a structure-based clustering tree using NJ/SNJ algorithms. Middle: optional ProstT5/3Di representations can be used for sequence-only datasets when local model weights are supplied. Bottom: the sequence-derived relationships can be complemented by structure-informed clustering to yield biological insights.
-
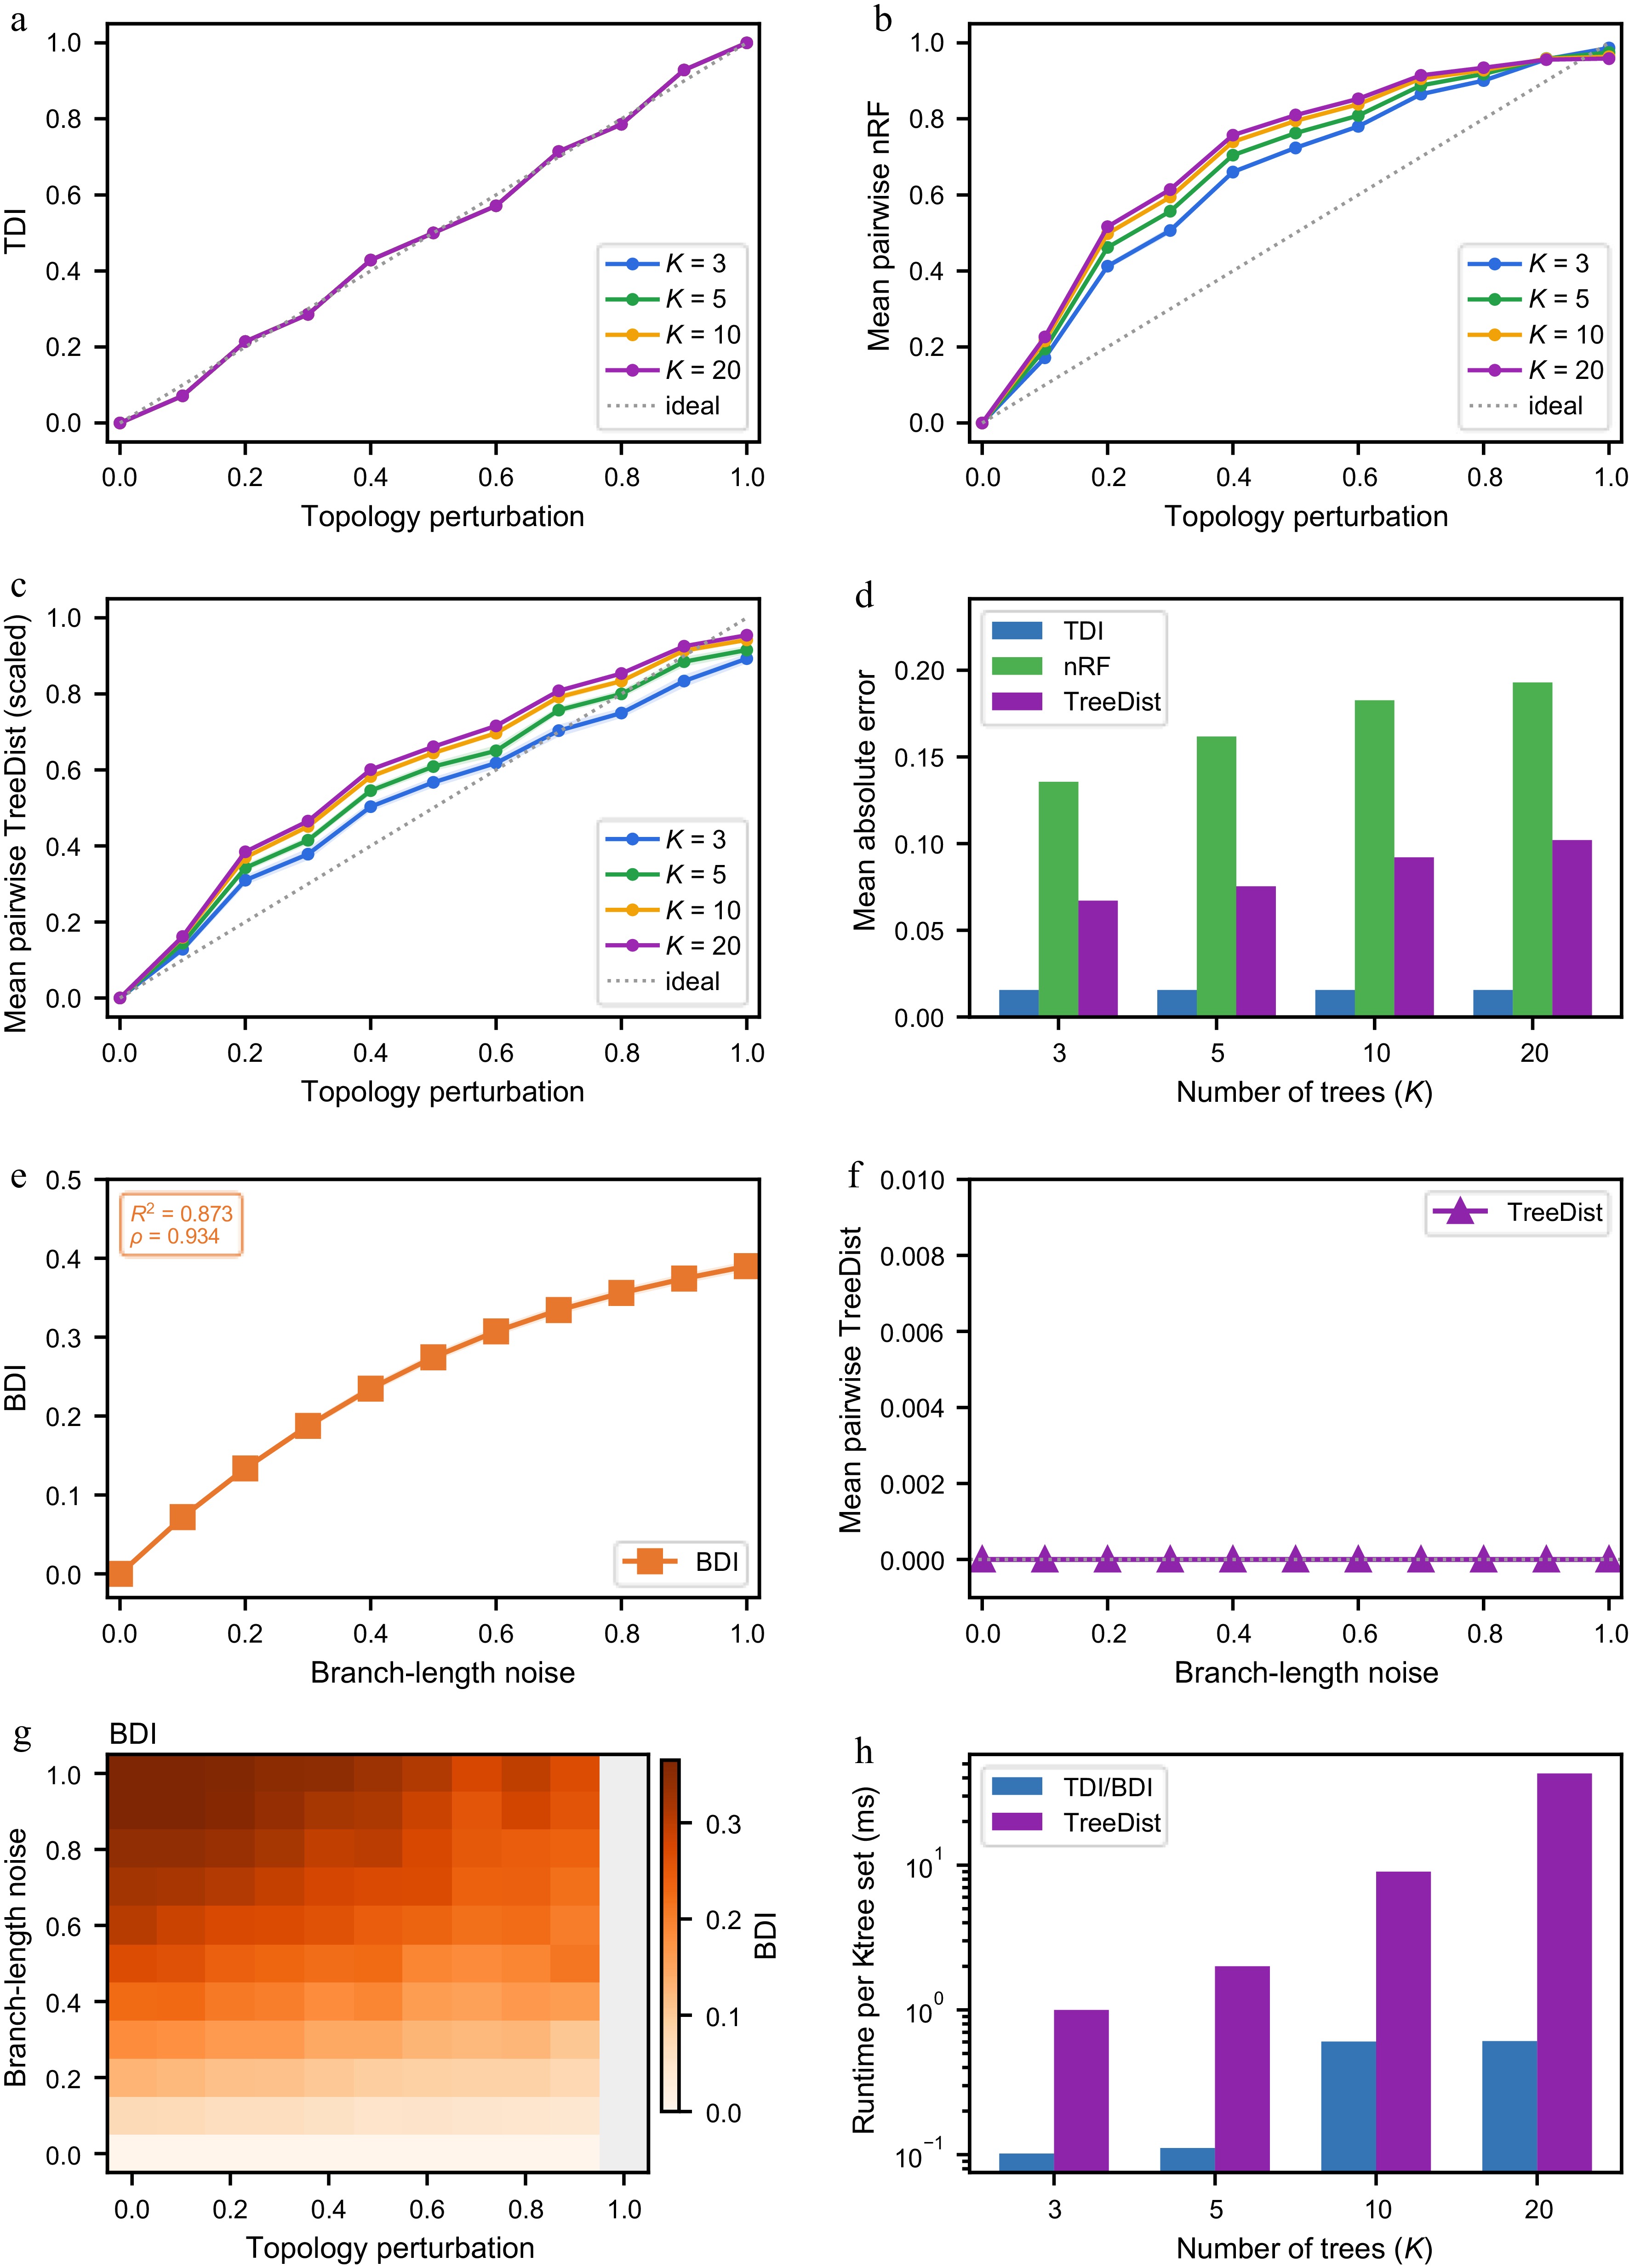
Figure 3.
Multi-tree validation of the Topology Difference Index (TDI) and Branch-Length Difference Index (BDI). (a) TDI closely recovered the known topology perturbation level across K = 3, 5, 10, and 20 aligned trees. (b) Mean pairwise normalized RF was inflated relative to the reference-to-other perturbation target because all perturbed-vs-perturbed pairs contribute to the average. (c) Mean pairwise TreeDist showed the same pairwise-summary behavior after empirical scaling to 0−1 for visual comparison. (d) Mean absolute calibration error was consistently lower for TDI than for mean pairwise normalized RF or scaled TreeDist. (e) Under branch-length-only perturbation, BDI increased with branch-length noise; R2 denotes the linear-regression fit of BDI against the simulated noise level, and rho denotes Spearman rank correlation. (f) Mean pairwise TreeDist remained zero under the same branch-length-only perturbation because topology was unchanged. (g) The BDI heatmap uses an observation-scaled color range to emphasize vertical separation along the branch-length noise axis. (h) Runtime benchmark on the same K-tree inputs shows the median per-set runtime of TDI/BDI and TreeDist. Panels (a)−(f) and (h) used 50 replicates or benchmarked subsets from those conditions; panel (g) used 20 replicates per grid cell.
-
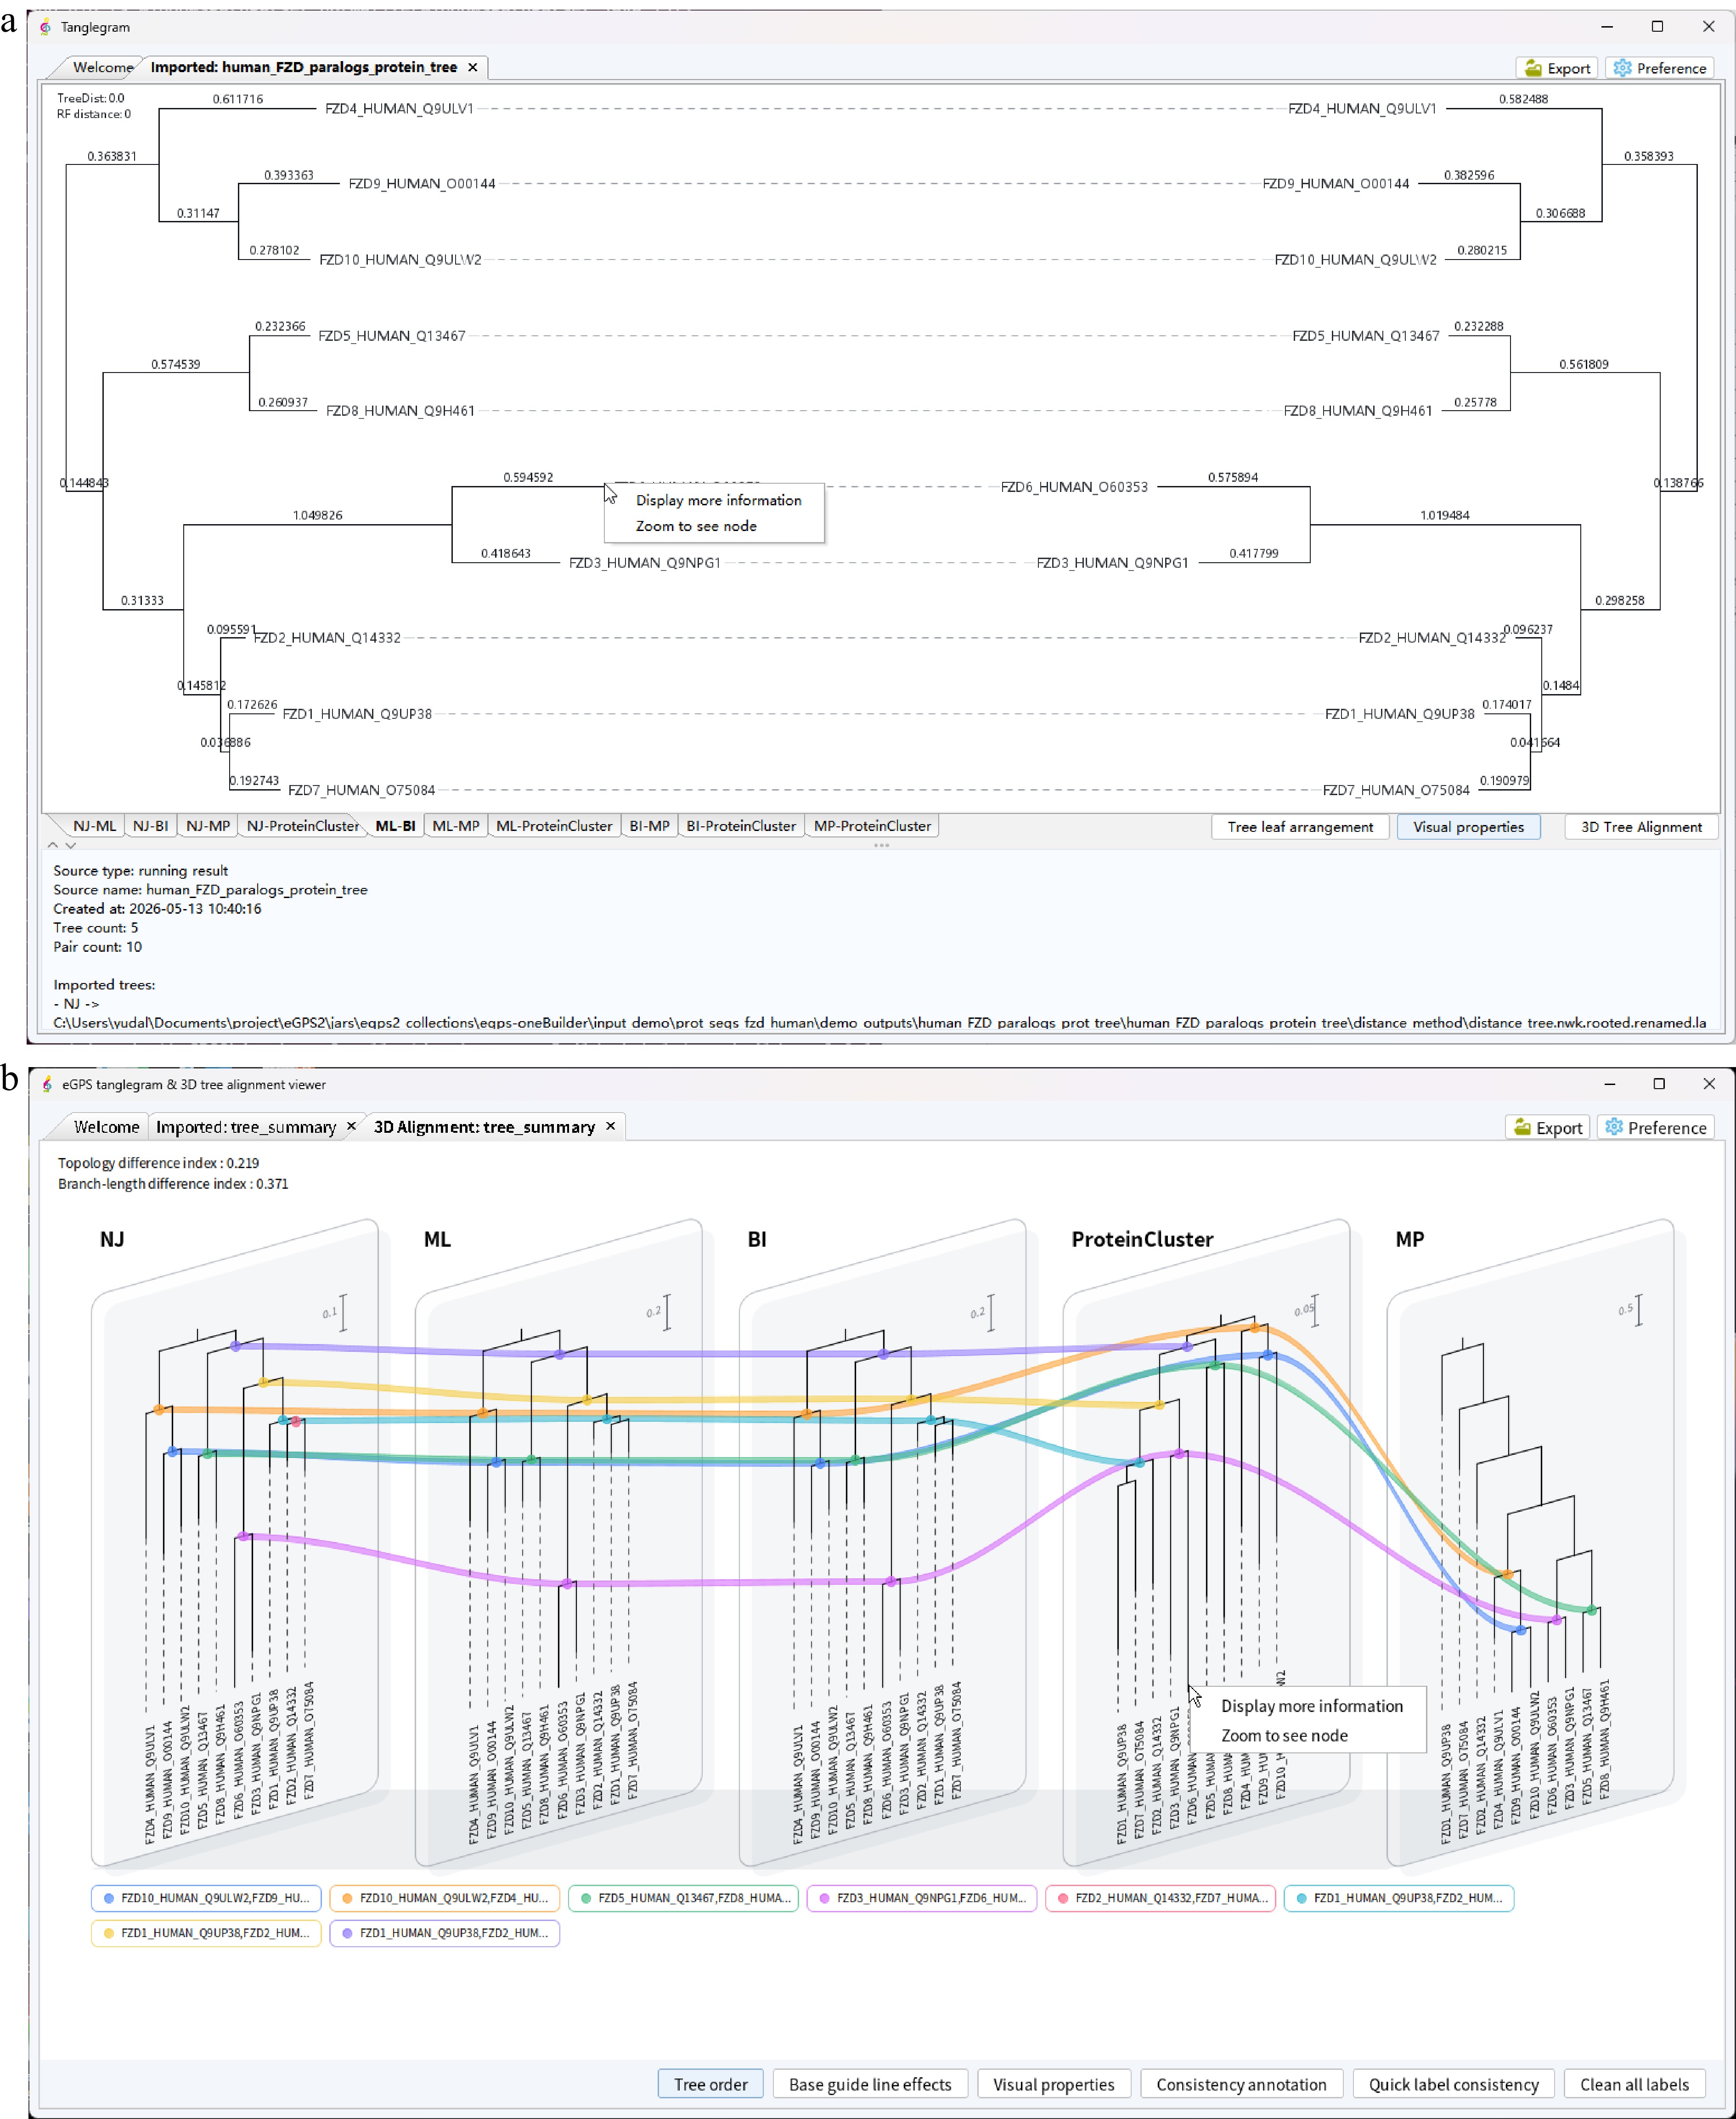
Figure 4.
A snapshot of the eGPS-viewer with a highly interactive tanglegram view and pseudo-3D Tree Alignment. (a) Standalone tanglegram viewer for pairwise tree comparison. The viewer imports eGPS-oneBuilder results or independent Newick format trees with matched leaf labels, displays selected tree pairs side by side, reports tree-distance metrics, and supports pair tabs, zooming, panning, node inspection, visual-parameter adjustment, topology-preserving leaf arrangement, and figure export. For the demonstrated six trees, a combined 10 comparison panels are displayed as tabs at the bottom. The detailed tree information is shown on the bottom console; thus, obtaining an interactive pairwise phylogenetic tree interpretation environment. (b) Pseudo-3D Tree Alignment View for multiple-tree comparison. Trees inferred by NJ, ML, BI, MP, and optional ProteinCluster methods are displayed as parallel layers. Colored consistency ribbons connect matched clades across trees, while TDI and BDI (top left) summarize topological and branch-length disagreement. The interpretation environment is organized by the Tabs on the desktop. After loading data from the Welcome page, the first visualization tab is a snapshot of the tree in a tanglegram. After clicking the '3D Tree Alignment' button, the visual demonstration appears right on the figure.
-
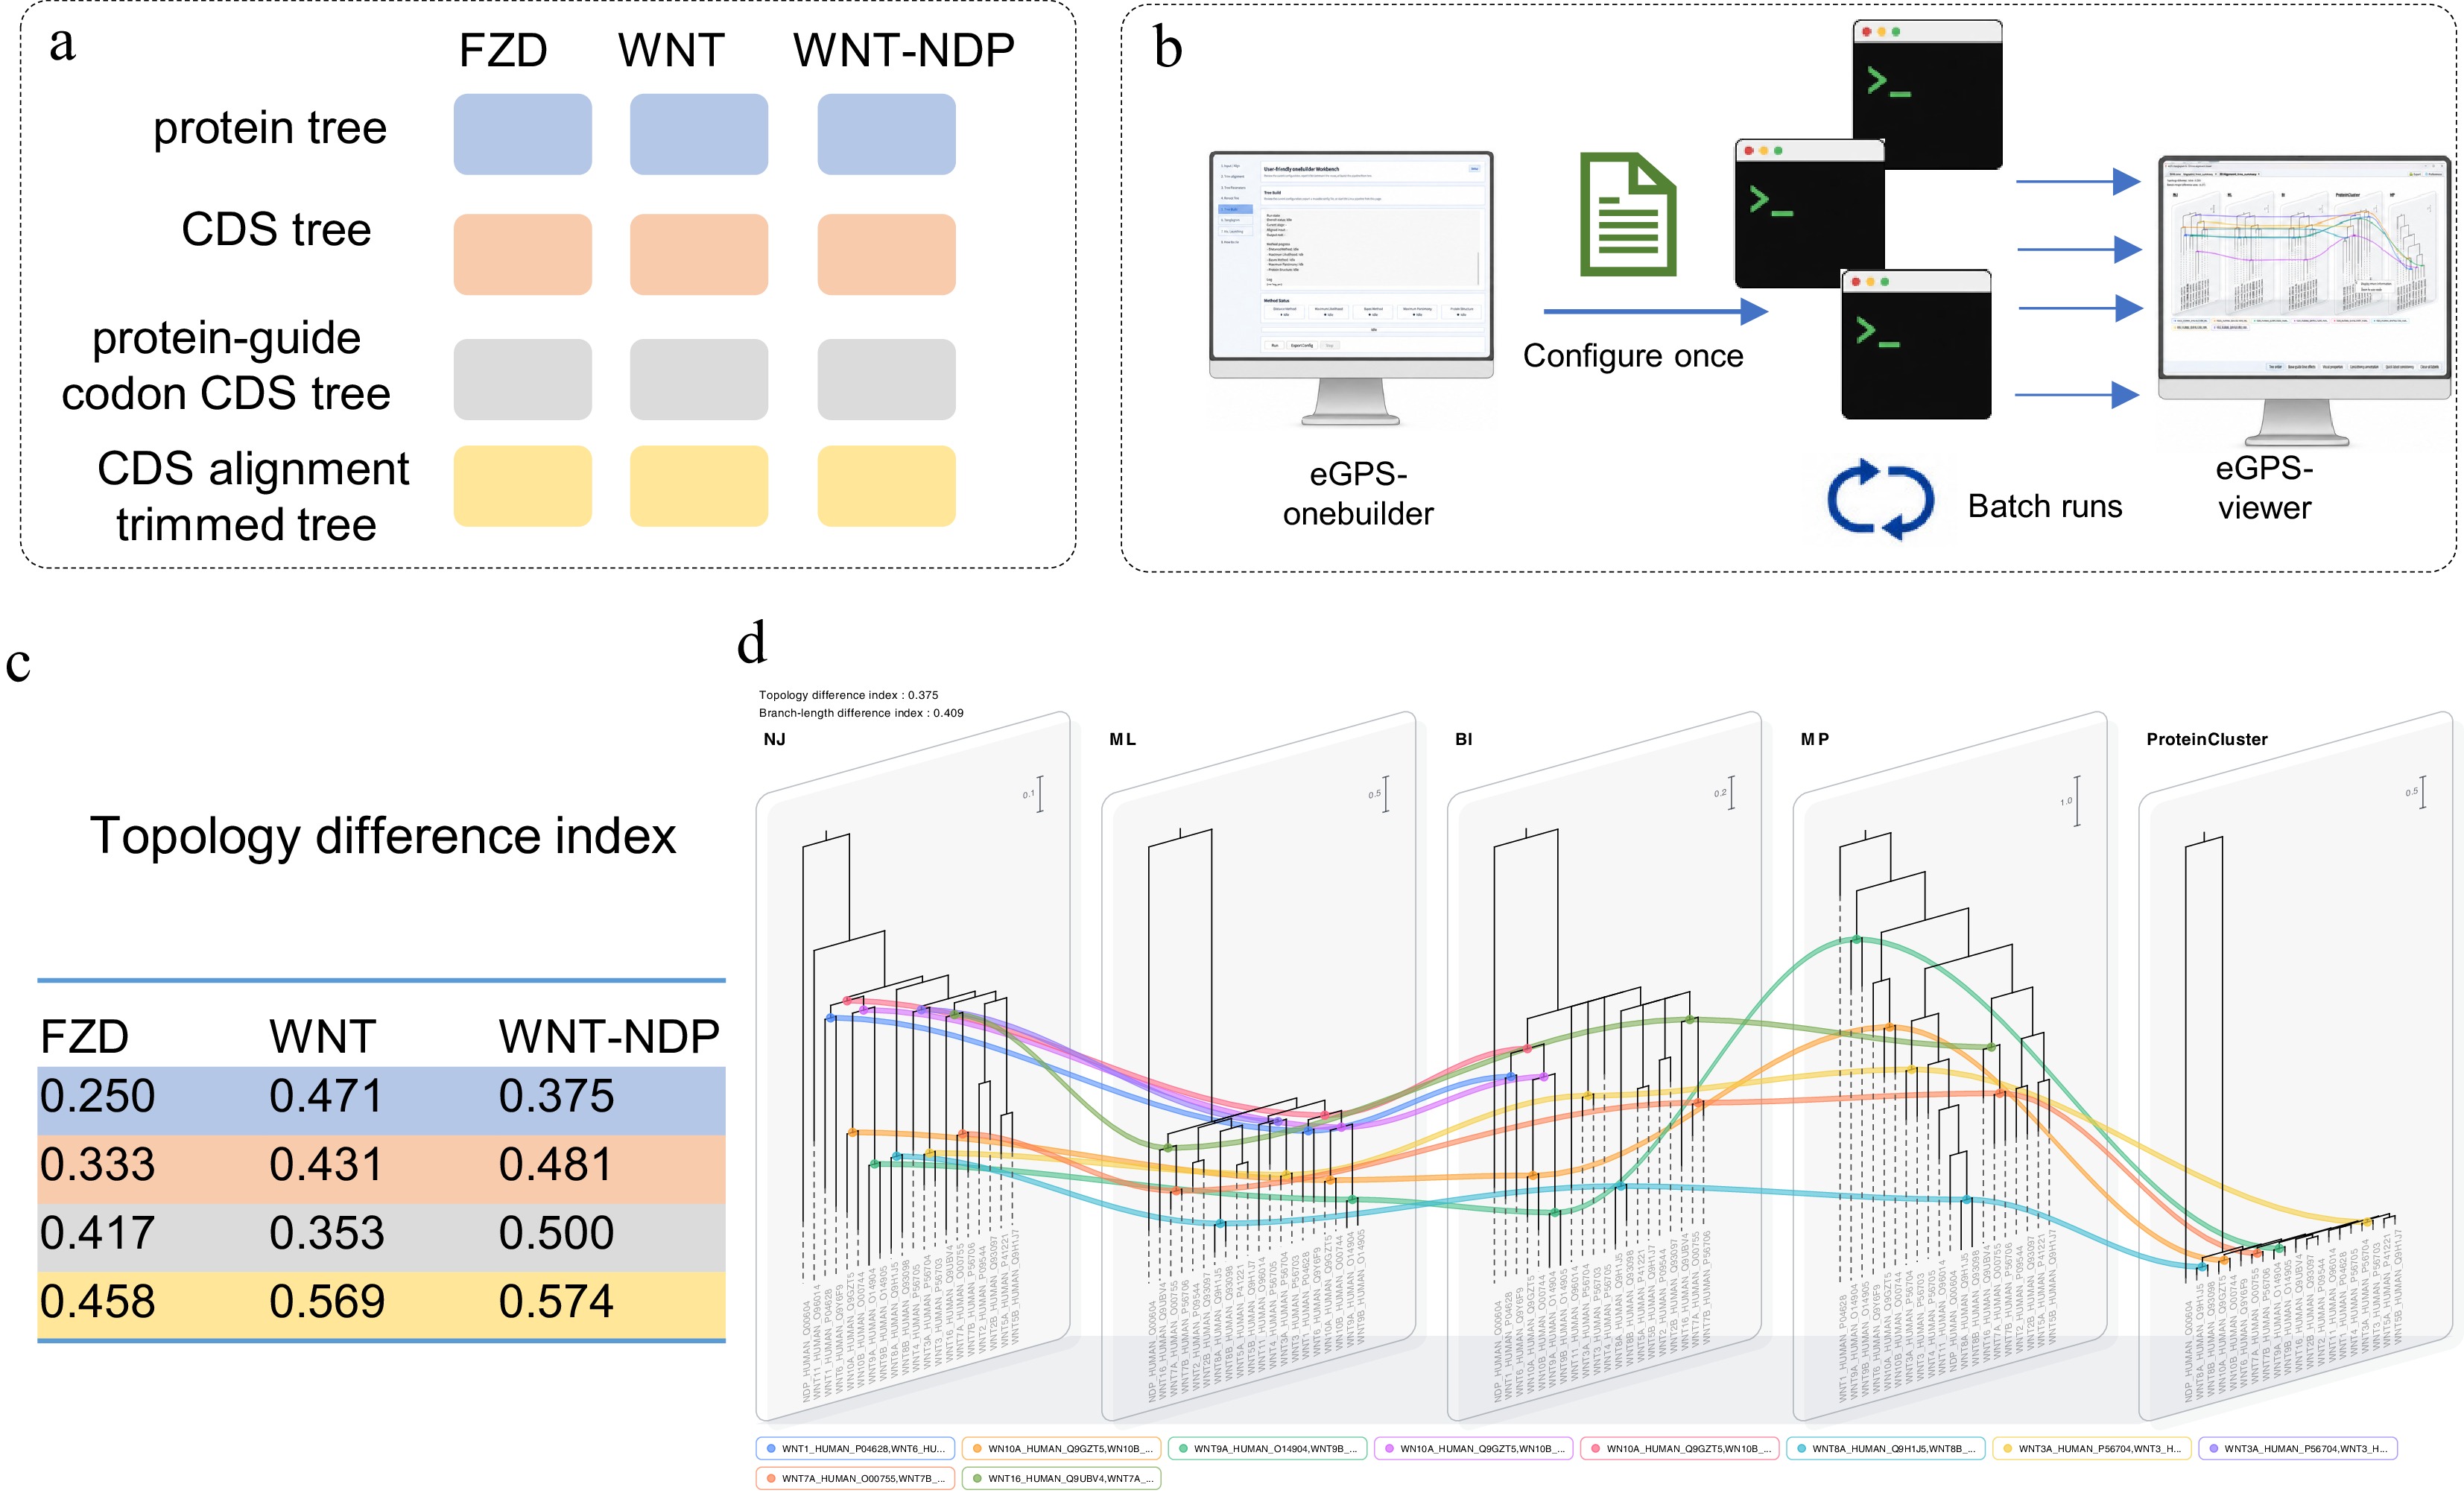
Figure 5.
Multi-method phylogenetic analysis of human WNT, FZD, and WNT-NDP paralogs. (a) Input organization and analysis design for the human FZD, WNT, and WNT-NDP datasets, each including CDS sequences, protein sequences, and corresponding predicted protein structures. Four parallel workflows were prepared for each dataset: protein-sequence tree inference with optional Foldseek-based structure clustering, untrimmed CDS tree inference after MAFFT alignment, CDS tree inference after MAFFT alignment followed by default trimming, and protein-guided CDS alignment converted from the aligned protein sequences (codon alignment). (b) eGPS-oneBuilder workflow for executing batch analyses via the GUI-CLI bridge. The workflow connects sequence alignment, optional trimming or CDS–protein alignment conversion, multi-method tree inference, quantitative topology comparison, and interactive tree visualization. Users first generate configuration files through the GUI; once generated, these configurations can be executed in batch mode, and the resulting trees can be readily inspected in the interactive visualization environment. All analyses can be performed on a standard personal computer without requiring dedicated servers, workstations, or other high-performance computing resources. (c) TDI values summarize topological disagreement across the 12 analyses. (d) 3D alignment of the WNT-NDP protein analysis shows that NDP is placed basal to WNT paralogs by NJ, ML, BI, and structure-derived similarity trees, but not by MP. See Supplementary Material 3 for details and reproducible analysis, and Supplementary Material 4 for bootstrap values and posterior probabilities.
-
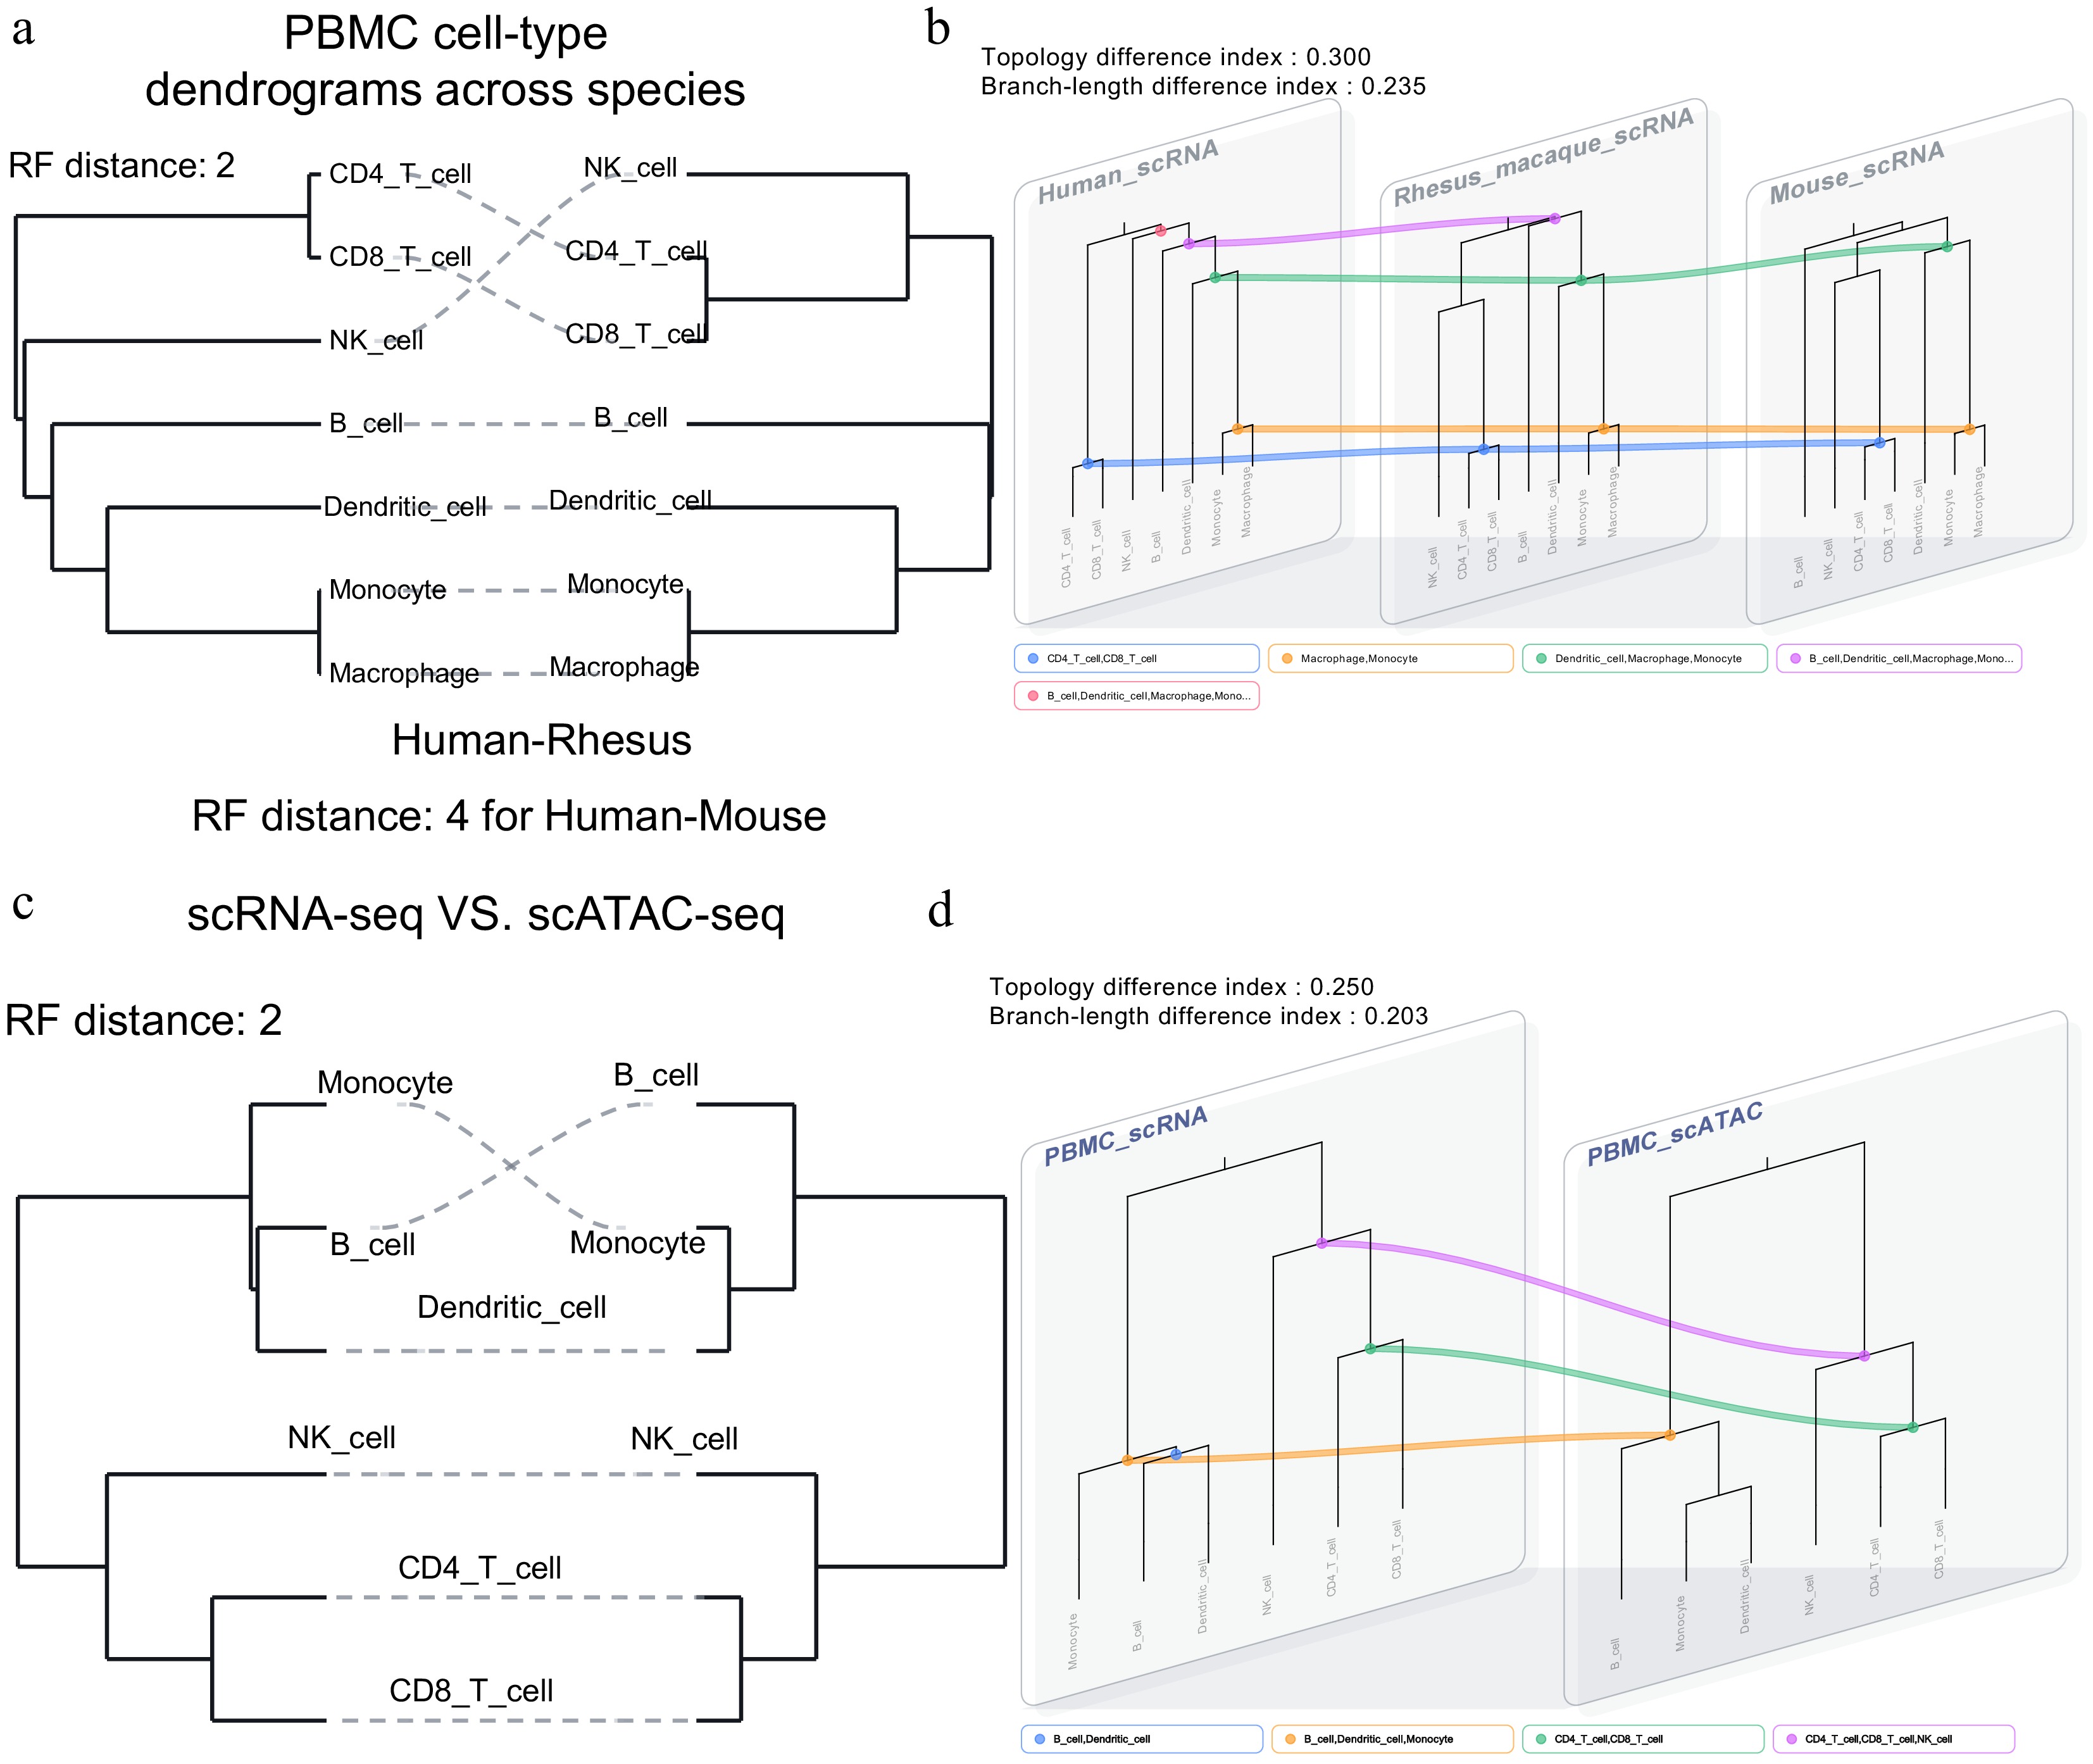
Figure 6.
Proof-of-concept extension of tree alignment to single-cell cell-type similarity dendrograms. (a) Pairwise tanglegram with Robinson–Foulds (RF) distance comparison of PBMC cell-type dendrograms among human, rhesus macaque, and mouse. The RF distance between human-rhesus is smaller than human-mouse, which is consistent with the species' evolutionary relationship. (b) 3D alignment of cross-species PBMC dendrograms highlights conserved T-cell and myeloid groupings and divergent NK/B-cell organization. (c) Pairwise tanglegram comparison of RNA- and ATAC-derived PBMC dendrograms from paired 10x multiome data. (d) Two-layer alignment of RNA and ATAC cell-type trees shows concordant CD4+/CD8+ T-cell and NK-cell relationships, with weaker agreement among other immune-cell groups.
-
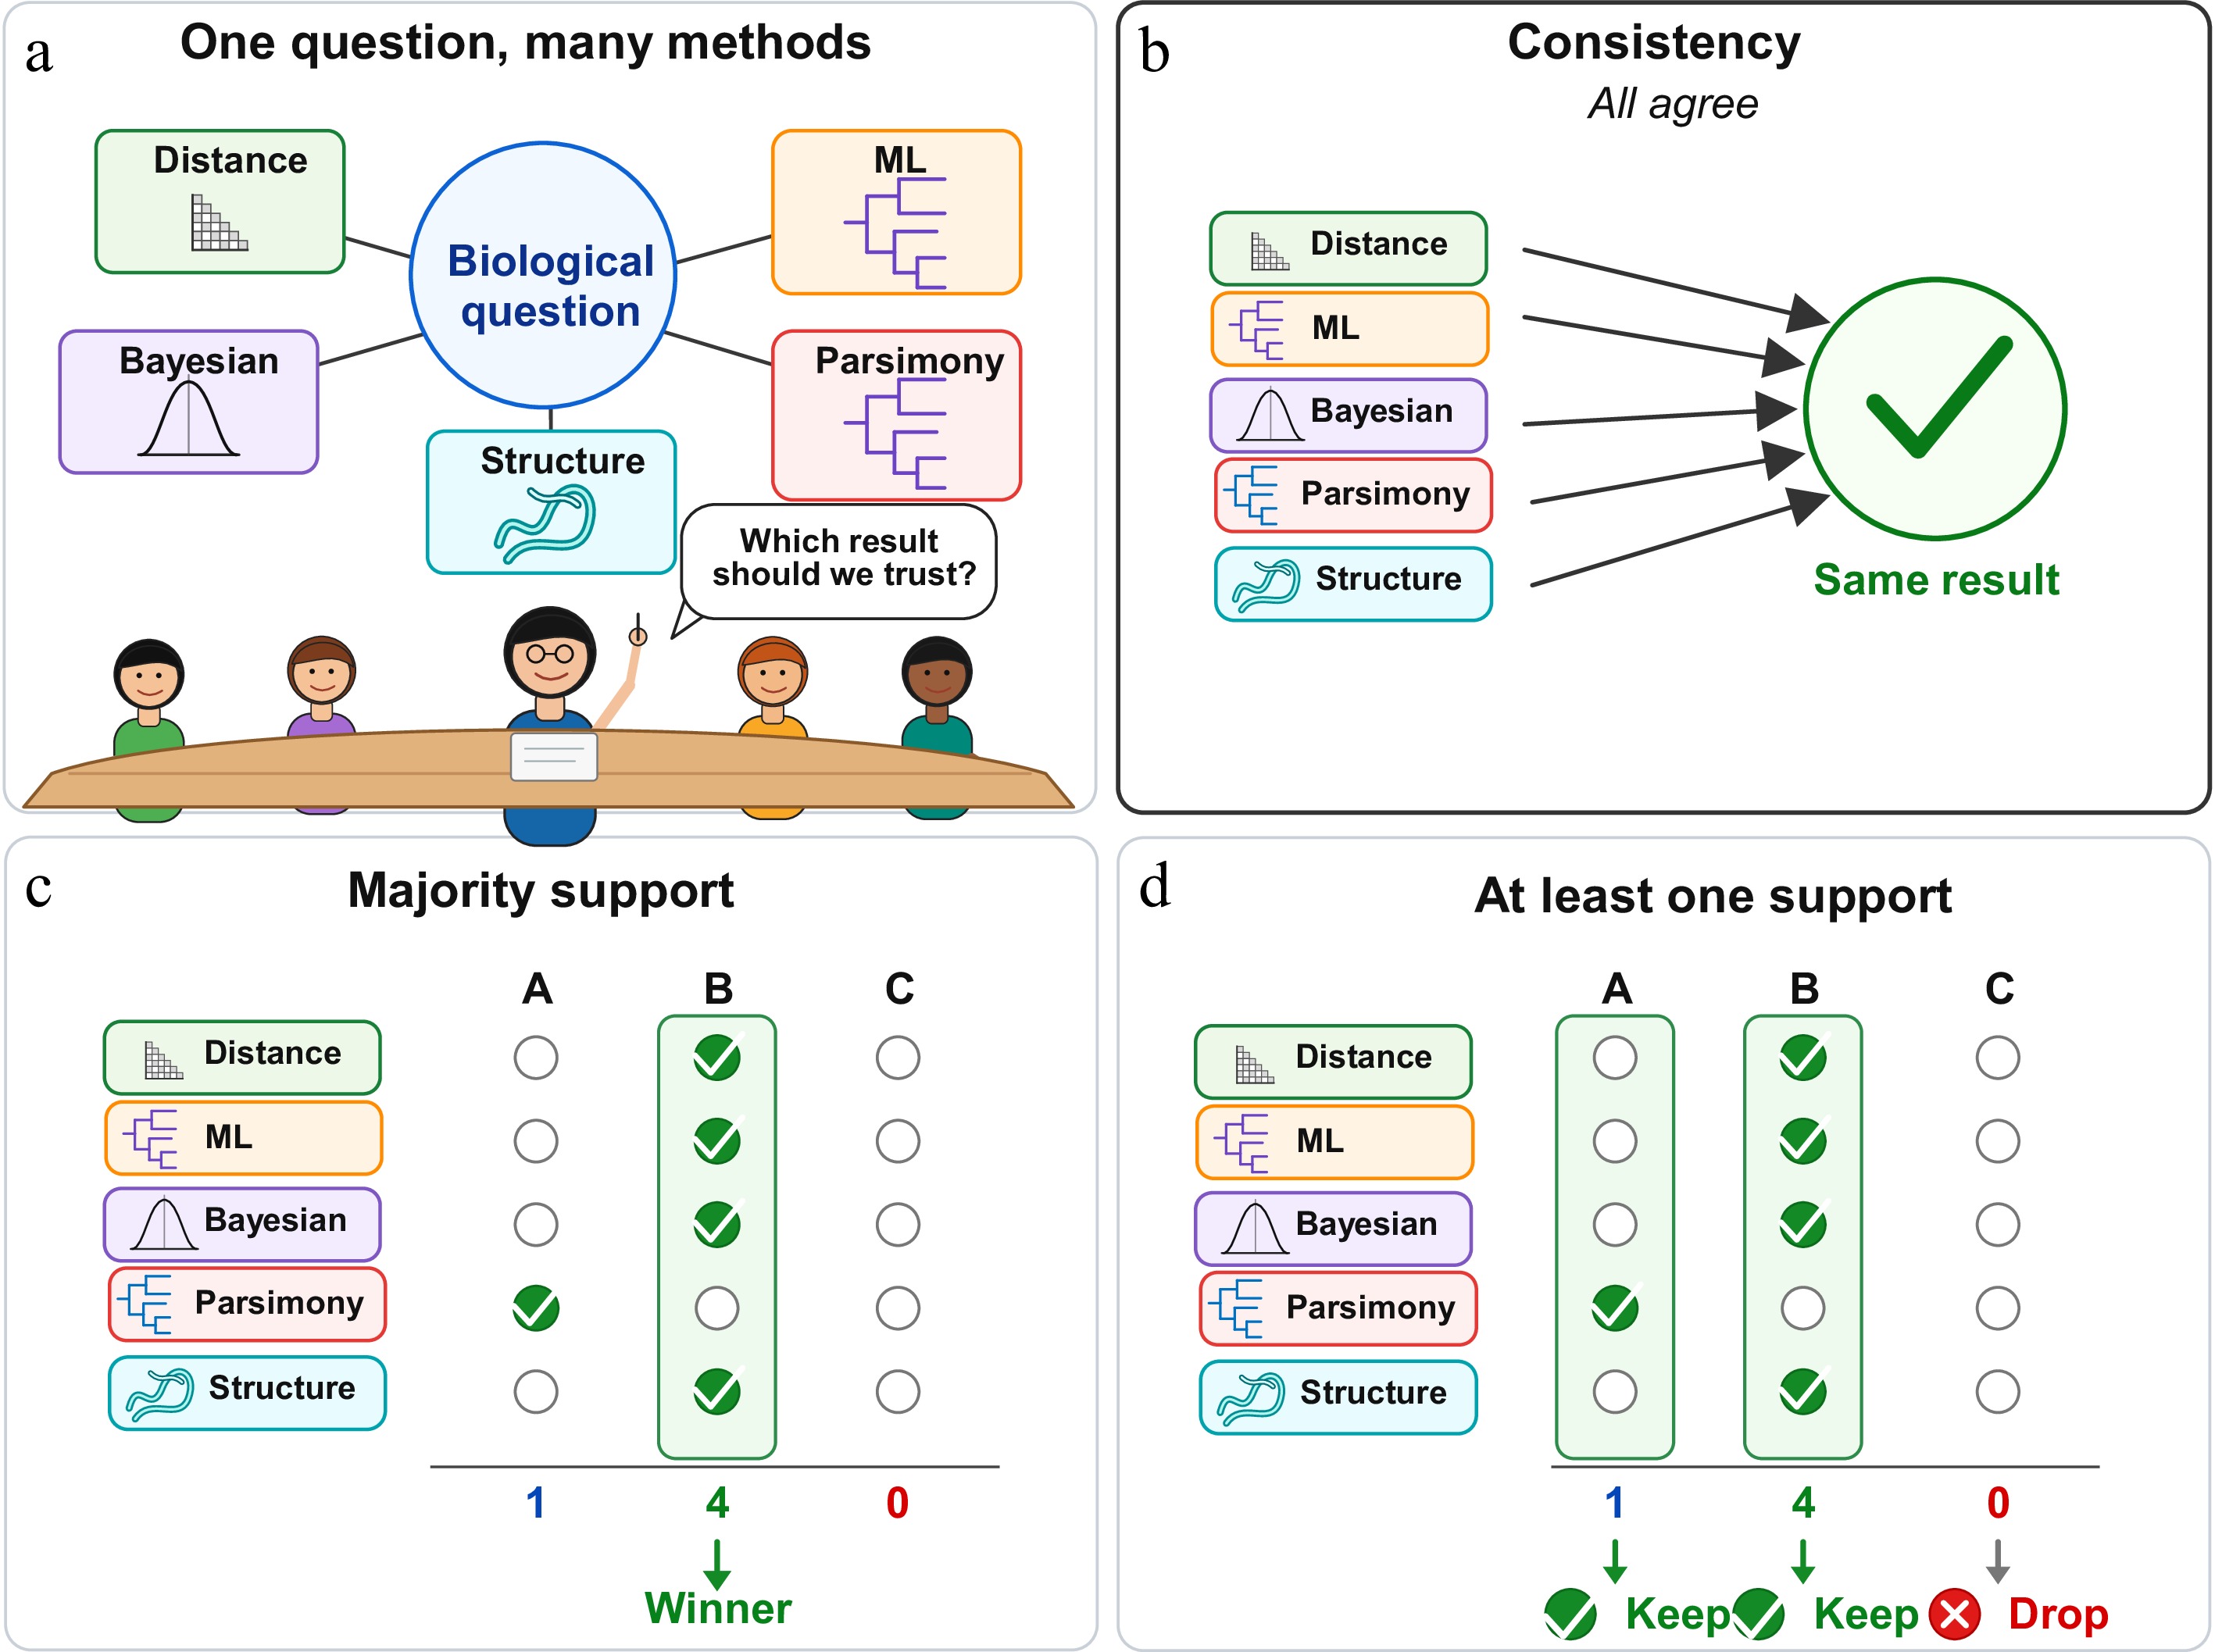
Figure 7.
Conceptual decision rules for interpreting multi-method phylogenetic results in eGPS-oneBuilder. (a) A single biological question can be evaluated by multiple complementary approaches, including distance-based inference, maximum likelihood (ML), Bayesian inference, parsimony, and protein structure-informed clustering. The central challenge is deciding which inferred relationship should be trusted or retained. (b) Under a strict consistency rule, a result is accepted only when all methods support the same conclusion. (c) Under majority support, the candidate supported by most methods is selected as the primary result. (d) Under an at-least-one-support rule, any candidate supported by one or more methods is retained for further interpretation, whereas unsupported candidates are discarded. This framework emphasizes that multi-method phylogenetic analysis should not force premature selection of a single topology, but should make agreement, disagreement, and alternative biologically plausible hypotheses explicit.
-
Difficulty eGPS-oneBuilder No gold-standard tree for most real datasets Generate and compare multiple plausible trees instead of reporting only one topology. Fragmented command-line workflow Integrate alignment, tree inference, rerooting, visualization, and comparison in one workflow, with packaged runtime support for out-of-the-box use. Hard-to-track parameter choices Store GUI-selected settings in a reusable runtime JSON configuration. Limited result interpretation Provide TreeDist/RF matrices, heatmaps, and interactive tanglegram views. GUI and CLI are often separated Use the GUI for setup and inspection, and the CLI for reproducible Linux execution. Lacks intuitive graph for multiple tree alignment and quantitative metrics Implemented an intuitive tree alignment layout engine and created the Topology Difference Index and Branch-Length Difference Index. Table 1.
The difficulties in the current phylogenetic tree analysis pipeline and the solution of eGPS-oneBuilder.
Figures
(7)
Tables
(1)