-
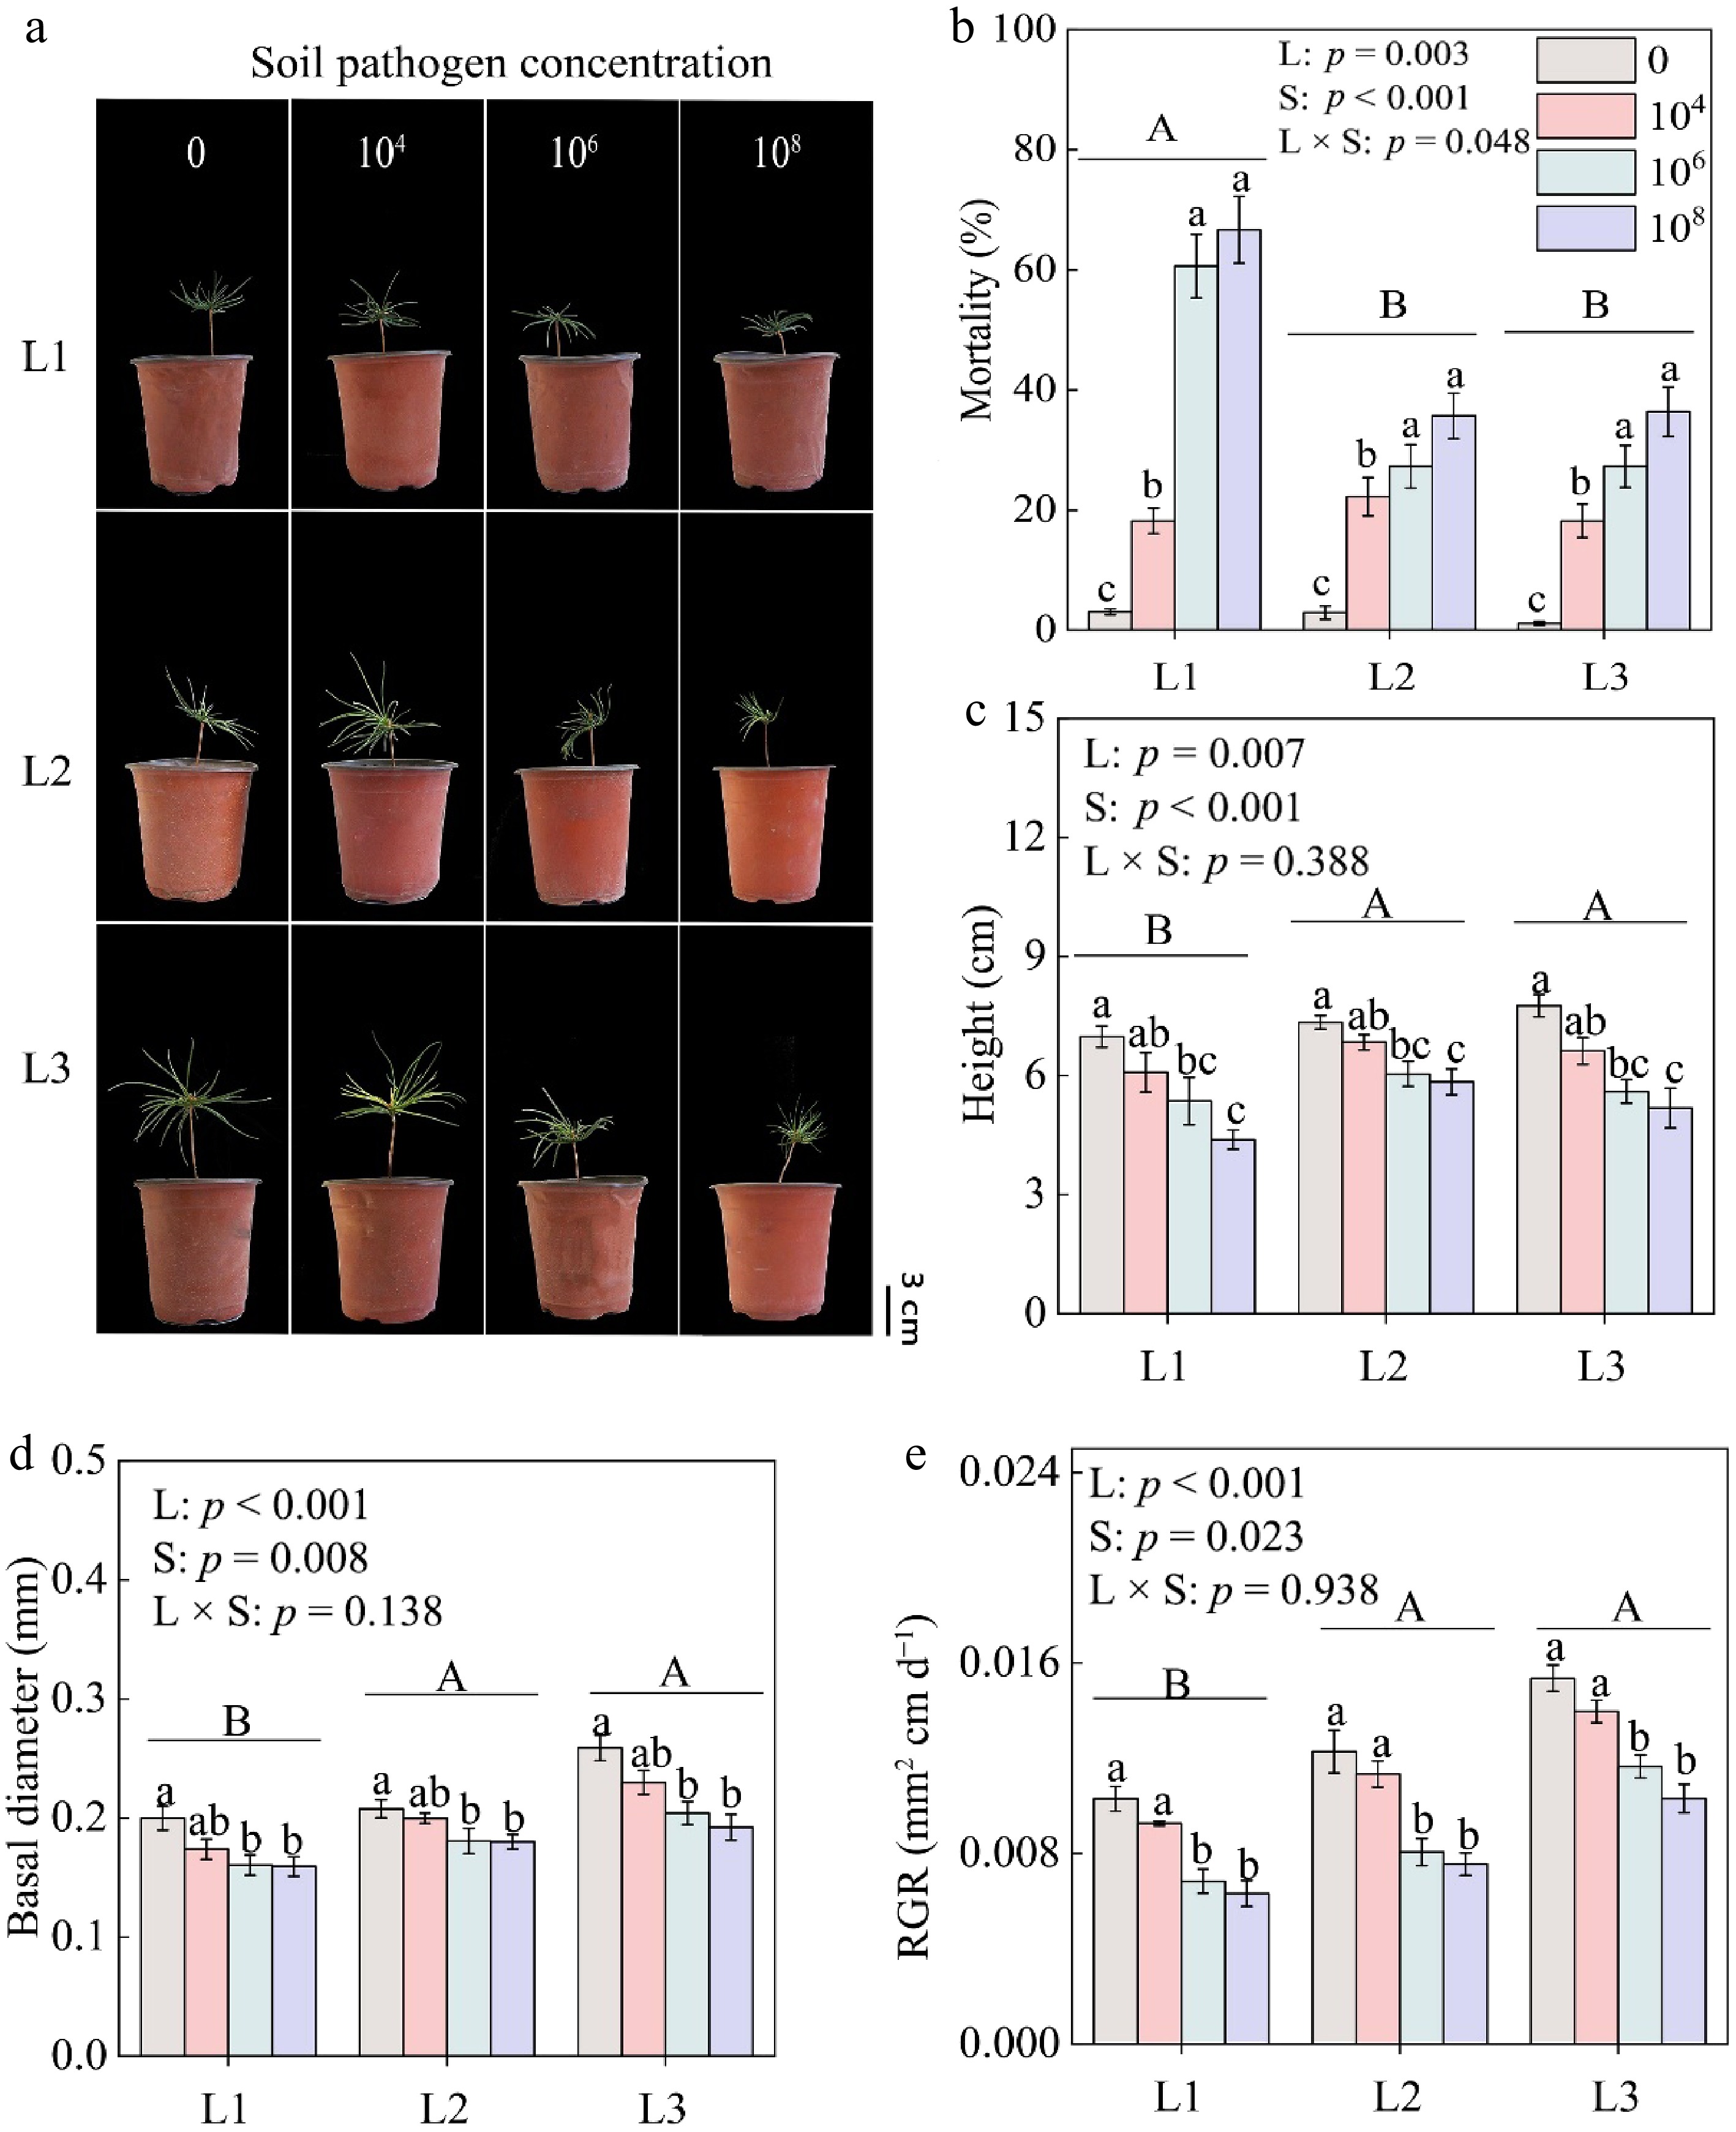
Figure 1.
Growth response of P. koraiensis seedlings to different light and soil pathogen treatments: (a) phenotype, (b) mortality, (c) height, (d) basal diameter, and (e) relative growth rate (RGR). Error bars show the mean values and SE (n = 5). L: light intensity; S: soil pathogen; L × S: the interaction of light intensity and soil pathogen; L1, L2, L3: low, medium, and high light at 200, 400, and 600 μmol·m−2·s−1, respectively; 0, 1 × 10⁴, 1 × 10⁶, 1 × 10⁸: the concentration of Fusarium oxysporum at 0, 1 × 10⁴, 1 × 10⁶, 1 × 10⁸ CFU/mL, respectively. Different uppercase letters indicate significant differences among light treatments; lowercase letters indicate significant differences among pathogen concentrations under the same light level (p < 0.05).
-
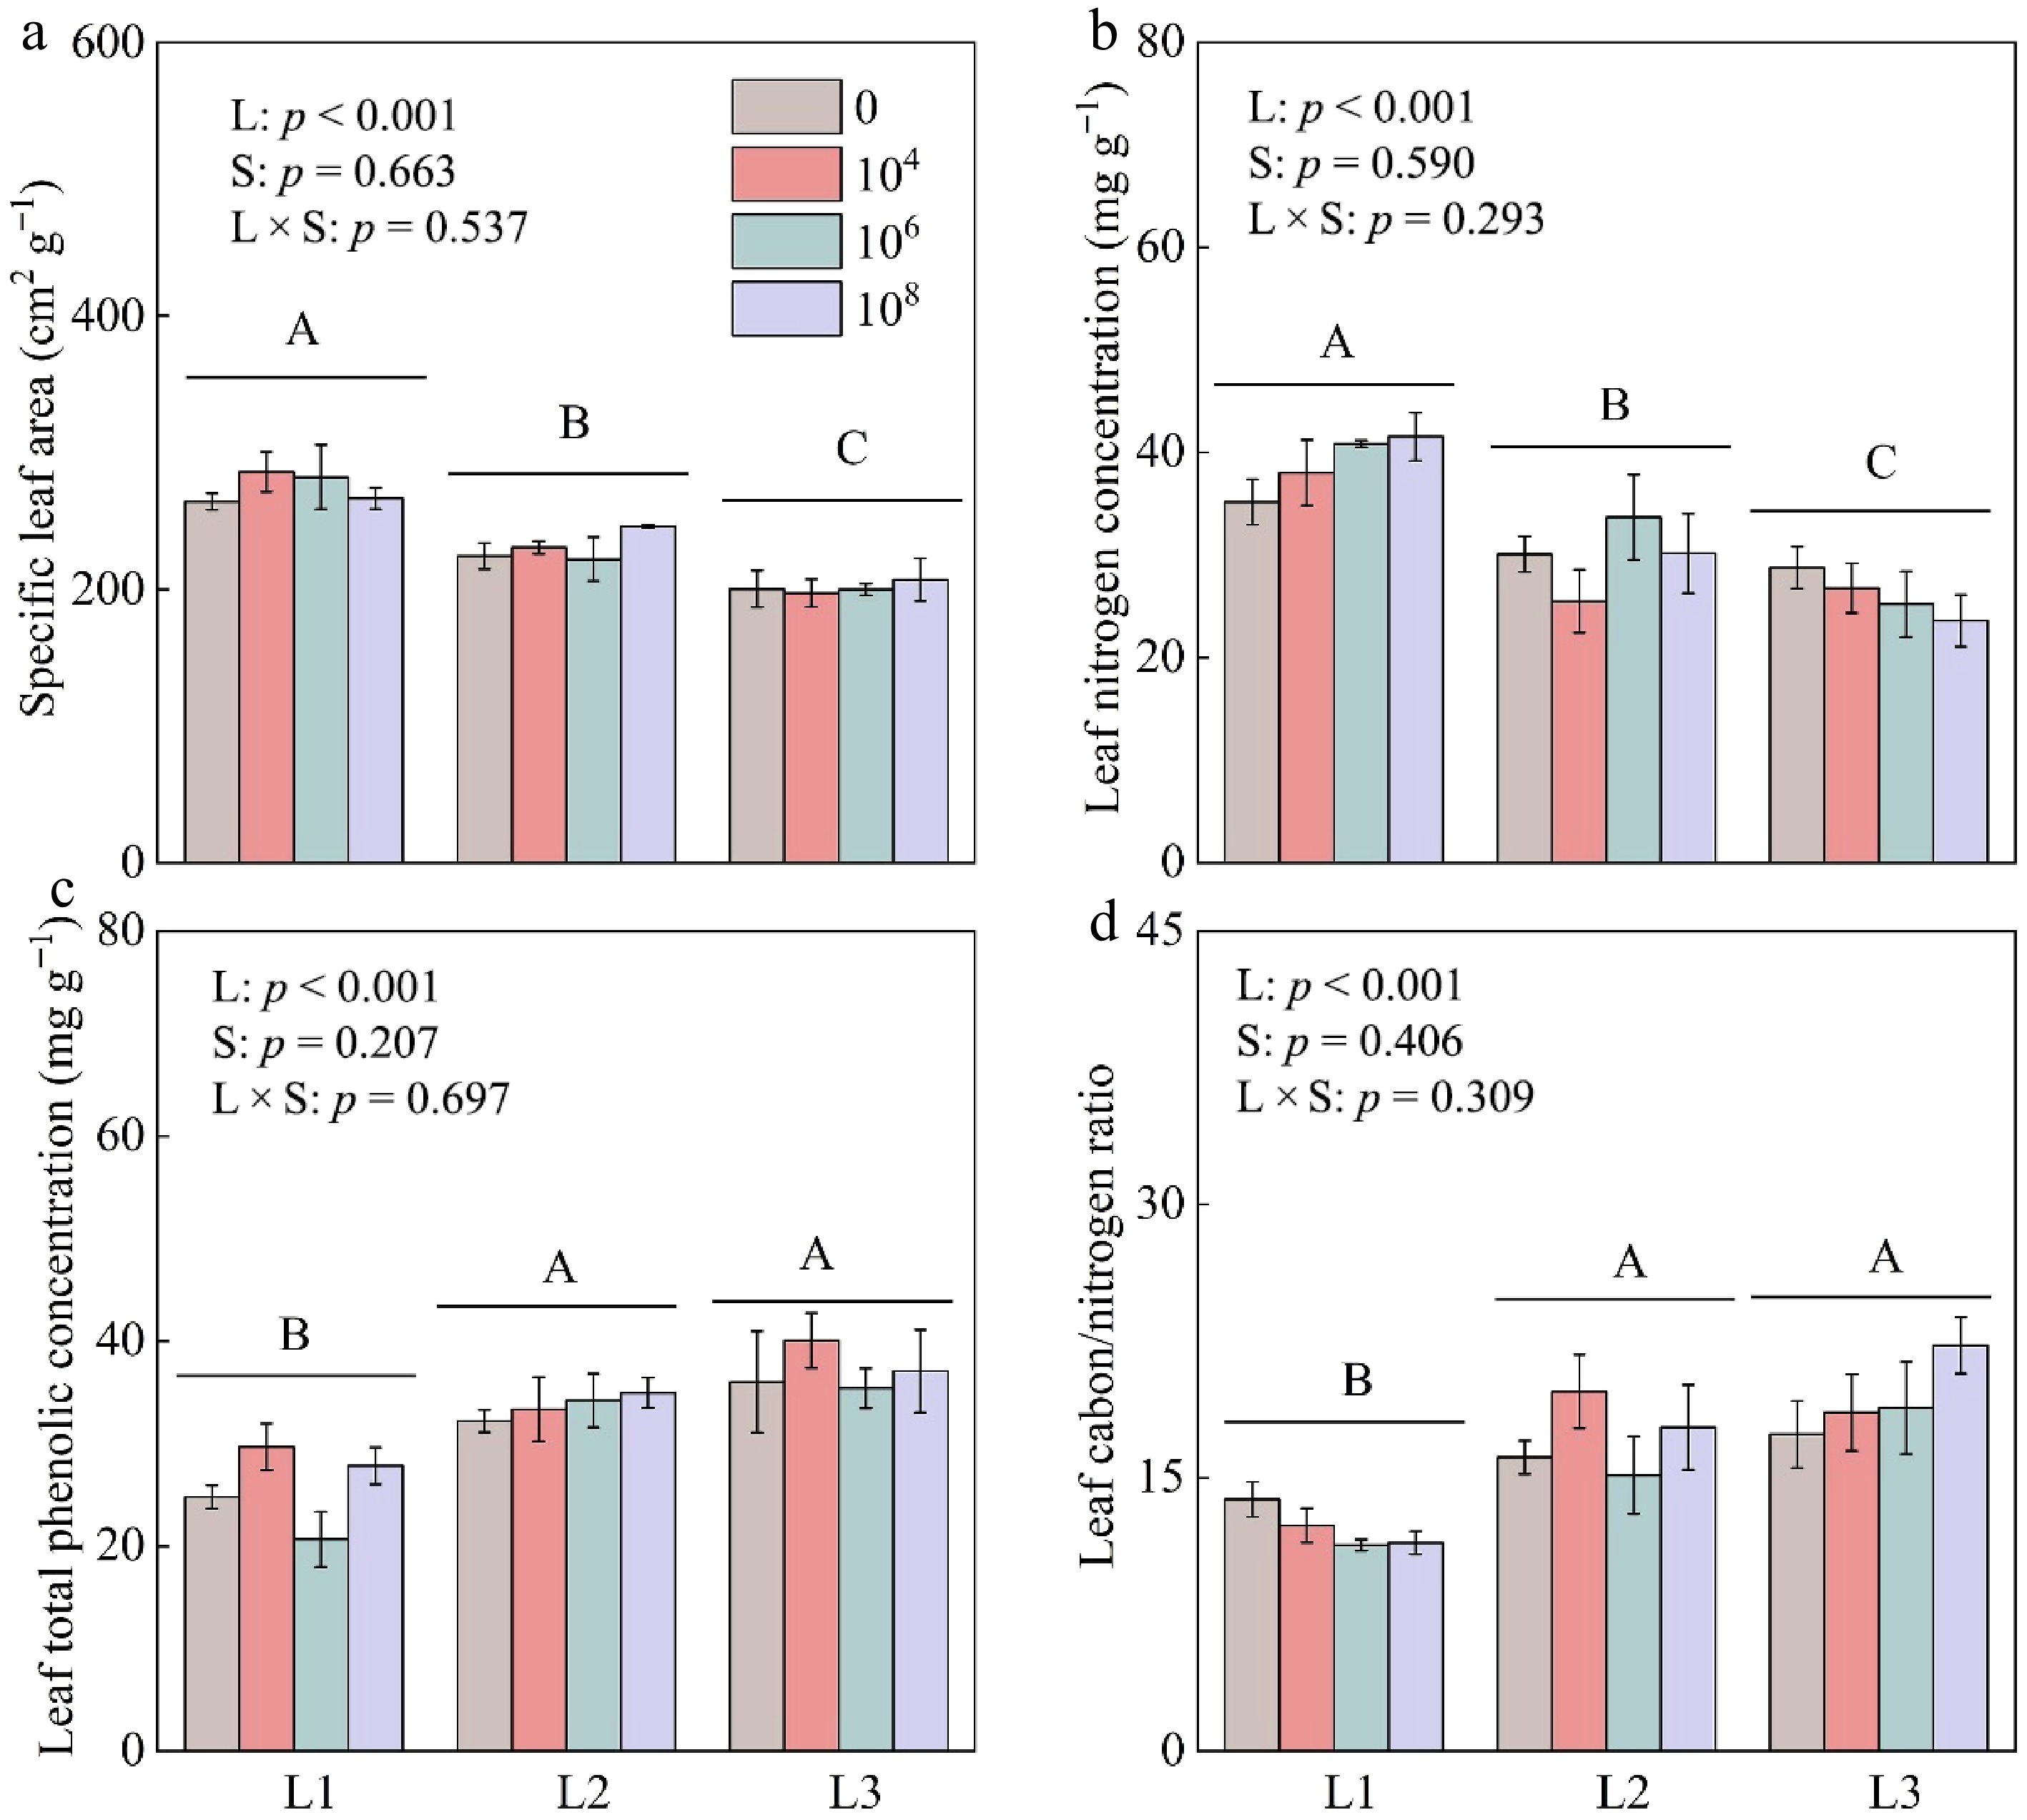
Figure 2.
Variation in leaf traits of P. koraiensis seedlings across light and soil pathogen treatments: (a) specific leaf area; (b) N concentration; (c) total phenolic concentration; and (d) leaf carbon-to-nitrogen ratio. Error bars show the mean values and SE (n = 5). L: light intensity; S: soil pathogen; L × S: the interaction of light intensity and soil pathogen. L1, L2, L3: low, medium, and high light at 200, 400, and 600 μmol·m−2·s−1, respectively; 0, 1 × 10⁴, 1 × 10⁶, 1 × 10⁸: the concentration of Fusarium oxysporum at 0, 1 × 10⁴, 1 × 10⁶, and 1 × 10⁸ CFU/mL, respectively. Different uppercase letters indicate significant differences among light treatments, and lowercase letters indicate significant differences among pathogen concentrations under the same light level (p < 0.05).
-
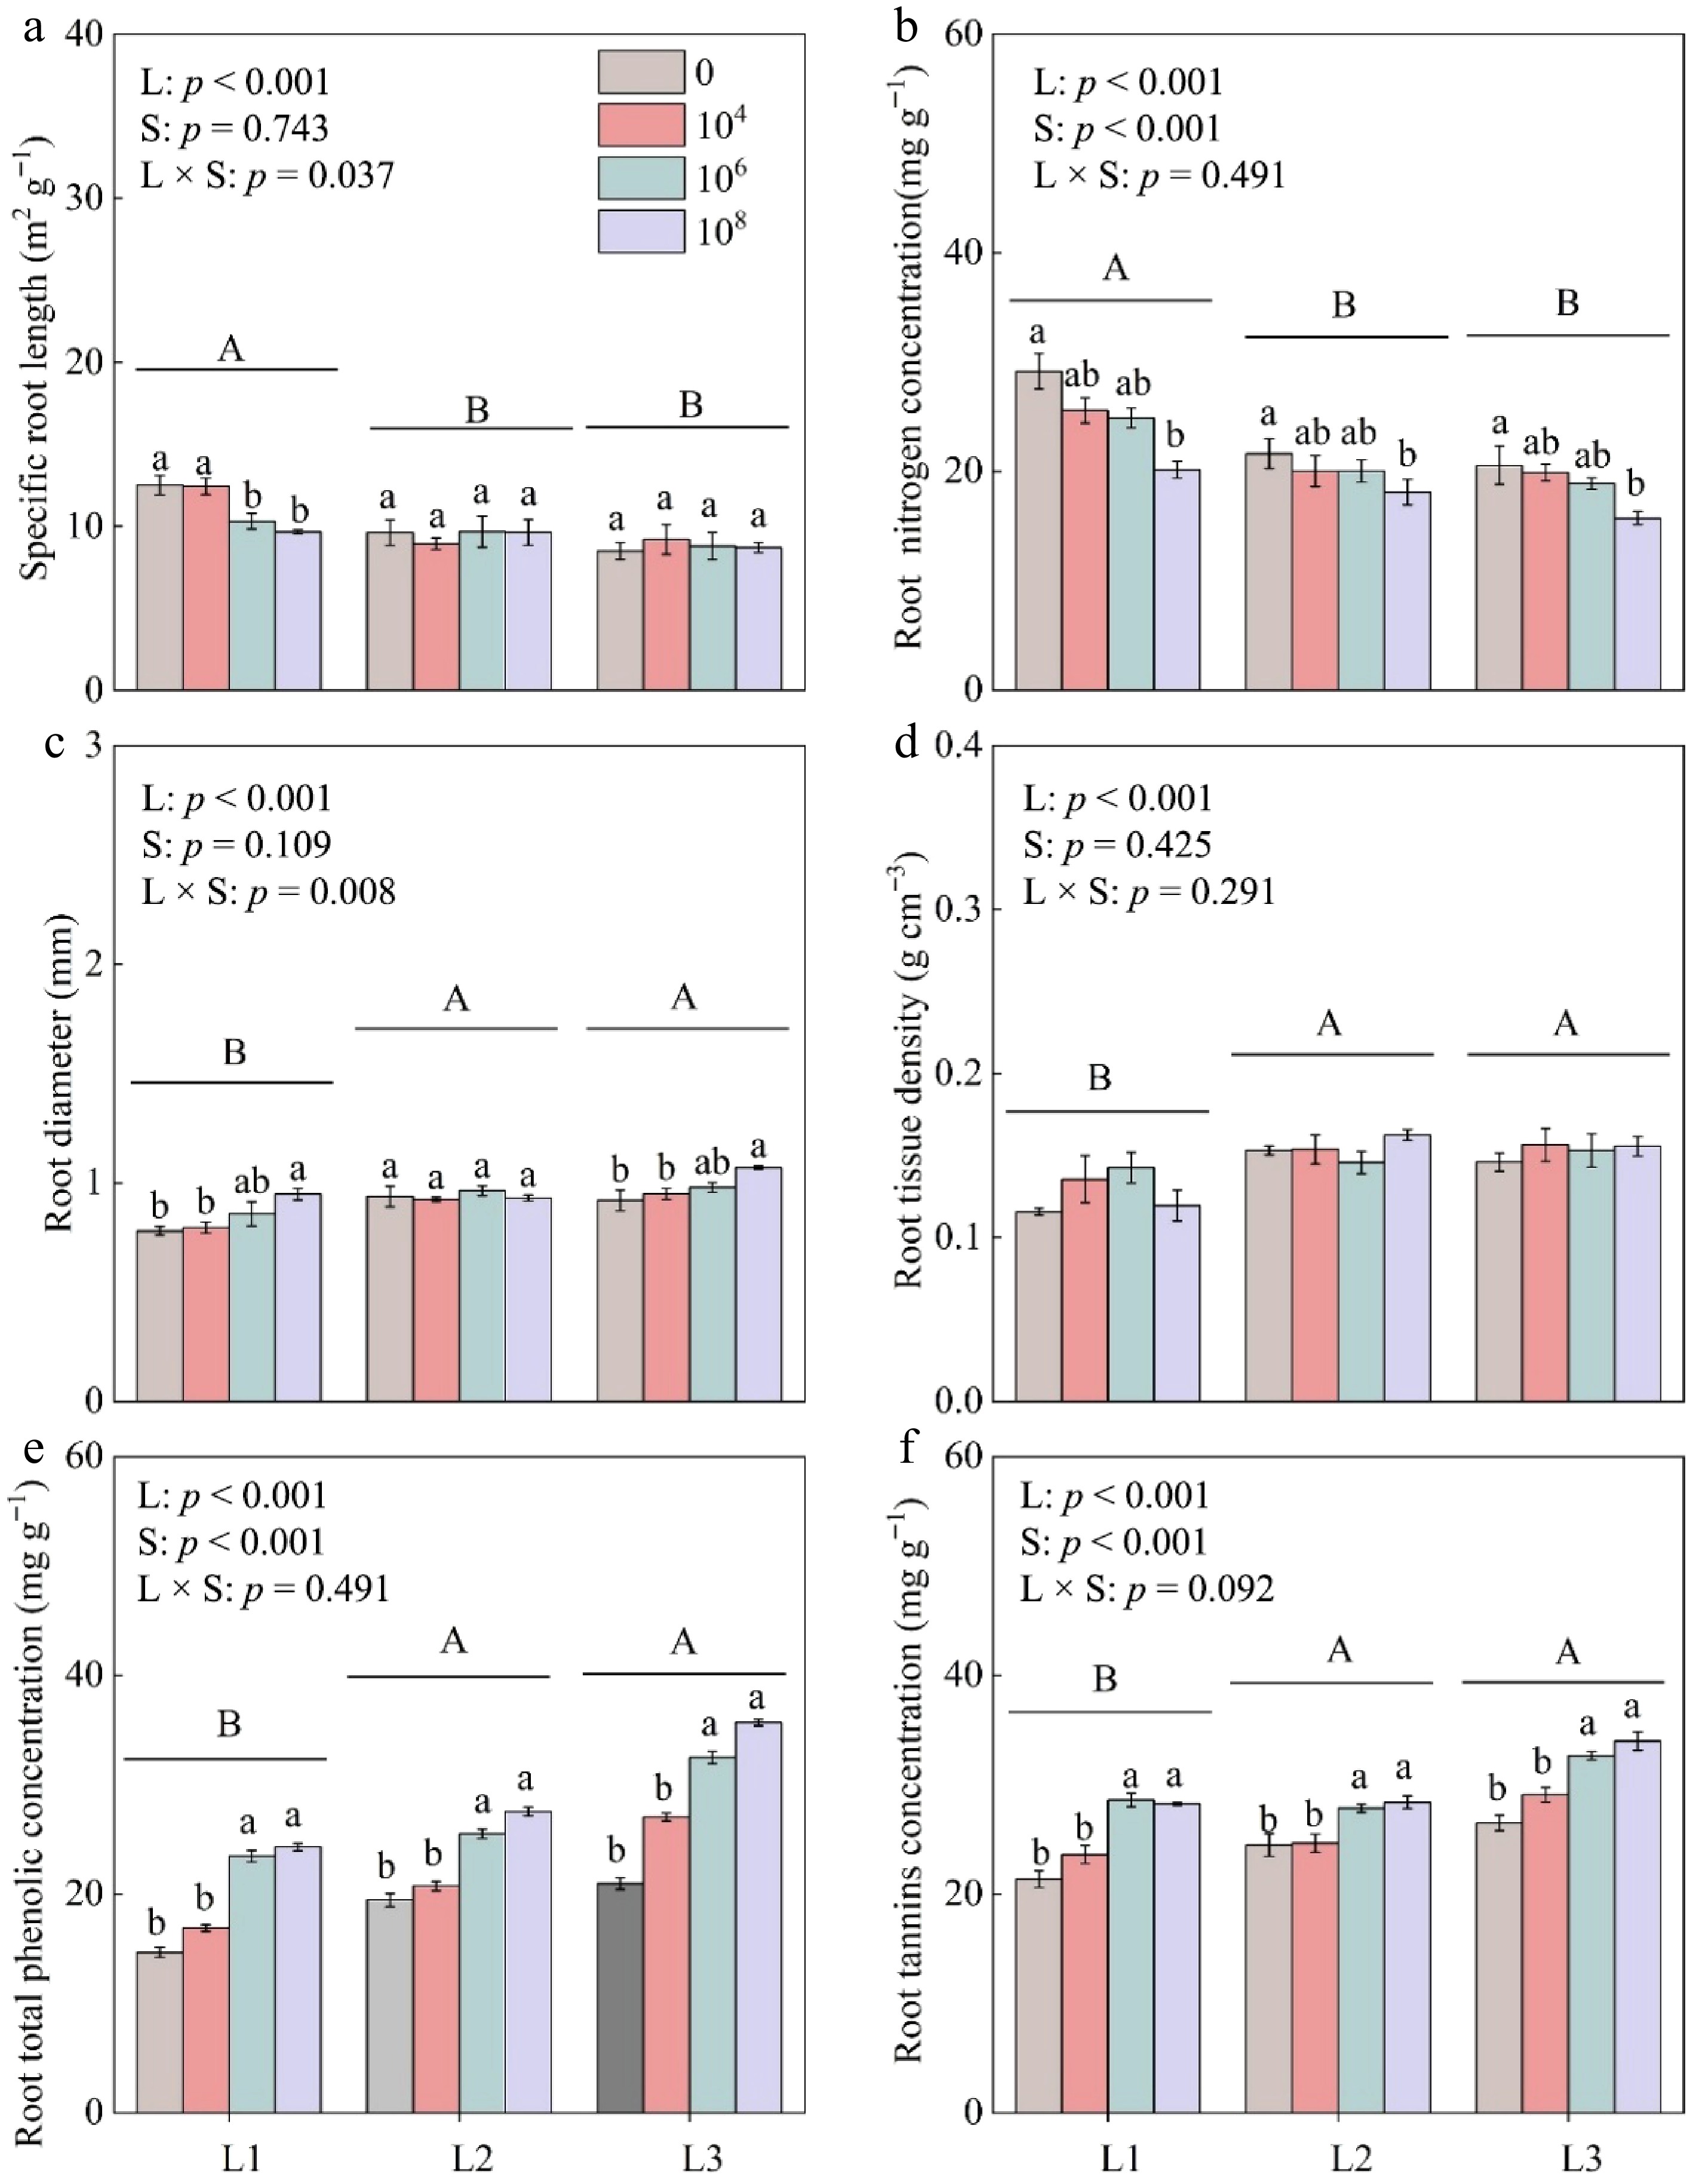
Figure 3.
Variation in root functional traits of P. koraiensis seedlings across light and soil pathogen treatments: (a) specific root length; (b) N concentration; (c) diameter; (d) root tissue density; (e) total phenolic concentration; and (f) tannin concentration. Error bars show the mean values and SE (n = 5). L: light intensity; S: soil pathogen; L × S: the interaction of light intensity and soil pathogen. L1, L2, L3: low, medium, and high light at 200, 400, and 600 μmol·m−2·s−1, respectively; 0, 1 × 10⁴, 1 × 10⁶, 1 × 10⁸: the concentration of Fusarium oxysporum at 0, 1 × 10⁴, 1 × 10⁶, and 1 × 10⁸ CFU/mL, respectively. Different uppercase letters indicate significant differences among light treatments, and lowercase letters indicate significant differences among pathogen concentrations under the same light level (p < 0.05).
-
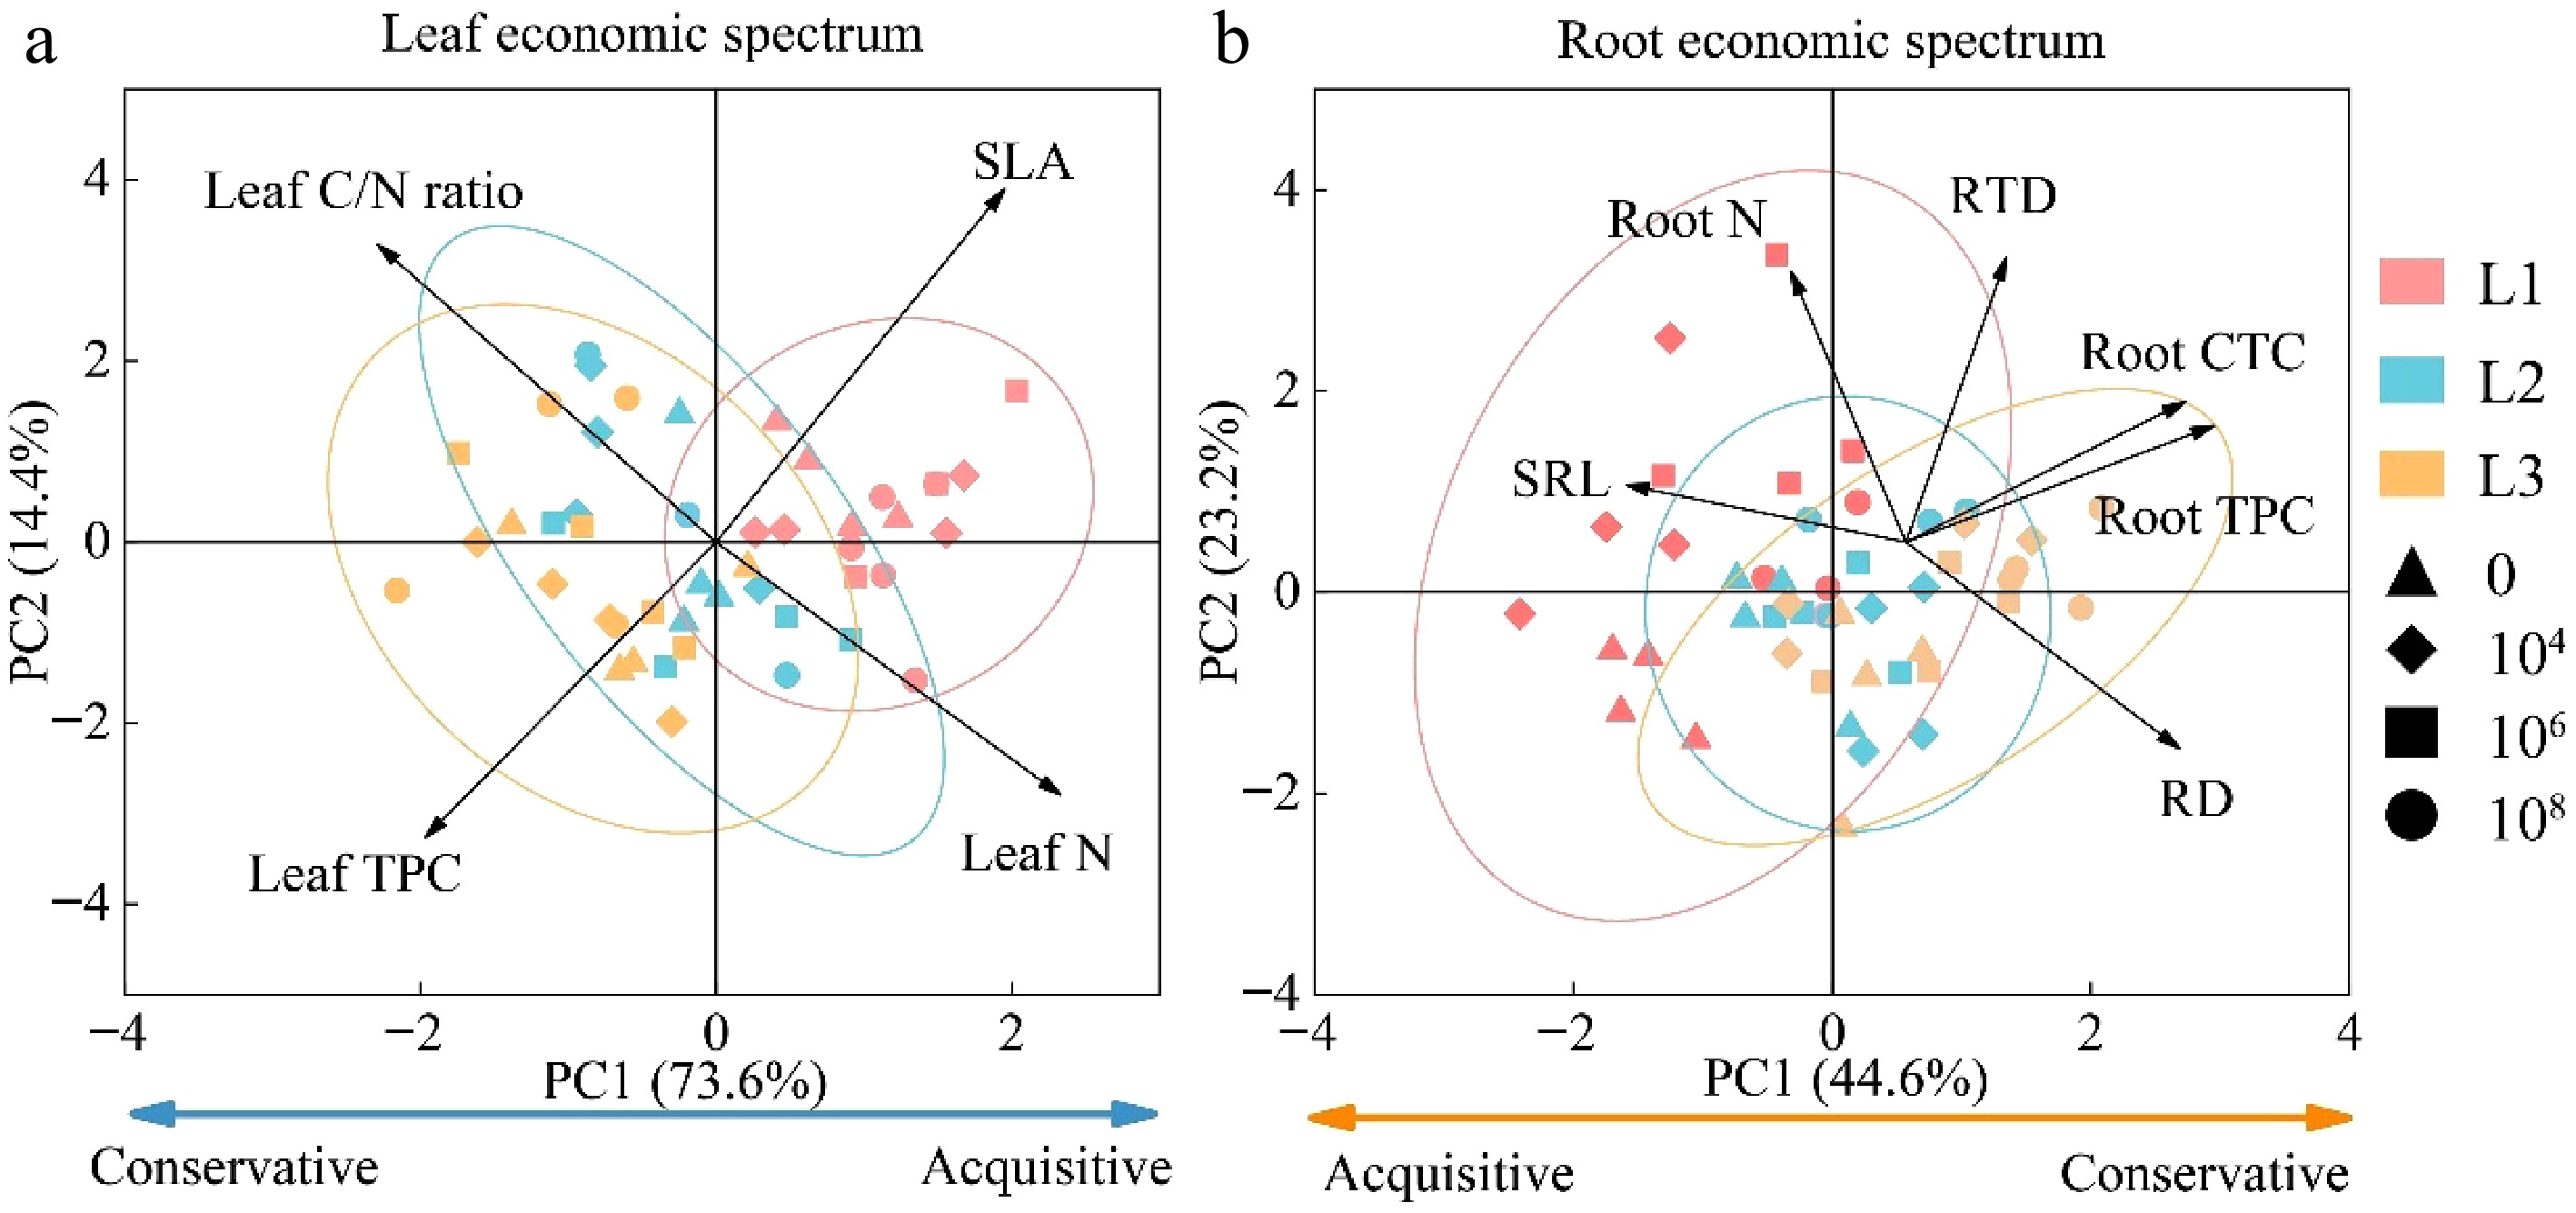
Figure 4.
Principal component analysis (PCA) of leaf and root traits of P. koraiensis seedlings across light and soil pathogen treatments. SLA, specific leaf area; leaf N, leaf nitrogen concentration; leaf TPC, leaf total phenolic concentration; leaf C/N ratio, leaf carbon/nitrogen ratio; SRL, specific root length; root N, root nitrogen concentration; RD, root diameter; RTD, root tissue density; root TPC, root total phenolic concentration; root CTC, root tannin concentration. L1, L2, L3: low, medium, and high light at 200, 400, and 600 μmol·m−2·s−1, respectively; 0, 1 × 10⁴, 1 × 10⁶, 1 × 10⁸: the concentration of Fusarium oxysporum at 0, 1 × 10⁴, 1 × 10⁶, and 1 × 10⁸ CFU/mL, respectively.
-
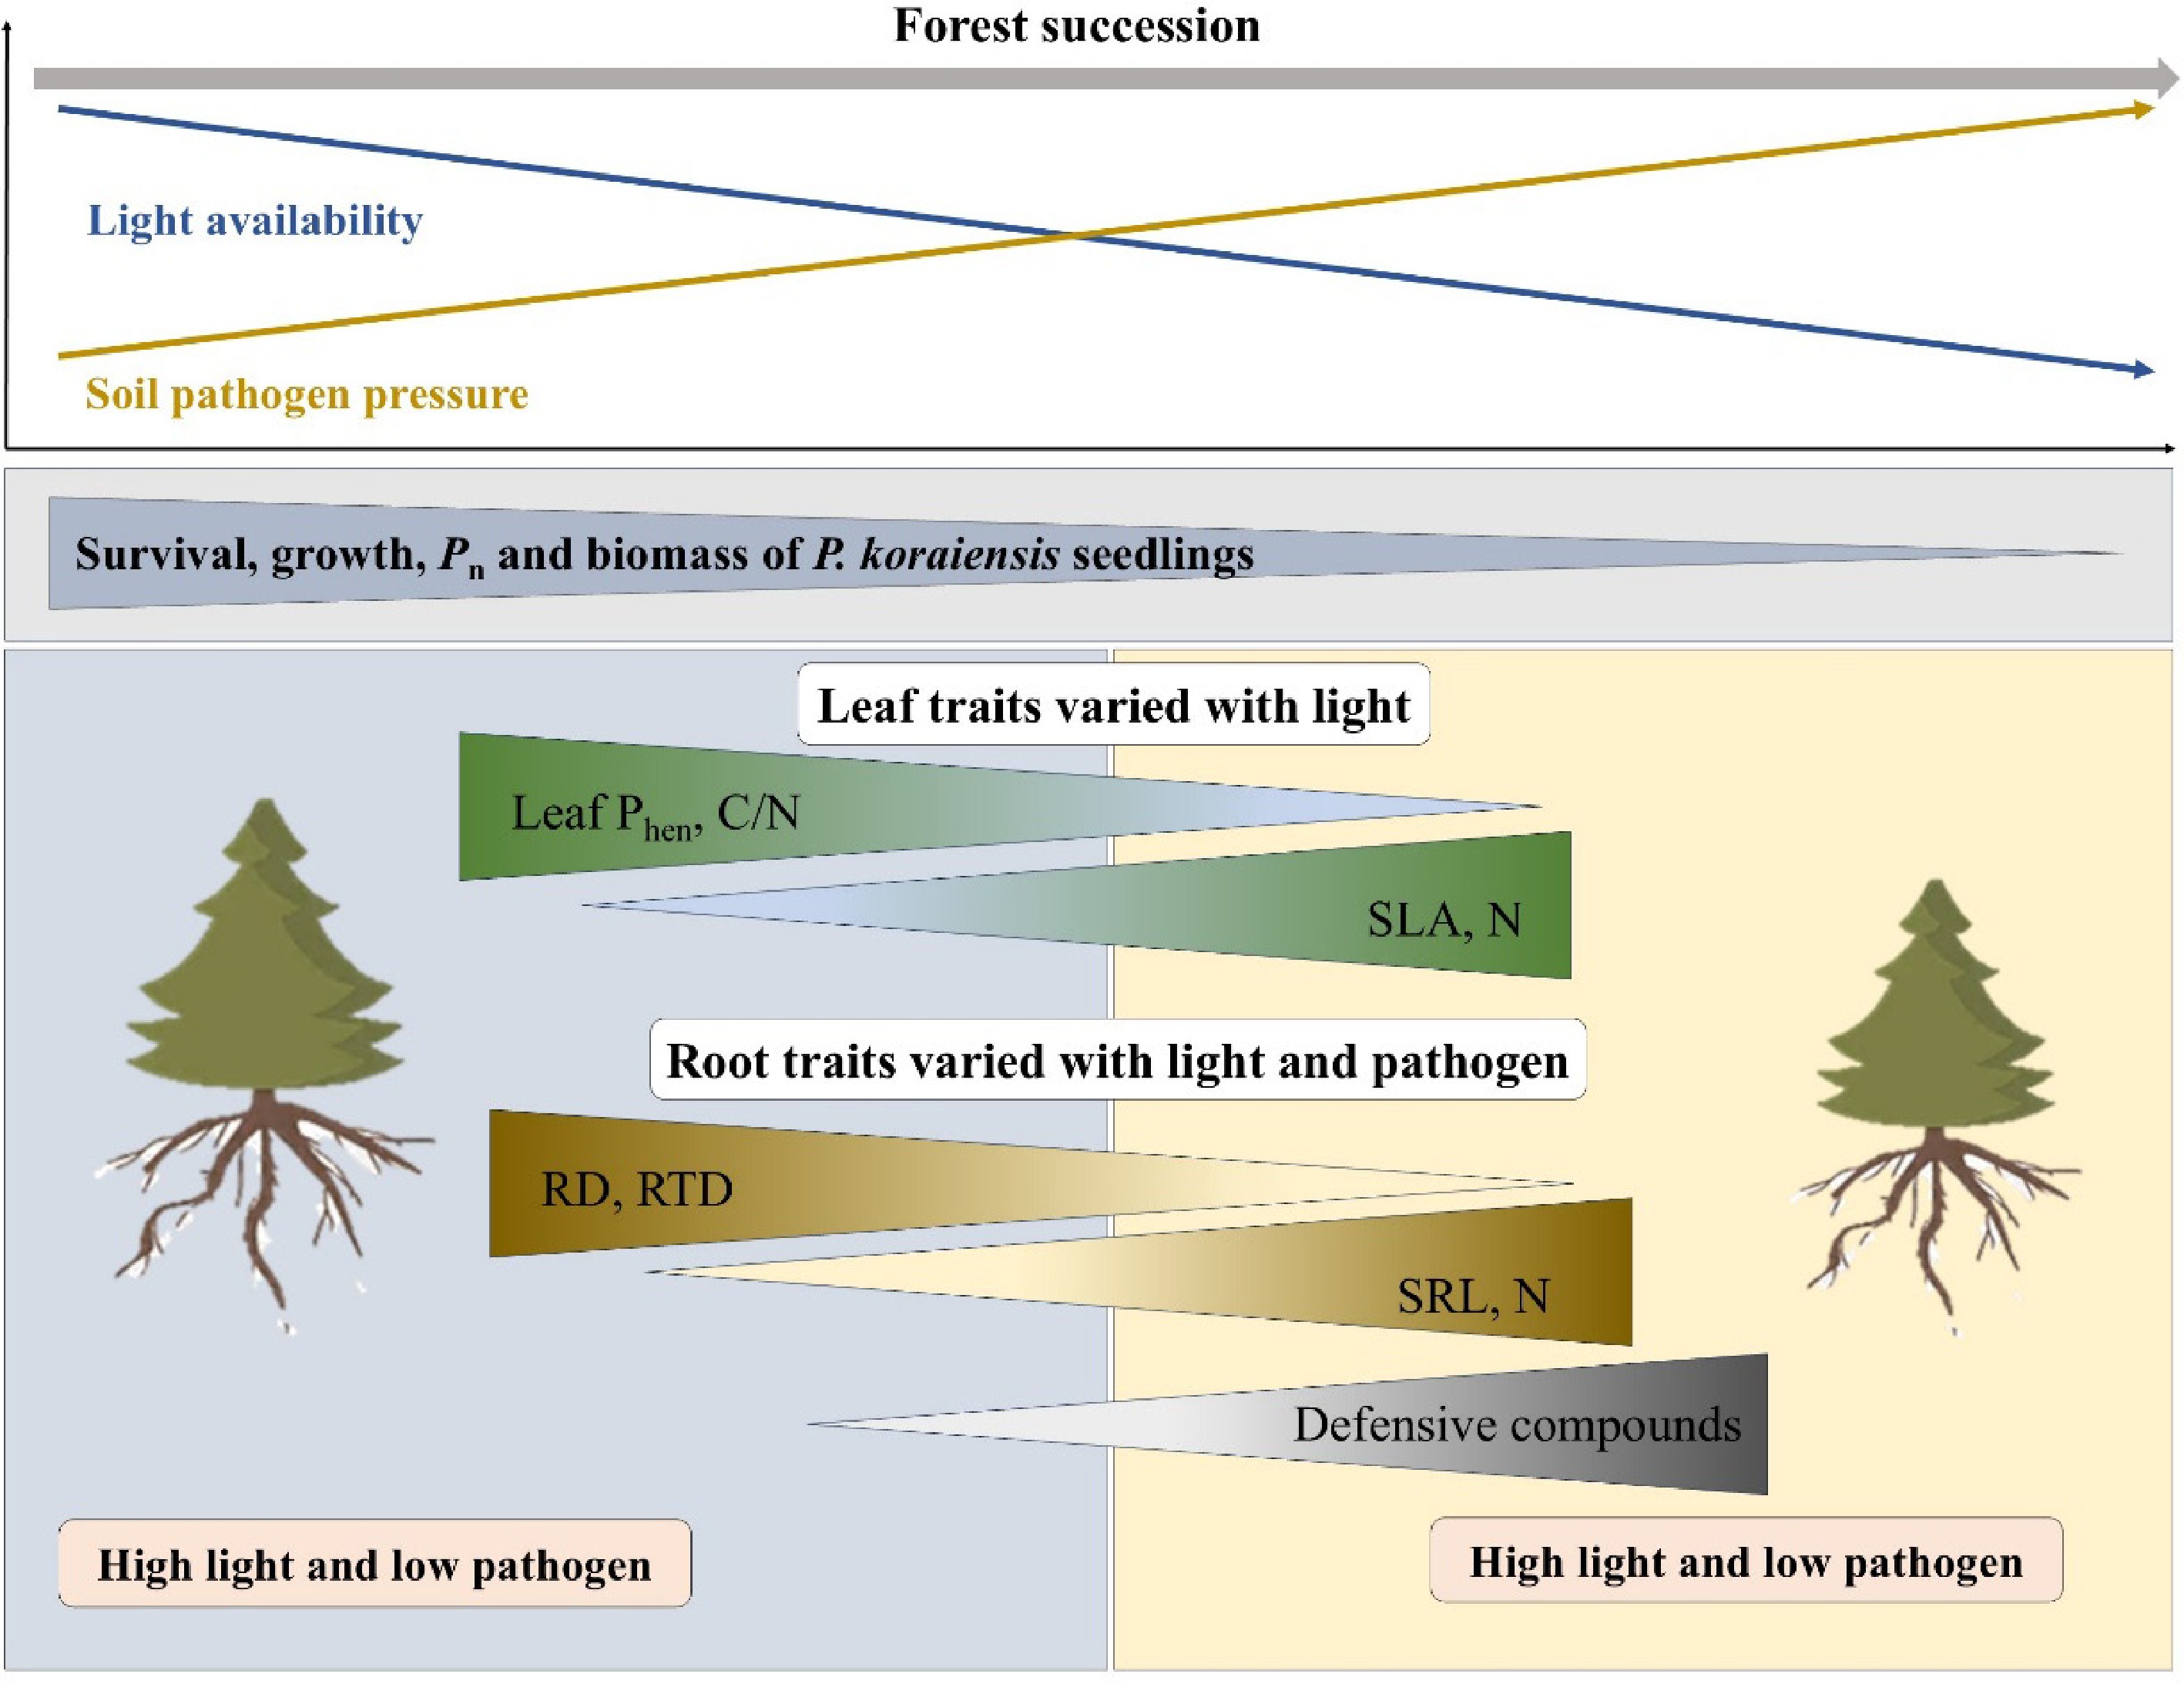
Figure 5.
The conceptual model illustrating adaptation strategies of P. koraiensis seedlings to variation in light availability and soil pathogens. SLA, specific leaf area; N, nitrogen concentration; leaf Phen: leaf total phenols concentration; SRL, specific root length; C/N ratio, carbon/nitrogen ratio; SRL, specific root length; RD, root diameter; RTD, root tissue density; defensive compounds, including root total phenols and tannin concentration.
-
Light level Pathogen concentration
(CFU/mL)Aboveground
biomass (g)Belowground
biomass (g)Total biomass (g) Root : shoot ratio Pn (μmol·m–2·s–1) Tr (mmol·m-2·s−1) L1 0 0.23 ± 0.01Ca 0.11 ± 0.01Ca 0.34 ± 0.02Ca 0.49 ± 0.02Bb 3.56 ± 0.44Ca 0.36 ± 0.05Ba 1 × 10⁴ 0.15 ± 0.01Cb 0.07 ± 0.01Cb 0.23 ± 0.01Cb 0.51 ± 0.04Bab 2.69 ± 0.16Cb 0.36 ± 0.05Ba 1 × 10⁶ 0.13 ± 0.01Cbc 0.07 ± 0.01Cbc 0.20 ± 0.01Cbc 0.54 ± 0.01Bab 2.35 ± 0.09Cbc 0.34 ± 0.03Ba 1 × 10⁸ 0.11 ± 0.01Cc 0.06 ± 0.01Cc 0.17 ± 0.01Cc 0.56 ± 0.07Ba 1.75 ± 0.26Cc 0.34 ± 0.02Ba L2 0 0.32 ± 0.01Ba 0.18 ± 0.01Ba 0.49 ± 0.02Ba 0.51 ± 0.02Bb 4.20 ± 0.19Ba 0.40 ± 0.01Ba 1 × 10⁴ 0.26 ± 0.01Bb 0.13 ± 0.01Bbc 0.39 ± 0.03Bb 0.57 ± 0.02Bab 3.51 ± 0.32Bab 0.27 ± 0.03Bb 1 × 10⁶ 0.21 ± 0.02Bc 0.12 ± 0.01Bbc 0.33 ± 0.02Bc 0.59 ± 0.04Bab 3.36 ± 0.38Bab 0.26 ± 0.04Bb 1 × 10⁸ 0.16 ± 0.01Bd 0.09 ± 0.01Bc 0.26 ± 0.01Bd 0.64 ± 0.05Ba 3.07 ± 0.05Bb 0.22 ± 0.03Bb L3 0 0.47 ± 0.01Aa 0.27 ± 0.02Aa 0.74 ± 0.01Aa 0.59 ± 0.04Ab 7.06 ± 0.03Aa 0.61 ± 0.02Aa 1 × 10⁴ 0.33 ± 0.01Ab 0.21 ± 0.01Ab 0.53 ± 0.01Ab 0.63 ± 0.04Aab 5.53 ± 0.46Ab 0.57 ± 0.05Aa 1 × 10⁶ 0.29 ± 0.02Ac 0.17 ± 0.01Ab 0.46 ± 0.03Ac 0.62 ± 0.07Aab 4.01 ± 0.28Ac 0.43 ± 0.04Ab 1 × 10⁸ 0.17 ± 0.02Ad 0.13 ± 0.01Ac 0.30 ± 0.02Ad 0.75 ± 0.06Aa 3.56 ± 0.11Ac 0.29 ± 0.01Ac L F 151.78 165.93 254.54 6.87 82.16 26.80 P < 0.001 < 0.001 < 0.001 0.003 < 0.001 < 0.001 S F 116.76 57.16 144.78 3.11 34.12 11.36 P < 0.001 < 0.001 <0.001 0.038 < 0.001 < 0.001 L × S F 9.41 5.11 11.81 0.55 5.21 4.08 P < 0.001 < 0.001 < 0.001 0.769 < 0.001 0.003 Different uppercase letters indicate significant differences among light treatments, and lowercase letters indicate significant differences among pathogen concentrations under the same light (p < 0.05). L: light intensity; S: soil pathogens; L × S: interaction effect. L1, L2, L3: low, medium, and high light at 200, 400, and 600 μmol·m−2·s−1, respectively; 0, 1 × 10⁴, 1 × 10⁶, 1 × 10⁸: the concentration of Fusarium oxysporum at 0, 1 × 10⁴, 1 × 10⁶, 1 × 10⁸ CFU/mL, respectively. Table 1.
Photosynthetic traits and biomass allocation of P. koraiensis seedlings across light and soil pathogen treatments.
Figures
(5)
Tables
(1)