-
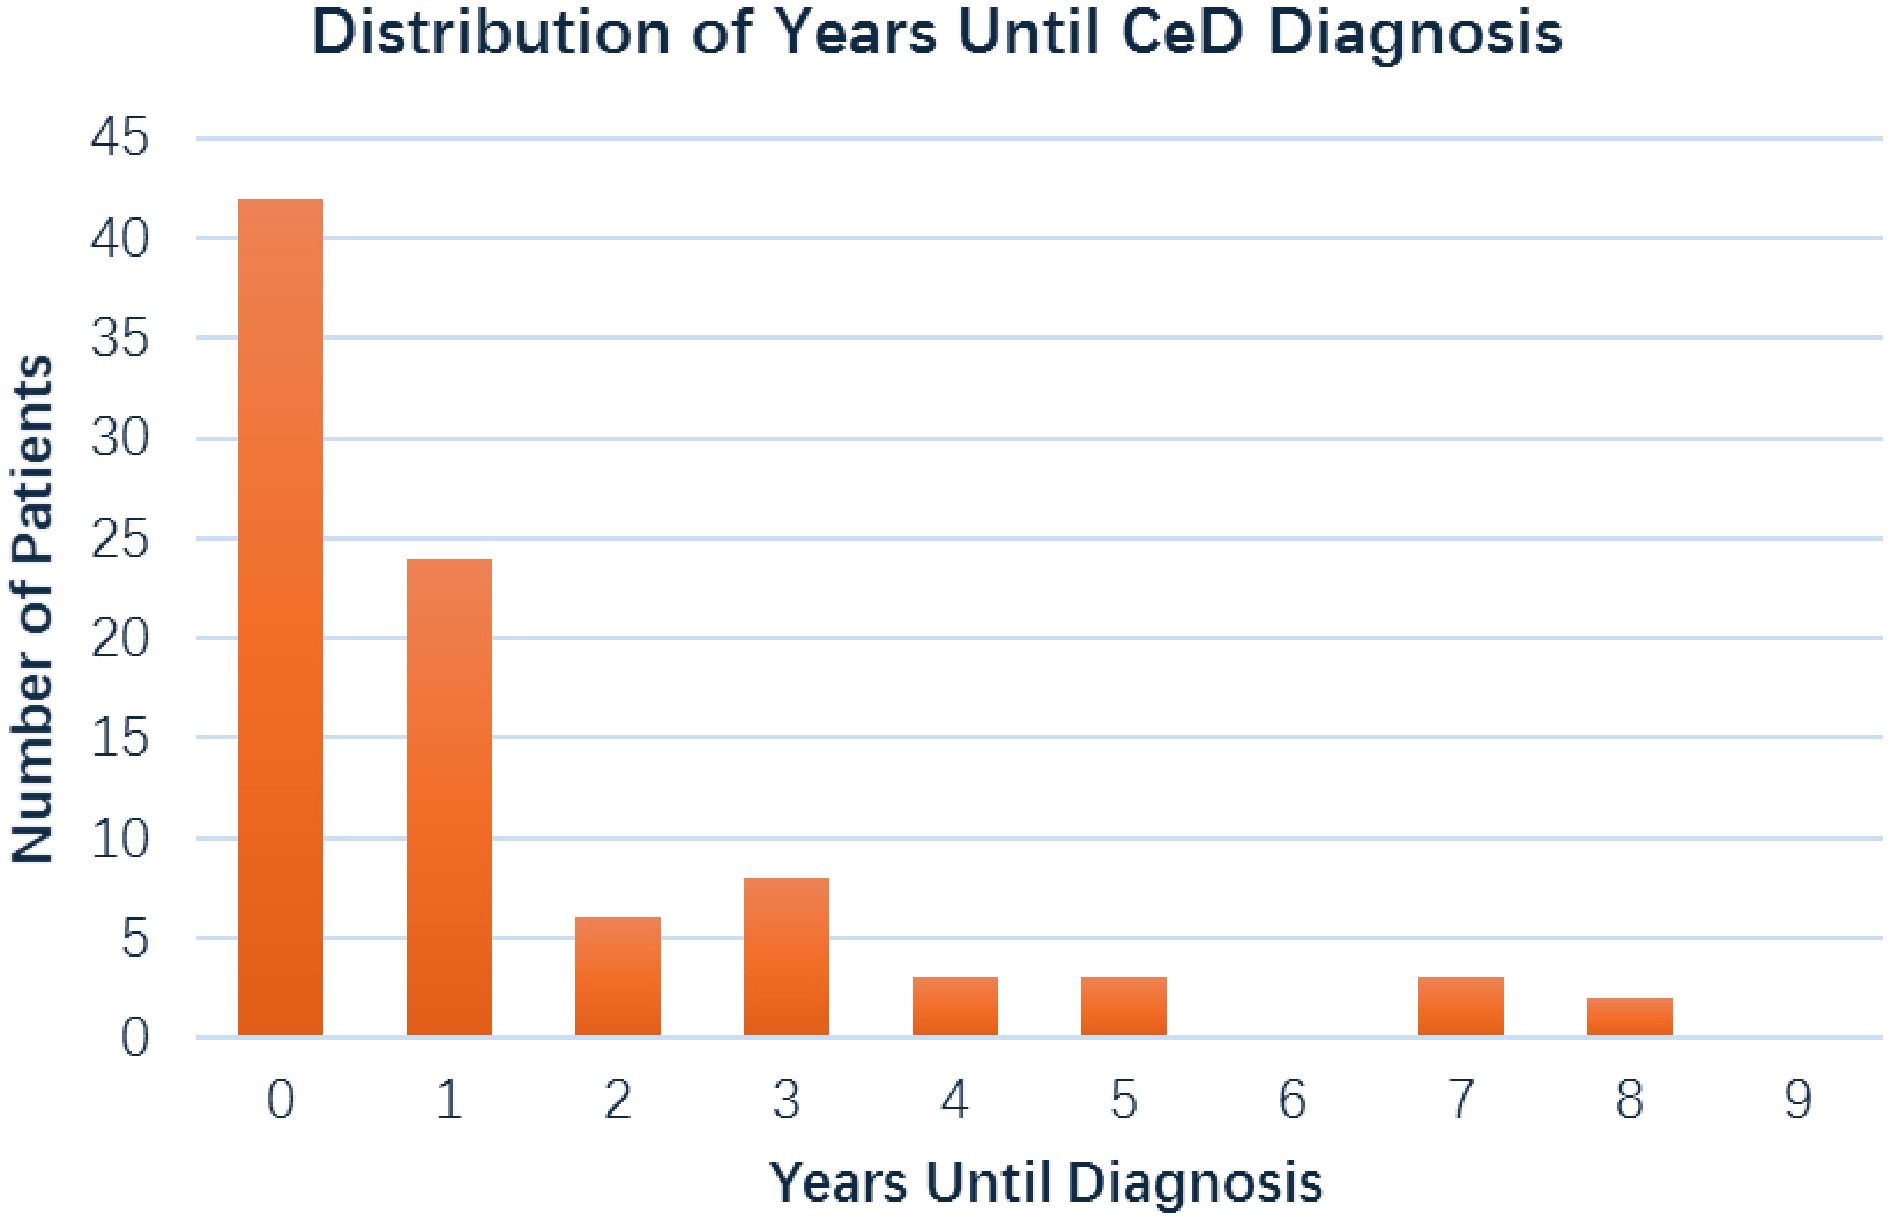
Figure 1.
Distribution years from T1DM diagnosis to CeD diagnosis.
-
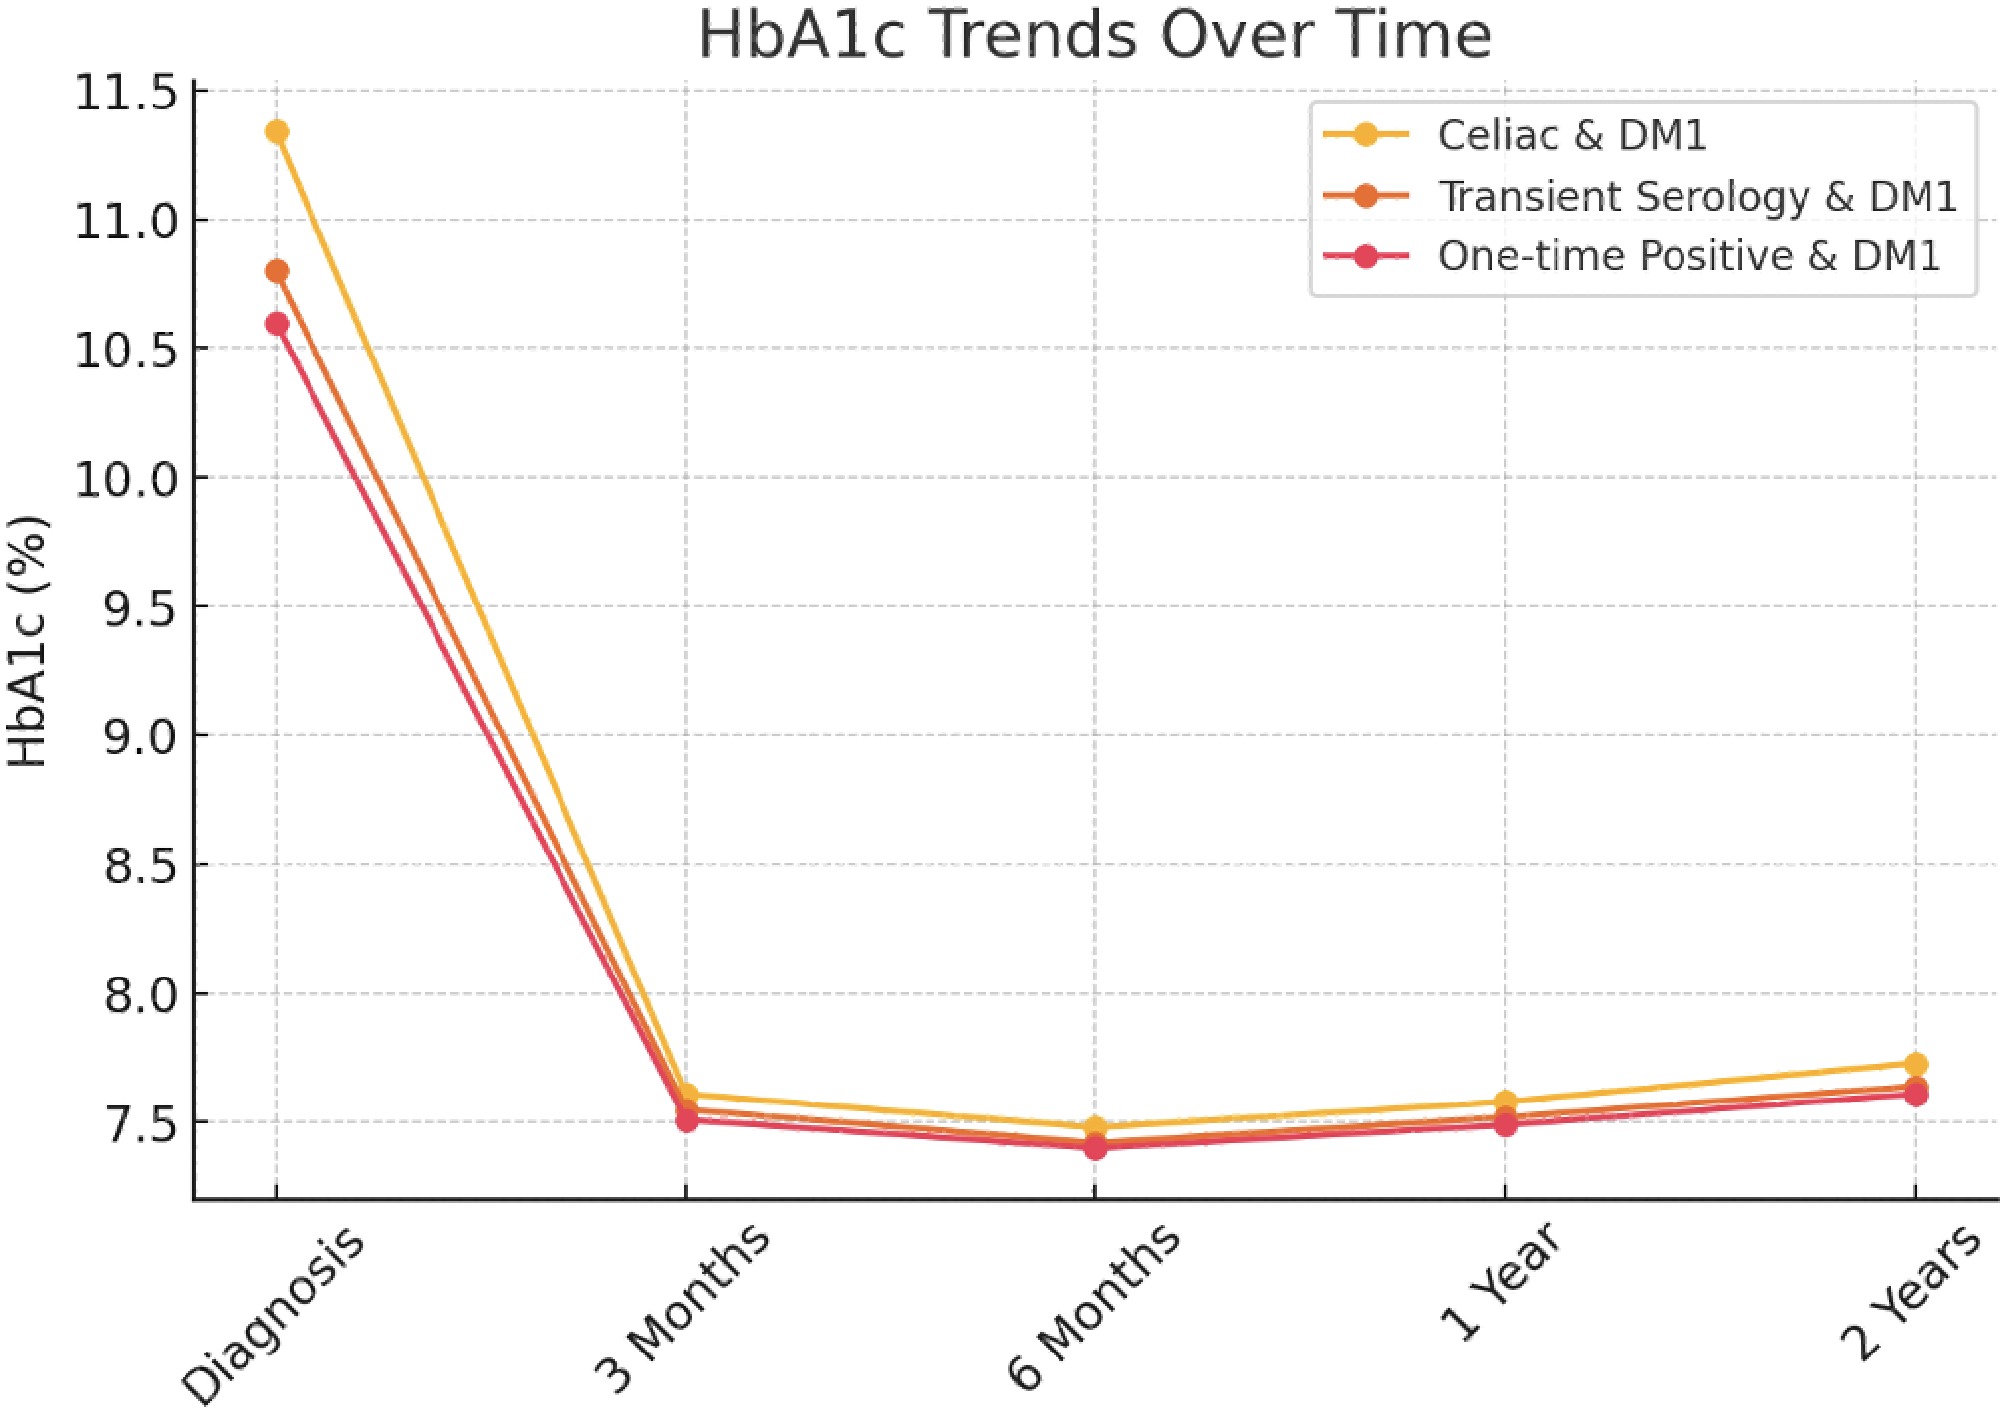
Figure 2.
HbA1c trends over time in children with type 1 diabetes (DM1) according to celiac serology status.
-
Comparison Group 1 (CeD + DM1)
n = 113Group 2 (transient serology and DM1) n = 15 Group 3 (one-time positive serology and DM1) n = 8 p-value TTG0 mean (baseline) (× ULN) 9.38 (SD ± 14.84) 4.3 (SD ± 5.1) 1.83 (SD ± 0.9) p < 0.01 EMA positive, n (%) 86, (76.4%) 10, (66.6%) 2, (25.0%) p < 0.01 Biopsy performed, n (%) 101, (89.8%) 6, (40.0%) 1, (12.5%) p < 0.01 TTG1 mean (follow-up while on GCD) 9.00 (SD ± 9.62) 4.9 (SD ± 5.09) 3.8 (SD ± 0.9) p < 0.05 HbA1c at diagnosis (%) 11.34 (SD ± 2.35) 10.8 (SD ± 2.28) 10.6 (SD ± 2.95) p <0.01 HbA1c at 1 year (%) 7.58(SD ± 1.00) 7.52 (SD ± 1.22) 7.49 (SD ± 1.20) p <0.01 HbA1c at 2 years (%) 7.73(SD ± 1.01) 7.64 (SD ± 1. 7) 7.61 (SD ± 0.5) p <0.01 Gastrointestinal symptoms, n (%) 32, (28.3%) 0, (0%) 0, (0%) p < 0.01 Female, n (%) 67, (59.3%) 9, (60.0%) 3, (37.5%) p = 0.729 Autoimmune markers, n (%) 108, (95.3%) 15, (100%) 7, (87.5%) p = 0.42 Family Hx of CeD, n (%) 11, (9.7%) 1, (6.7%) 0, (0.0%) p = 0.43 Family Hx of T1DM, n (%) 19, (16.8%) 0, (0.0%) 1, (12.5%) p = 0.23 CeD, celiac disease; DM1, type 1 diabetes mellitus; TTG0, tissue transglutaminase antibody at baseline; SD, standard deviation; EMA, endomysial antibodies; TTG1, tissue transglutaminase antibody at follow-up; HbA1c, glycated hemoglobin; M/F, male/female; Hx, history; GCD, gluten-containing diet. Table 1.
Group comparisons.
-
Comparison CeD before T1DM CeD after T1DM p-value GI symptoms at CeD diagnosis, n (%) 14/20 (70.0%) 18/91 (19.8%) 0.001 EMA positivity, n (%) 5/10 (50.0%) 5/54 (9.3%) 0.001 Thyroglobulin antibody positivity, n (%) 2/19 (10.5%) 0/87 (0.0%) 0.002 Insulin autoantibody positivity, n (%) 4/19 (21.1%) 40/87 (46.0%) 0.046 Liver function test abnormalities, n (%) 0/21 (0.0%) 2/92 (2.2%) 1.000 (NS) Family history of CeD or T1DM, n (%) 8/21 (38.1%) 25/91 (27.5%) 0.33 (NS) HbA1c at 1 year post-T1DM diagnosis, n (%) Higher Lower 0.02 HbA1c at 2 years post-T1DM diagnosis, n (%) Higher Lower 0.008 Microvascular complications (nephropathy, retinopathy) None observed in either group None observed in either group N/A Bold values are to indicate statistically significant p-values. CeD, celiac disease; T1DM, type 1 diabetes mellitus; GI, gastrointestinal; EMA, endomysial antibodies; HbA1c, glycated hemoglobin; NS, not significant; N/A, not applicable. Table 2.
Clinical and laboratory differences between patients diagnosed with CeD before vs after T1DM.
Figures
(2)
Tables
(2)