-
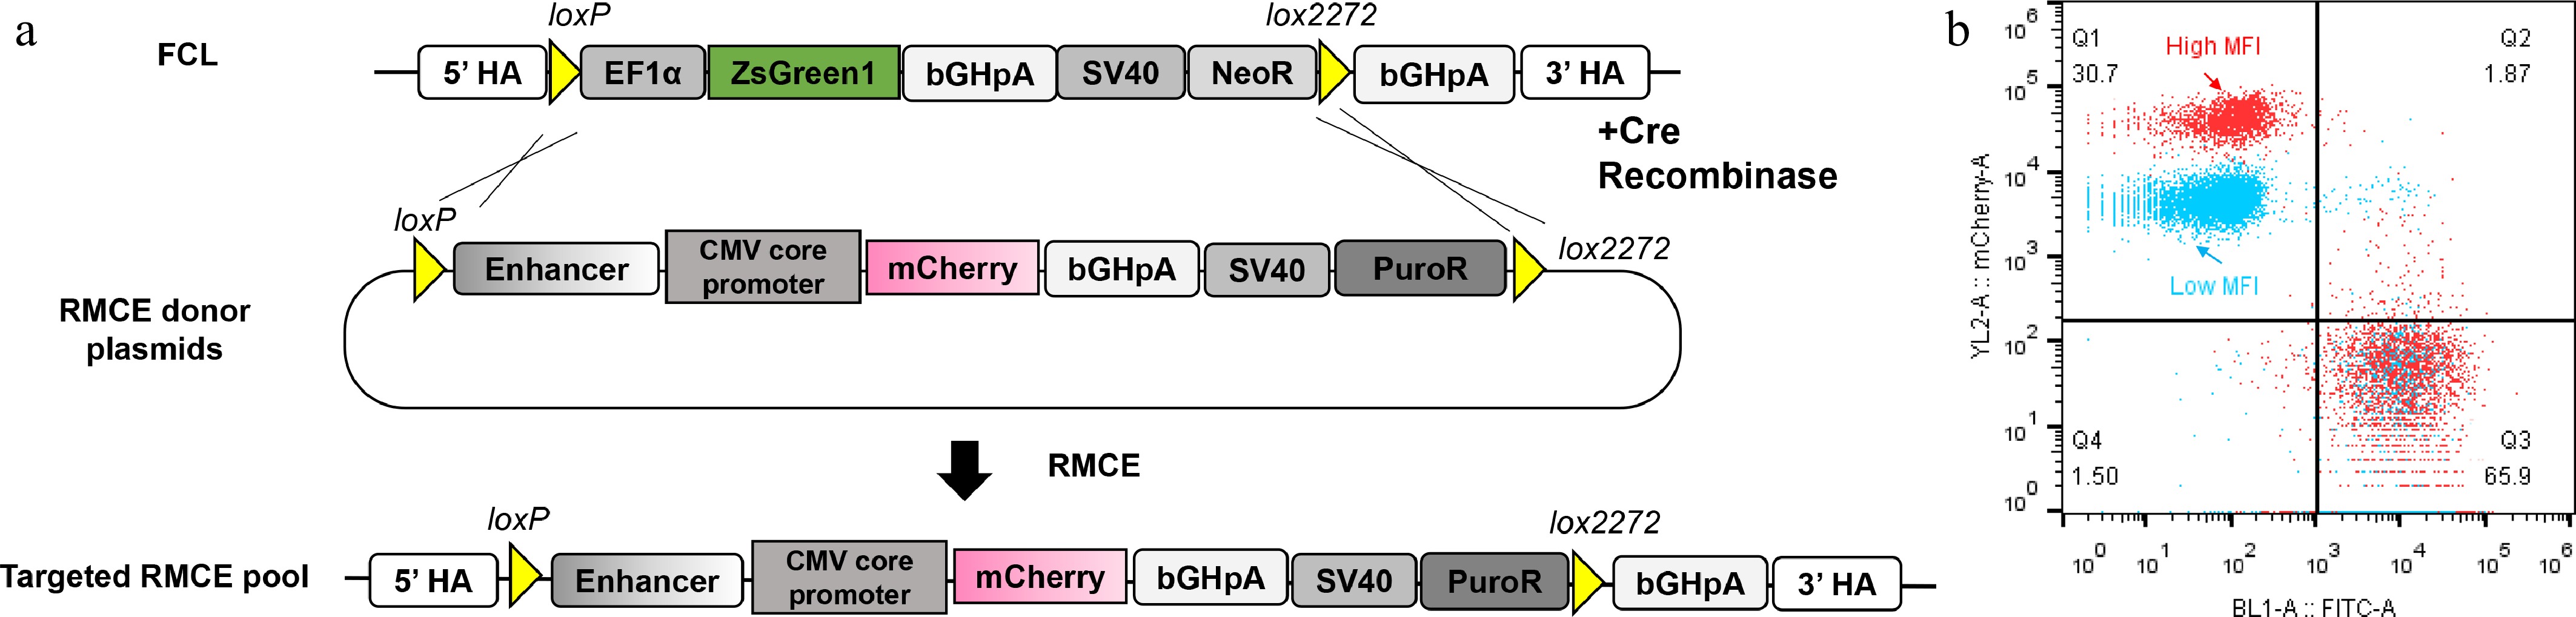
Figure 1.
Generation of a synthetic promoter screening platform via SSI and its application in promoter screening. (a) We previously integrated the landing pad (LP) sequence into a safe harbor site within the Chinese hamster ovary (CHO-K1) cell genome to construct a founder cell line (FCL). Within the LP, the ZsGreen1 expression cassette is flanked by loxP and lox2272 sites, with a bGH poly(A) sequence located downstream of the lox2272 site. Upon co-transfection with the Cre recombinase plasmid, the ZsGreen1 expression cassette is replaced by the mCherry expression cassette from the RMCE donor plasmid. The correctly integrated cells (mCherry+/ZsGreen1-) are enriched under puromycin selection for 10 d. By measuring the median fluorescence intensity (MFI) of the successfully recombined populations, the expression levels of different synthetic promoters were evaluated. HA: homologous arm. (b) By detecting the MFI of the successfully recombined populations (i.e., mCherry+/ZsGReen1- cells in quadrant Q1), we can distinguish the strength of the two different promoters. Quadrant Q1 merged the flow cytometry results of the two promoters with varying strengths. The cell population in quadrant Q3 was resistant to puromycin selection and did not undergo recombination at the target locus.
-
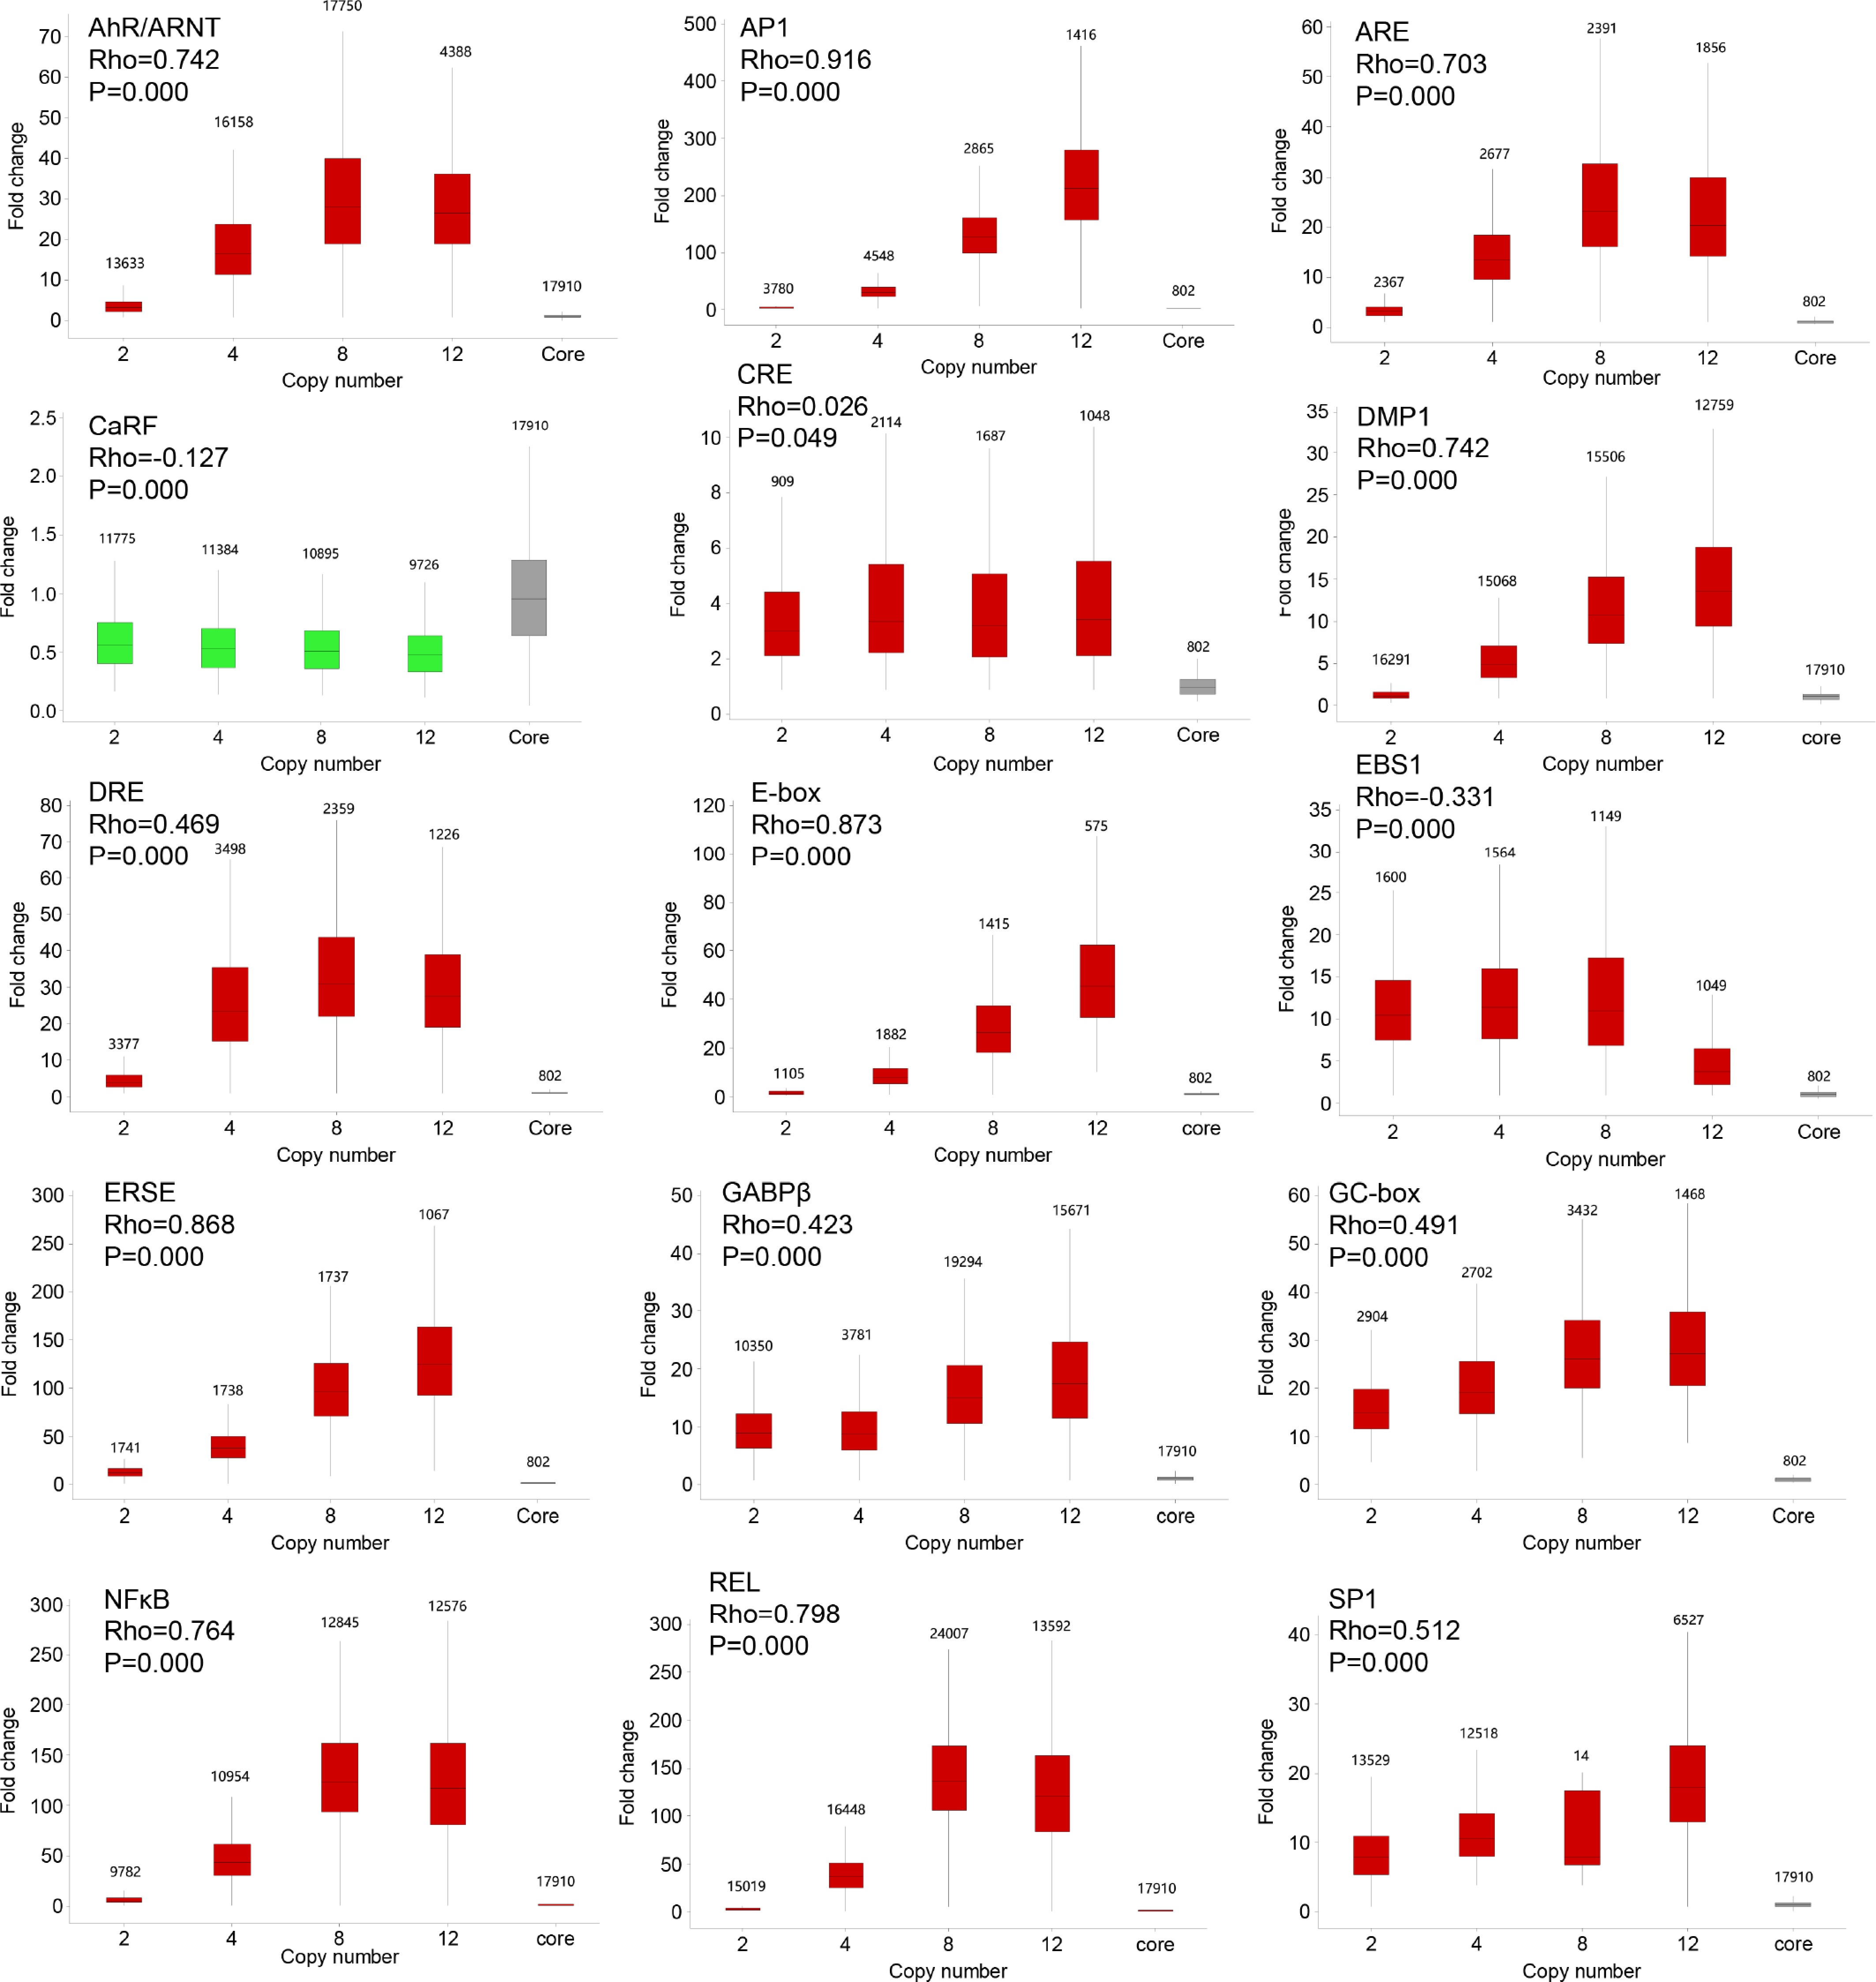
Figure 2.
Determination of optimal copy number for 15 TFREs. Spearman's rho was used to calculate the correlations between copy number and expression level for all 15 TFREs. Benjamini–Hochberg FDR-adjusted p-values were derived from Spearman's correlations. The CaRF binding site was included as an example of a site that could not be homotypically amplified. On the right, box plots illustrate the background expression of the CMV core promoter without any TFREs upstream. Red boxes indicate groups of TFREs with significantly higher expression compared to the core background (Mann–Whitney U test, p < 0.05), while green boxes represent groups with significantly lower expression. In the box plots, the central rectangle spans the first and third quartiles, the line within the rectangle denotes the median, and the ends of the vertical lines extending beyond the box indicate the minimum and maximum values. The numbers at the top of the boxes represent the number of tested biological replicates.
-
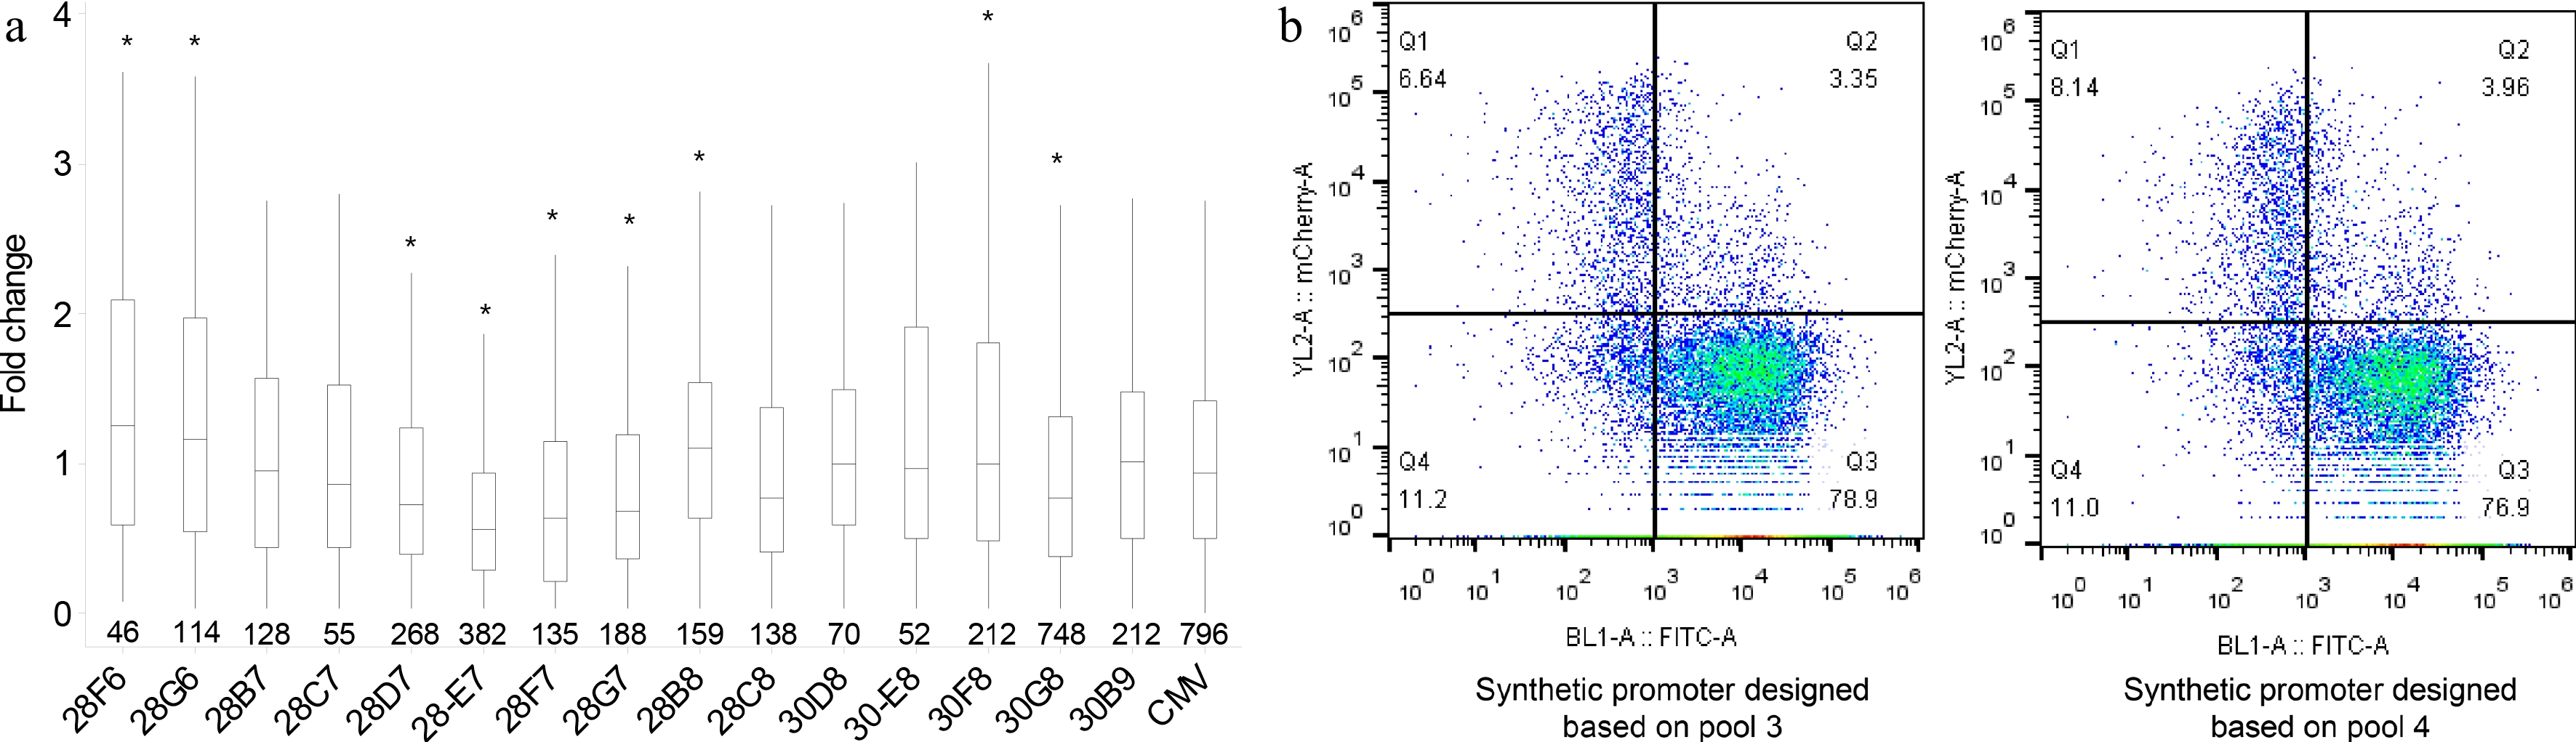
Figure 3.
The order and number of TFREs in heterotypic promoters influence reporter expression. (a) Reporter expression levels driven by different synthetic promoters derived from pool 1 and pool 2 were compared to the CMV promoter. Here, '28' or '30' indicates the total number of TFRE copies in each promoter, while 'F6', 'G6', etc., represent serial numbers. Fold changes were calculated by normalizing the MFI of the full CMV promoter. In the box plots, the central rectangle spans the first and third quartiles, the line inside the rectangle represents the median, and the ends of the vertical lines extending beyond the box indicate the minimum and maximum values. Statistical analysis was conducted between the synthetic promoters and the CMV promoter using the Mann–Whitney U test; * p < 0.05. The numbers at the bottom of the boxes indicate the number of biological replicates tested. (b) Since the distributions of mCherry expression are nearly identical across all promoters designed based on pool 3 and pool 4, only two exemplar promoters are shown here. The reporter expression of both promoters is log-uniformly distributed.
-
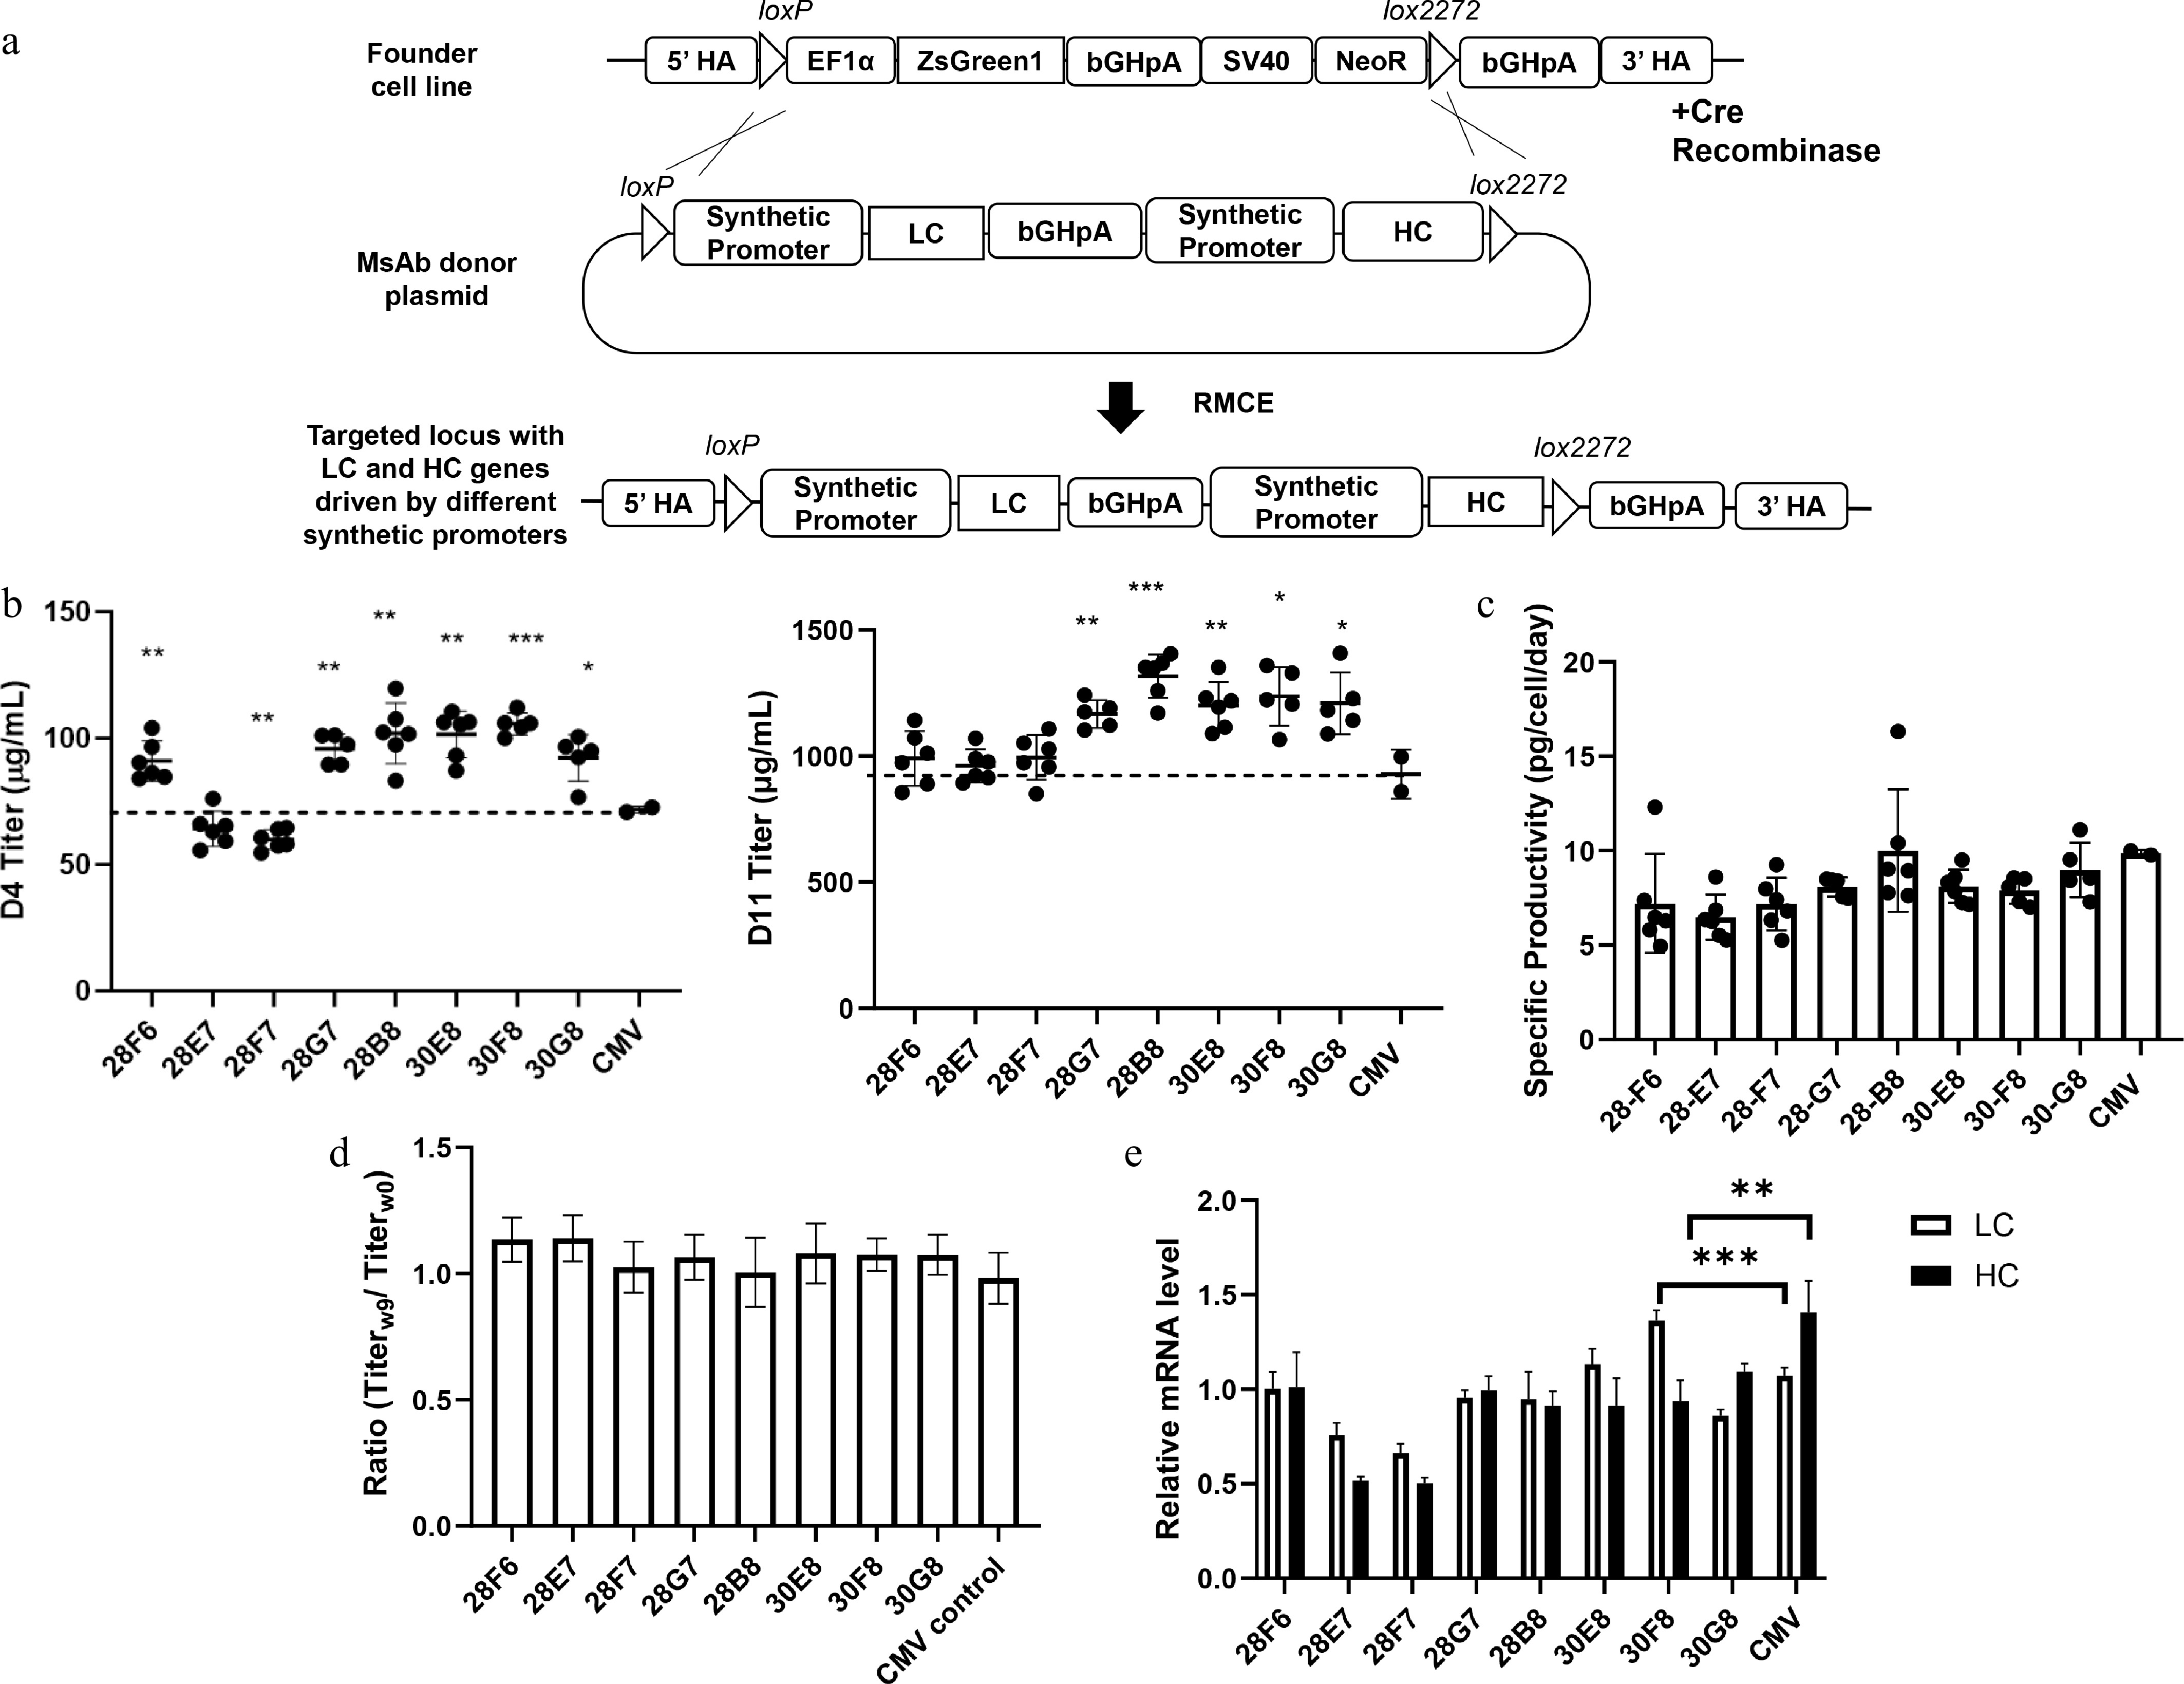
Figure 4.
The msAb expression levels driven by eight synthetic promoters were comparable to those of the CMV promoter. (a) Generation of clonally-derived cell lines expressing msAb, correctly integrated and driven by various synthetic promoters. (b) Titers measured on D4 and D11 of fed-batch culture are presented. Dashed lines indicate the average titer value of the CMV control group. Statistical analysis in (b) was performed by the Student's t-test comparing the synthetic promoter sample to the CMV promoter sample; * p < 0.05, ** p < 0.01, *** p < 0.001. Sample sizes were n = 5 for all synthetic promoters (e.g., 28F6, 28E7, 28F7, 28G7, 28B8, 30E8, 30F8, and 30G8) and n = 2 for the CMV promoter. (c) Specific productivity is shown. (d) Stability of msAb titer after 9 weeks of passaging is illustrated. (e) LC and HC gene expression levels during seed train culture were measured by qRT-PCR and normalized to the mean value of 28F6. One tested sample was randomly selected from each group. Error bars represent the standard deviation of three technical replicates (n = 3). Statistical analysis in (e) was performed using a Student's t-test comparing the synthetic promoter sample to the CMV promoter sample. The result comparing 30F8 and the CMV promoter are shown in the graph. ** p < 0.01, *** p < 0.001. All p-values were calculated and are listed in Supplementary Table S15.
-
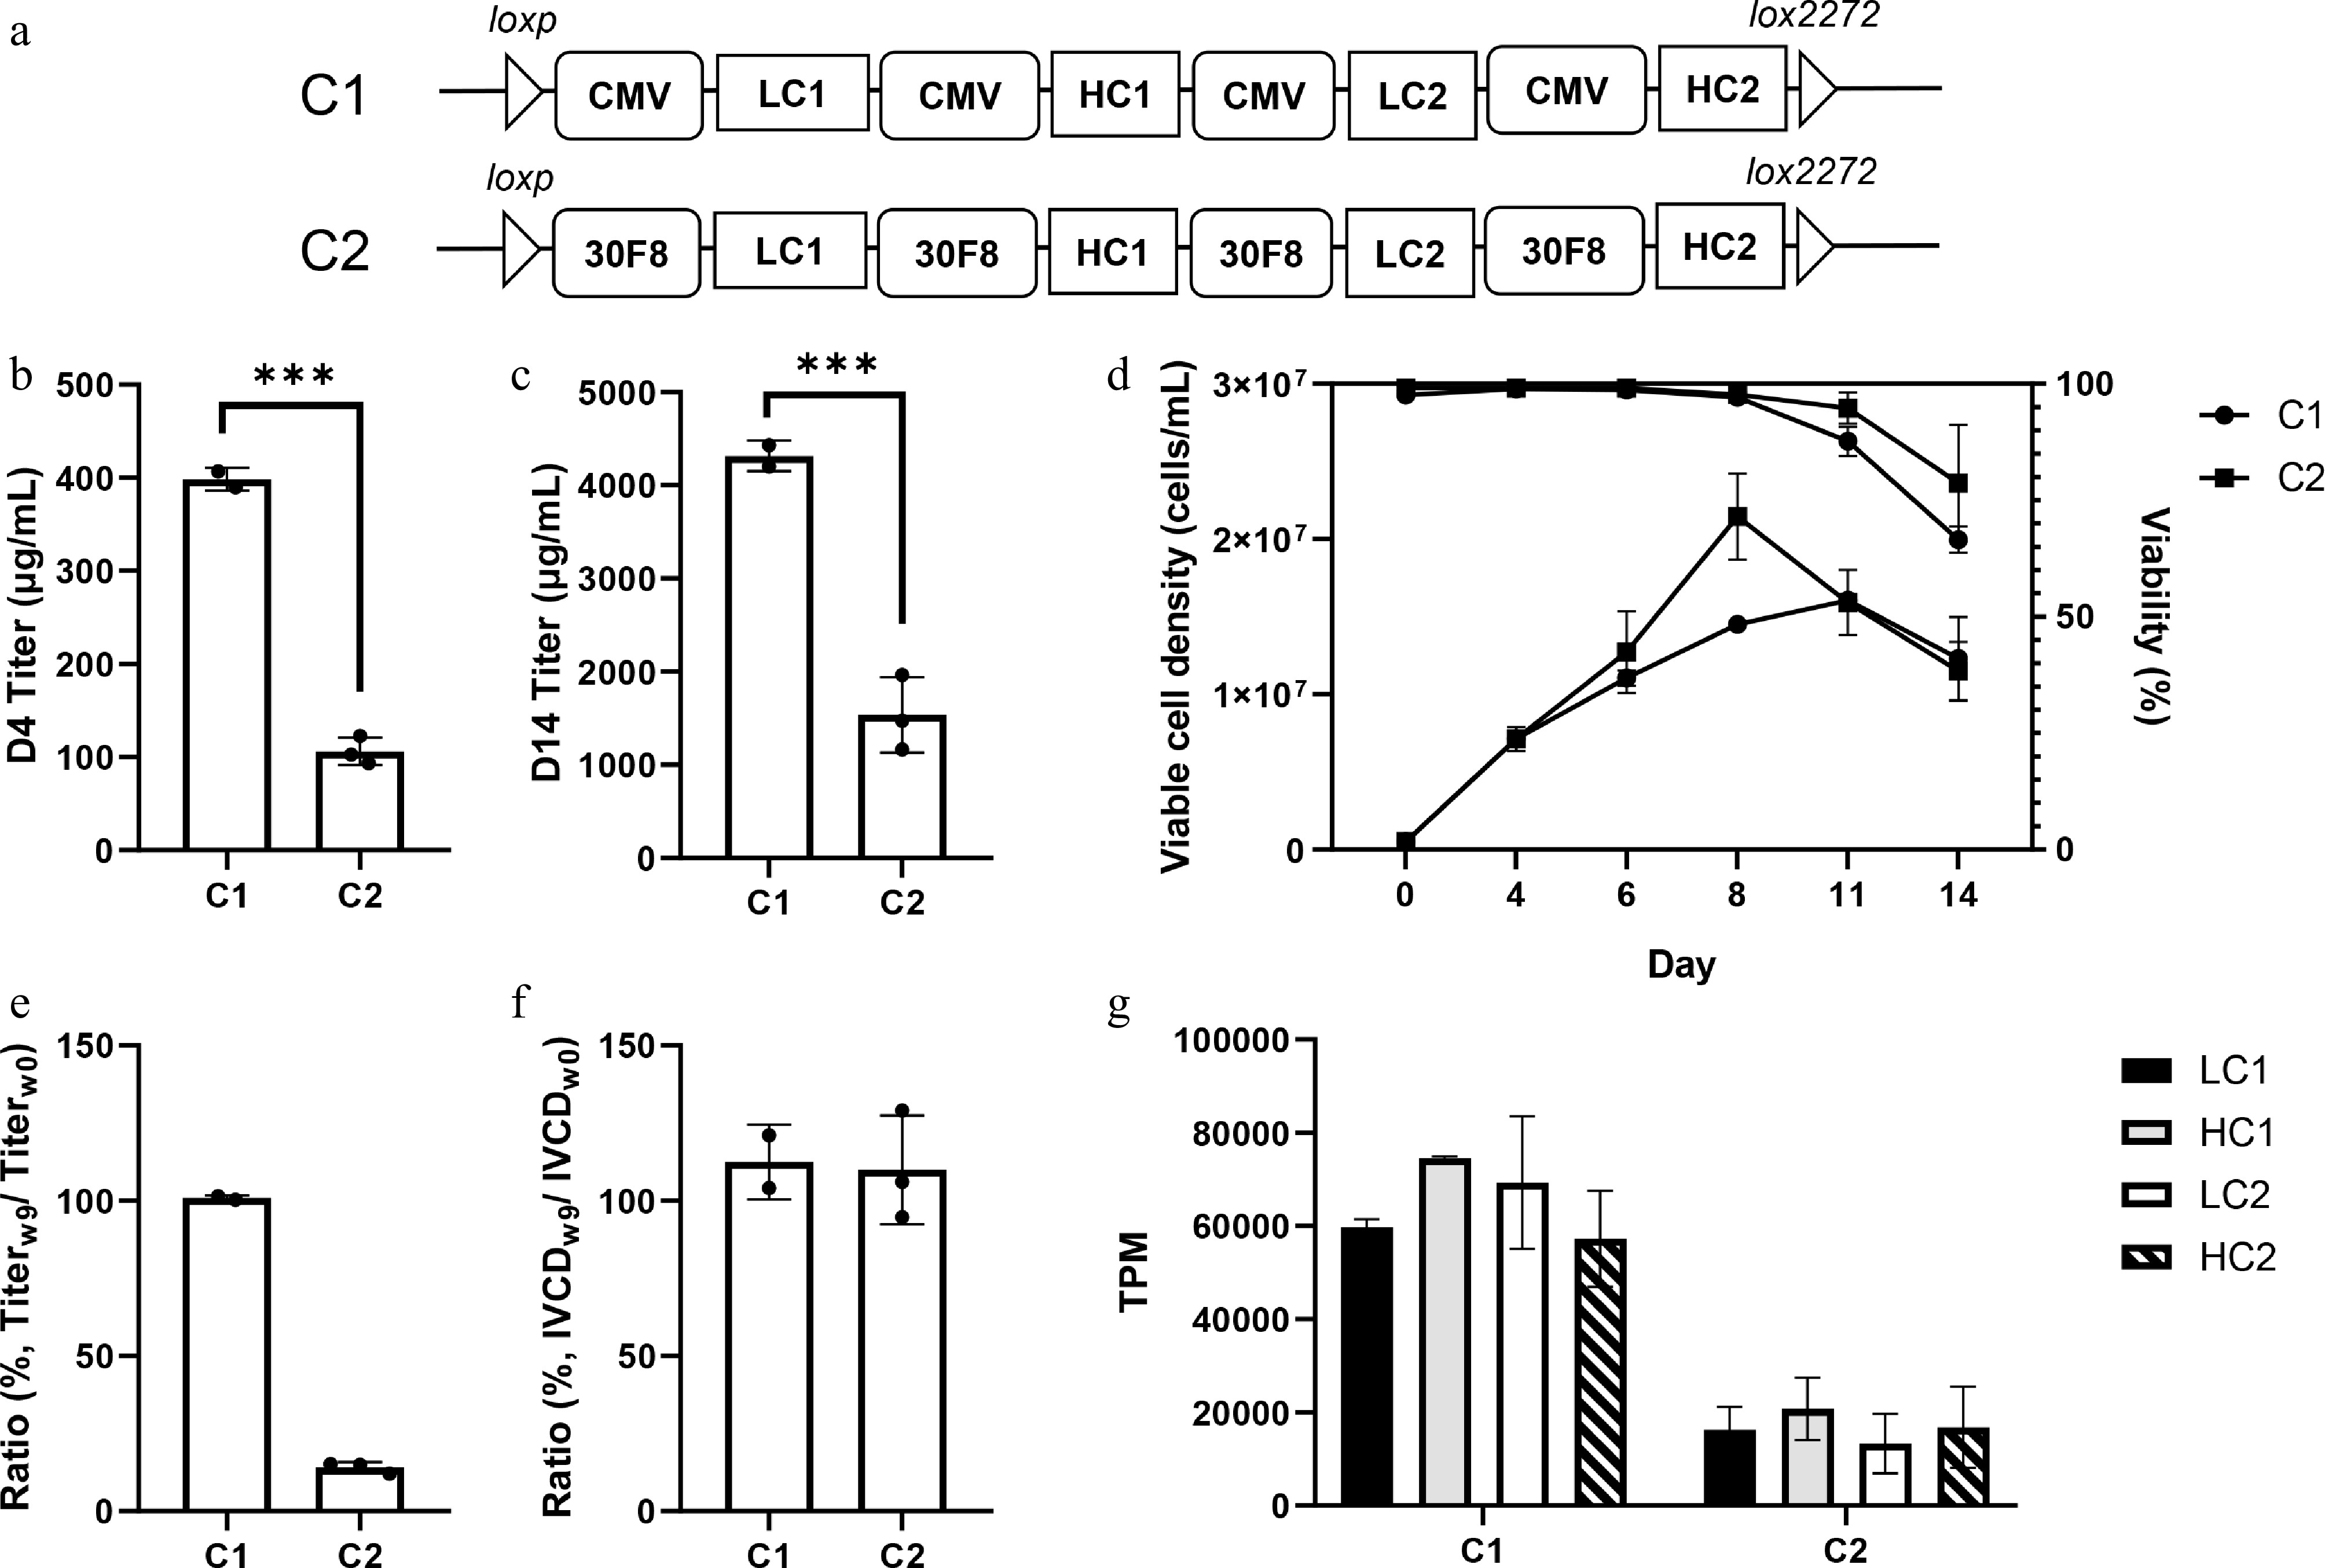
Figure 5.
Synthetic promoter combination expresses lower levels of a bsAb than a CMV promoter combination. (a) The CMV or synthetic promoter 30F8 is positioned upstream of each of the bsAb genes. The arrangement of the four bsAb genes is fixed in the order of LC1-HC1-LC2-HC2. A total of two promoter combinations were designed. (b), (c) The fed-batch titers on D4 and D14 are presented. Statistical analysis in (b) and (c) was performed using a Student's t-test comparing the C2 to the C1 samples. The results comparing two sets of samples are shown in the graph; *** p < 0.001. (d) VCD and viability during the fed-batch process are shown. (e), (f) The stability of fed-batch titer and cell growth over a 9-week passage are presented. (g) Transcription levels of transgenes are measured in transcripts per kilobase million (TPM) for bsAb-producing, clonally-derived cell lines sampled during seed train culture. The error bars represent the standard deviations of three subclones expressing the same transgenes (n = 3). In panels (b)–(g), n = 2 for C1; n = 3 for C2.
Figures
(5)
Tables
(0)