-

Figure 1.
Localization of miR-9 in the (a) non-treated control group. (b) negative control group, and (c) antagomir-9-treated group. Insert images demonstrate the overlap of miR-9 with 4′,6-diamidino-2-phenylindole (DAPI); arrows indicate cells in the ganglion cell layer. GCL, ganglion cell layer; IPL, inner plexiform layer; INL, inner nuclear layer; OPL, outer plexiform layer; ONL, outer nuclear layer. Scale bar represents 50 and 25 µm on the inserts.
-
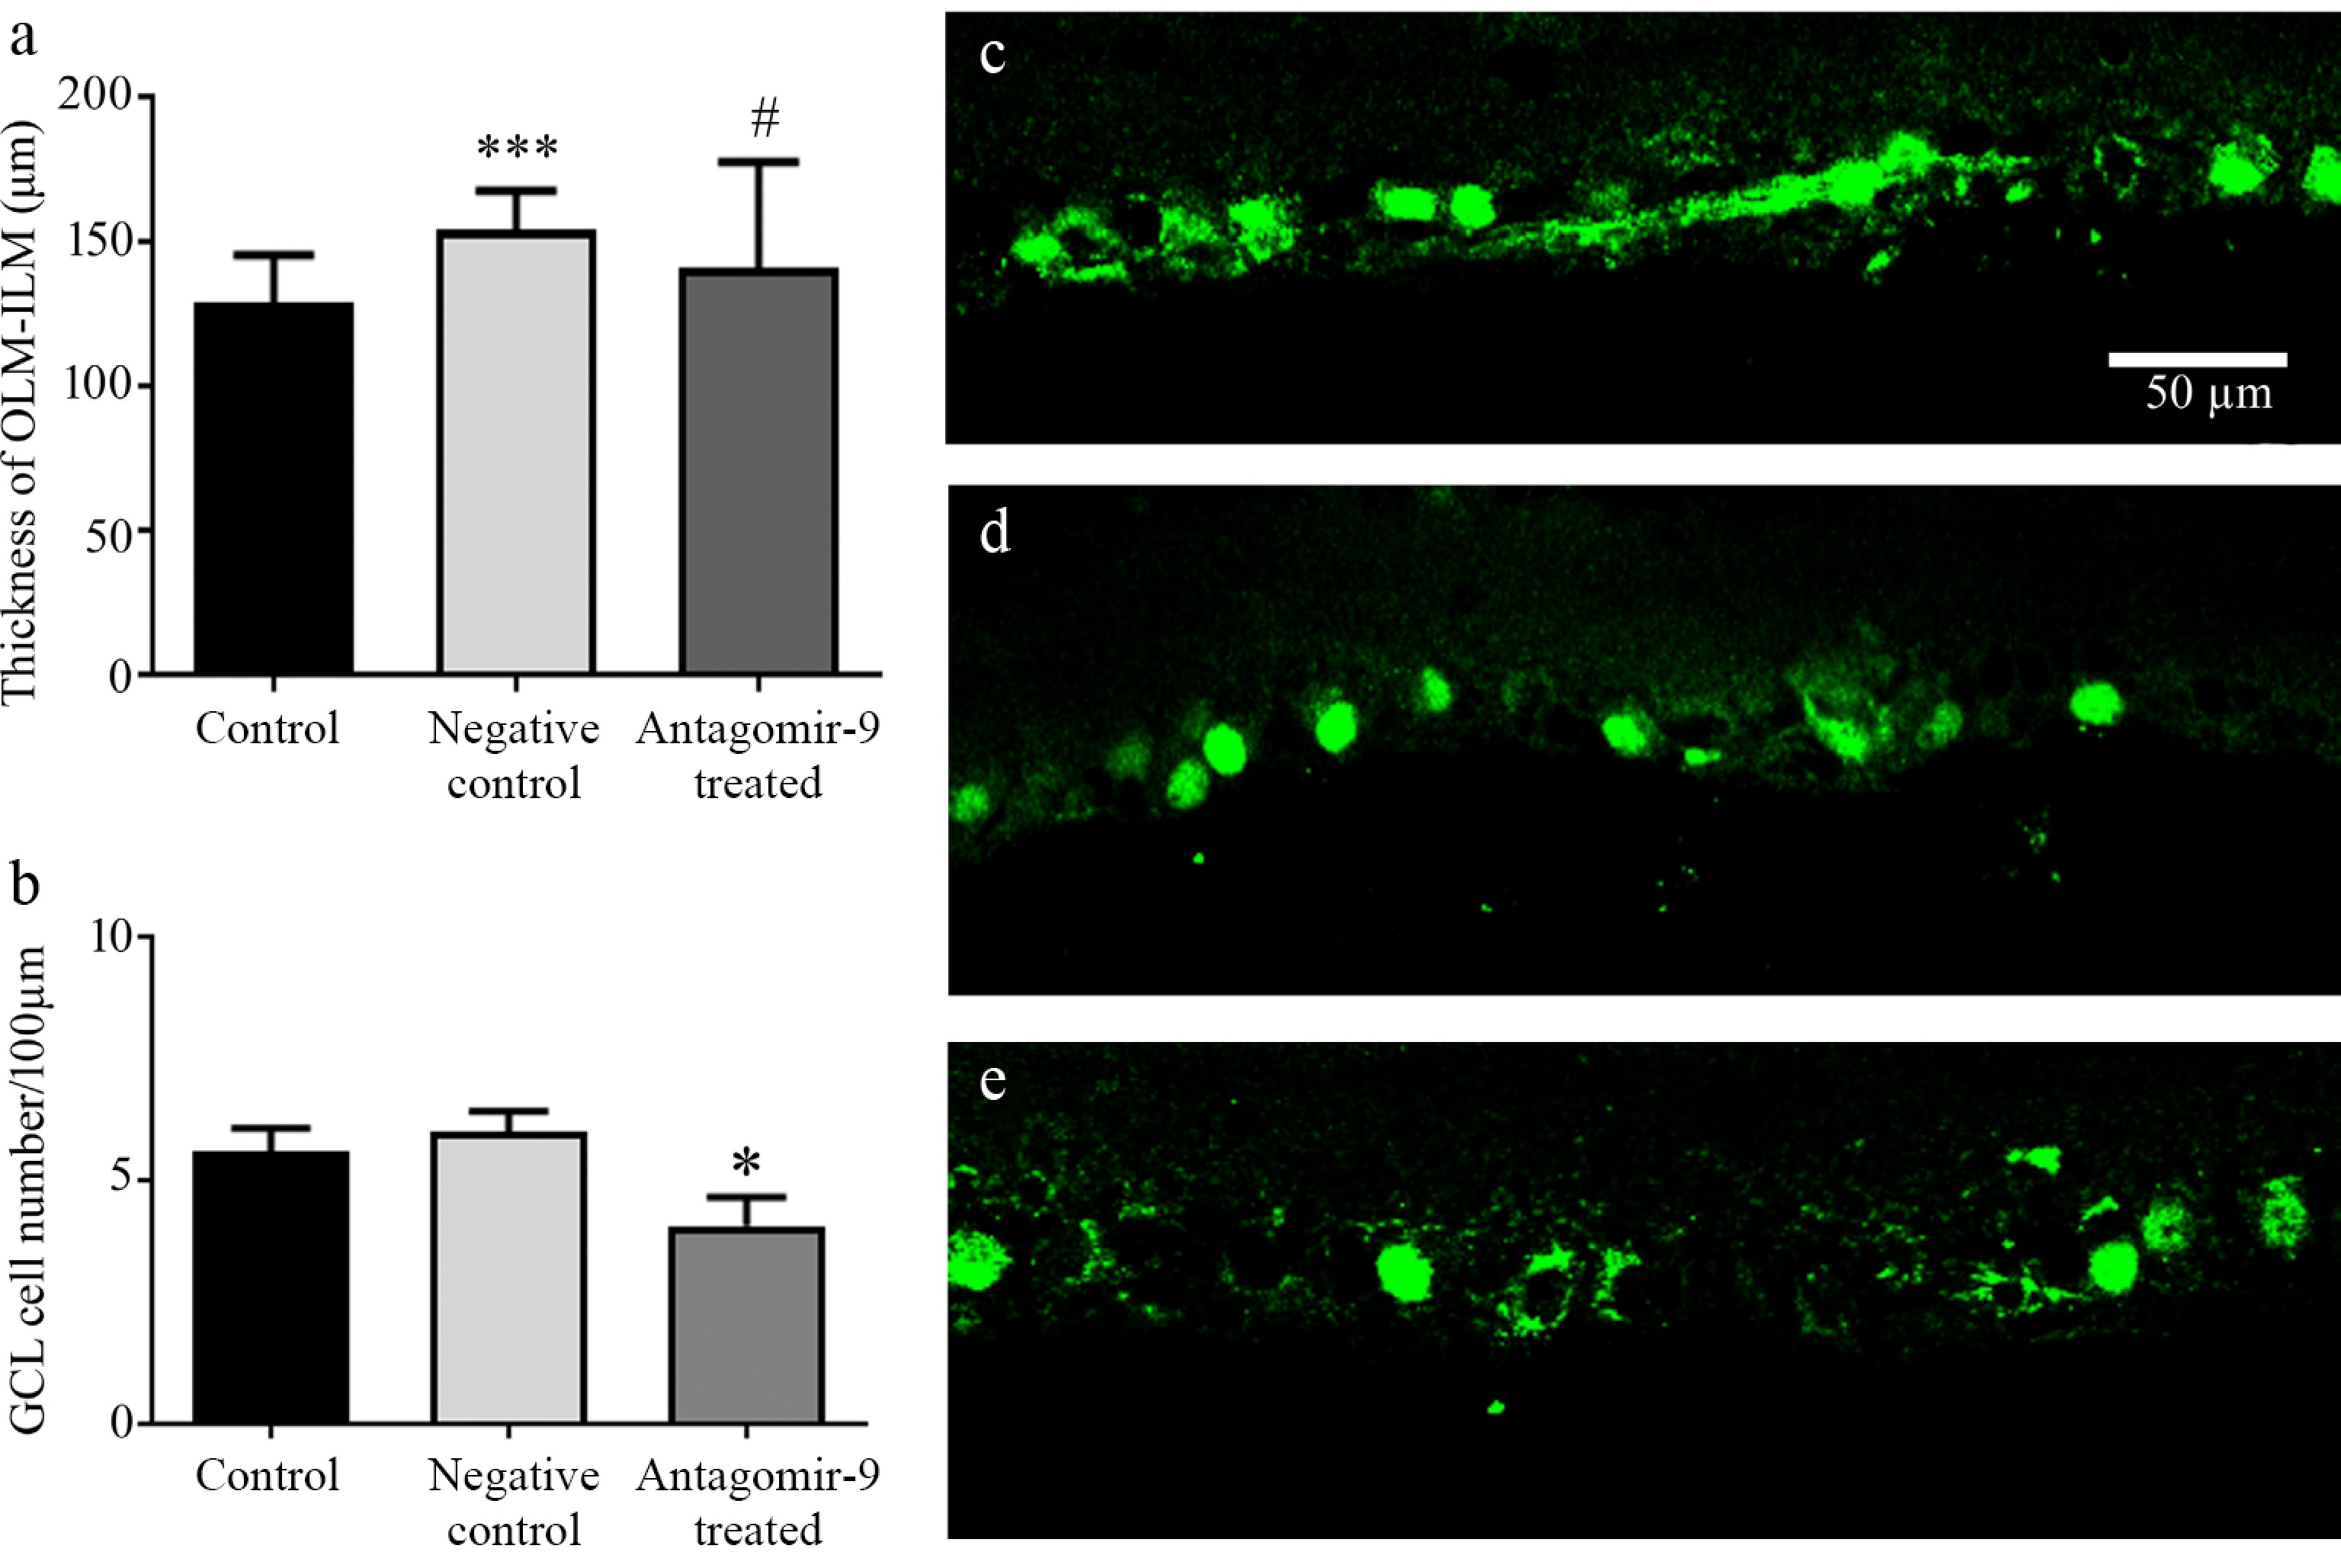
Figure 2.
(a) Retinal thickness and (b) ganglion cell number in different groups. Brn3a positive ganglion cells in rat retinas after different treatments: (c) non-treated control group; (d) negative control group; and (e) antagomir-9 treated group. Data are presented as mean ± SD, where * compared to control, # compared to negative control * or # indicate p < 0.05; and *** indicates p < 0.001. Statistical analysis was performed with n = 4 animals per group (biological replicates), counting 10 non-overlapping microscopy frames per eye. Normality of data was assessed by D'Agostino–Pearson, Shapiro–Wilk, and Kolmogorov–Smirnov tests. Group differences were analyzed using one-way ANOVA followed by Bonferroni's post hoc test. OLM, outer limiting membrane; ILM, inner limiting membrane; GCL, ganglion cell layer. Scale bars represent 50 µm.
-
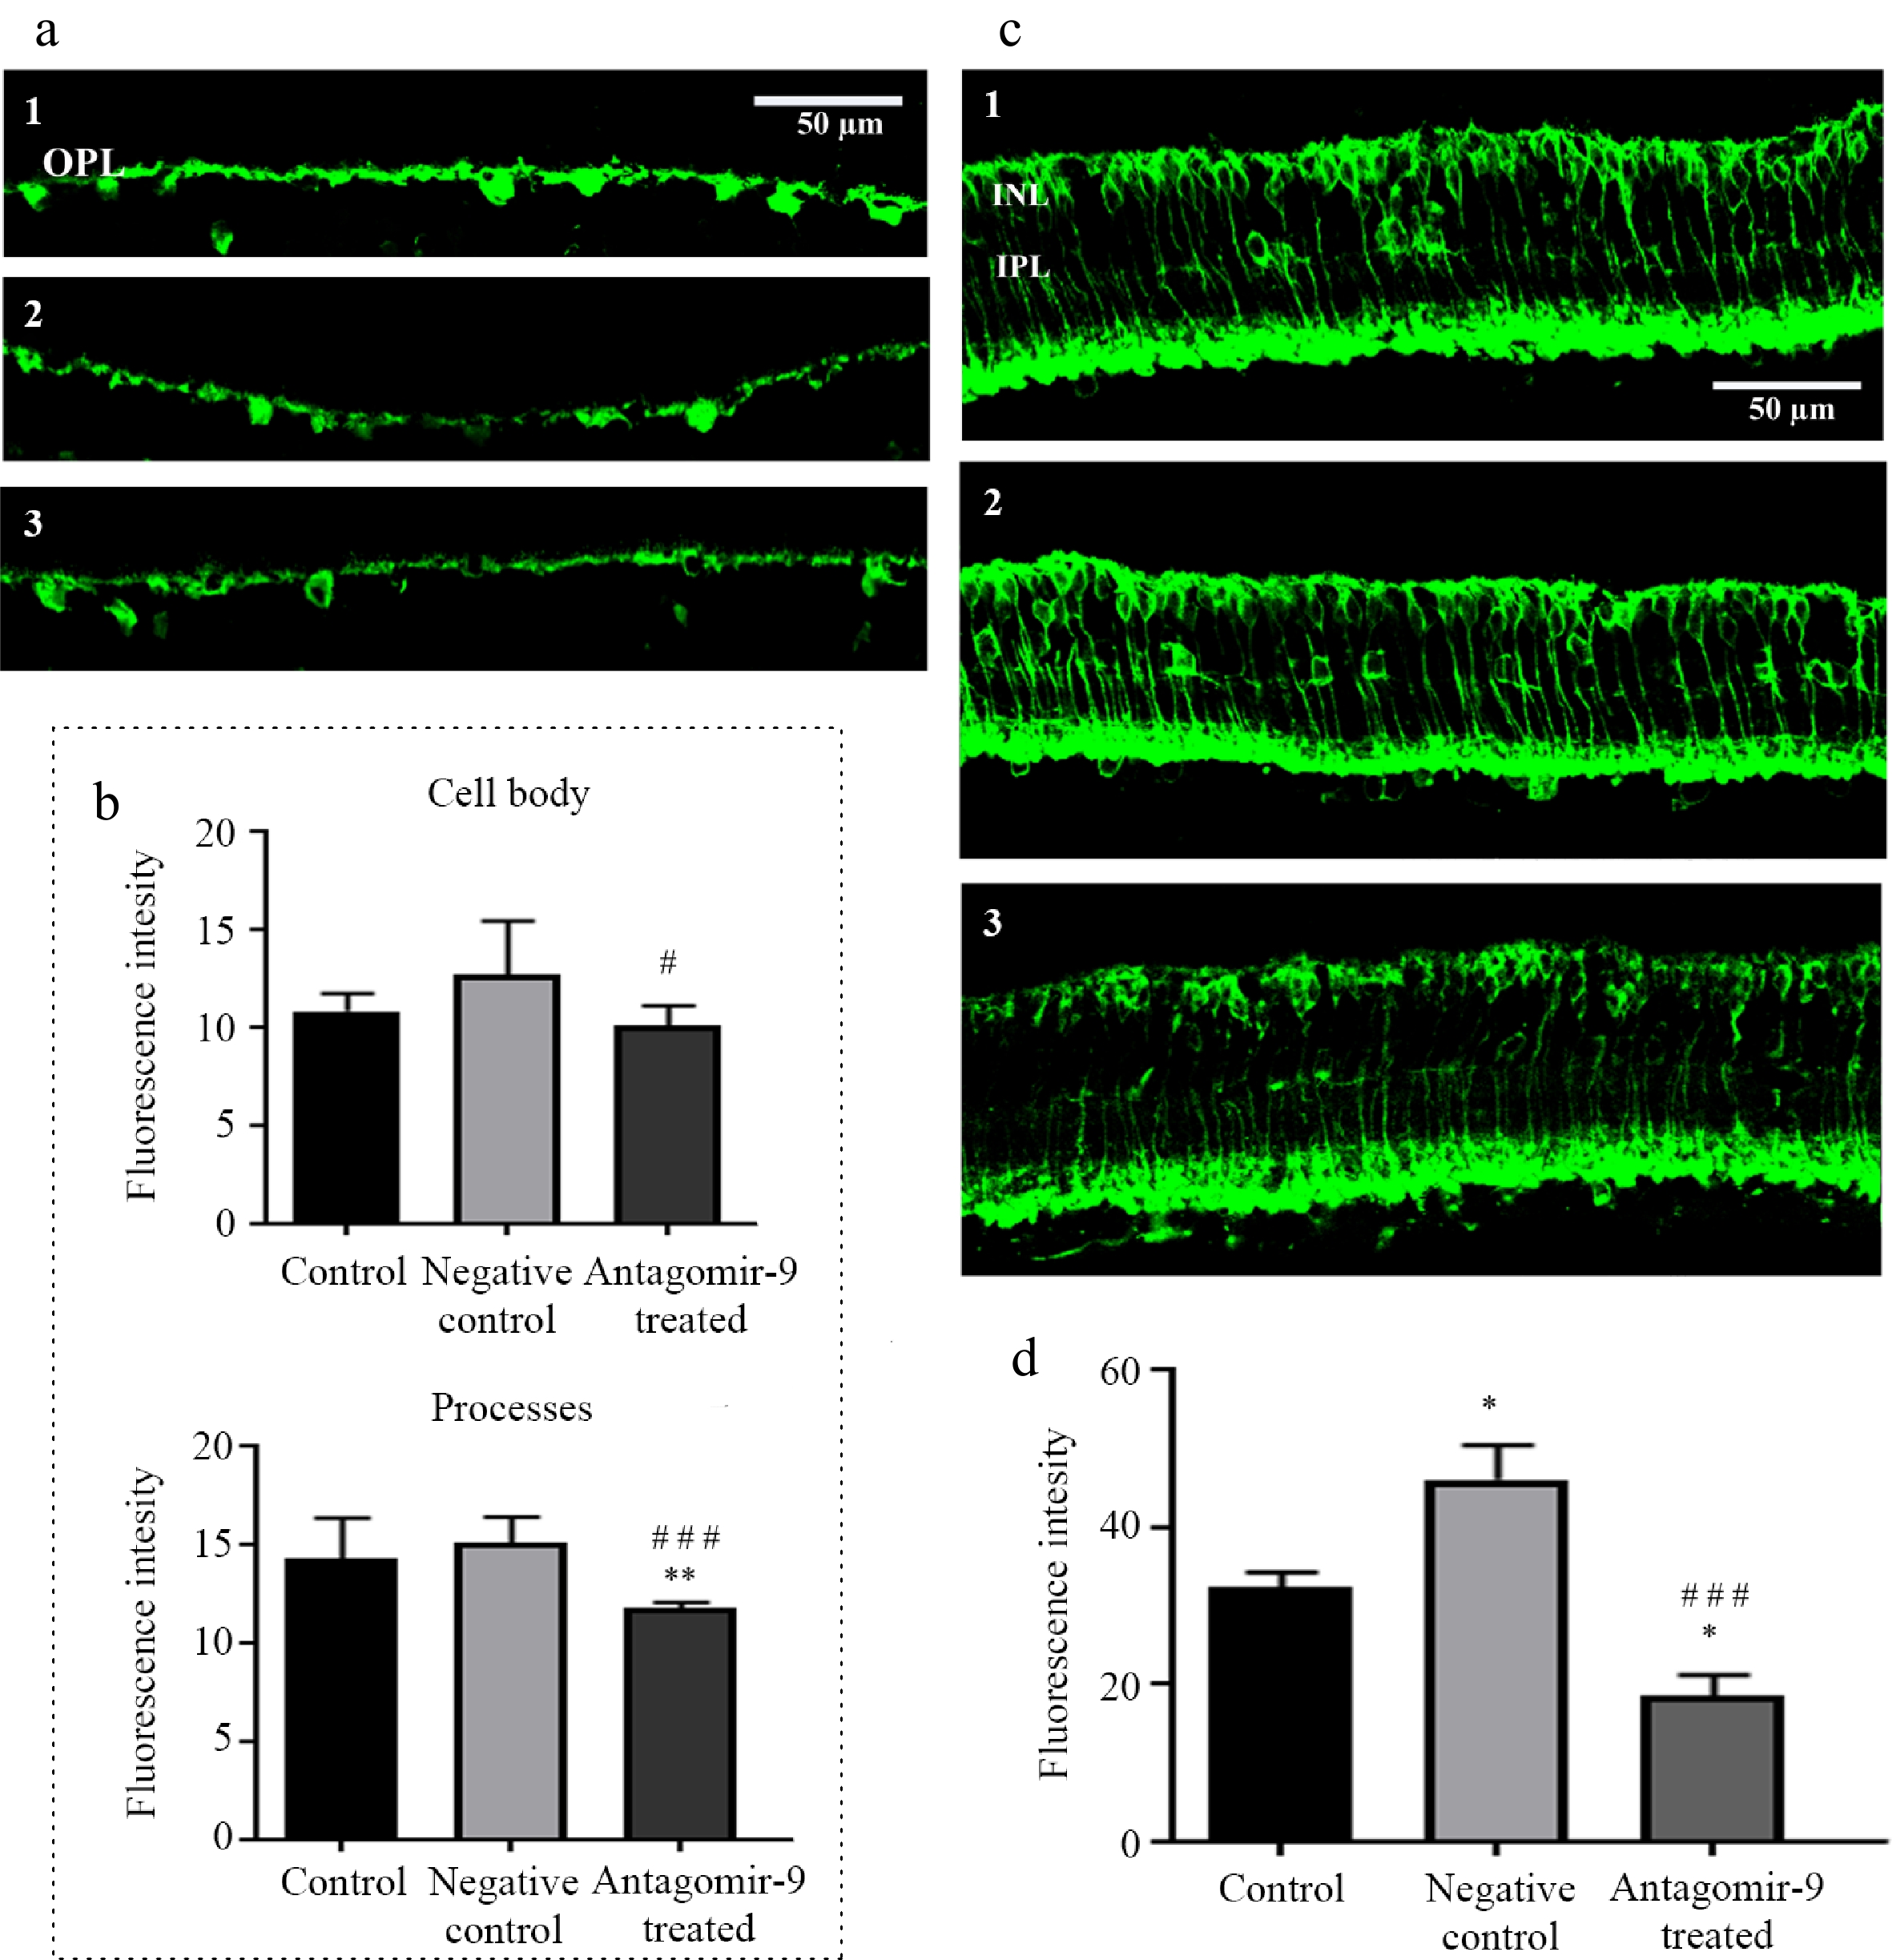
Figure 3.
Calbindin and PKCα expression in horizontal and rod bipolar cells after different treatments. (a) Representative retina sections stained for calbindin. (b) Quantification of calbindin immunofluorescence intensity in horizontal cell bodies and their processes in the outer plexiform layer (OPL). (c) Representative PKCΑα immunostaining in rod bipolar cells across the three experimental groups, showing reduced labeling of the cell bodies in the inner nuclear layer (INL) after antagomir-9 treatment, while terminals in the inner plexiform layer (IPL) remain relatively preserved. (d) Quantification of PKCα immunofluorescence intensity in rod bipolar cell bodies. For all quantifications, n = 4 animals per group (biological replicates); for each retina, values were obtained from 10 non-overlapping fields in the central retina. Data are presented as mean ± SD. Group differences were analyzed with the Kruskal–Wallis test followed by Dunn's multiple-comparison test. rat retina. * Compared to control; # compared to negative control; * indicates p < 0.05 and ### indicates p < 0.001. The numbers indicate the following conditions: (1) non-treated control group; (2) negative control group; and (3) antagomir-9 treated group. Abbreviations: outer plexiform layer (OPL), inner plexiform layer (IPL); and inner nuclear layer (INL). Scale bar represents 50 µm.
-
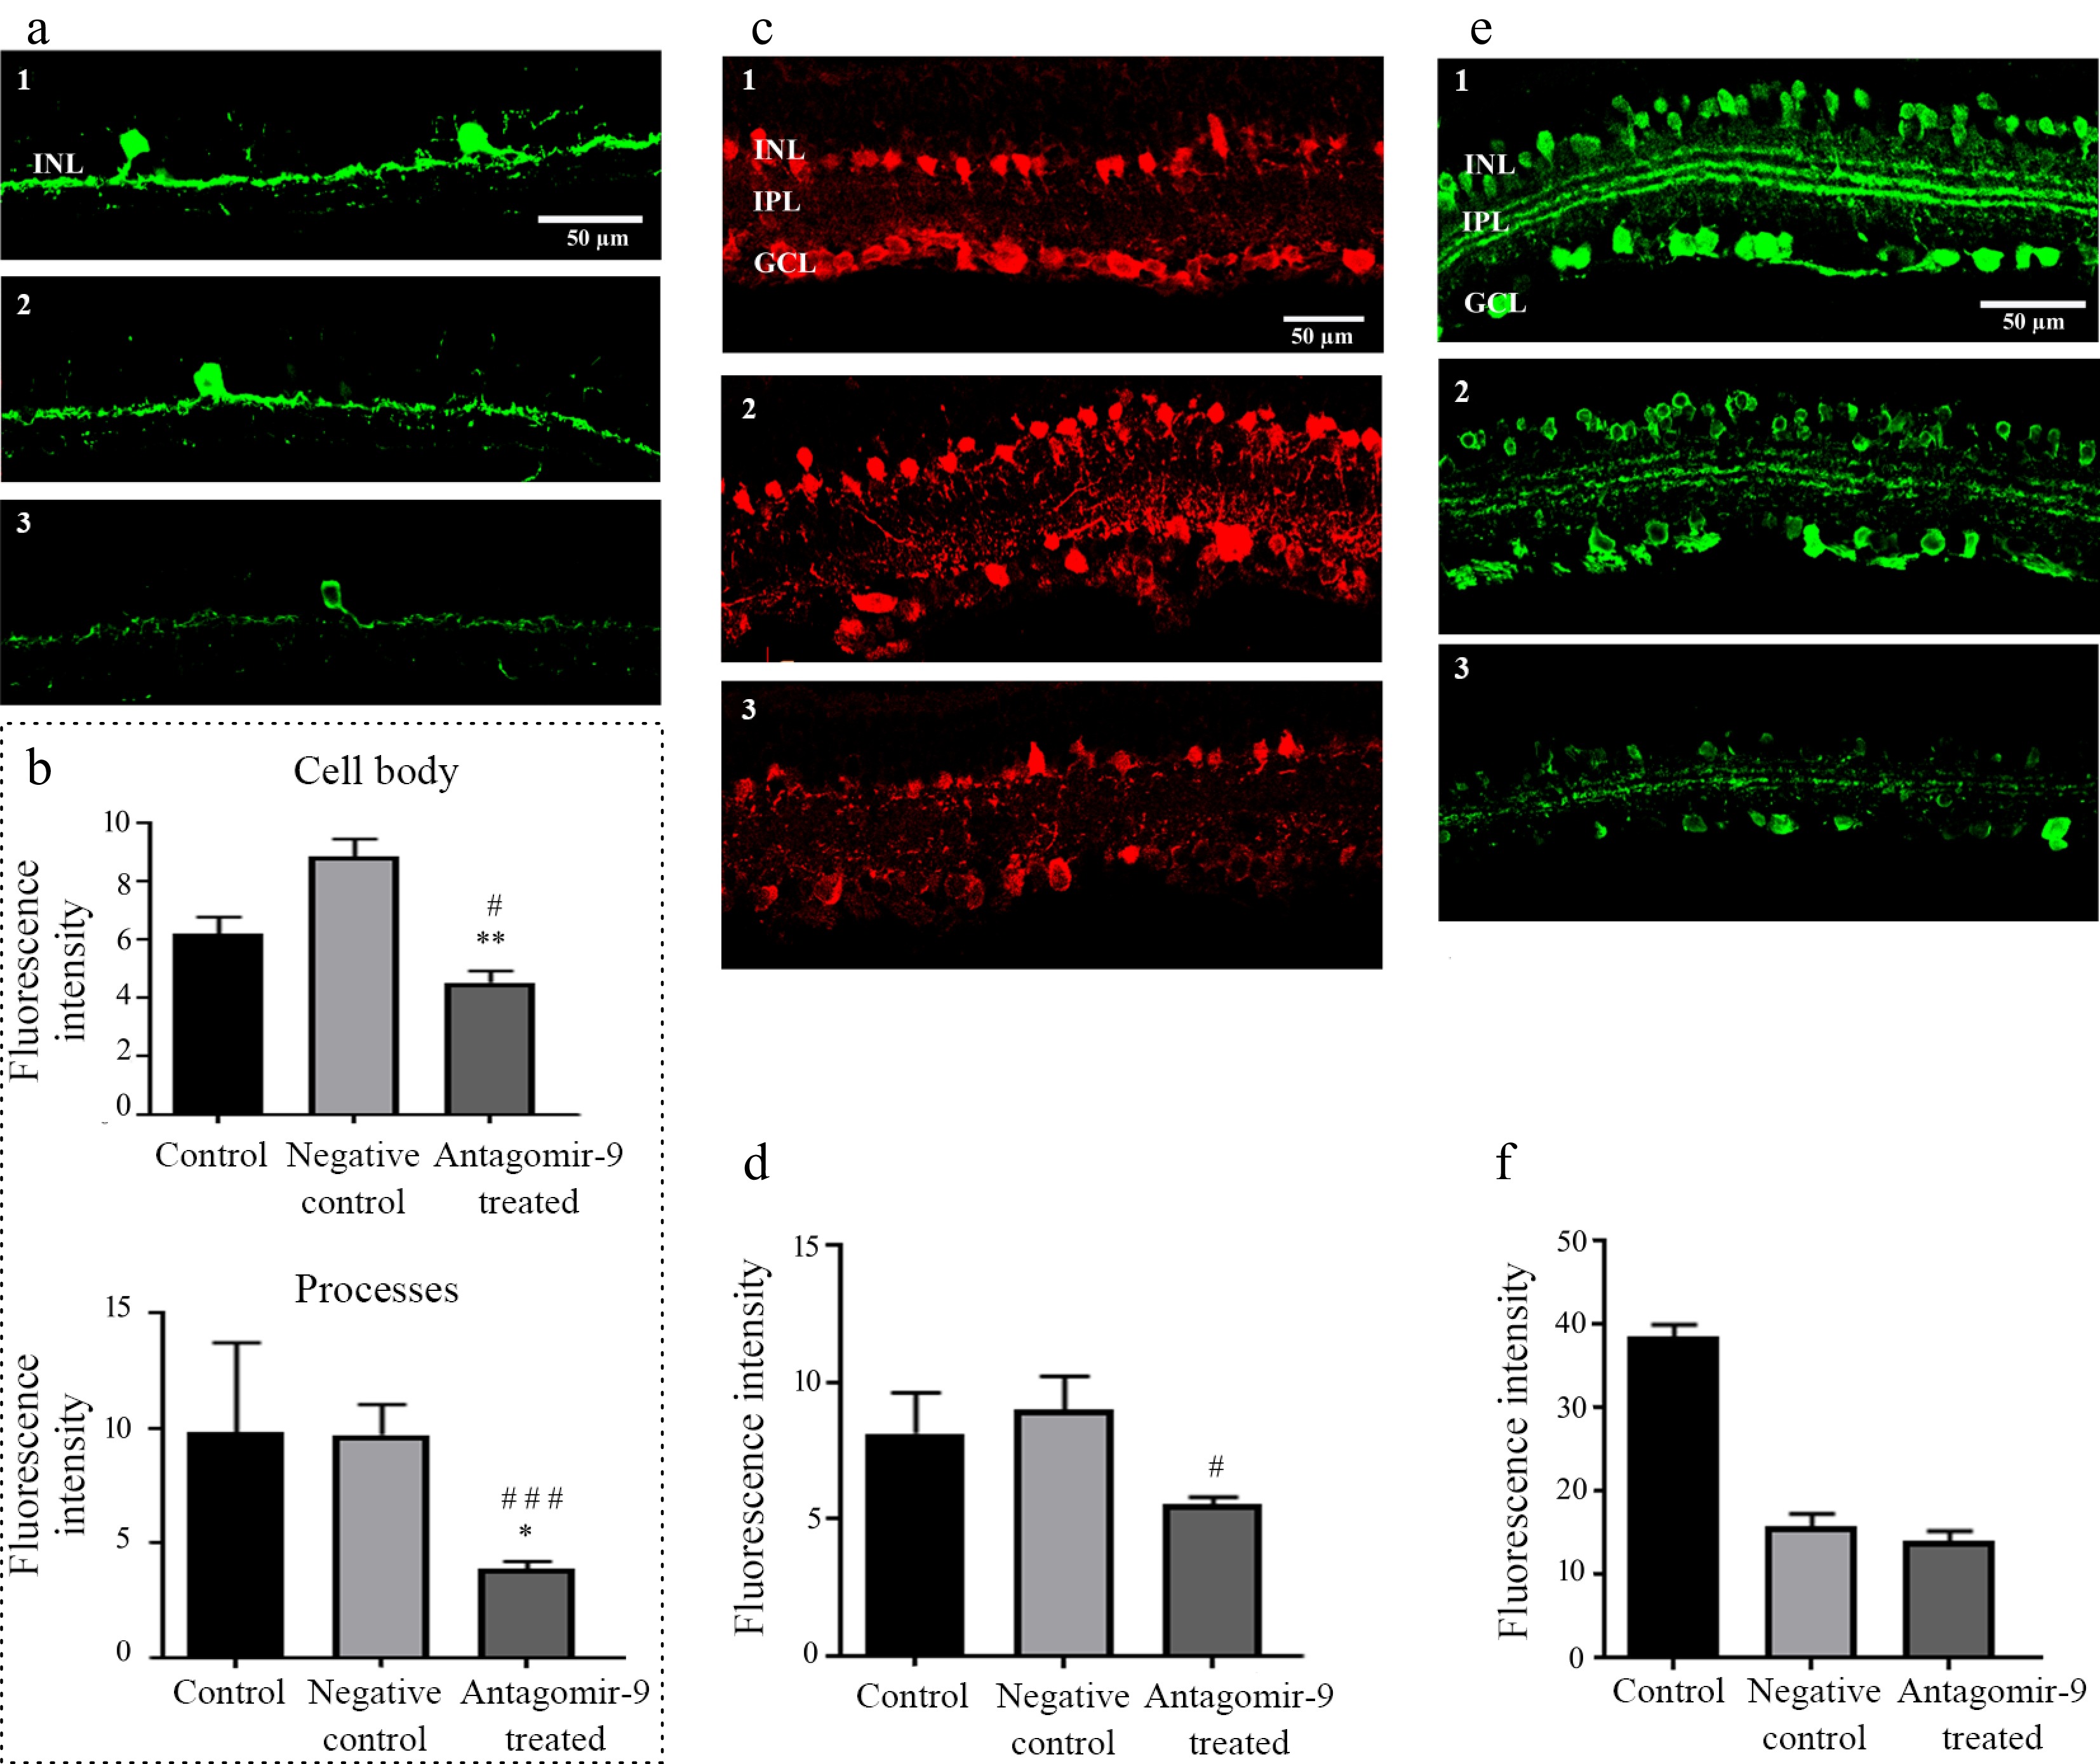
Figure 4.
Amacrine and inner retinal markers after different treatments. (a) Representative retina sections stained with tyrosine hydroxylase (TH) immunostaining. (b) Quantification of TH immunofluorescence intensity in retinal processes and cell bodies. (c) Representative parvalbumin immunostaining, illustrating loss of parvalbumin-positive somata in the ganglion cell layer and weaker labelling in amacrine cells after treatment. (d) Quantification of parvalbumin immunofluorescence intensity. (e) Representative calretinin immunostaining, showing reduced labelling of amacrine cell bodies and their processes in the inner plexiform layer (IPL) following antagomir-9 treatment. (f) Quantification of calretinin immunofluorescence intensity. For all quantifications, n = 4 animals per group (biological replicates); for each retina, values were obtained from 10 non-overlapping fields in the central retina. Data are presented as mean ± SD. Normality was tested using D'Agostino–Pearson, Shapiro–Wilk and Kolmogorov–Smirnov tests; group differences were analyzed with Kruskal–Wallis test followed by Dunn's multiple-comparison test. * Compared to control, ** indicates p < 0.01. The numbers indicate the following conditions: (1) non-treated control, (2) negative control, (3) antagomir-9-treated group. Abbreviations: inner nuclear layer (INL), inner plexiform layer (IPL), and ganglion cell layer (GCL). Scale bar represents 50 µm.
-
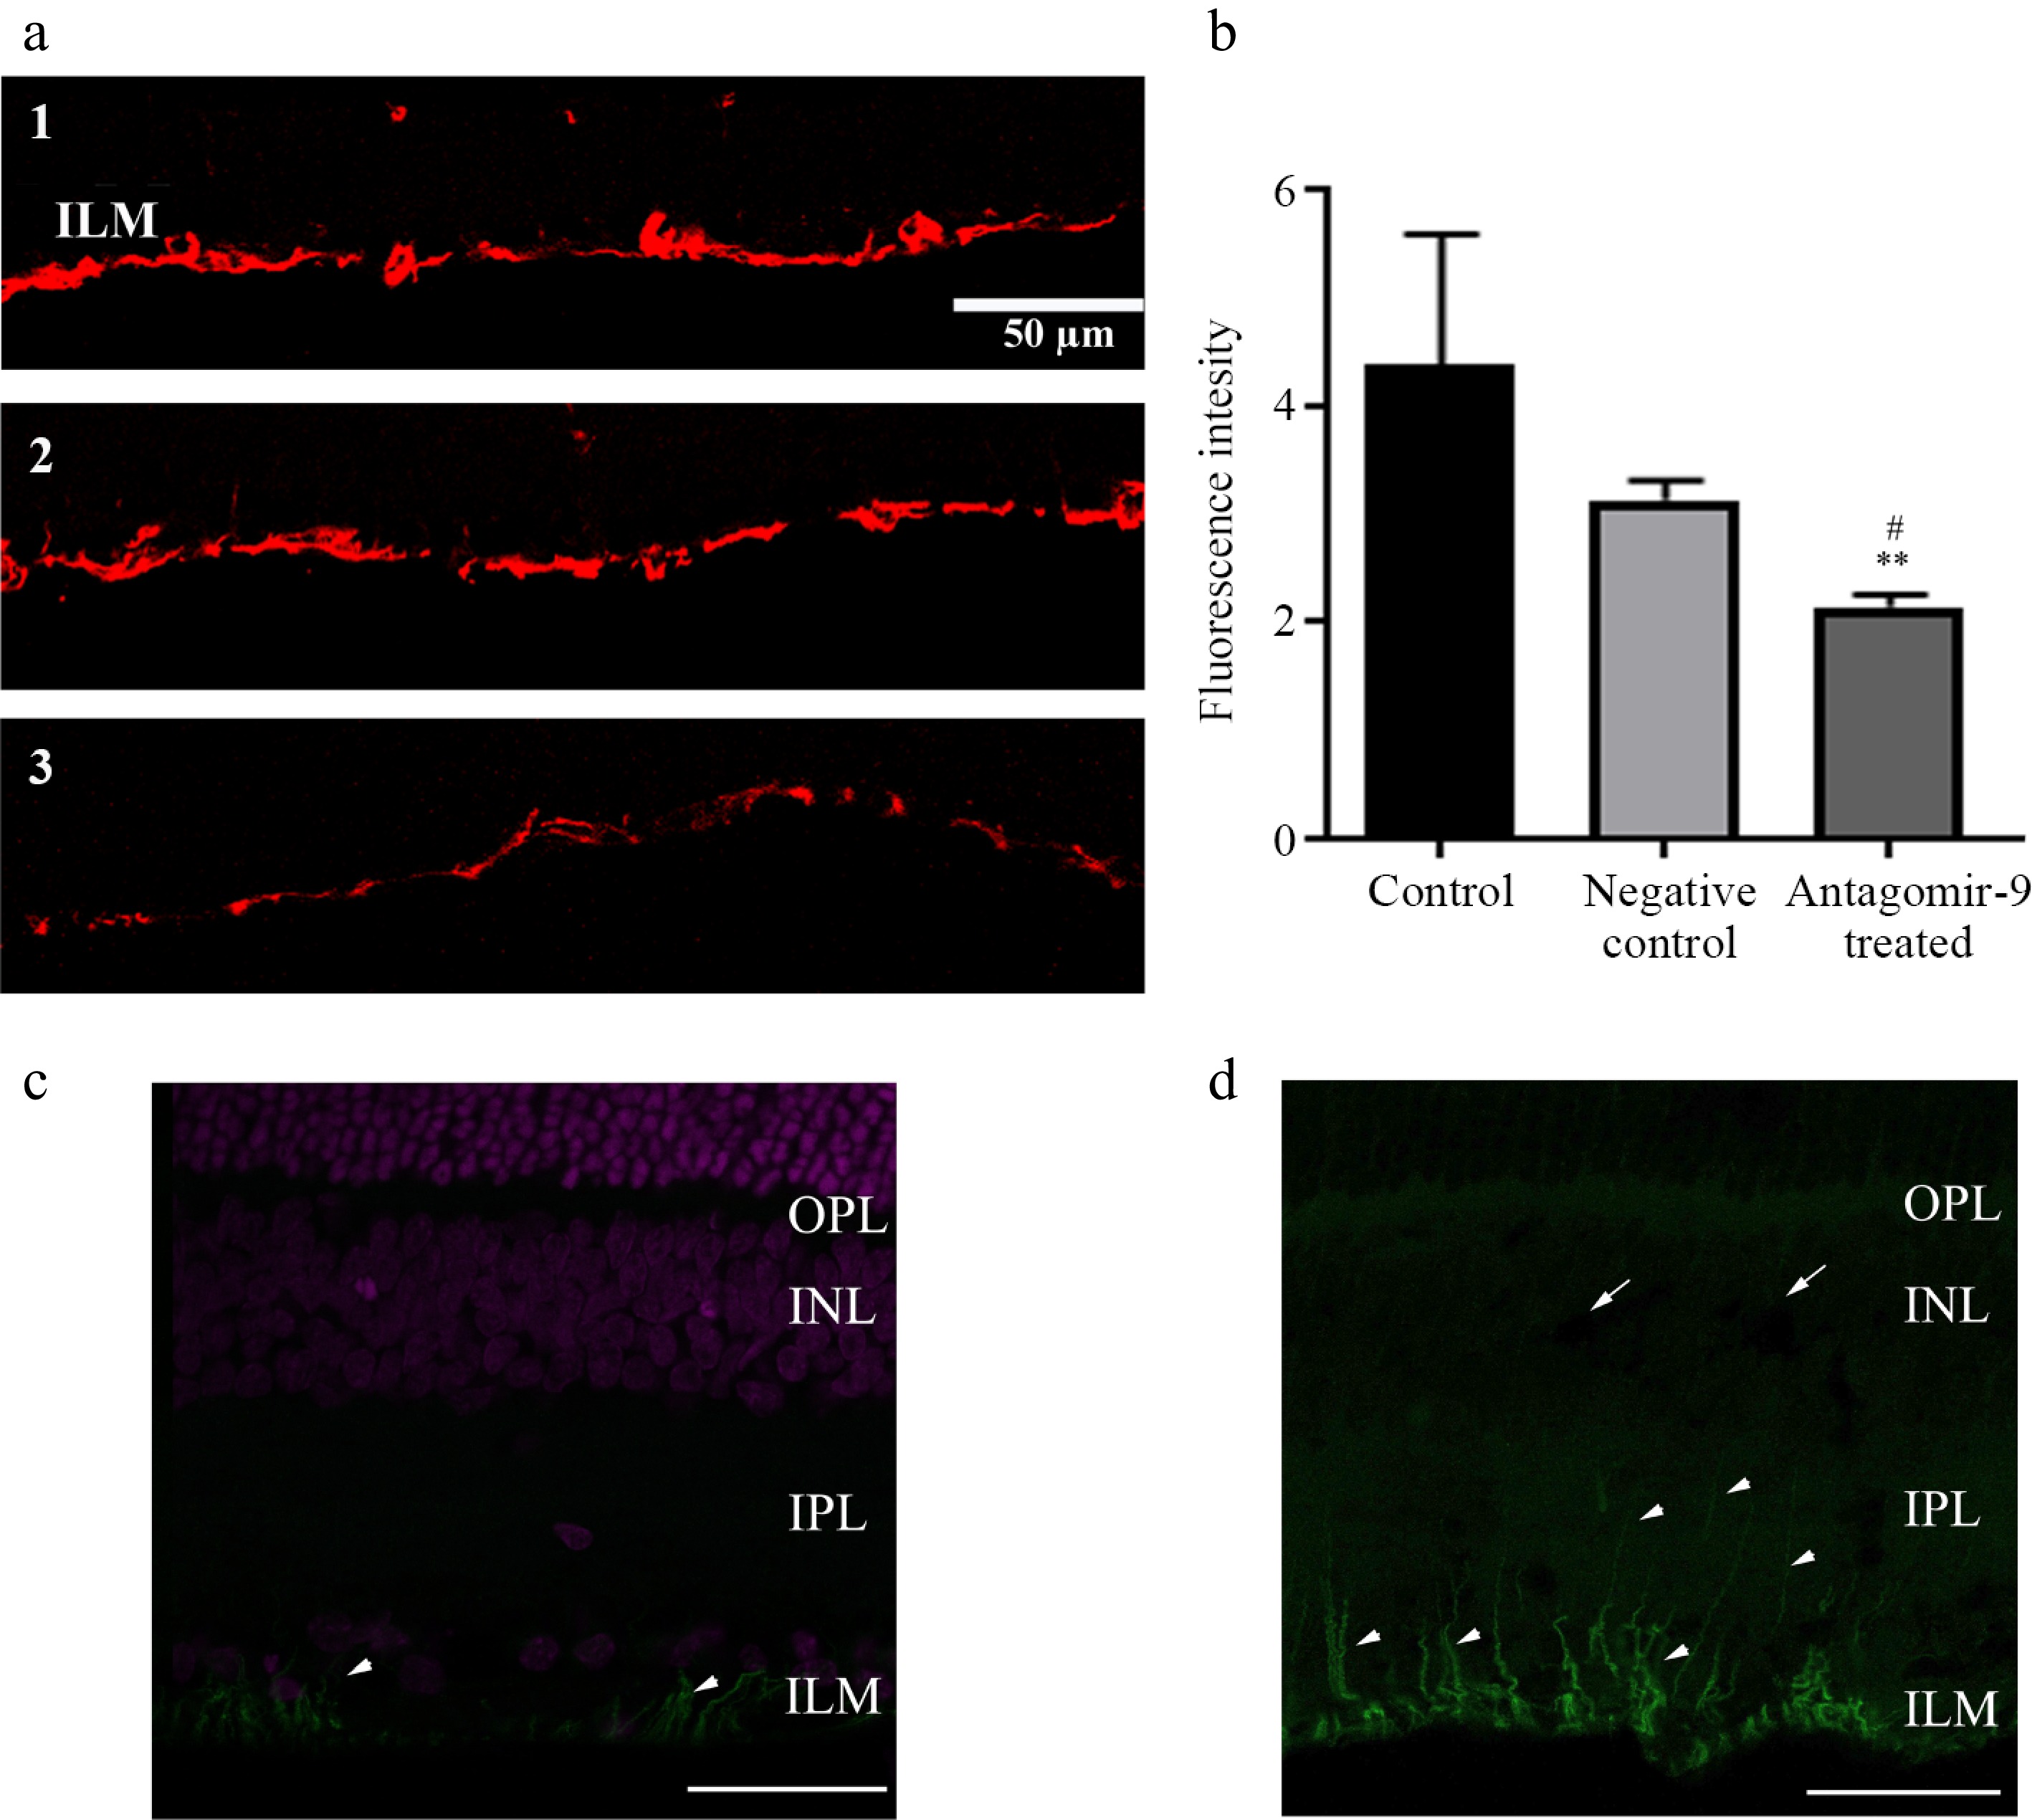
Figure 5.
GFAP immunolabeling and OneCut2 expression in rat retina. (a) GFAP immunostaining retinal sections from different experimental conditions: (1) non-treated control group, (2) negative control group, (3) antagomir-9-treated group. (b) Quantification of GFAP fluorescence intensity in the different experimental groups (n = 4 animals per group; 10 non-overlapping fields per retina in the central region). Normality was tested (D'Agostino–Pearson, Shapiro–Wilk, Kolmogorov–Smirnov); group differences were analyzed with non-parametric Kruskal–Wallis followed by Dunn's multiple comparison test. * Compared to control, # compared to negative control; ** indicates p < 0.01, # indicates p < 0.05. Representative OneCut2 immunostaining in (c) non-treated control, and (d) antagomir-9 treated retinas. In (c), the immunoreaction appeared around the blood vessels in the nerve fiber layer (arrowheads) reaching up to the level of ganglion cell somas. In (d), immunoreactive fibers extended into the IPL (arrowheads), and immunoreactivity was observed around blood vessels in the OPL (arrows). Abbreviations: inner nuclear layer (INL), inner plexiform layer (IPL), inner limiting membrane (ILM). Scale bar represents 50 µm.
-
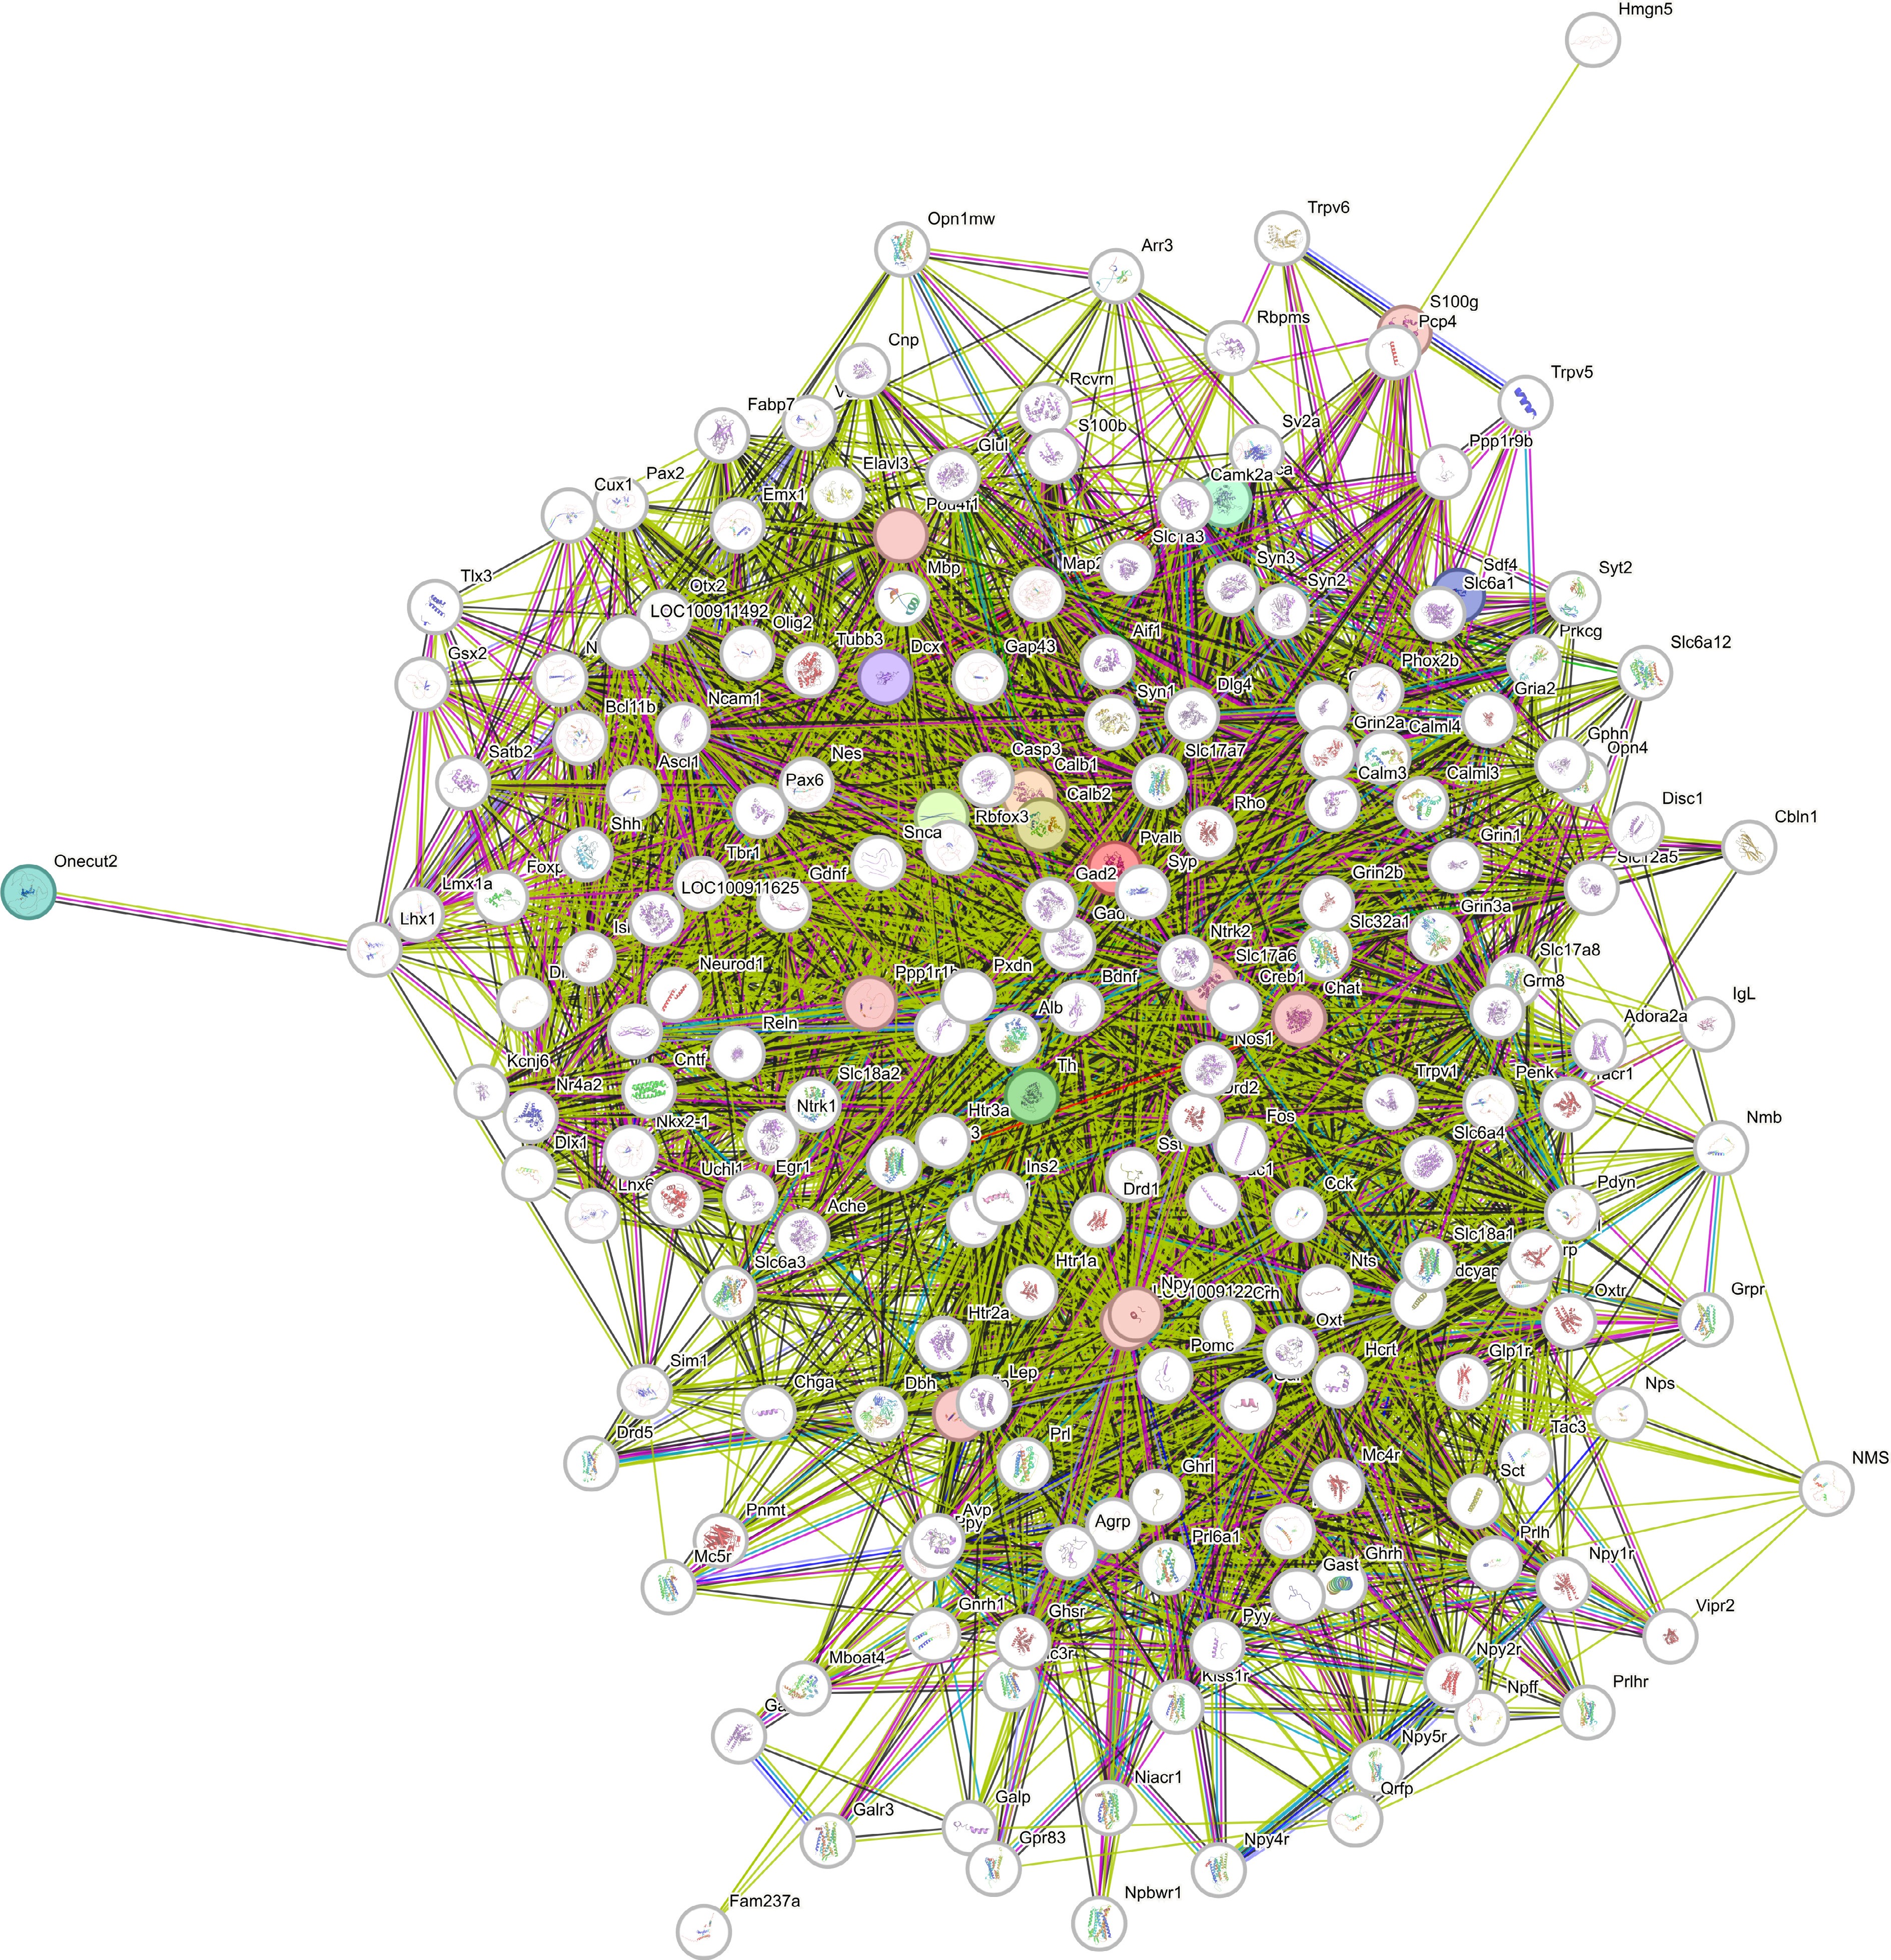
Figure 6.
STRING protein–protein interaction network of key retinal marker proteins. The network shows the interactions between major retinal markers (GFAP, PKCα/Prkca, calbindin/Calb1, calretinin/Calb2, parvalbumin/Parval, tyrosine hydroxylase/Th) and the transcription factor OneCut2 (OC-2), which is a validated, conserved direct target of miR-9 as demonstrated in both of our prior study[11] and independent experimental evidence in the literature (TargetScan 2024.07.04). This network visually underscores the central role and regulatory relationship of miR-9 via OneCut2 in postnatal retinal signaling, affecting complex, interconnected retinal networks.
Figures
(6)
Tables
(0)