-
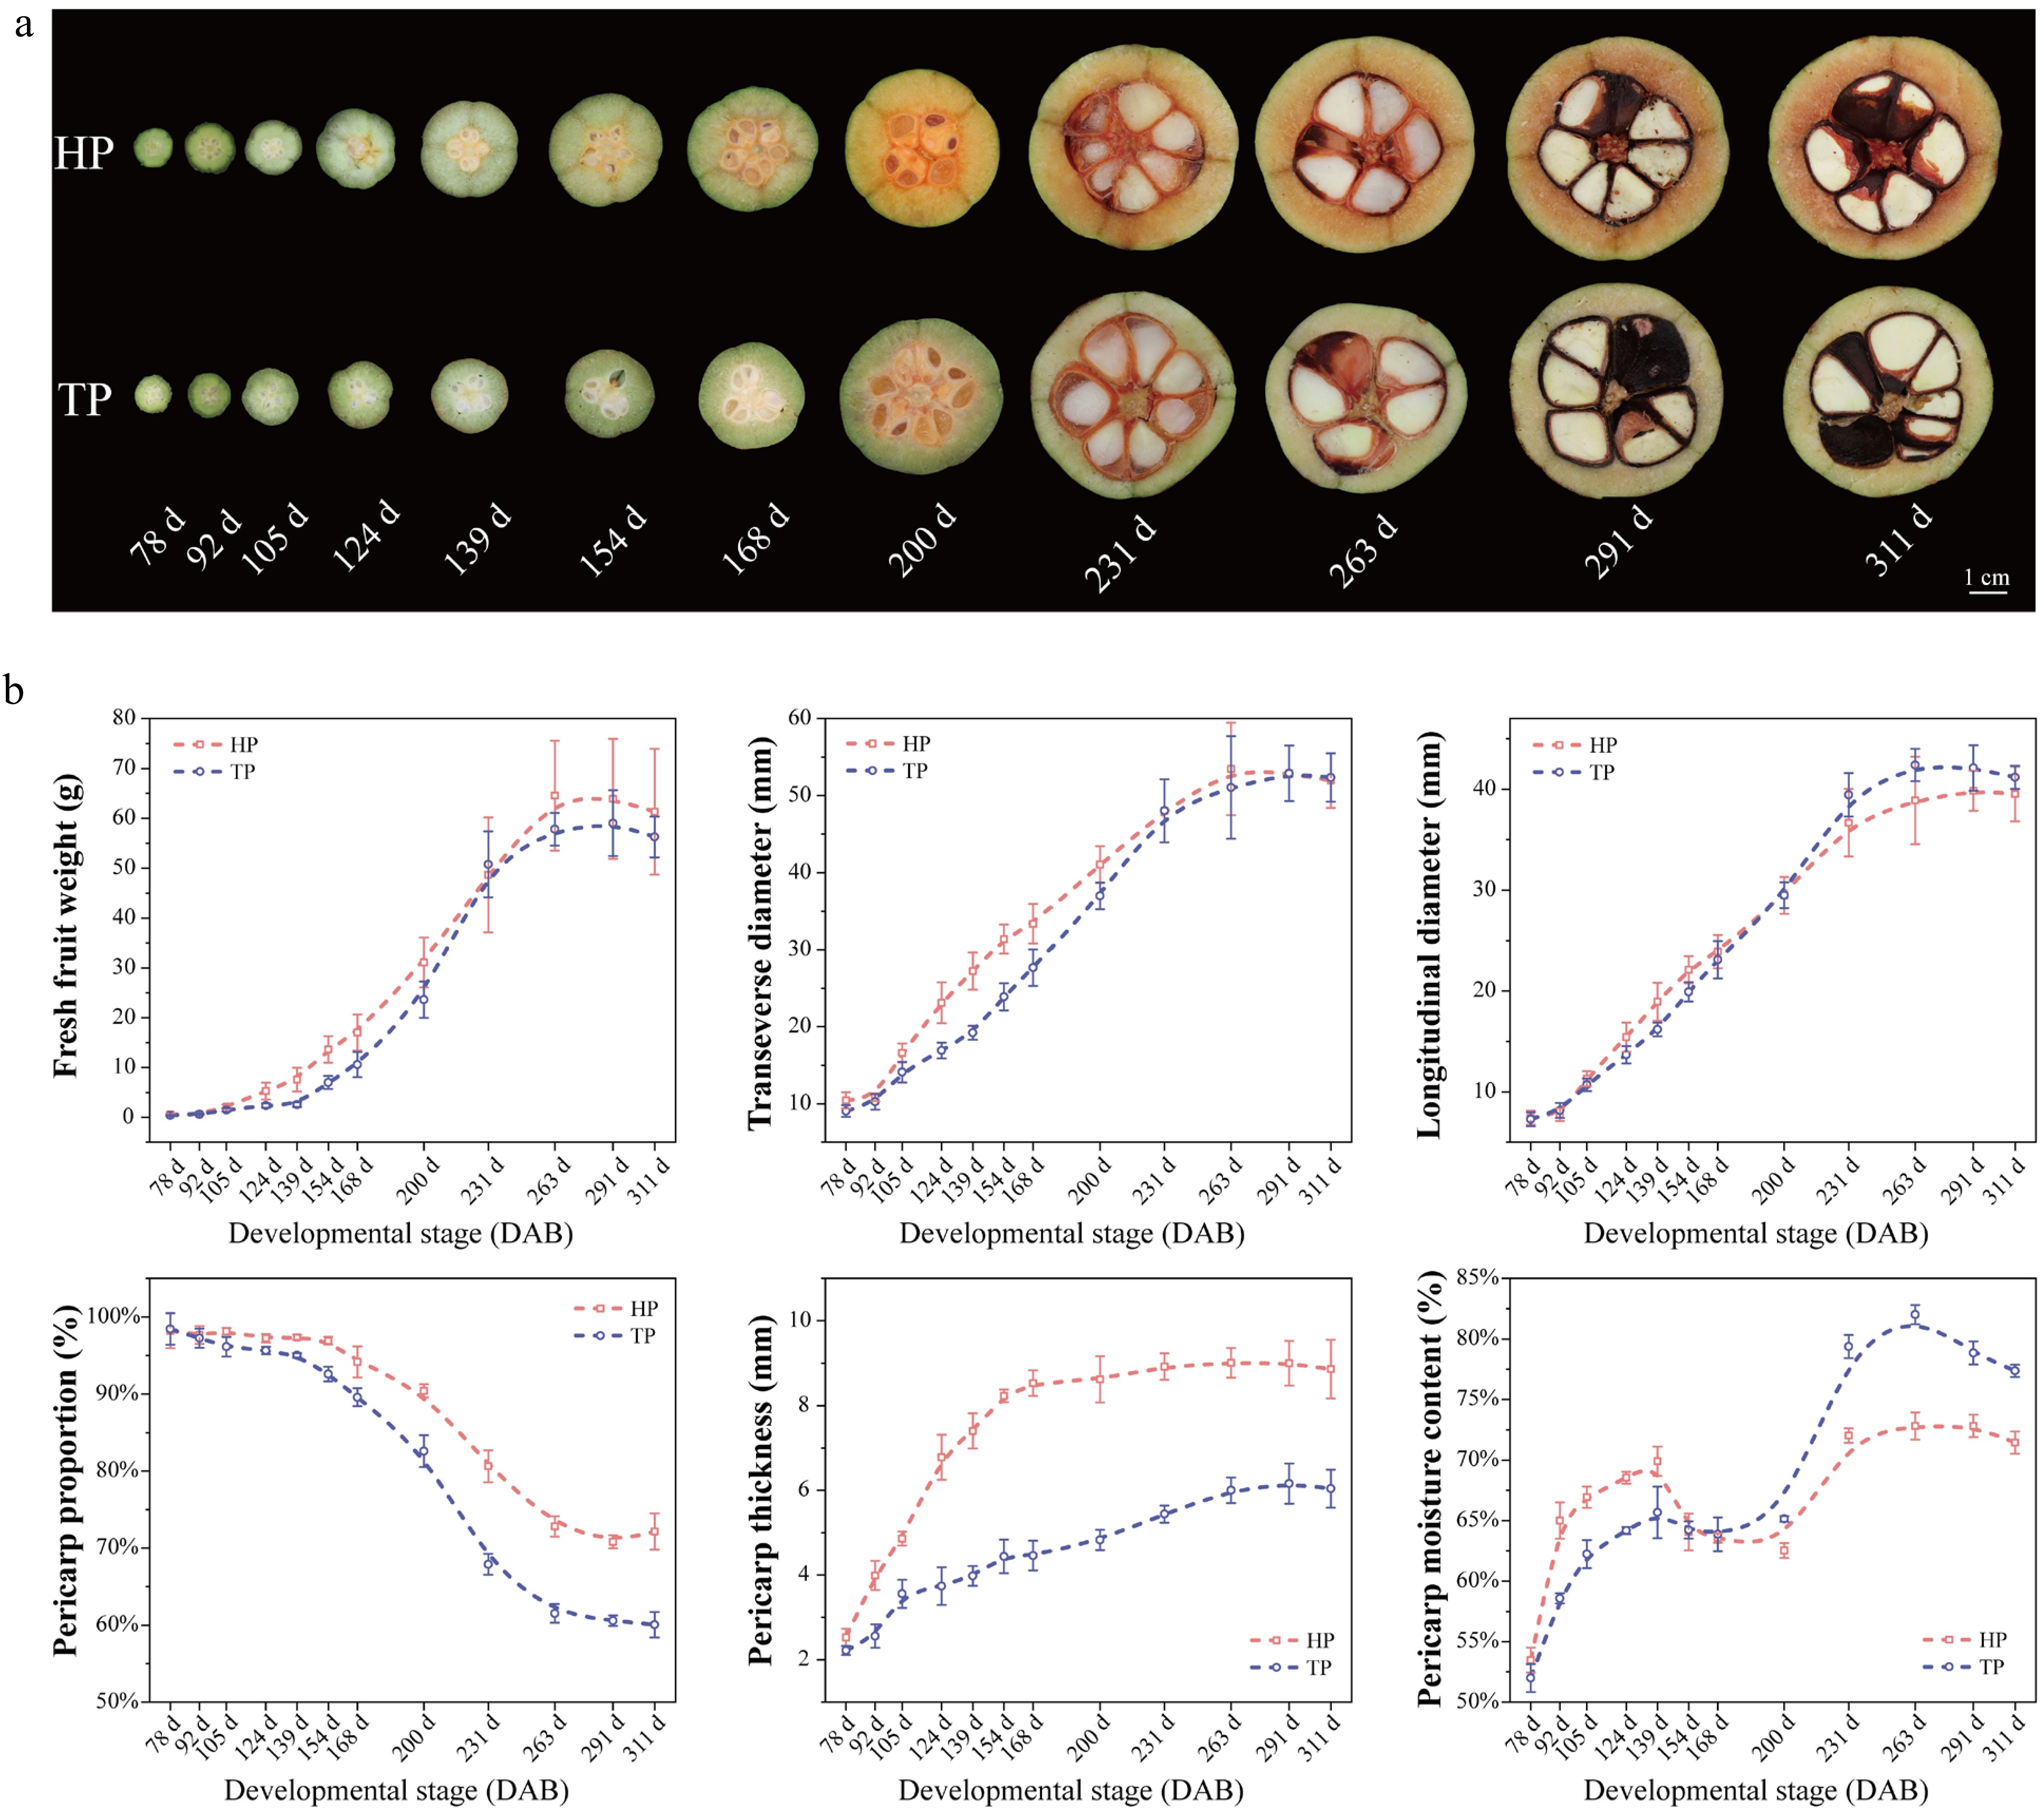
Figure 1.
Morphological characteristics and dynamic changes in the phenotypic traits of HP and TP fruits during development. (a) Representative transverse sections of HP and TP fruits at different developmental stages (78, 92, 105, 124, 139, 154, 168, 200, 231, 263, 291, and 311 d). The HP fruits consistently exhibited a markedly thicker pericarp throughout development. (b) Dynamic changes in the main phenotypic traits of HP and TP fruits during development, including fresh fruit weight (g), transverse diameter (mm), pericarp moisture content (%), proportion of pericarp (%), pericarp thickness (mm), and longitudinal diameter (mm). Data represent the mean ± SD of three biological replicates.
-
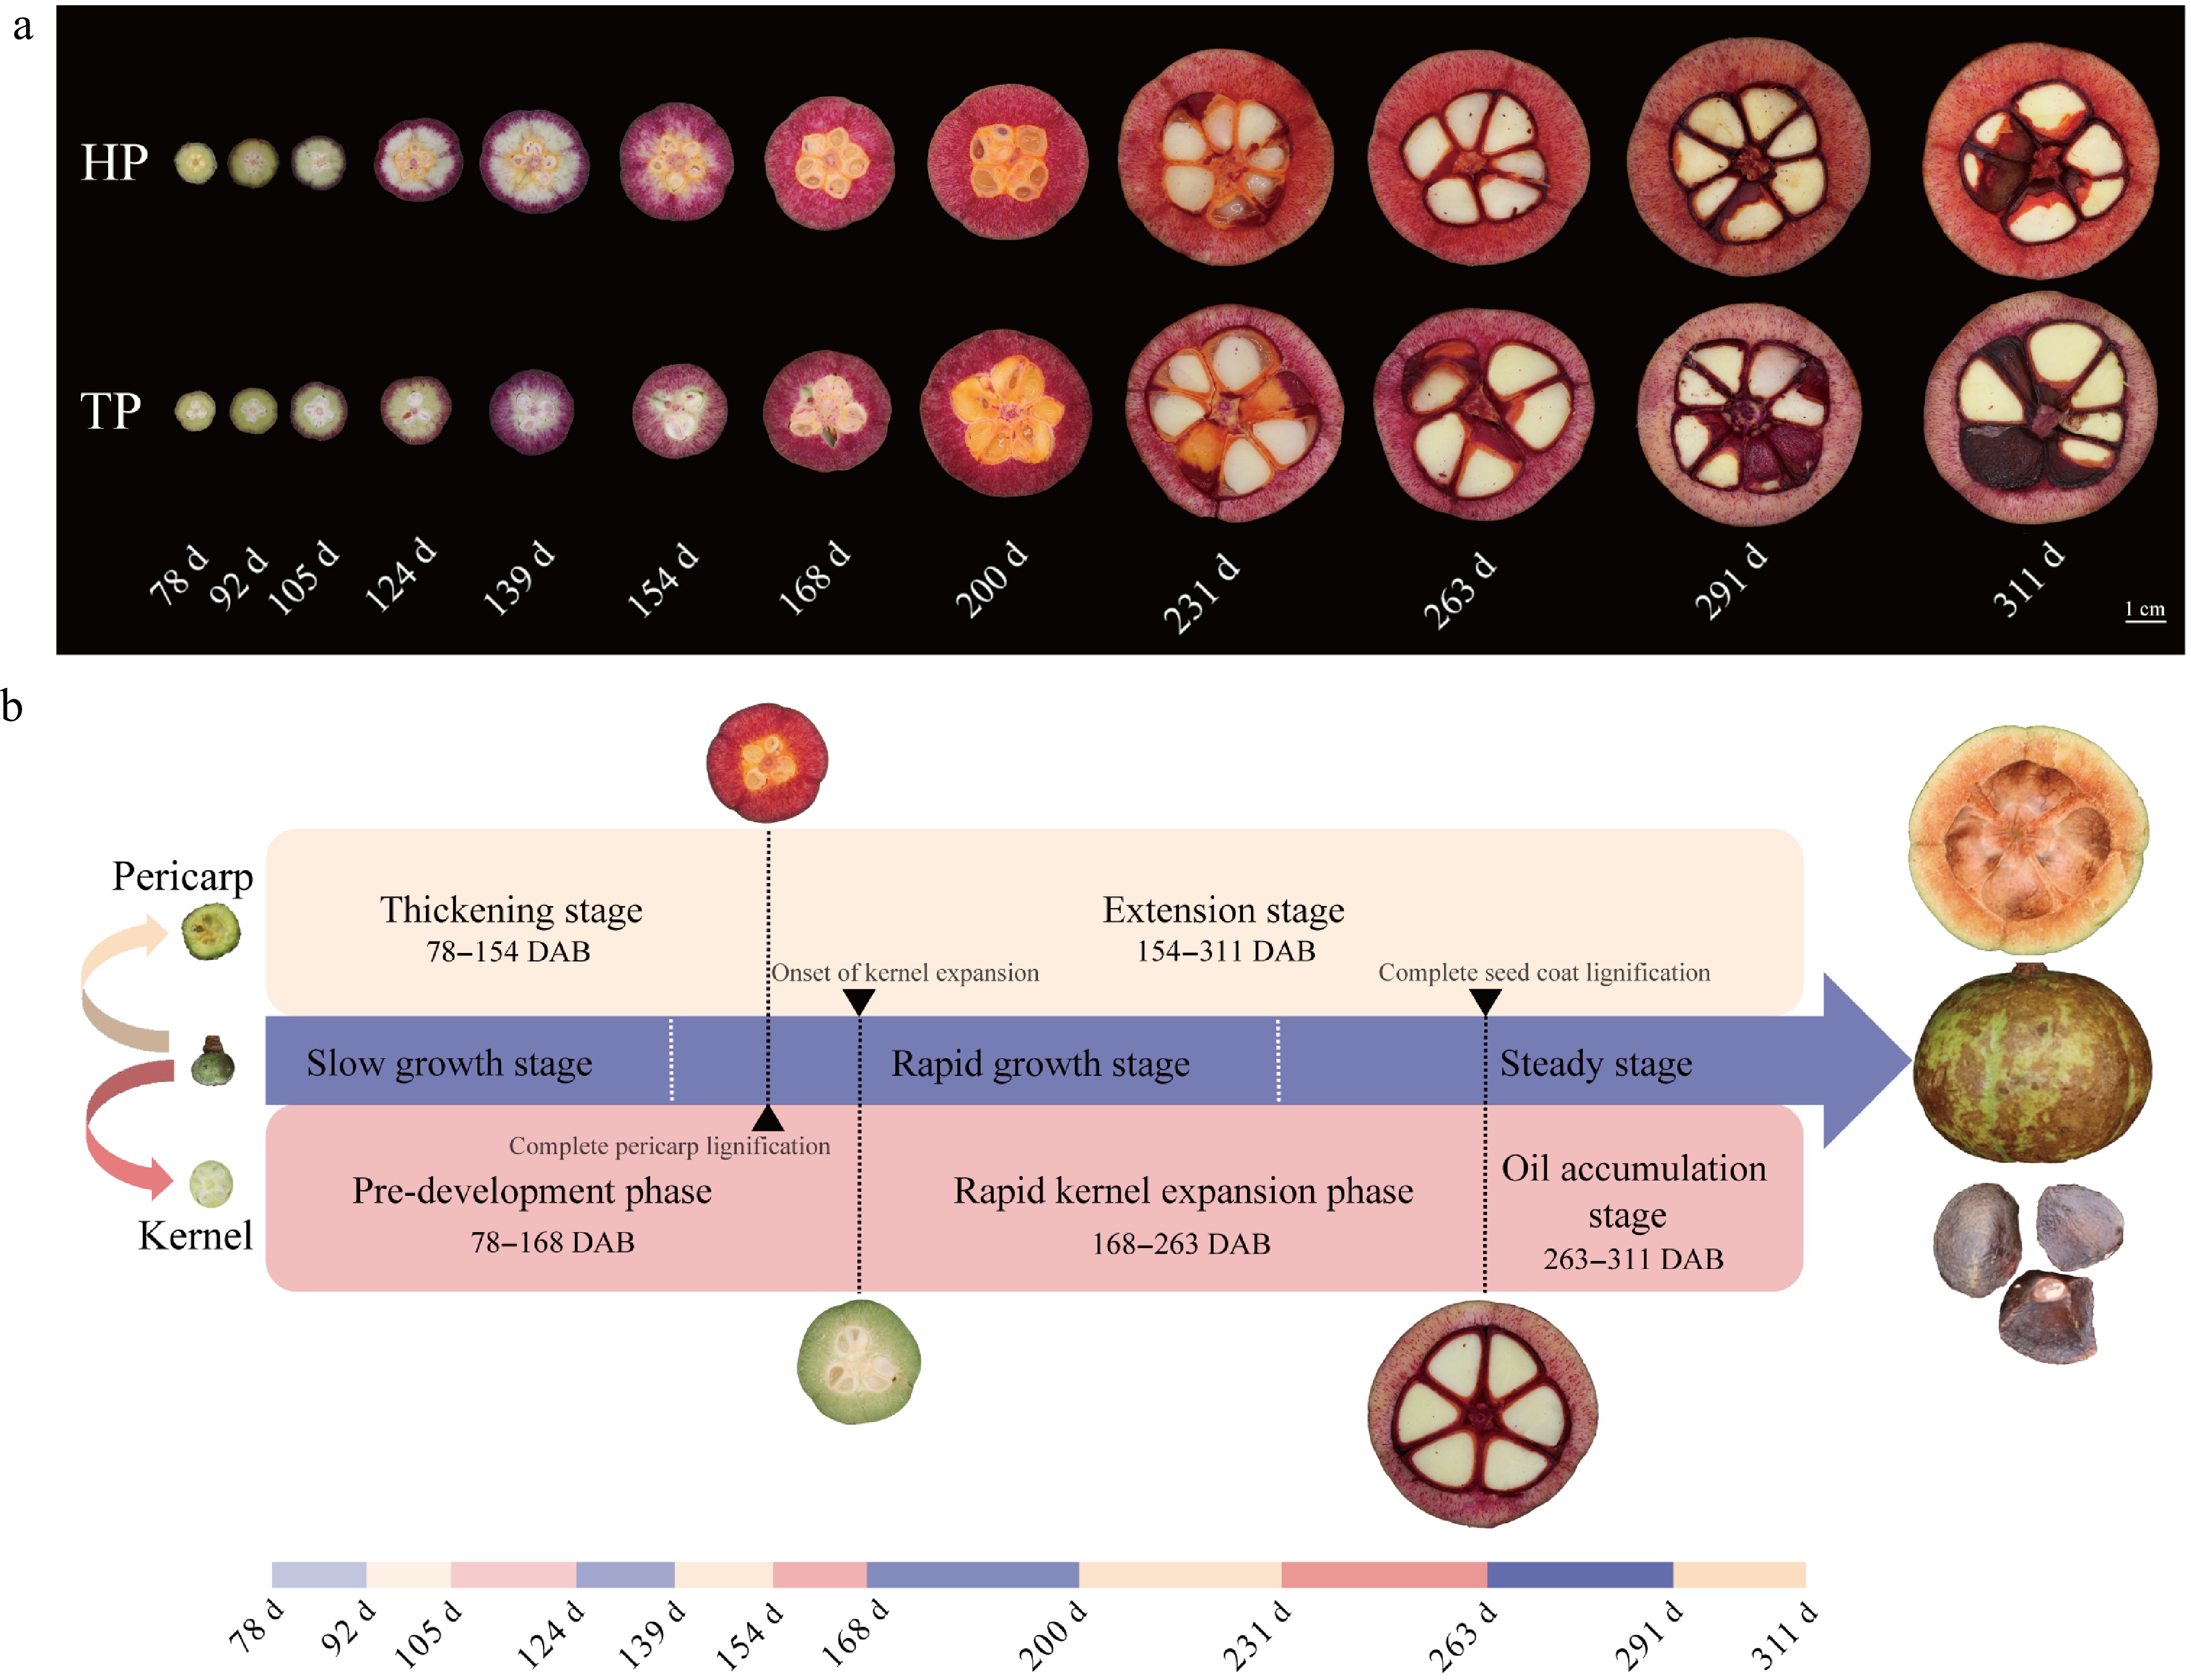
Figure 2.
Lignification patterns of the pericarp in HP and TP fruits and classification of fruit developmental stages. (a) Phloroglucinol–HCl staining of transverse sections of the pericarp from 78 to 311 d, showing progressive lignification from the outer to the inner pericarp. HP pericarps exhibited a deeper lignin staining intensity than TP. (b) Schematic model of C. drupifera fruit development. Fruit development was divided into three stages: Slow growth, rapid growth, and steady stage. Pericarp development included a thickening stage (78–154 d) and an extension stage (154–311 d). Seed kernel development was divided into a pre-development phase (78–168 d), a rapid kernel expansion phase (168–263 d), and an oil accumulation stage (263–311 d).
-
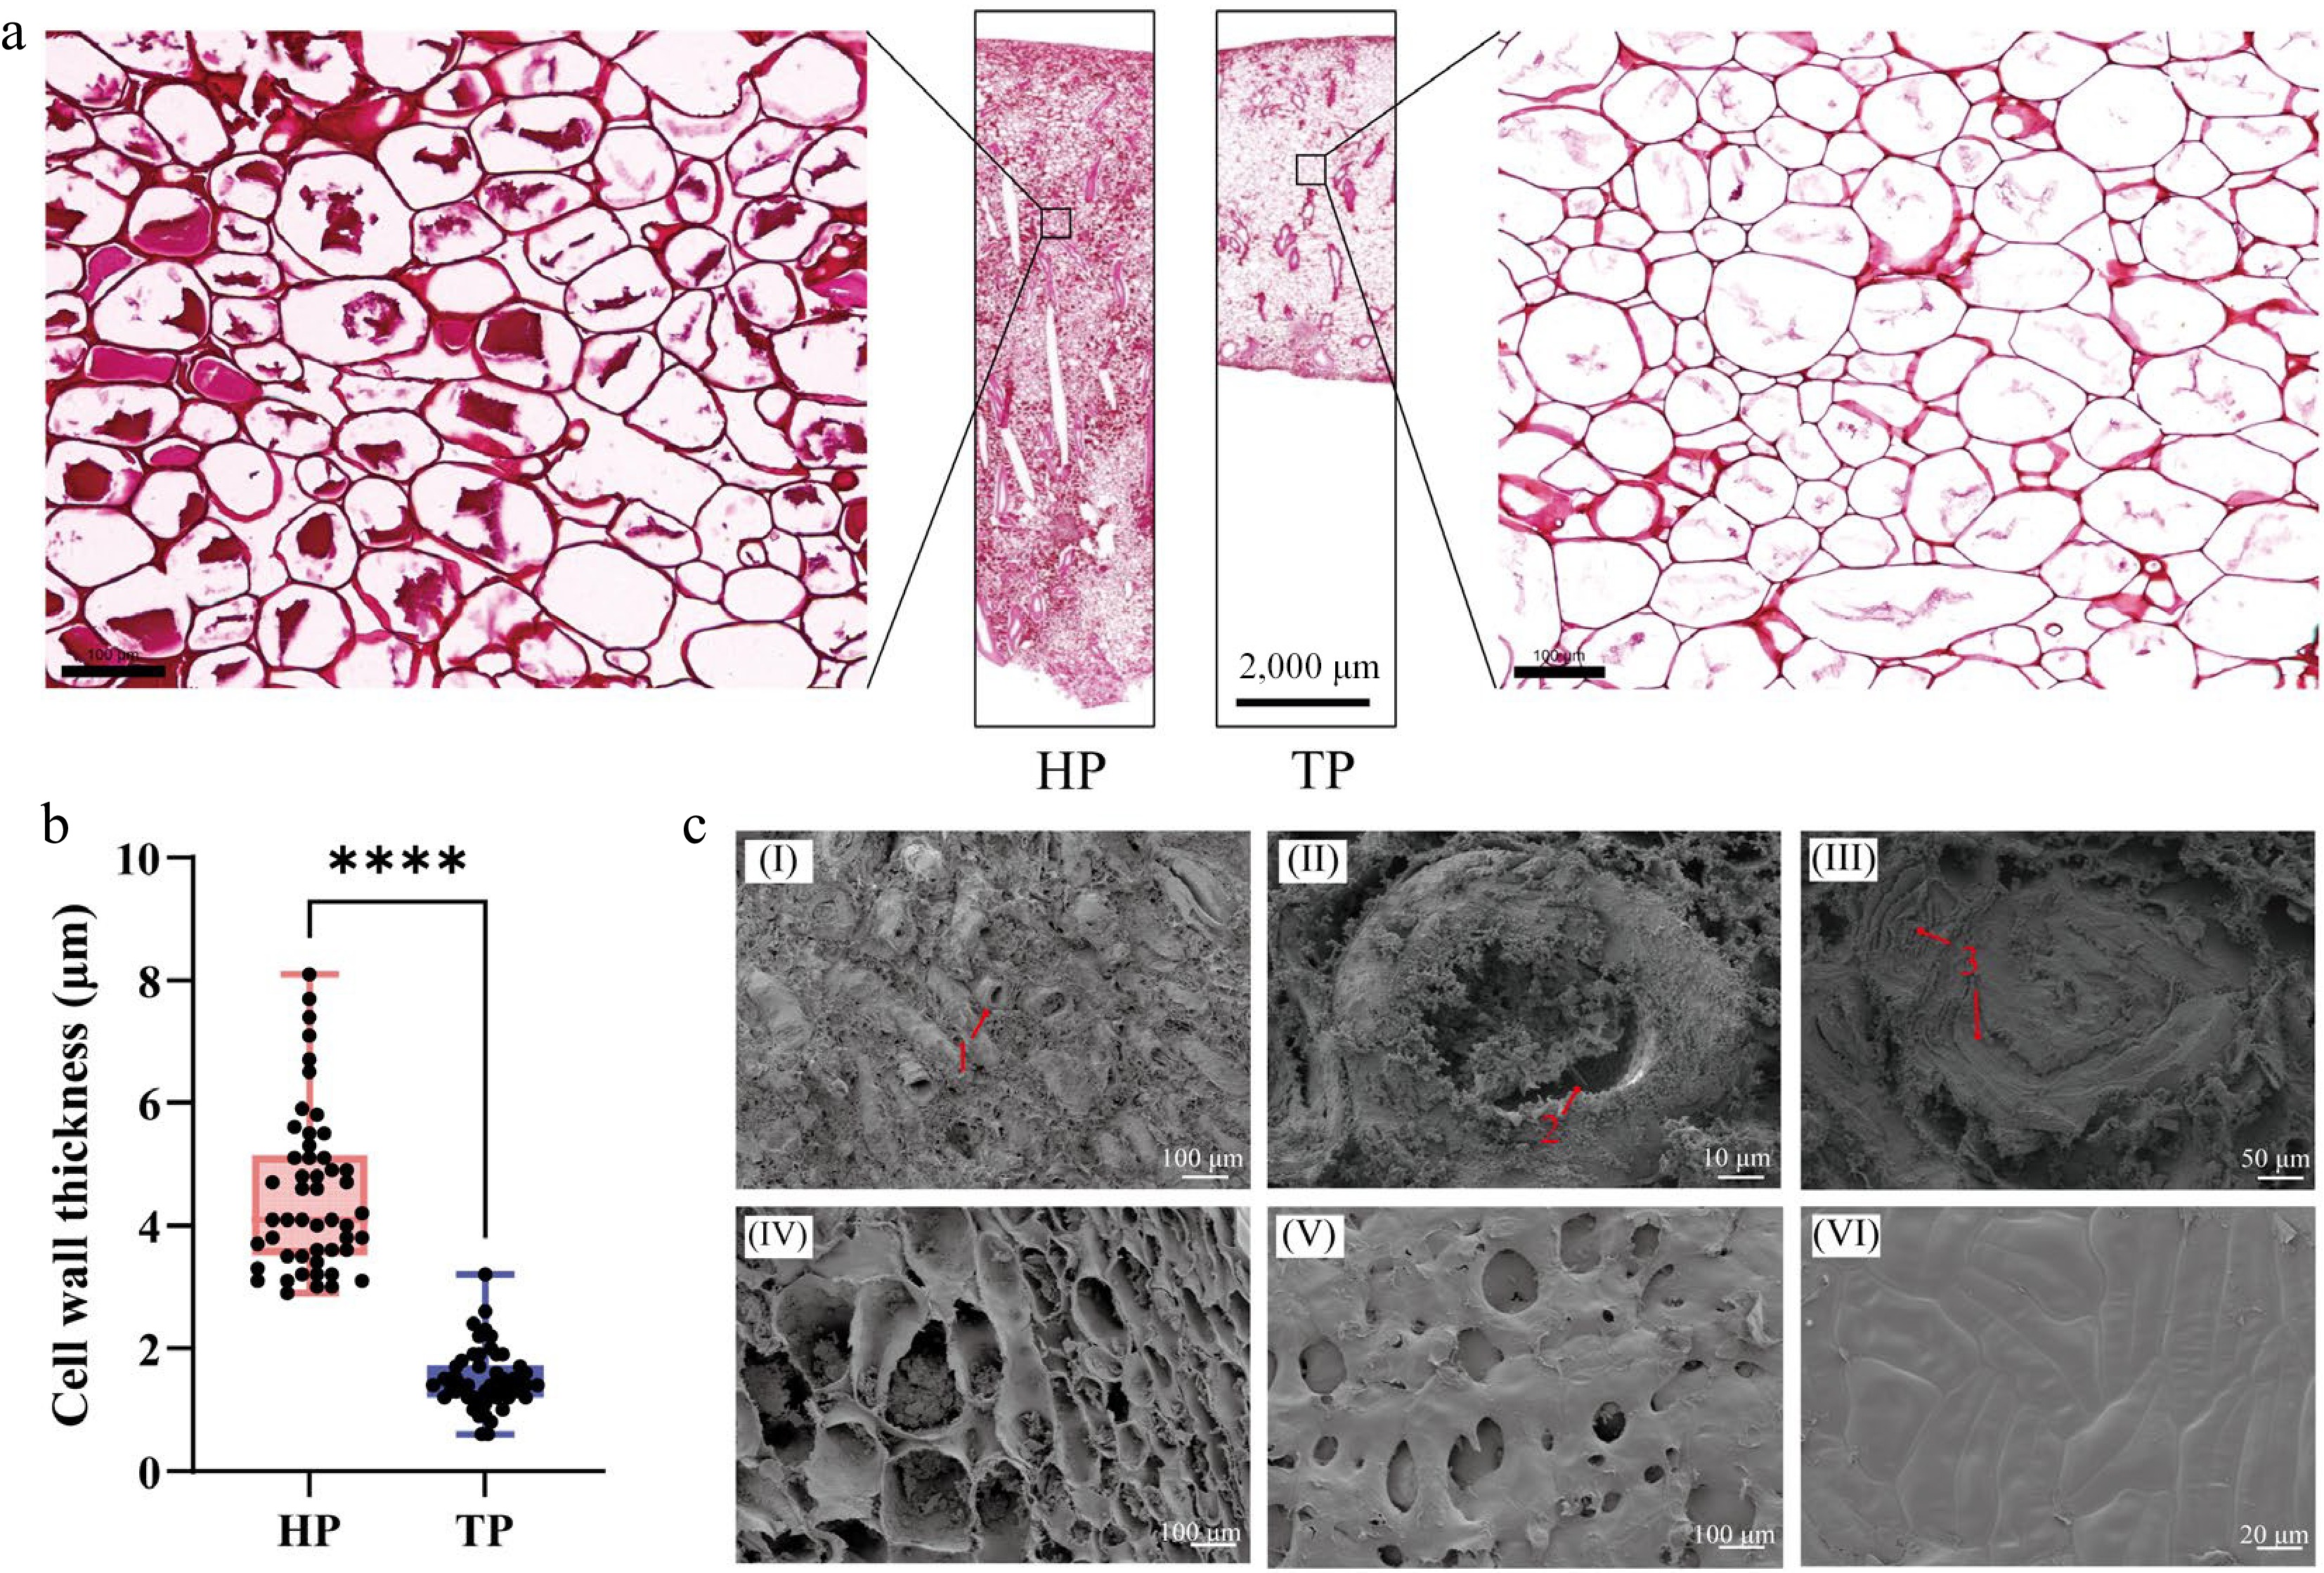
Figure 3.
Anatomical structure and microscopic morphology of the pericarp in HP and TP fruits. (a) Paraffin sections of mature pericarps from HP and TP stained with safranin. The enlarged views show that HP possesses markedly thicker cell walls, whereas TP exhibits thinner walls with a lower degree of lignification. (b) Statistical analysis of cell wall thickness in HP and TP pericarps (n = 50). Asterisks denote a significant difference between HP and TP, based on Student's t-test (**** p < 0.0001). (c) SEM images showing the microstructure of the pericarp. (I–III) Morphology and structural characteristics of sclereids; (IV) parenchyma cell structure; (V) inner epidermis; (VI) outer epidermis. Numbered red labels indicate the following: 1, sclereid cells; 2, pits and plasmodesmata on the sclereid wall; 3, lamellar thickening of sclereid cells' secondary walls.
-
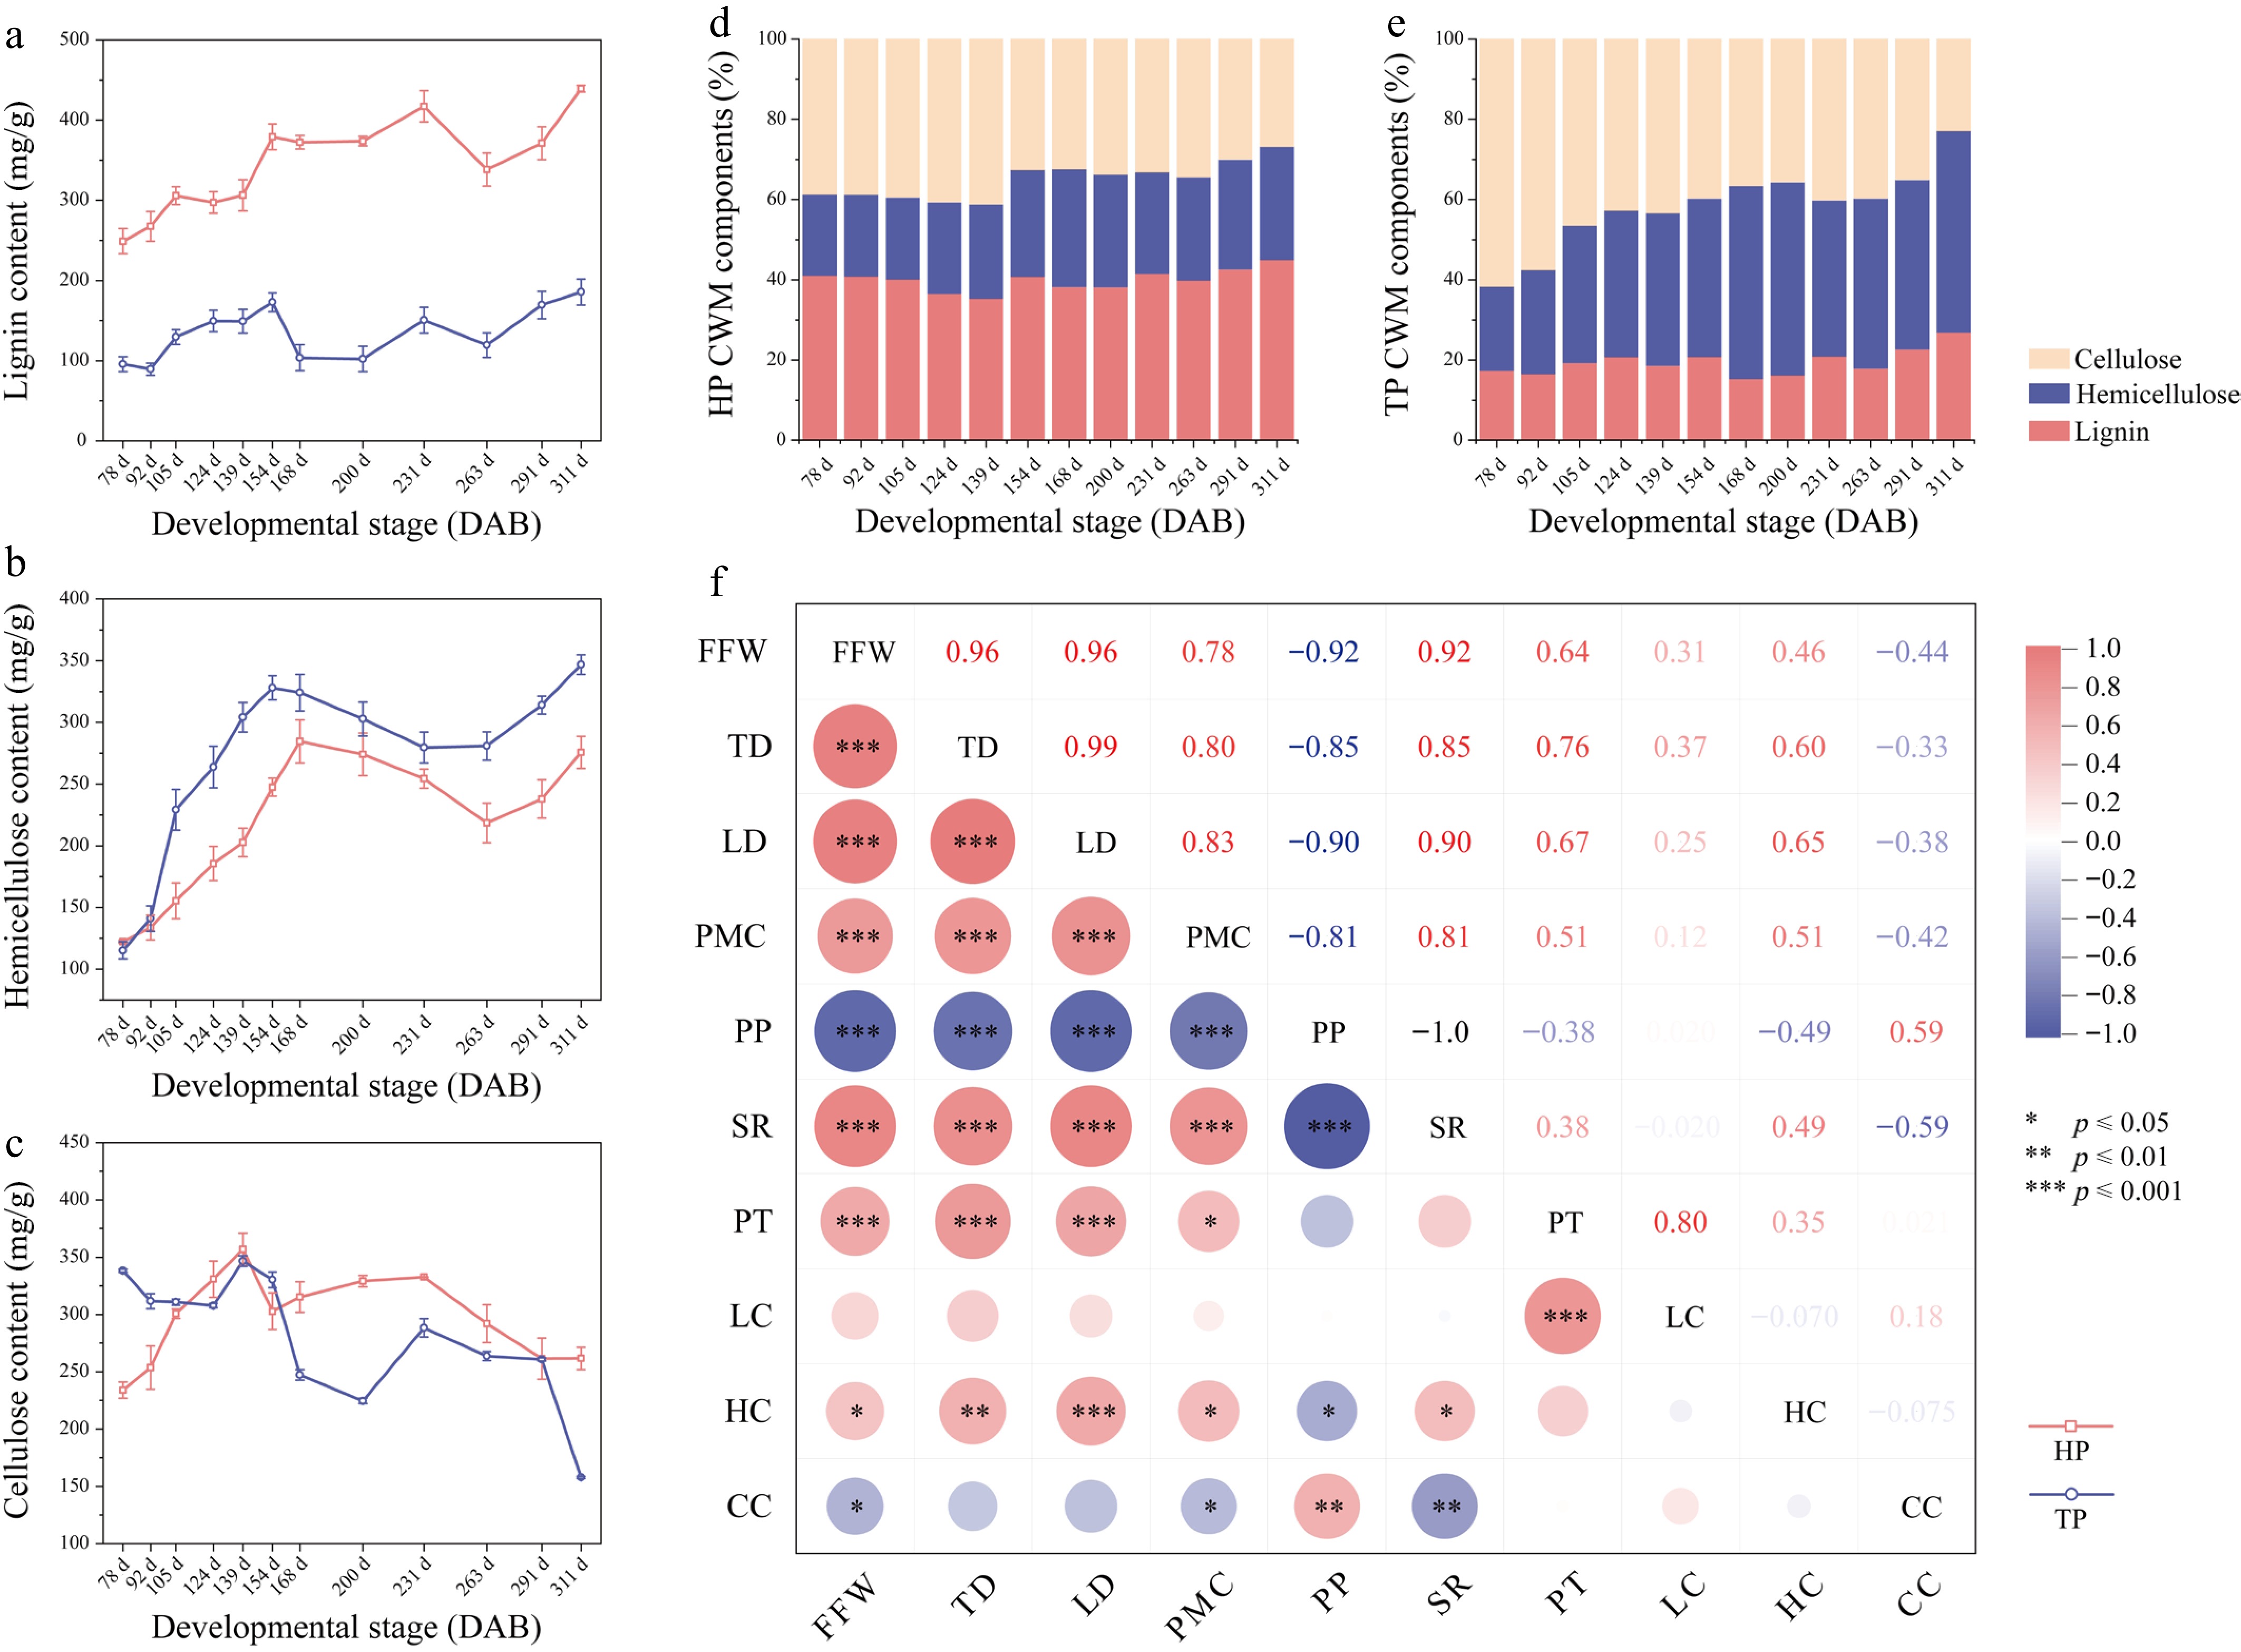
Figure 4.
Analysis of cell wall composition and its correlation with fruit traits in HP and TP pericarps. (a)–(c) Changes in lignin (a), hemicellulose (b), and cellulose (c) contents in HP and TP pericarps at different developmental stages (78–311 d). HP maintained a significantly higher lignin content throughout development, whereas TP exhibited greater accumulation of hemicellulose and cellulose. (d)–(e) Relative proportions of the three major cell wall components—lignin, hemicellulose, and cellulose—in HP (d) and TP (e) pericarps. HP showed a consistently higher proportion of lignin, whereas TP cell walls were dominated by hemicellulose and cellulose. (f) Correlation analysis between cell wall components and fruit phenotypic traits. The color of each circle indicates the correlation direction (red: positive; blue: negative), and circle size reflects the strength of the correlation. Abbreviations: FFW, fresh fruit weight; TD, transverse diameter; LD, longitudinal diameter; PMC, pericarp moisture content; PP, pericarp proportion; SR, seed yield ratio; PT, pericarp thickness; LC, lignin content; HC, hemicellulose content; CC, cellulose content.
-
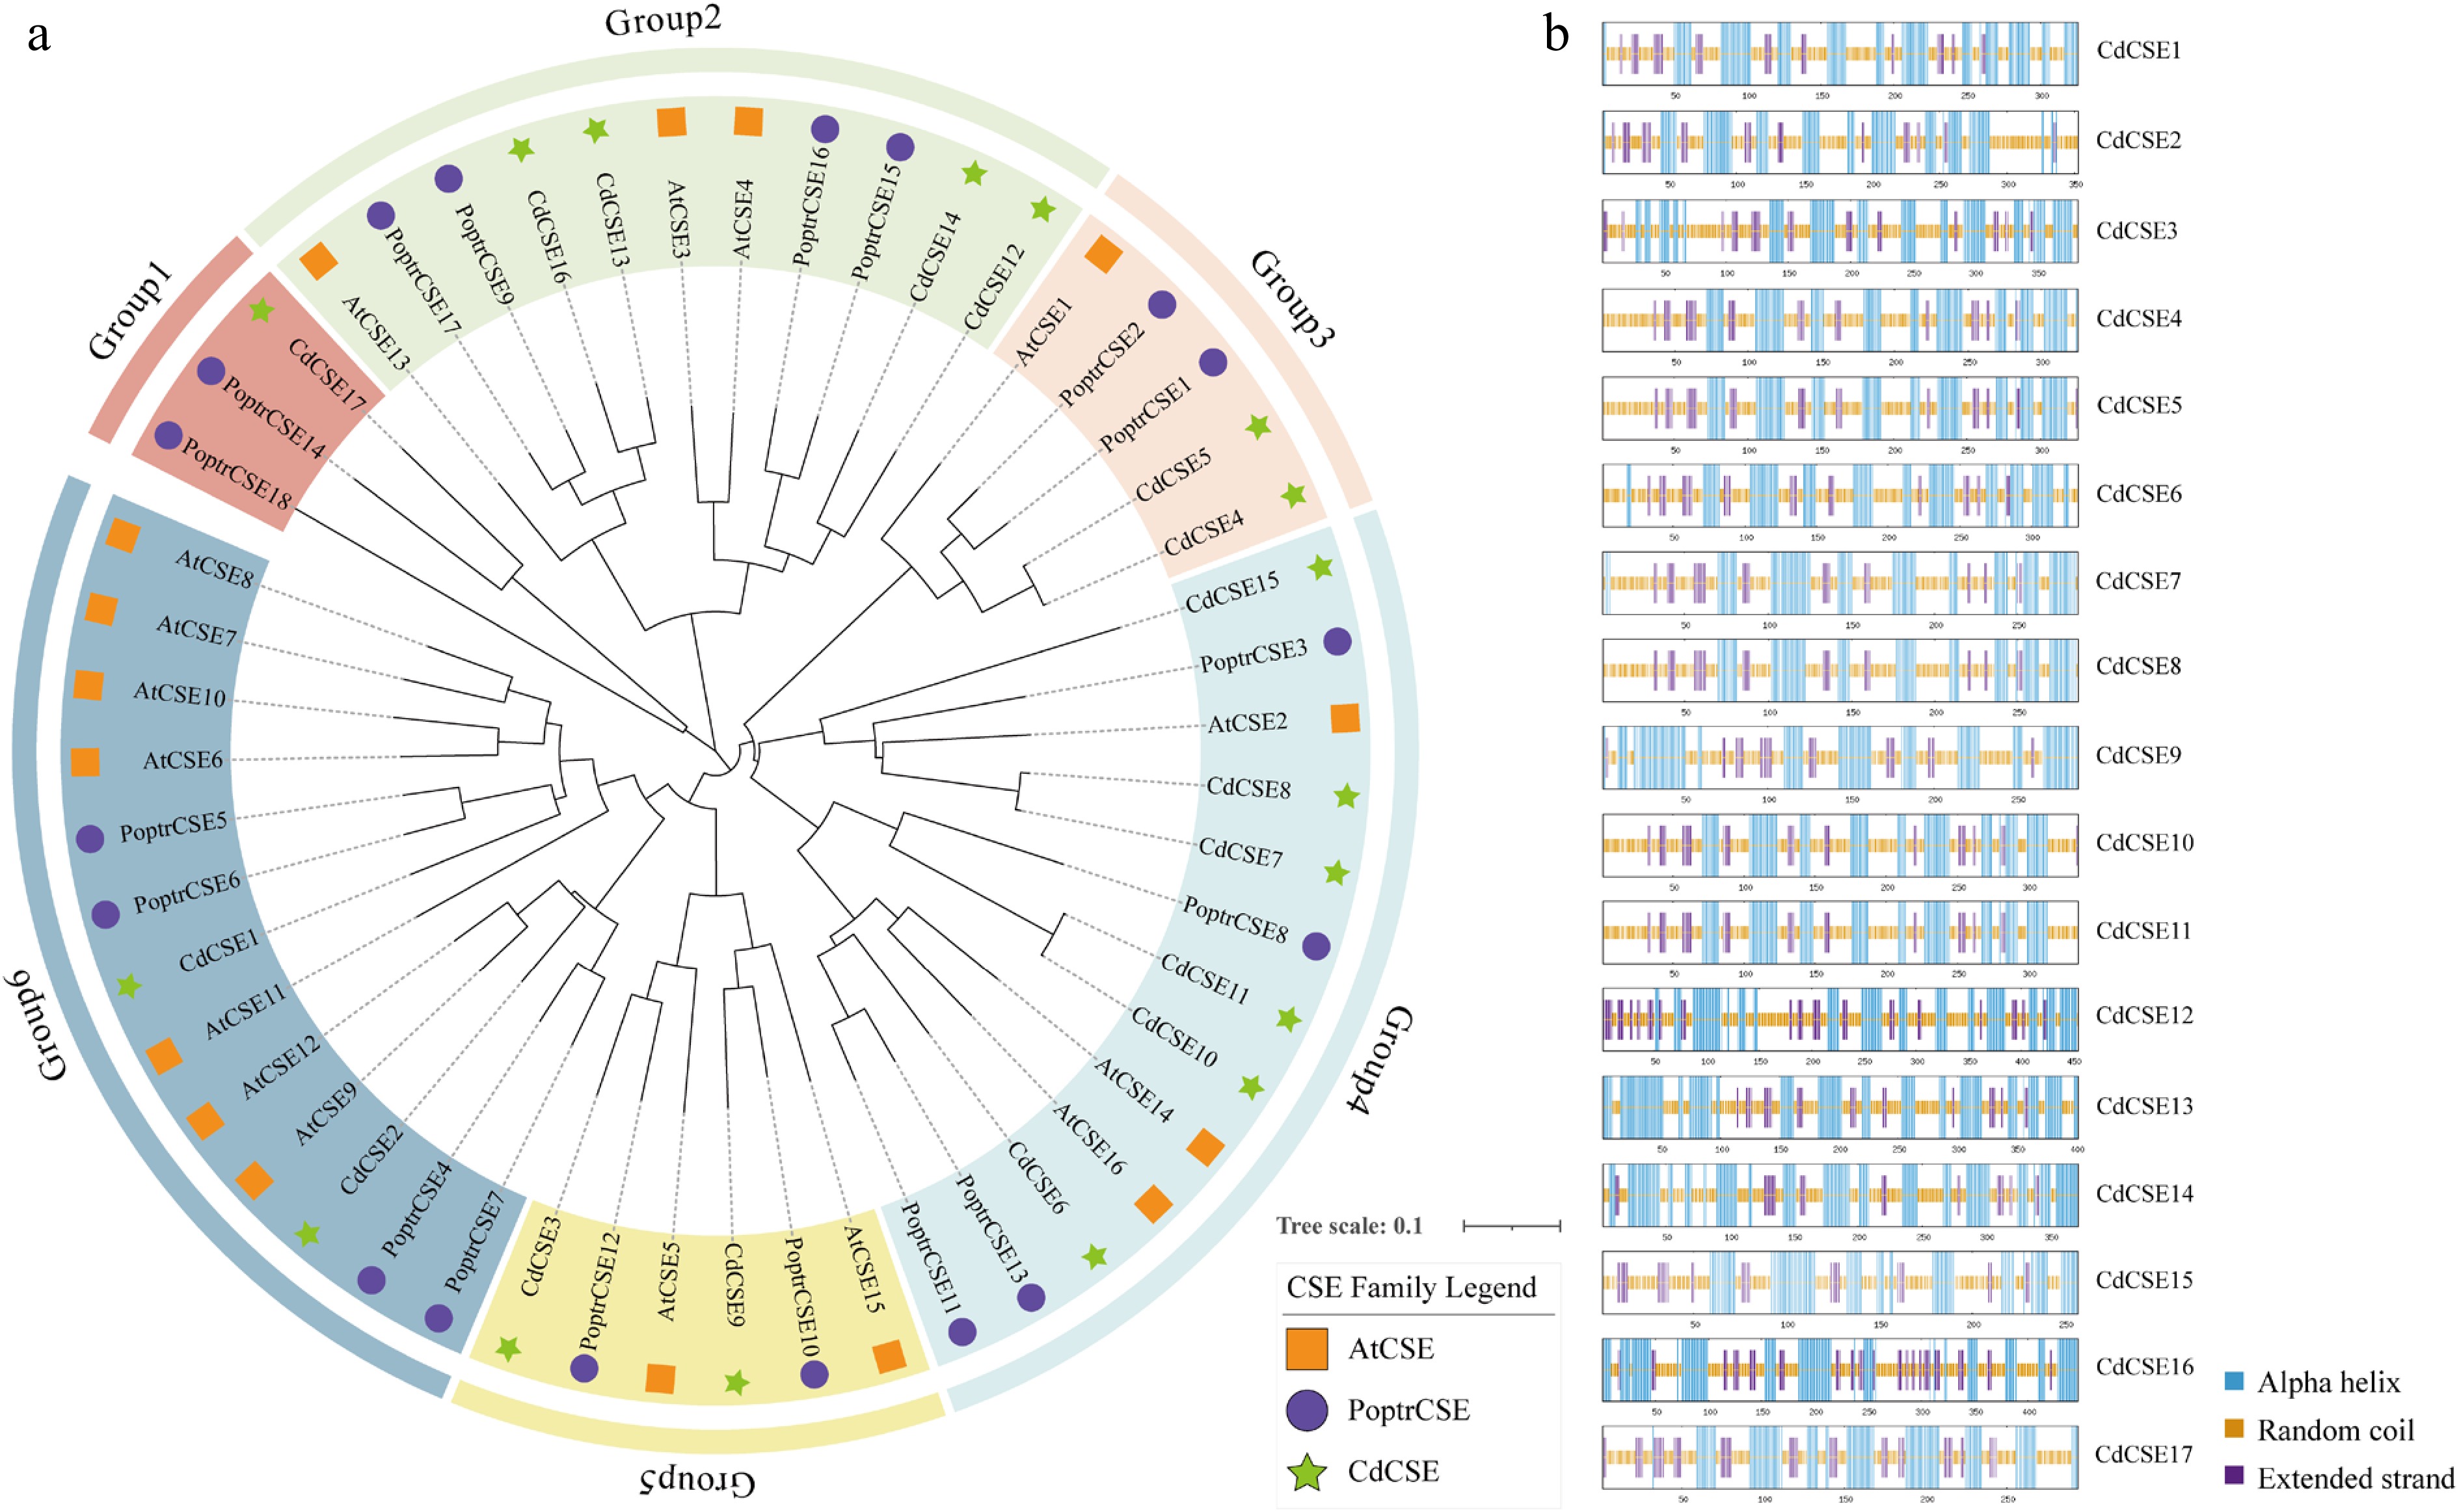
Figure 5.
Evolutionary analysis and secondary structure prediction of the CdCSE gene family. (a) Phylogenetic tree of CSE members in A. thaliana, P. trichocarpa, and C. drupifera. (b) Predicted secondary structures of the 17 CdCSE proteins. The colored regions indicate distinct structural elements: Alpha helices (blue), random coils (orange), and extended strands (purple).
-
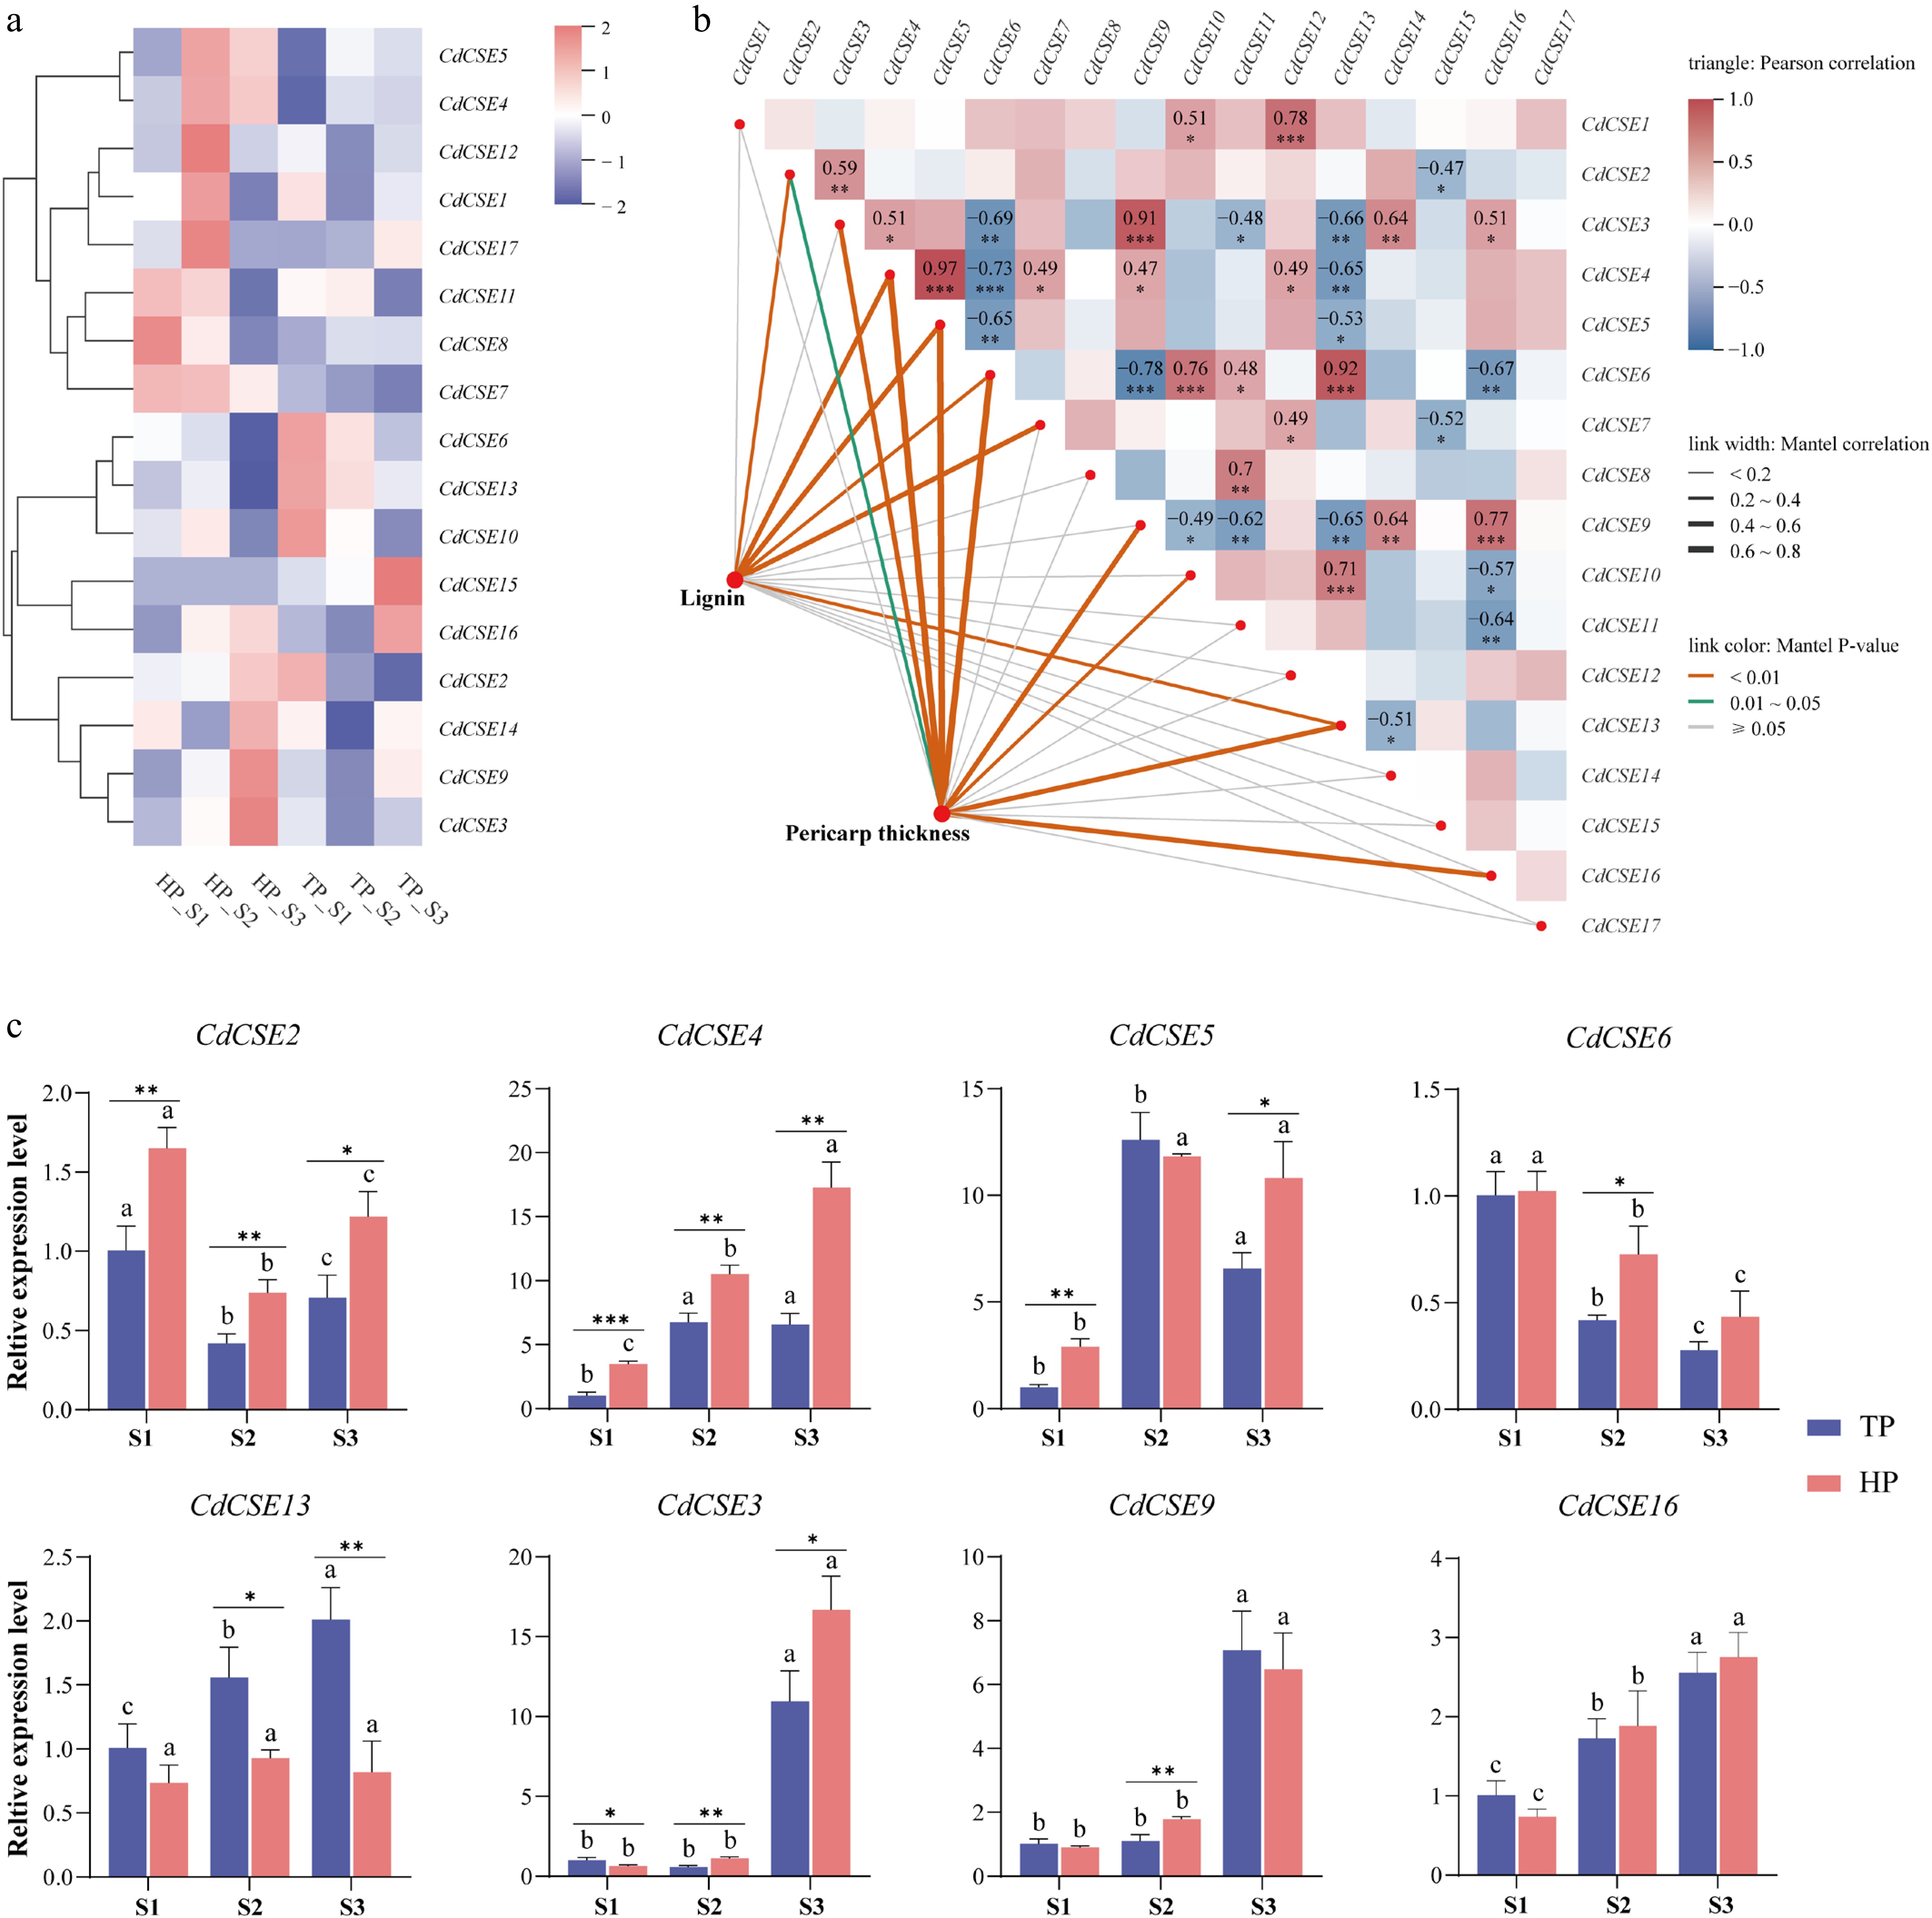
Figure 6.
Expression analysis of CdCSE genes in HP and TP pericarps. (a) Heatmap showing the transcriptome expression profiles of CdCSE genes at different developmental stages (S1–S3) of HP and TP pericarps. (b) Correlation analysis (Mantel test) of CdCSE gene expression levels, lignin content, and pericarp thickness. Edge width indicates Mantel's r statistic, and edge color indicates the statistical significance. (c) qRT-PCR validation of eight representative CdCSE genes. Error bars represent the standard deviation of three biological replicates. Different letters indicate significant differences between developmental stages within the same pericarp type (p < 0.05); asterisks indicate significant differences between HP and TP at the same developmental stage ( *** p < 0.001; ** p < 0.01; * p < 0.05).
-
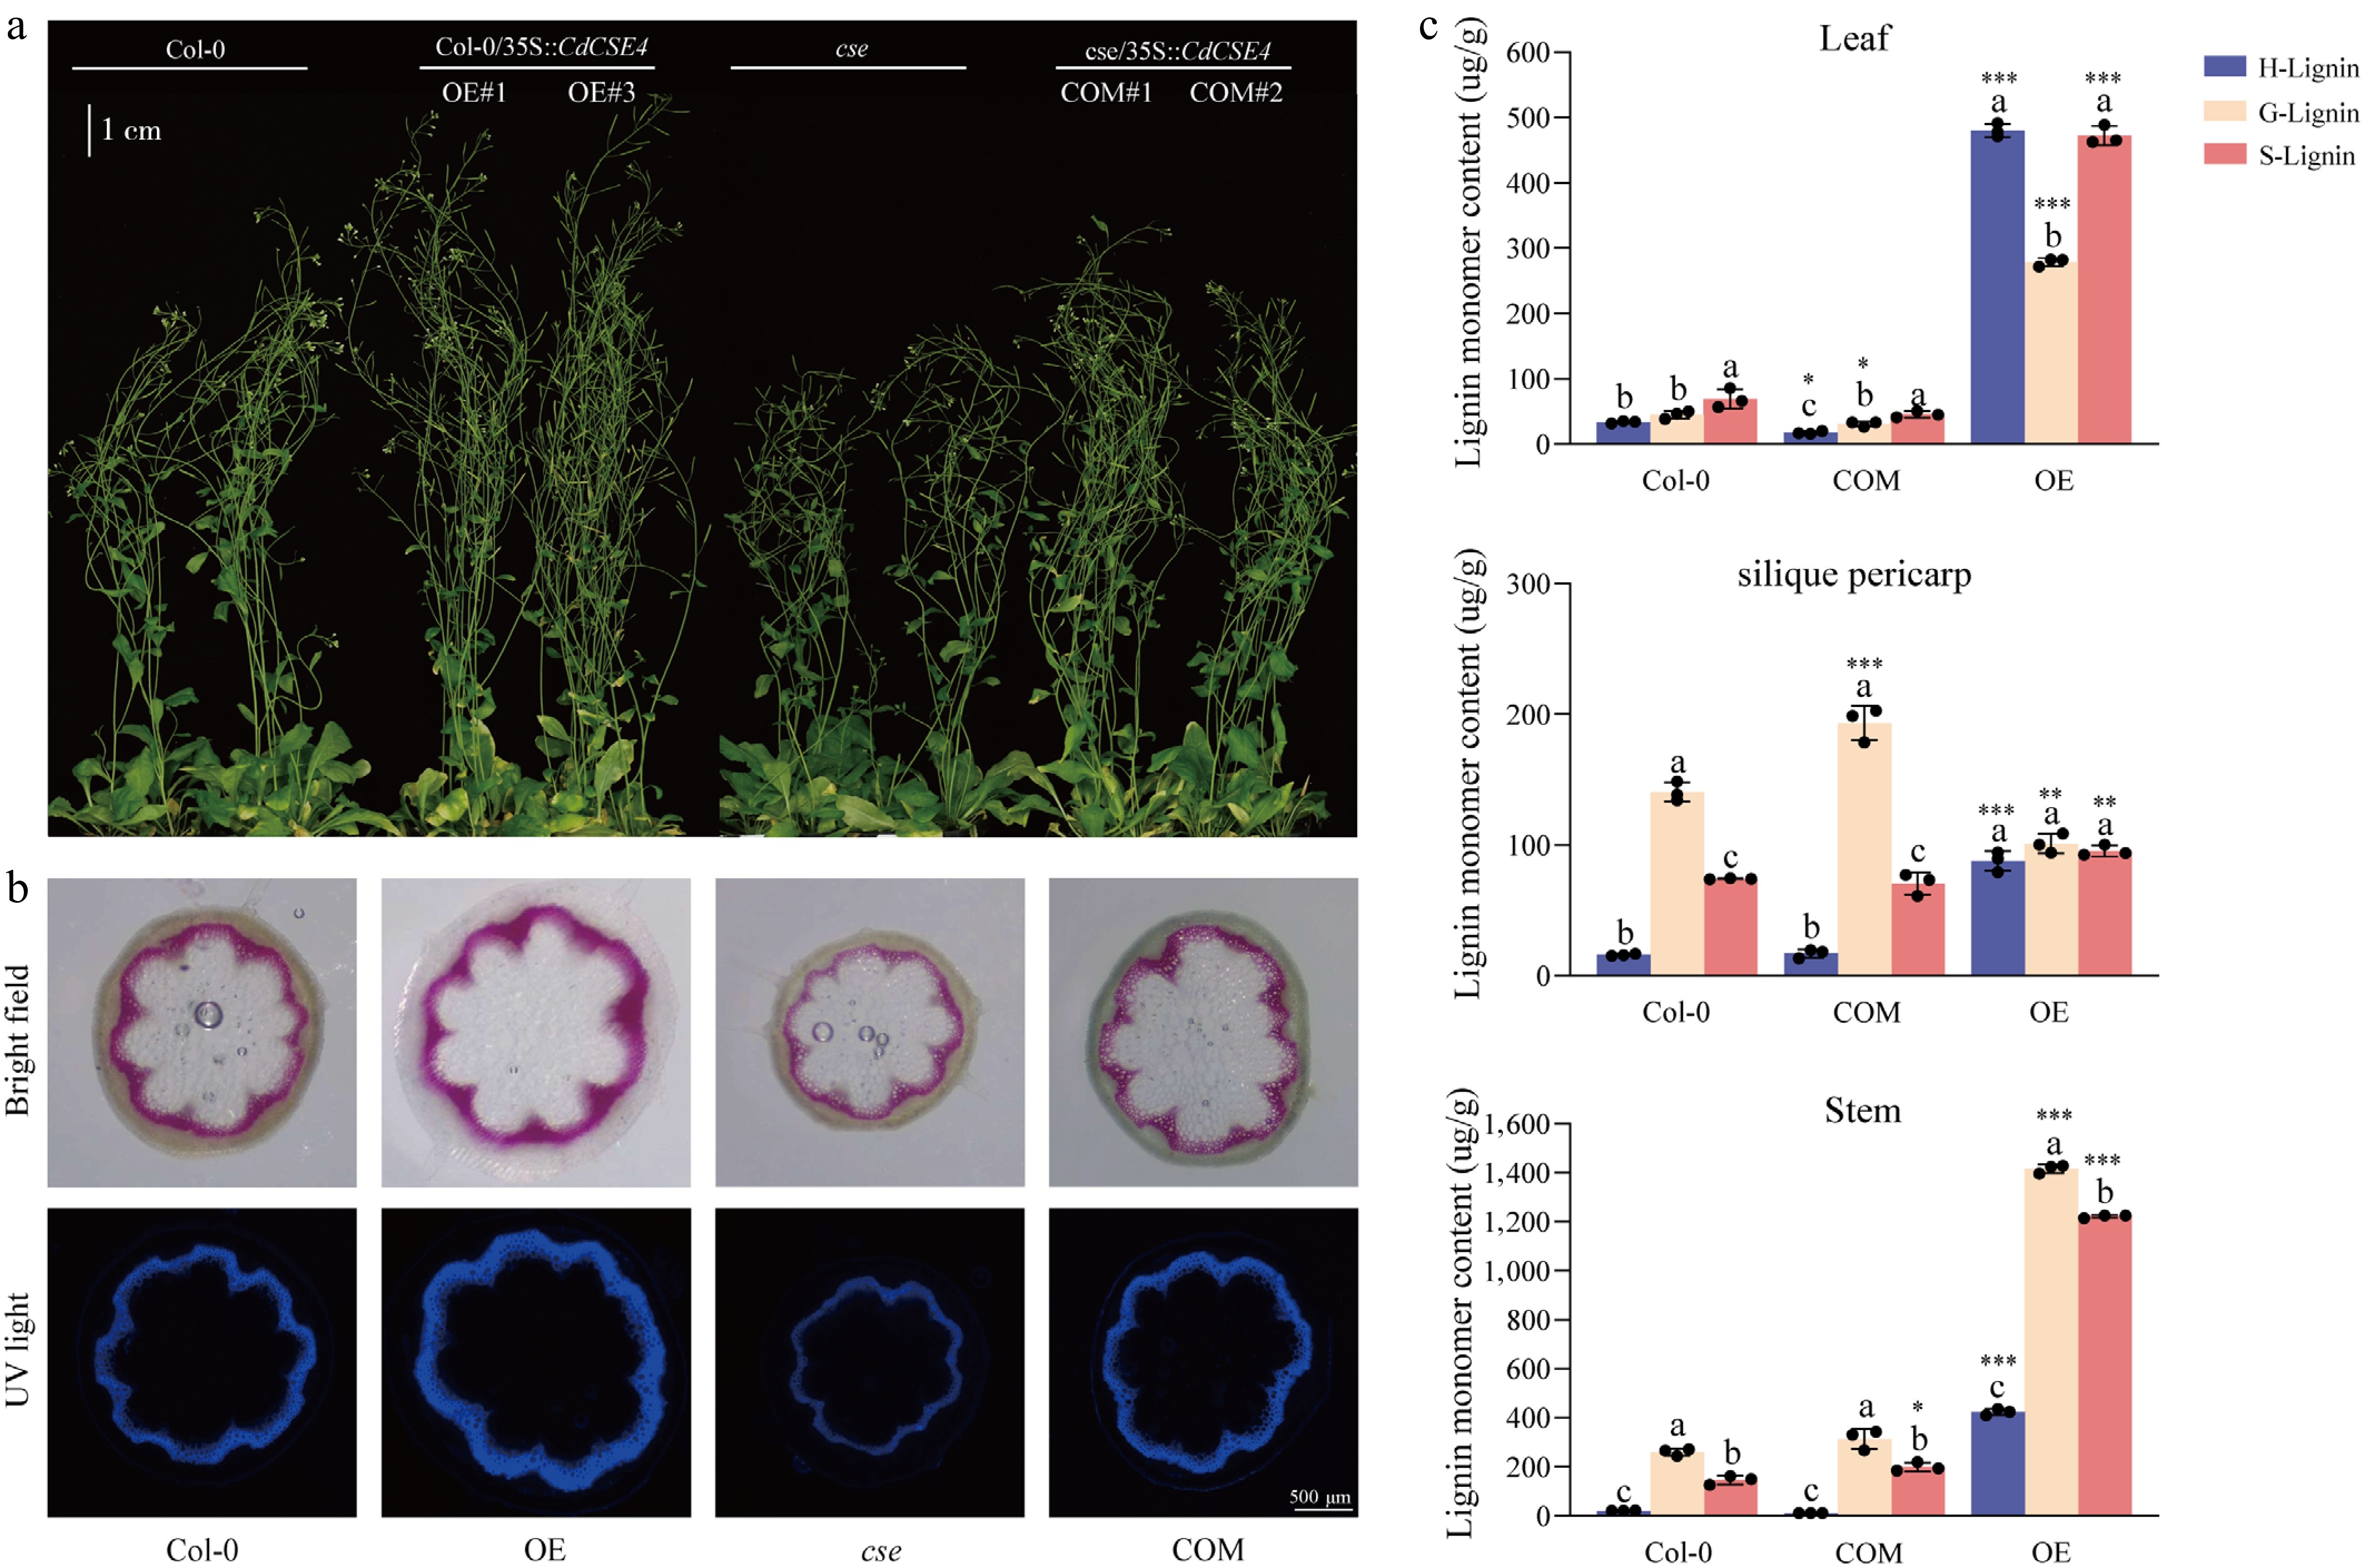
Figure 7.
Functional validation of CdCSE4 in A. thaliana through phenotypic and biochemical analyses. (a) Phenotypic observation of A. thaliana wild-type (Col-0), Col-0/35S::CdCSE4 overexpression lines (OE), cse mutant, and cse/35S::CdCSE4 complementation lines (COM). OE#1 and OE#3, alongside COM#1 and COM#2, are the independent transgenic lines used. (b) Phloroglucinol–HCl staining and UV autofluorescence of stem cross-sections from Col-0, OE, cse, and COM lines. (c) Comparison of H-, G-, and S-type lignin monomer contents in the leaves, silique pericarps, and stems of different Arabidopsis genotypes. Data are presented as the means ± SD (n = 3). Different letters indicate significant differences among the three lignin monomer types (H, G, and S) within the same genotype (p < 0.05); asterisks indicate significant differences between the different genotypes and the wild-type Col-0 for the same monomer ( *** p < 0.001; ** p < 0.01; * p < 0.05).
Figures
(7)
Tables
(0)