-
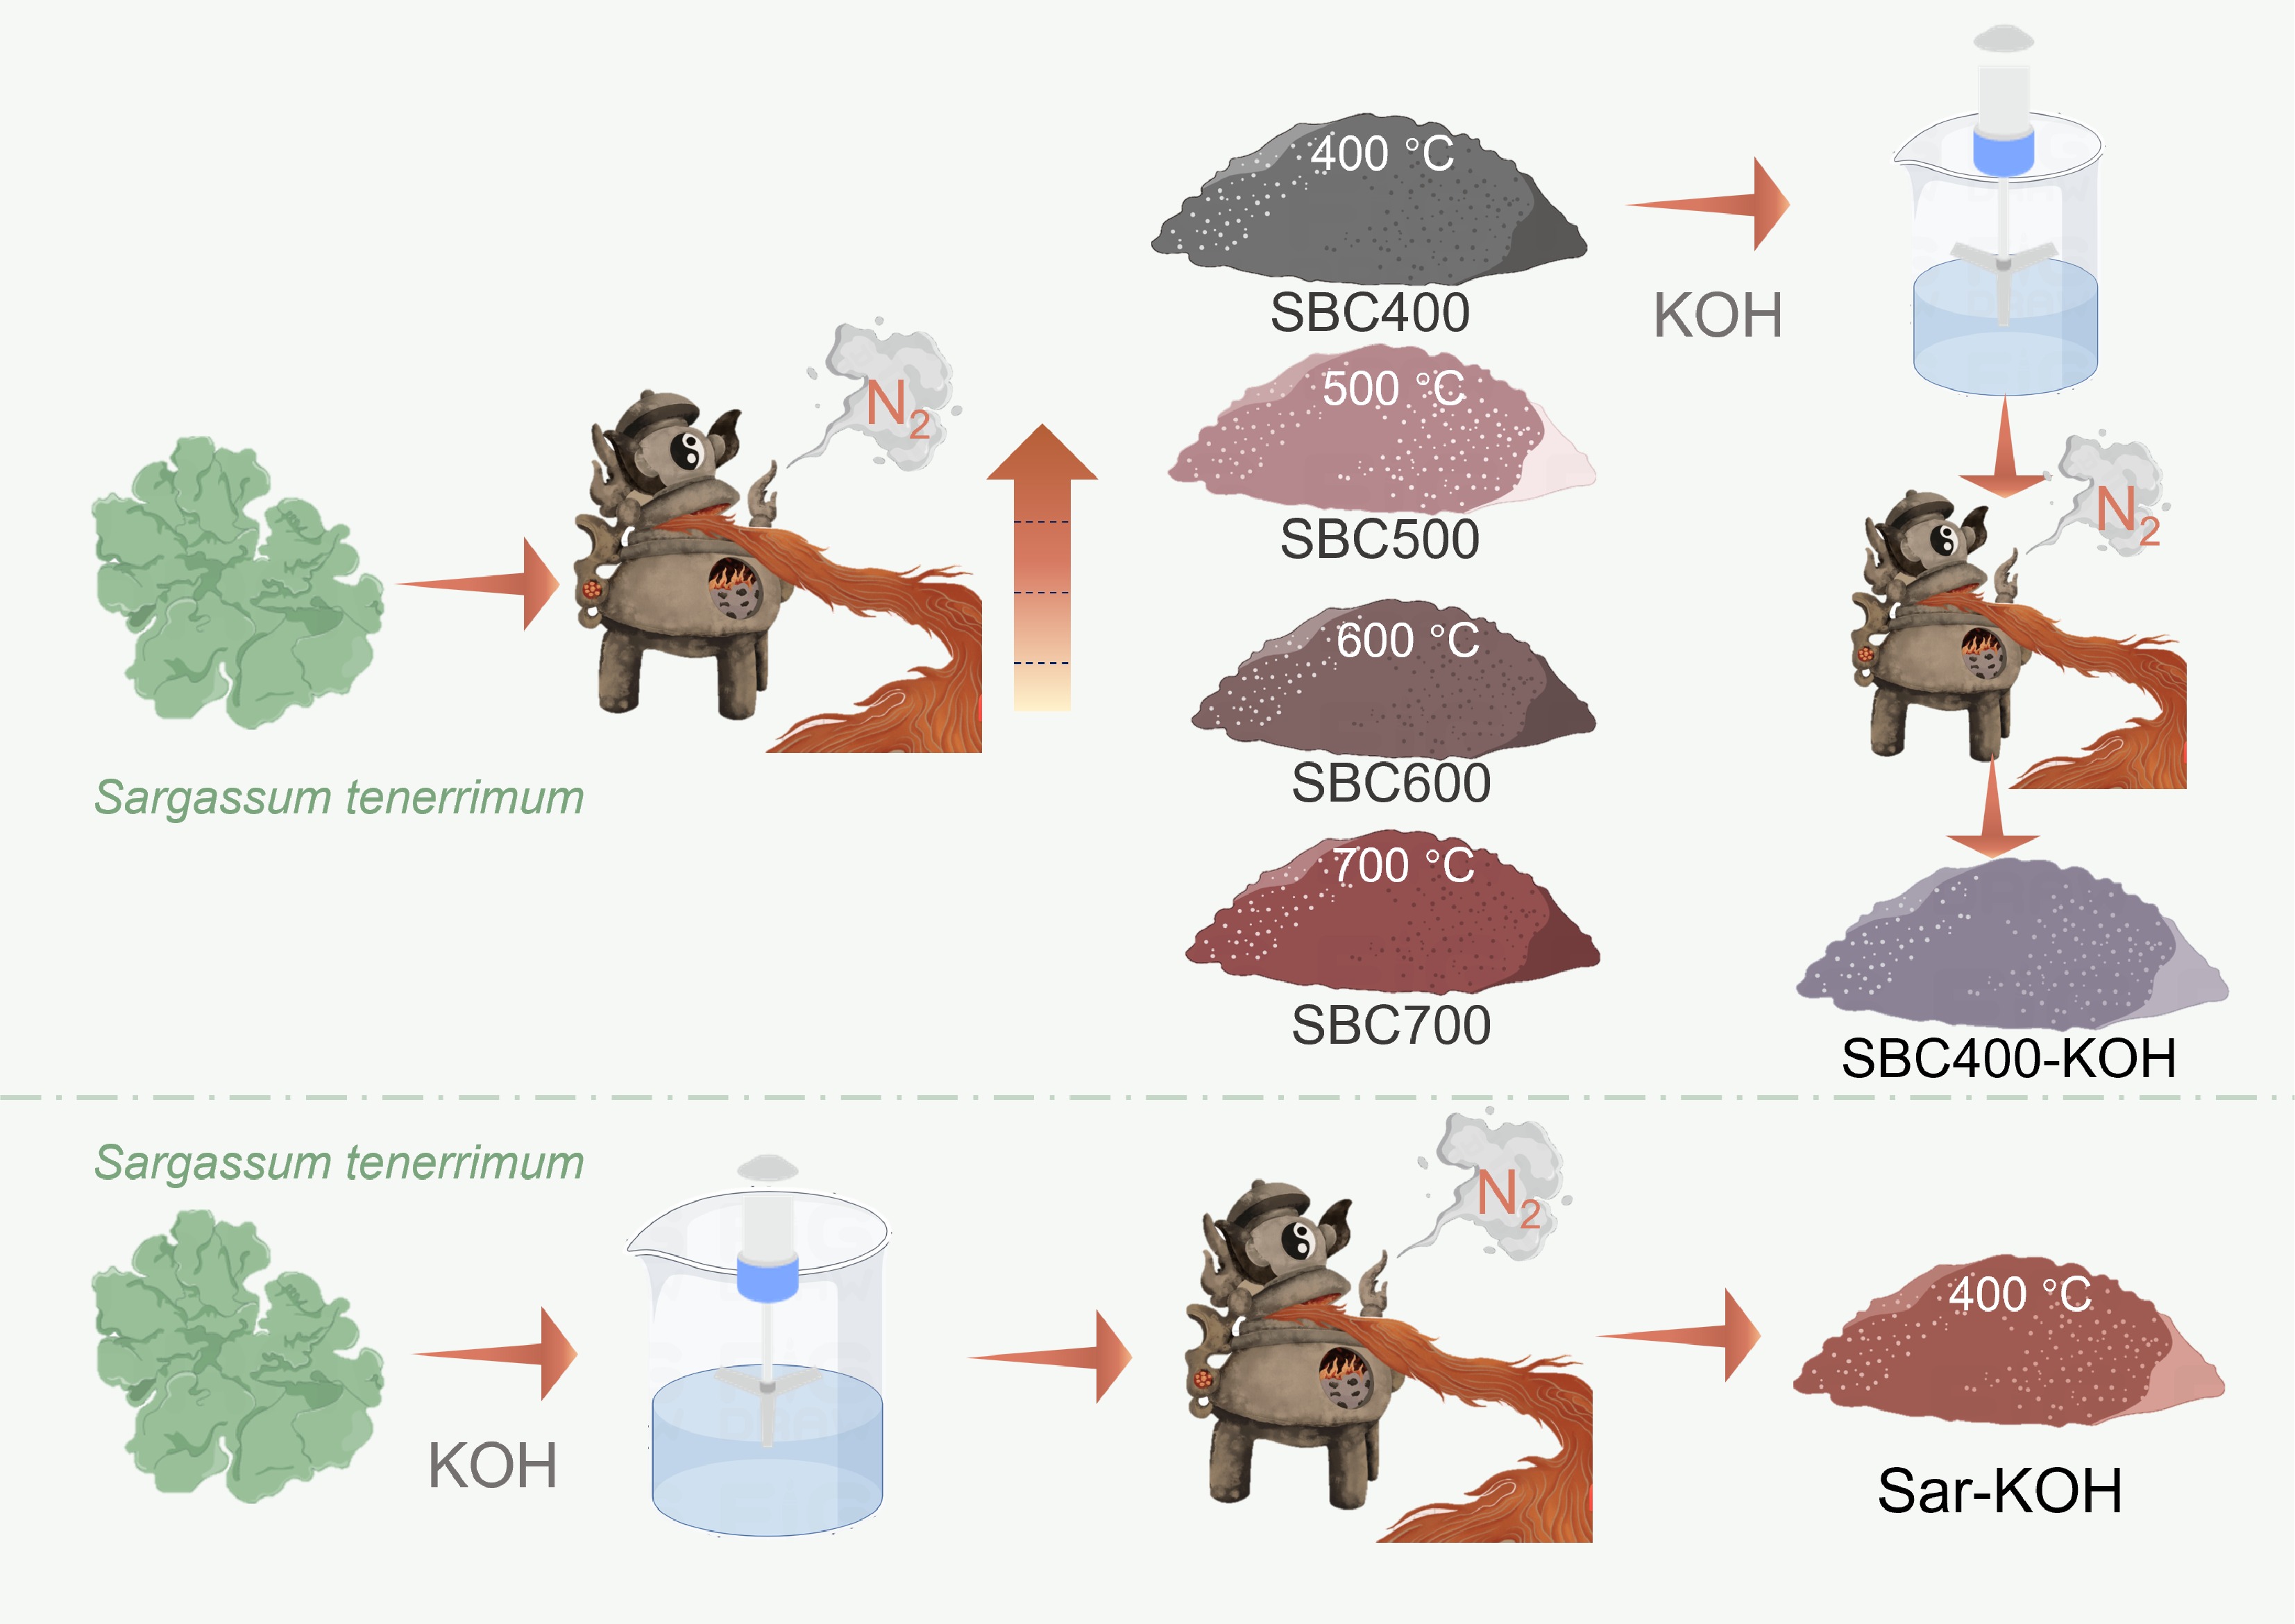
Figure 1.
Schematic diagram of the preparation of biochars from Sargassum tenerrimum.
-
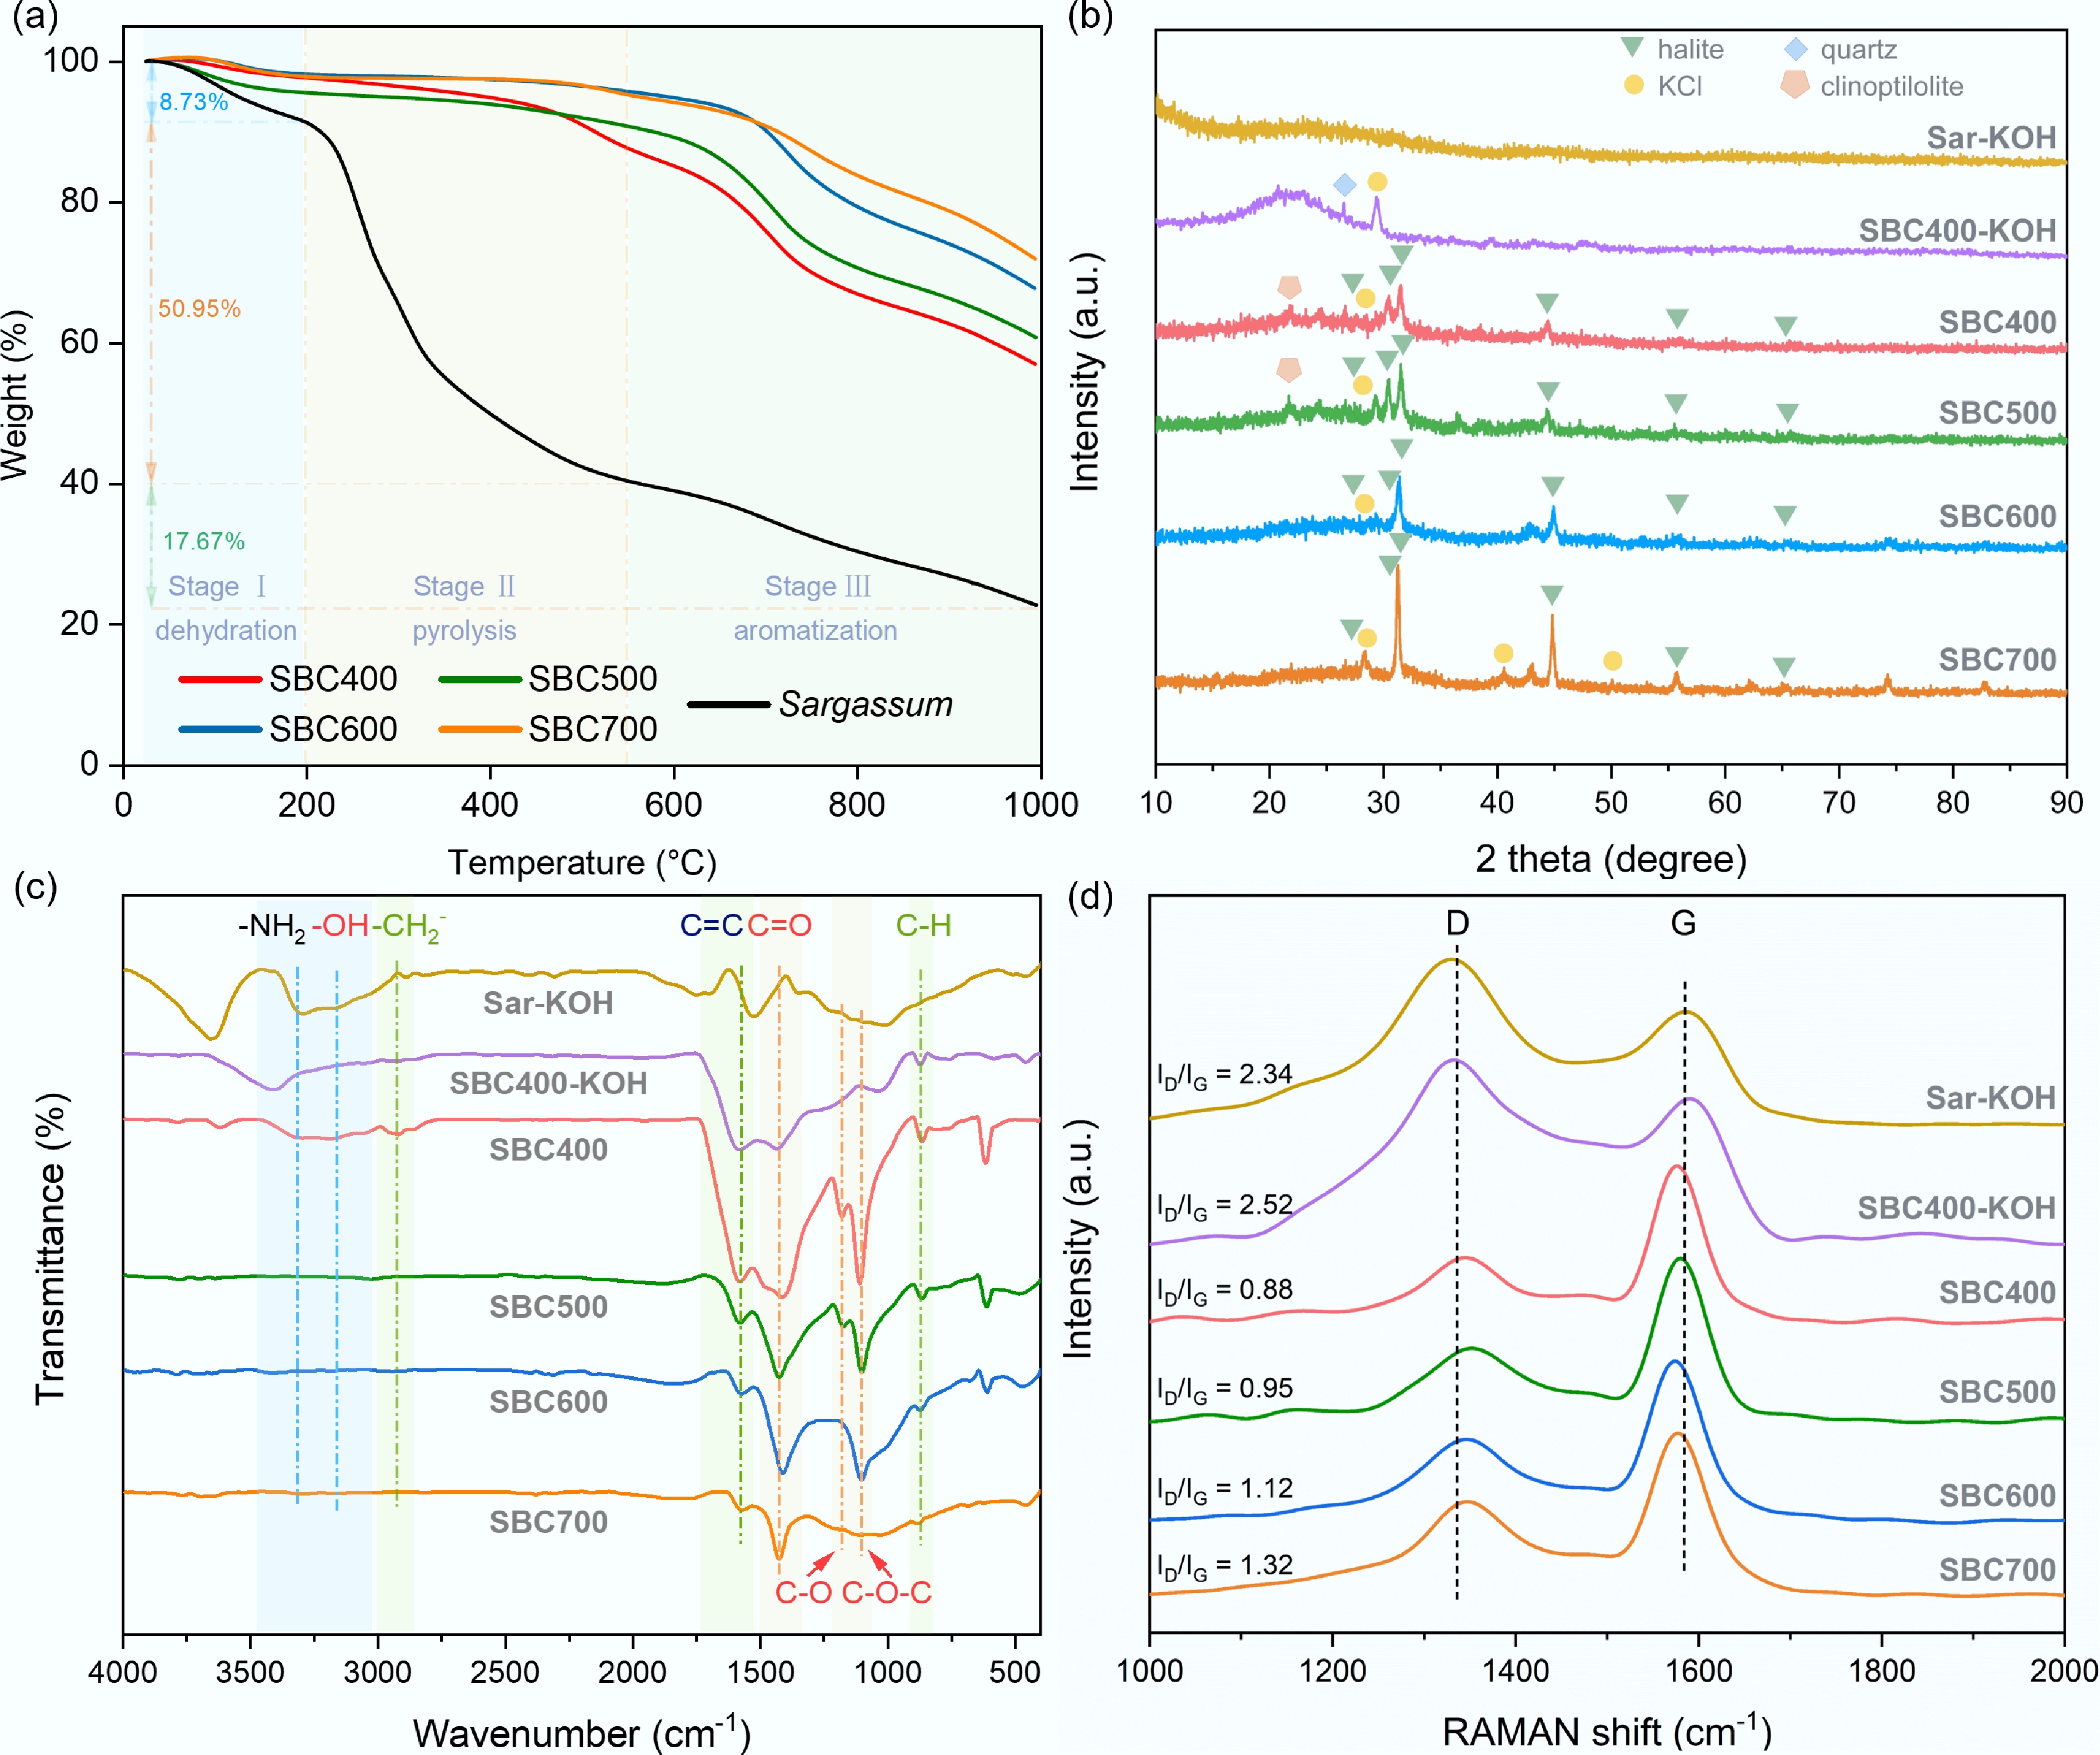
Figure 2.
(a) TGA curves of S. tenerrimum and its biochars; (b) XRD image, (c) FTIR pattern, and (d) Raman spectra of SBC400, SBC500, SBC600, SBC700, SBC400-KOH, and Sar-KOH.
-
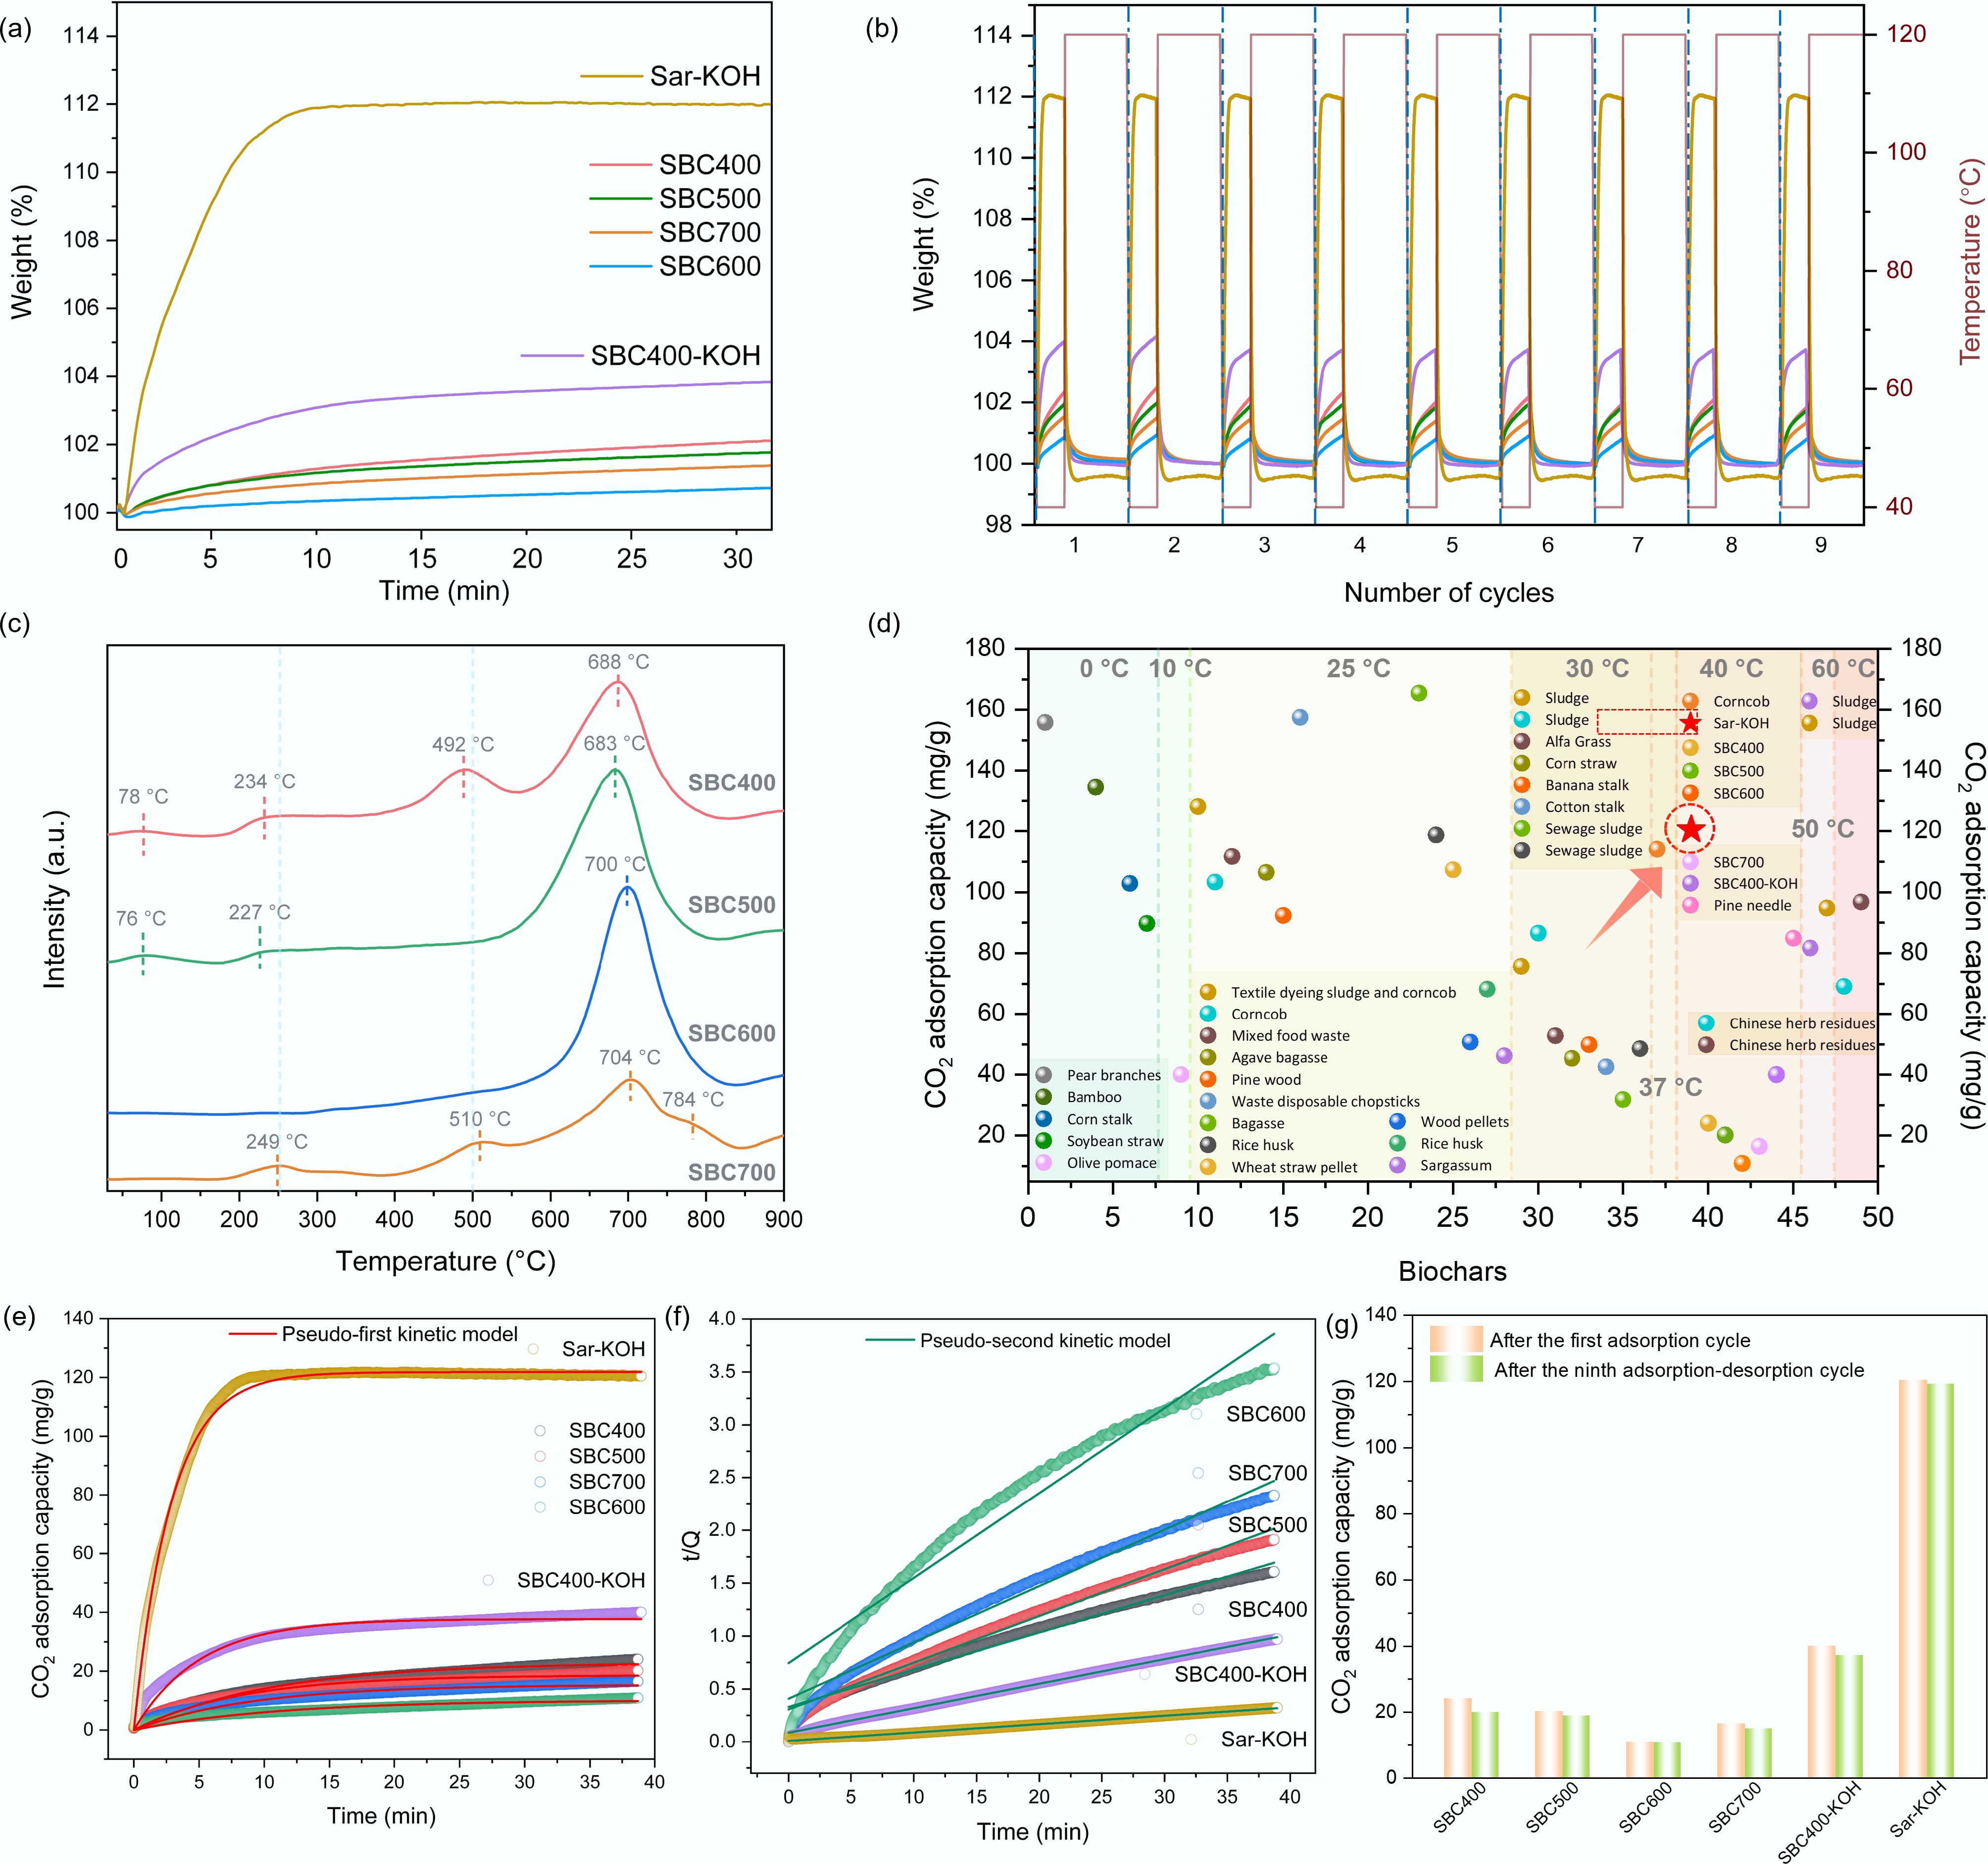
Figure 3.
(a) CO2 adsorption capacity and (b) adsorption cycle stability of biochars. (c) CO2-TPD profile of SBC400, SBC500, SBC600, and SBC700. (d) Comparison of the CO2 adsorption capacities of some reported biochars. (e) Pseudo-first-order kinetic adsorption curves and (f) pseudo-second-order kinetic adsorption curves of biochars for CO2. (g) CO2 adsorption capacity of biochars after the first adsorption cycle and after the ninth adsorption–desorption cycle.
-
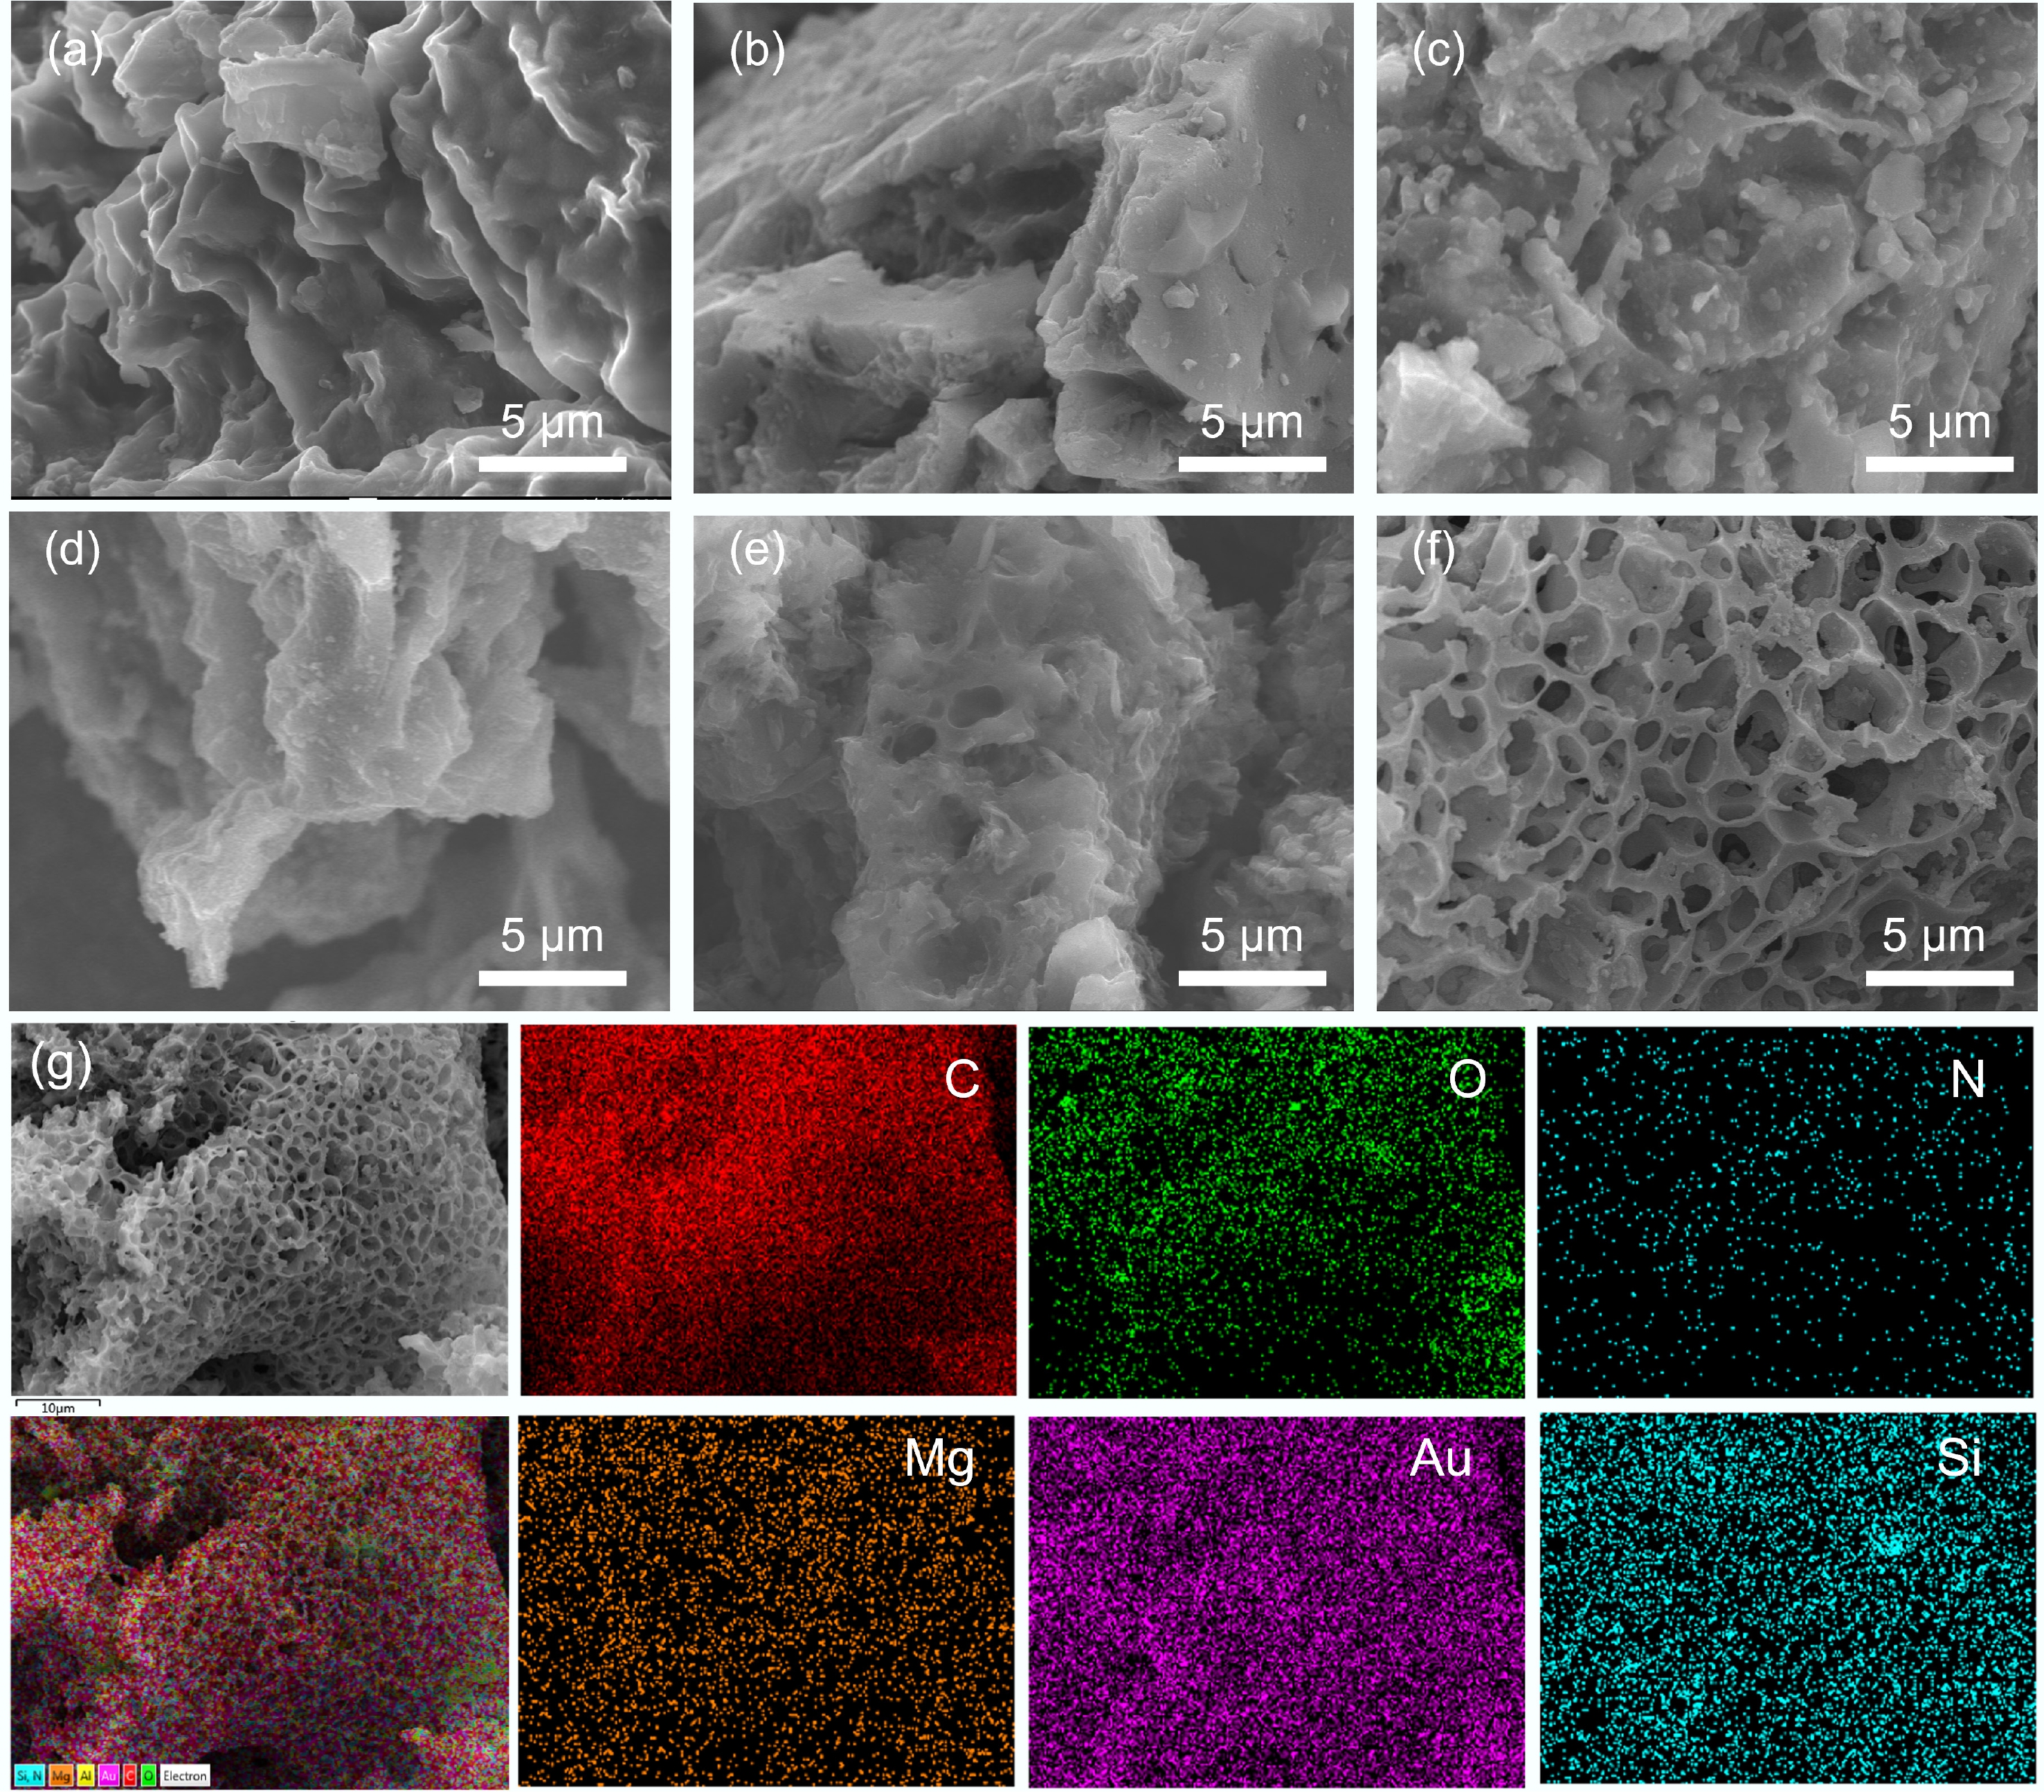
Figure 4.
SEM images of (a) SBC400, (b) SBC500, (c) SBC600, (d) SBC700, (e) SBC400-KOH, and (f) Sar-KOH. (g) SEM EDS and elemental mapping images of C, O, N, Mg, Au, and Si in Sar-KOH.
-
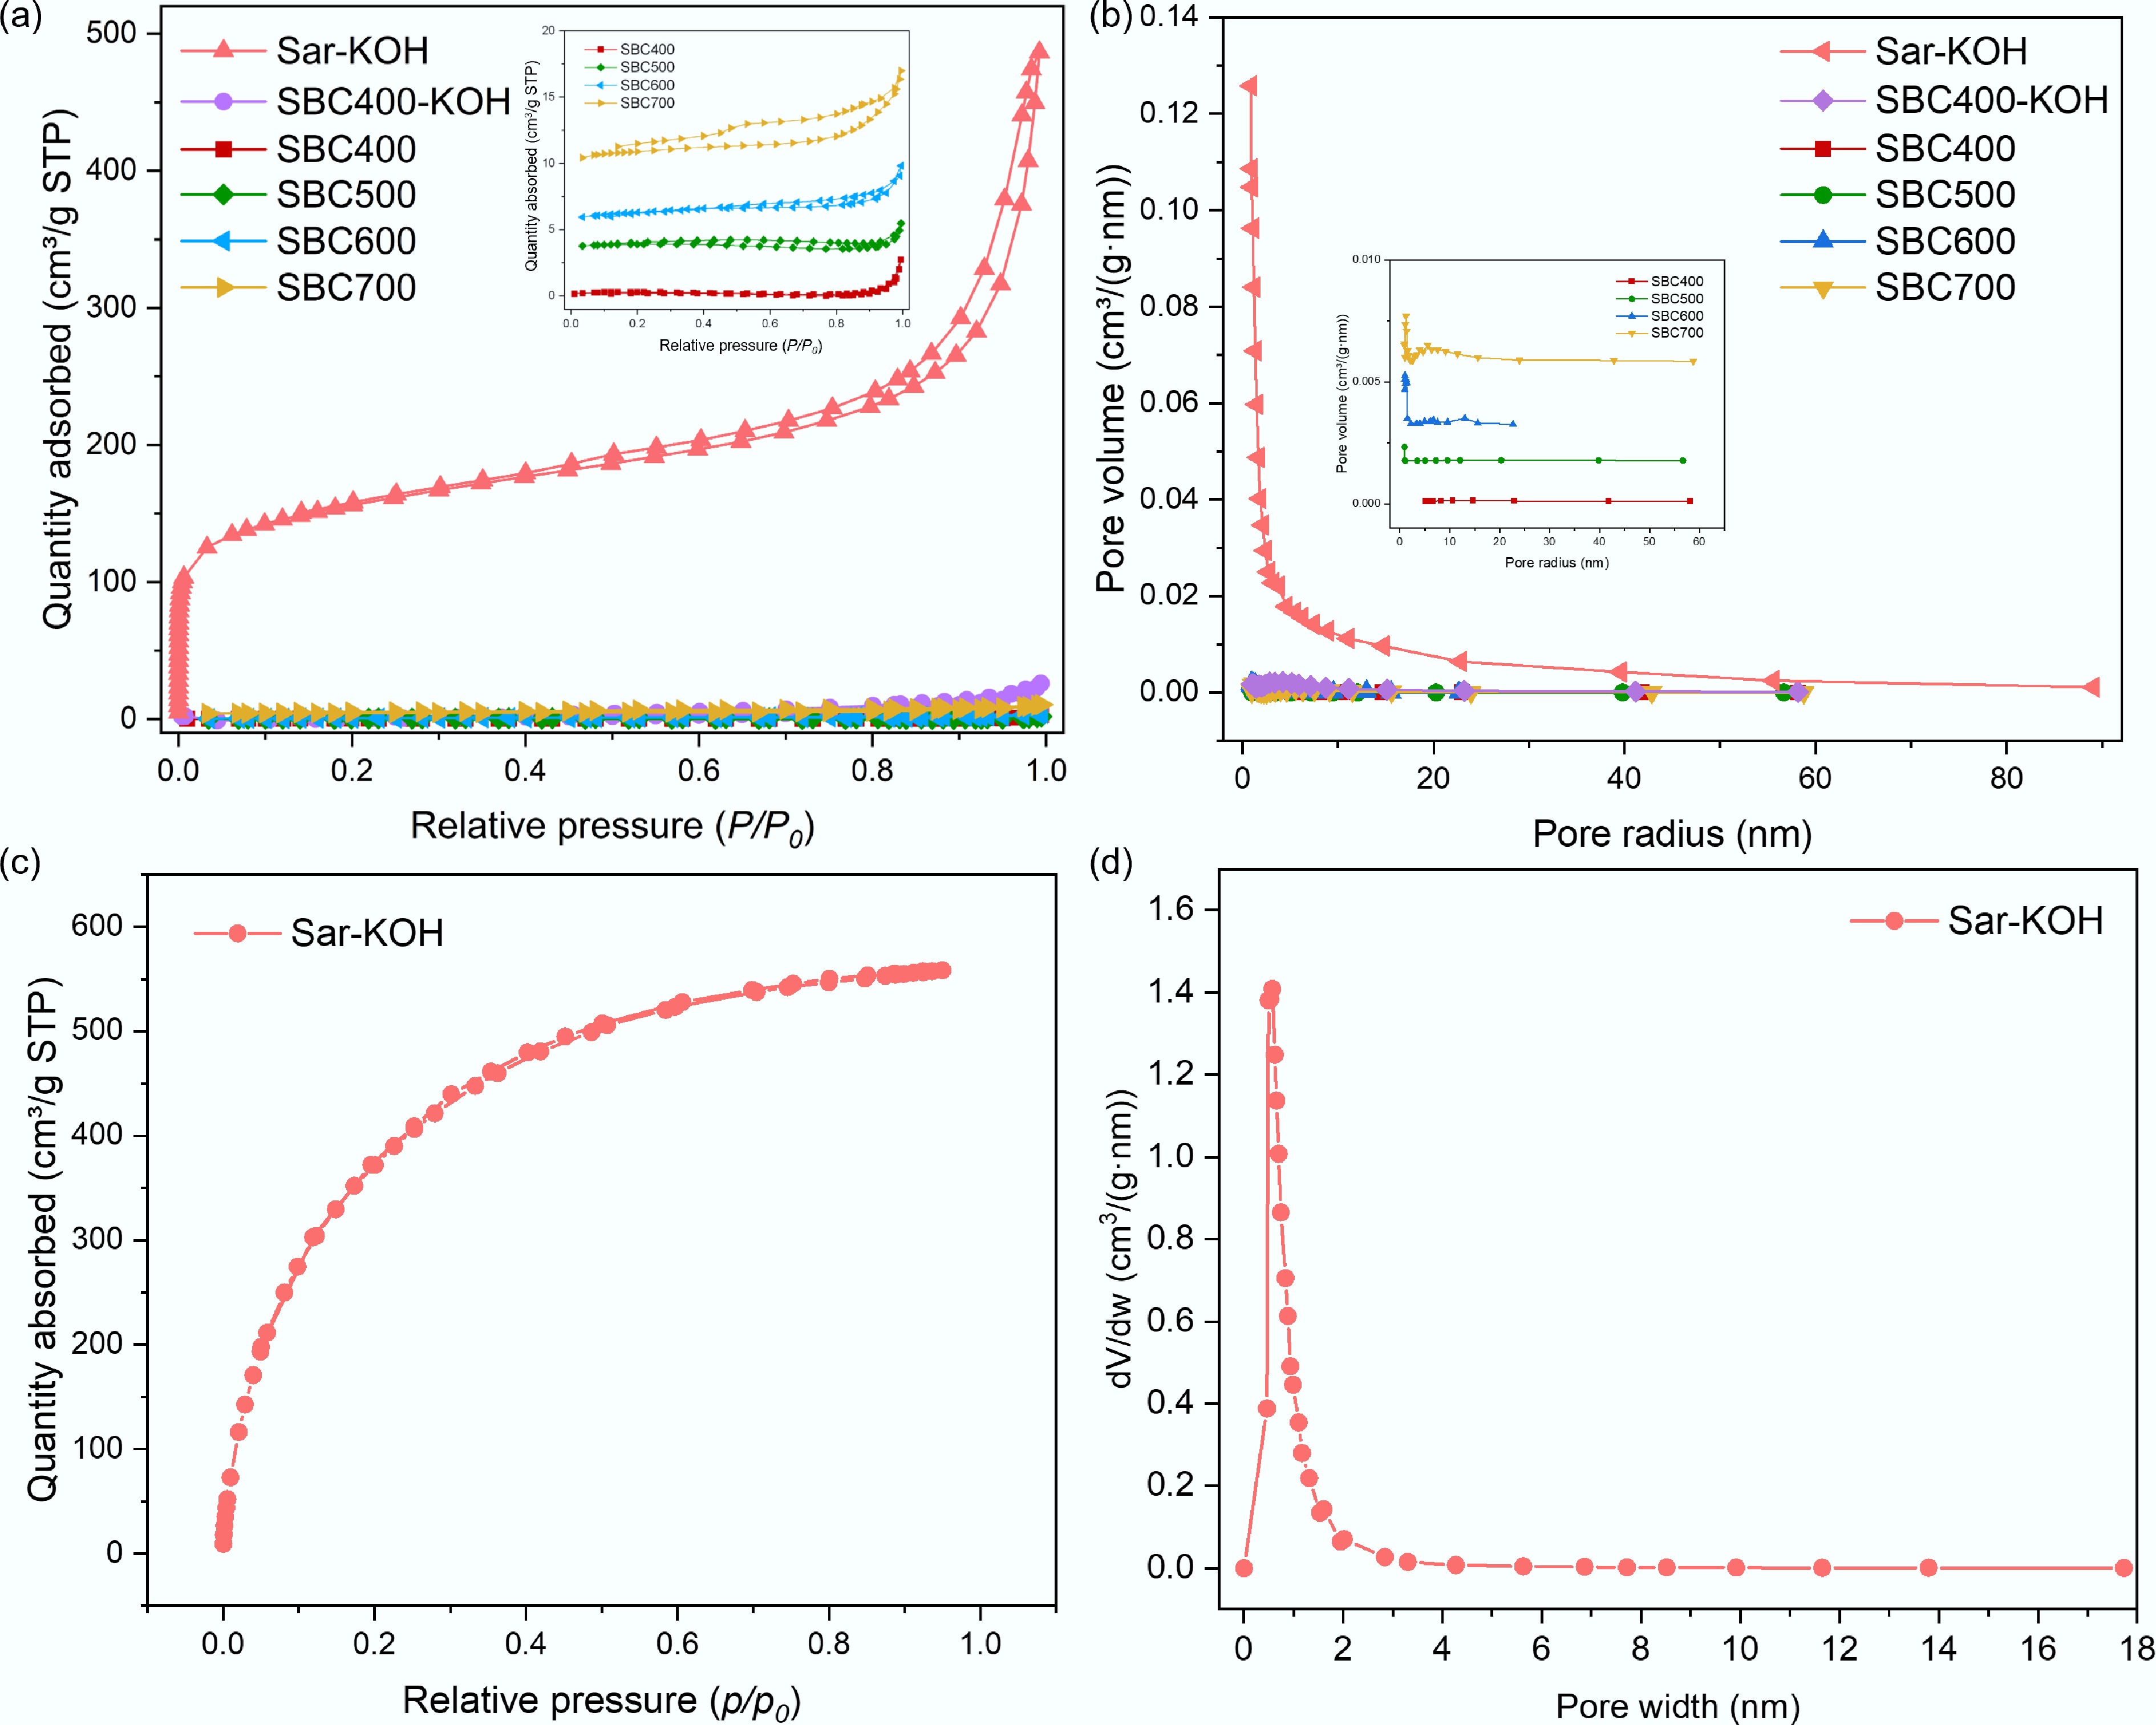
Figure 5.
(a) N2 adsorption–desorption isotherms and (b) pore size distributions of SBC400, SBC500, SBC600, SBC700, SBC400-KOH, and Sar-KOH. (c) CO2 adsorption–desorption isotherm at 273 K and (d) the pore size distribution of Sar-KOH.
-
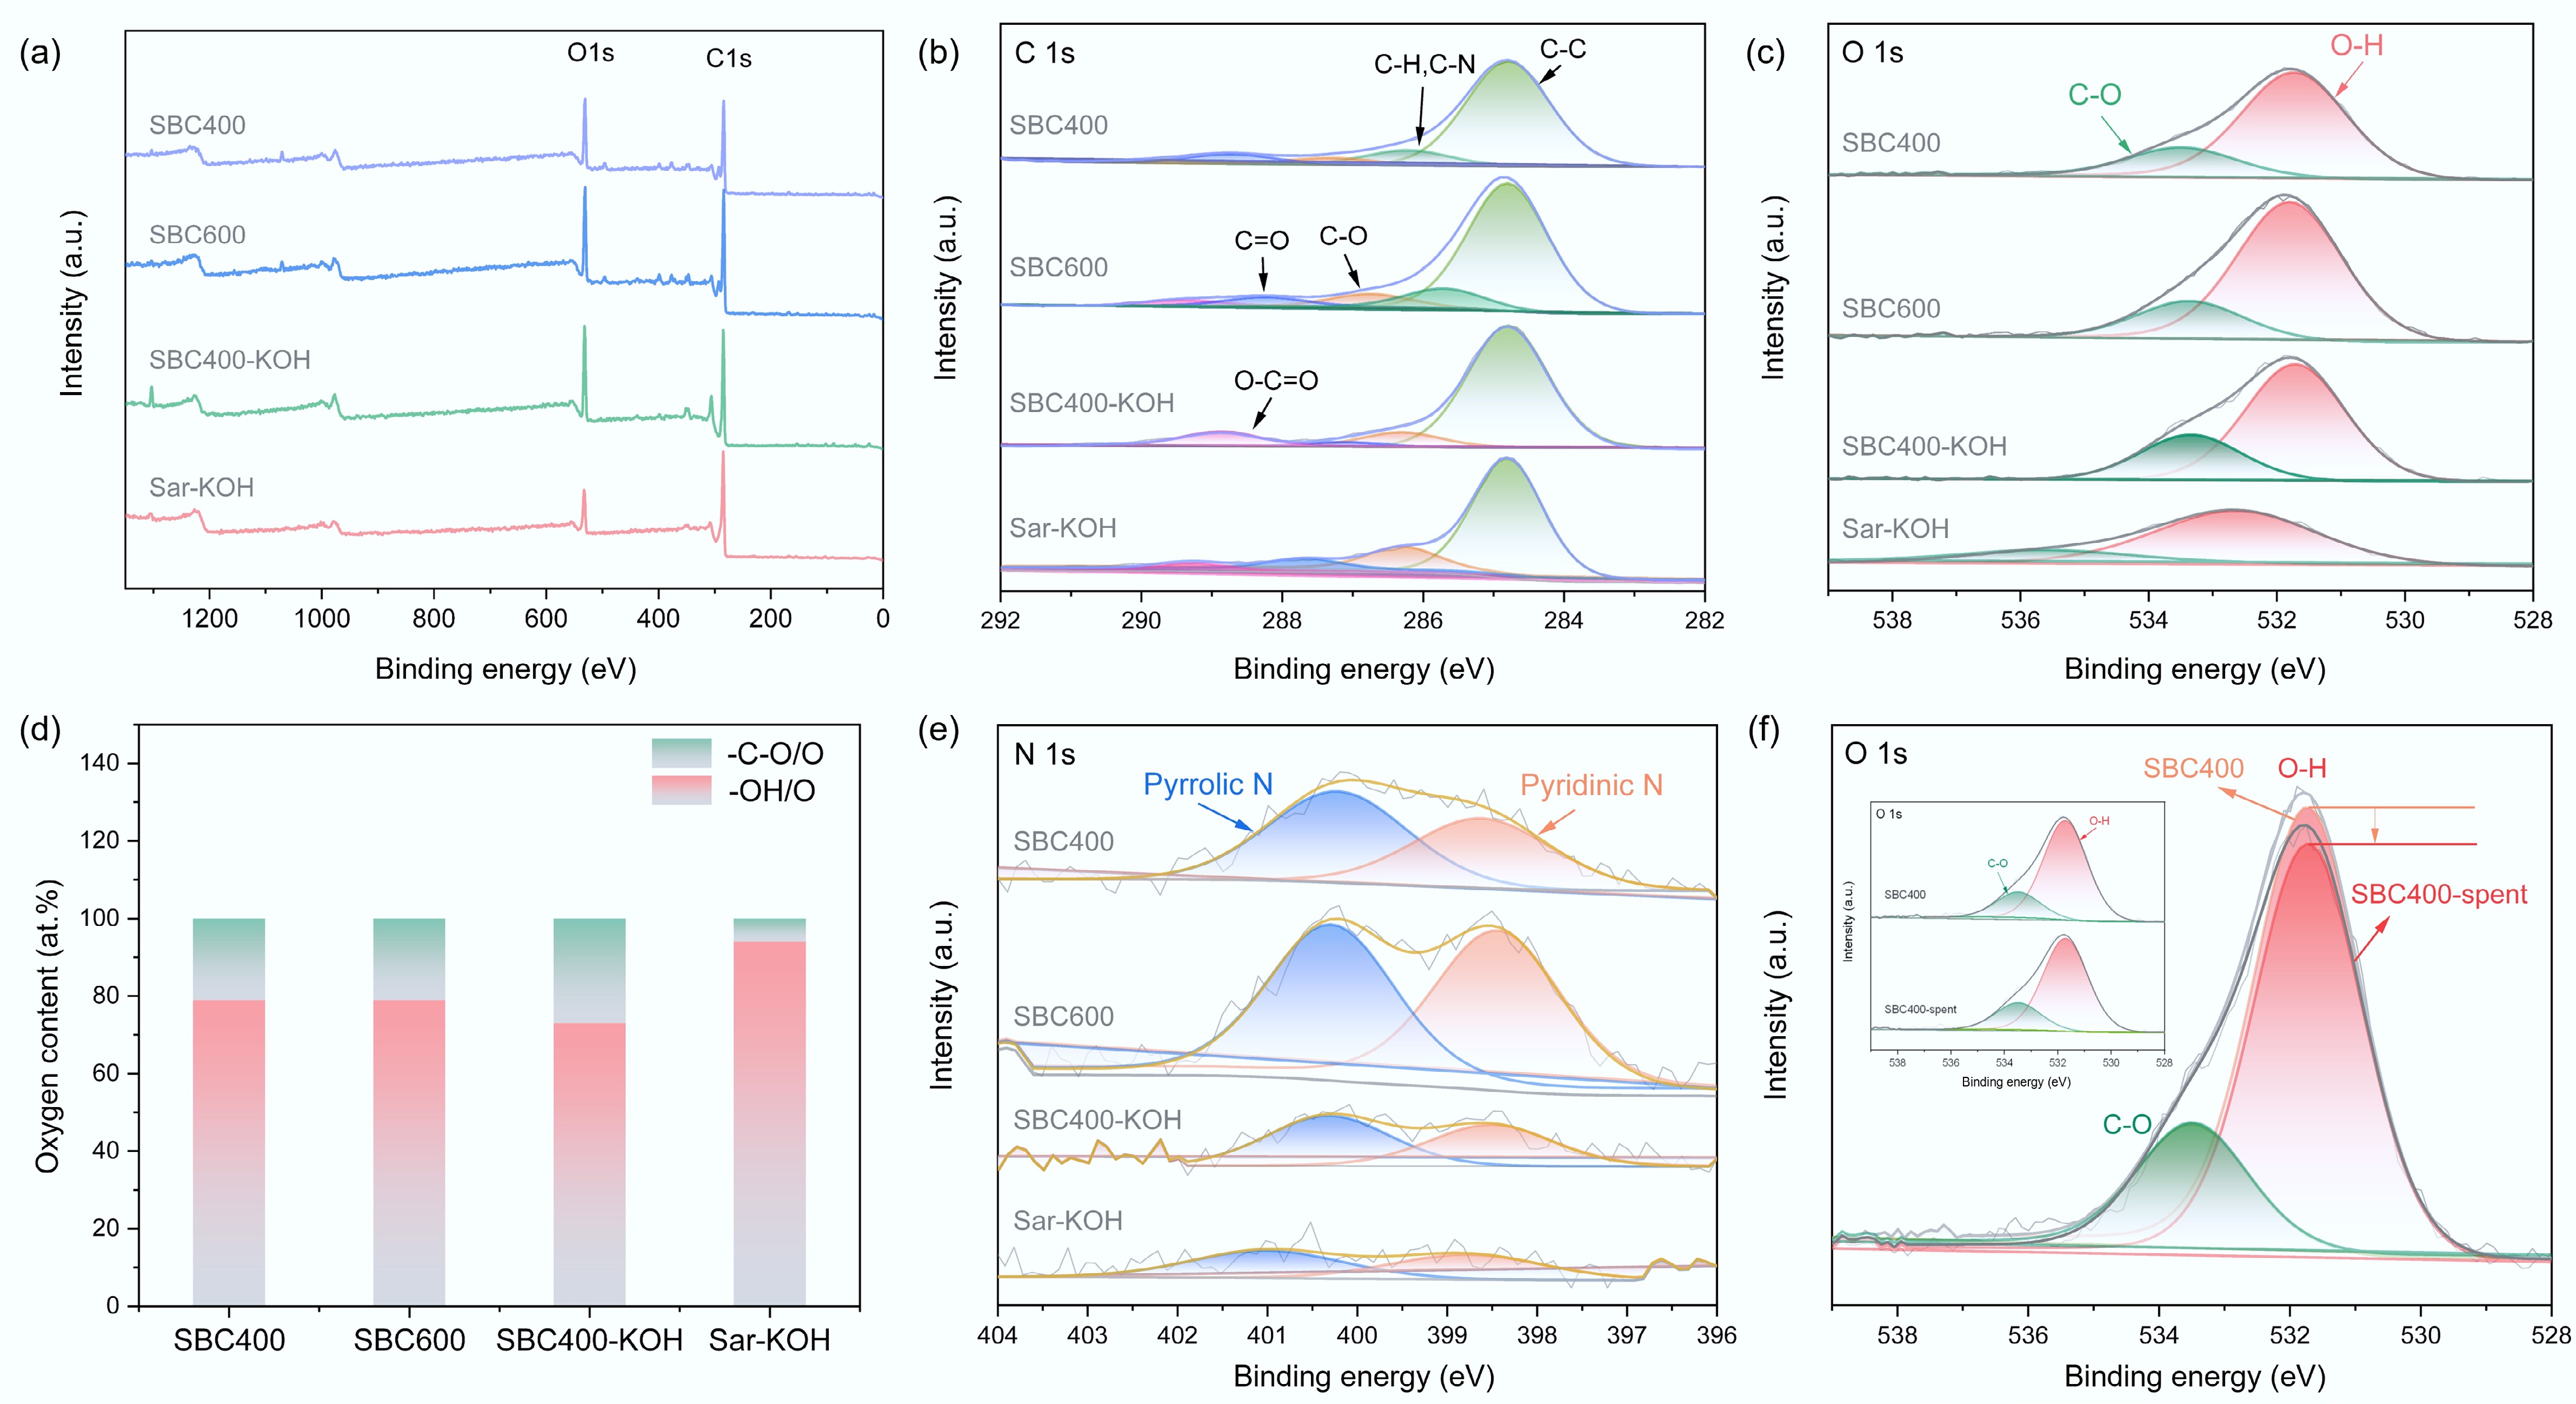
Figure 6.
(a) XPS survey spectra and typical (b) C 1s, (c) O 1s spectra. (d) Relative content of –C–O and –OH groups. (e) N 1s spectra of SBC400, SBC600, SBC400-KOH, and Sar-KOH and (f) O 1s spectra of SBC400 before and after CO2 adsorption.
-
Sample SBC400 SBC500 SBC600 SBC700 SBC400-KOH Sar-KOH Specific Surface Area determined by the BET method (SBET) (m2/g) 1.14 1.37 2.61 17.11 9.64 569.66 CO2 adsorption capacity (mg/g) 24.1 20.2 10.9 16.5 40.0 120.5 Loss of adsorption capacity after 9 cycles (%) 17.0 6.4 2.8 8.5 7.0 1.1 Table 1.
Textural parameter and CO2 adsorption capacities of the biochars
-
Sample Pseudo-first order model Pseudo-second order model $ {q}_{t}={q}_{e}(1-{\text{e}}^{-{{k}_{1}}t}) $ $ q_t=t\times k_2\times q_e^2/(1+q_e\times t\times k_2) $ qe (mg/g) k1 (1/min) R2 qe (mg/g) k2 (g/(mg·min)) R2 SBC400 22.96 0.095 0.965 28.425 0.004 0.984 SBC500 18.65 0.123 0.940 22.650 0.006 0.989 SBC600 10.18 0.090 0.892 12.427 0.009 0.957 SBC700 15.41 0.111 0.930 18.779 0.007 0.982 SBC400-KOH 37.74 0.199 0.962 43.103 0.006 0.999 Sar-KOH 121.83 0.351 0.994 125.786 0.008 0.997 Table 2.
Adsorption kinetic parameters of CO2 on biochar at 40 °C
-
Process Parameter Value Feedstock Carbon content in biochar
Biochar yield from Sargassum tenerrimum pyrolysis~50% (mass basis)
~50% by massPyrolysis and activation[61] Thermal demand at 400 °C ~2.8 MJ/kg biomass Regeneration[61] Energy for CO2 desorption ~0.2 MJ/kg CO2 Transport Biomass delivery (truck, 50 km) ~0.1 MJ/ton km Energy mix[62] Grid emission factor (Qinghai, China) 0.41 kg CO2-eq/kwh Table 3.
Lifecycle inventory
Figures
(6)
Tables
(3)