-
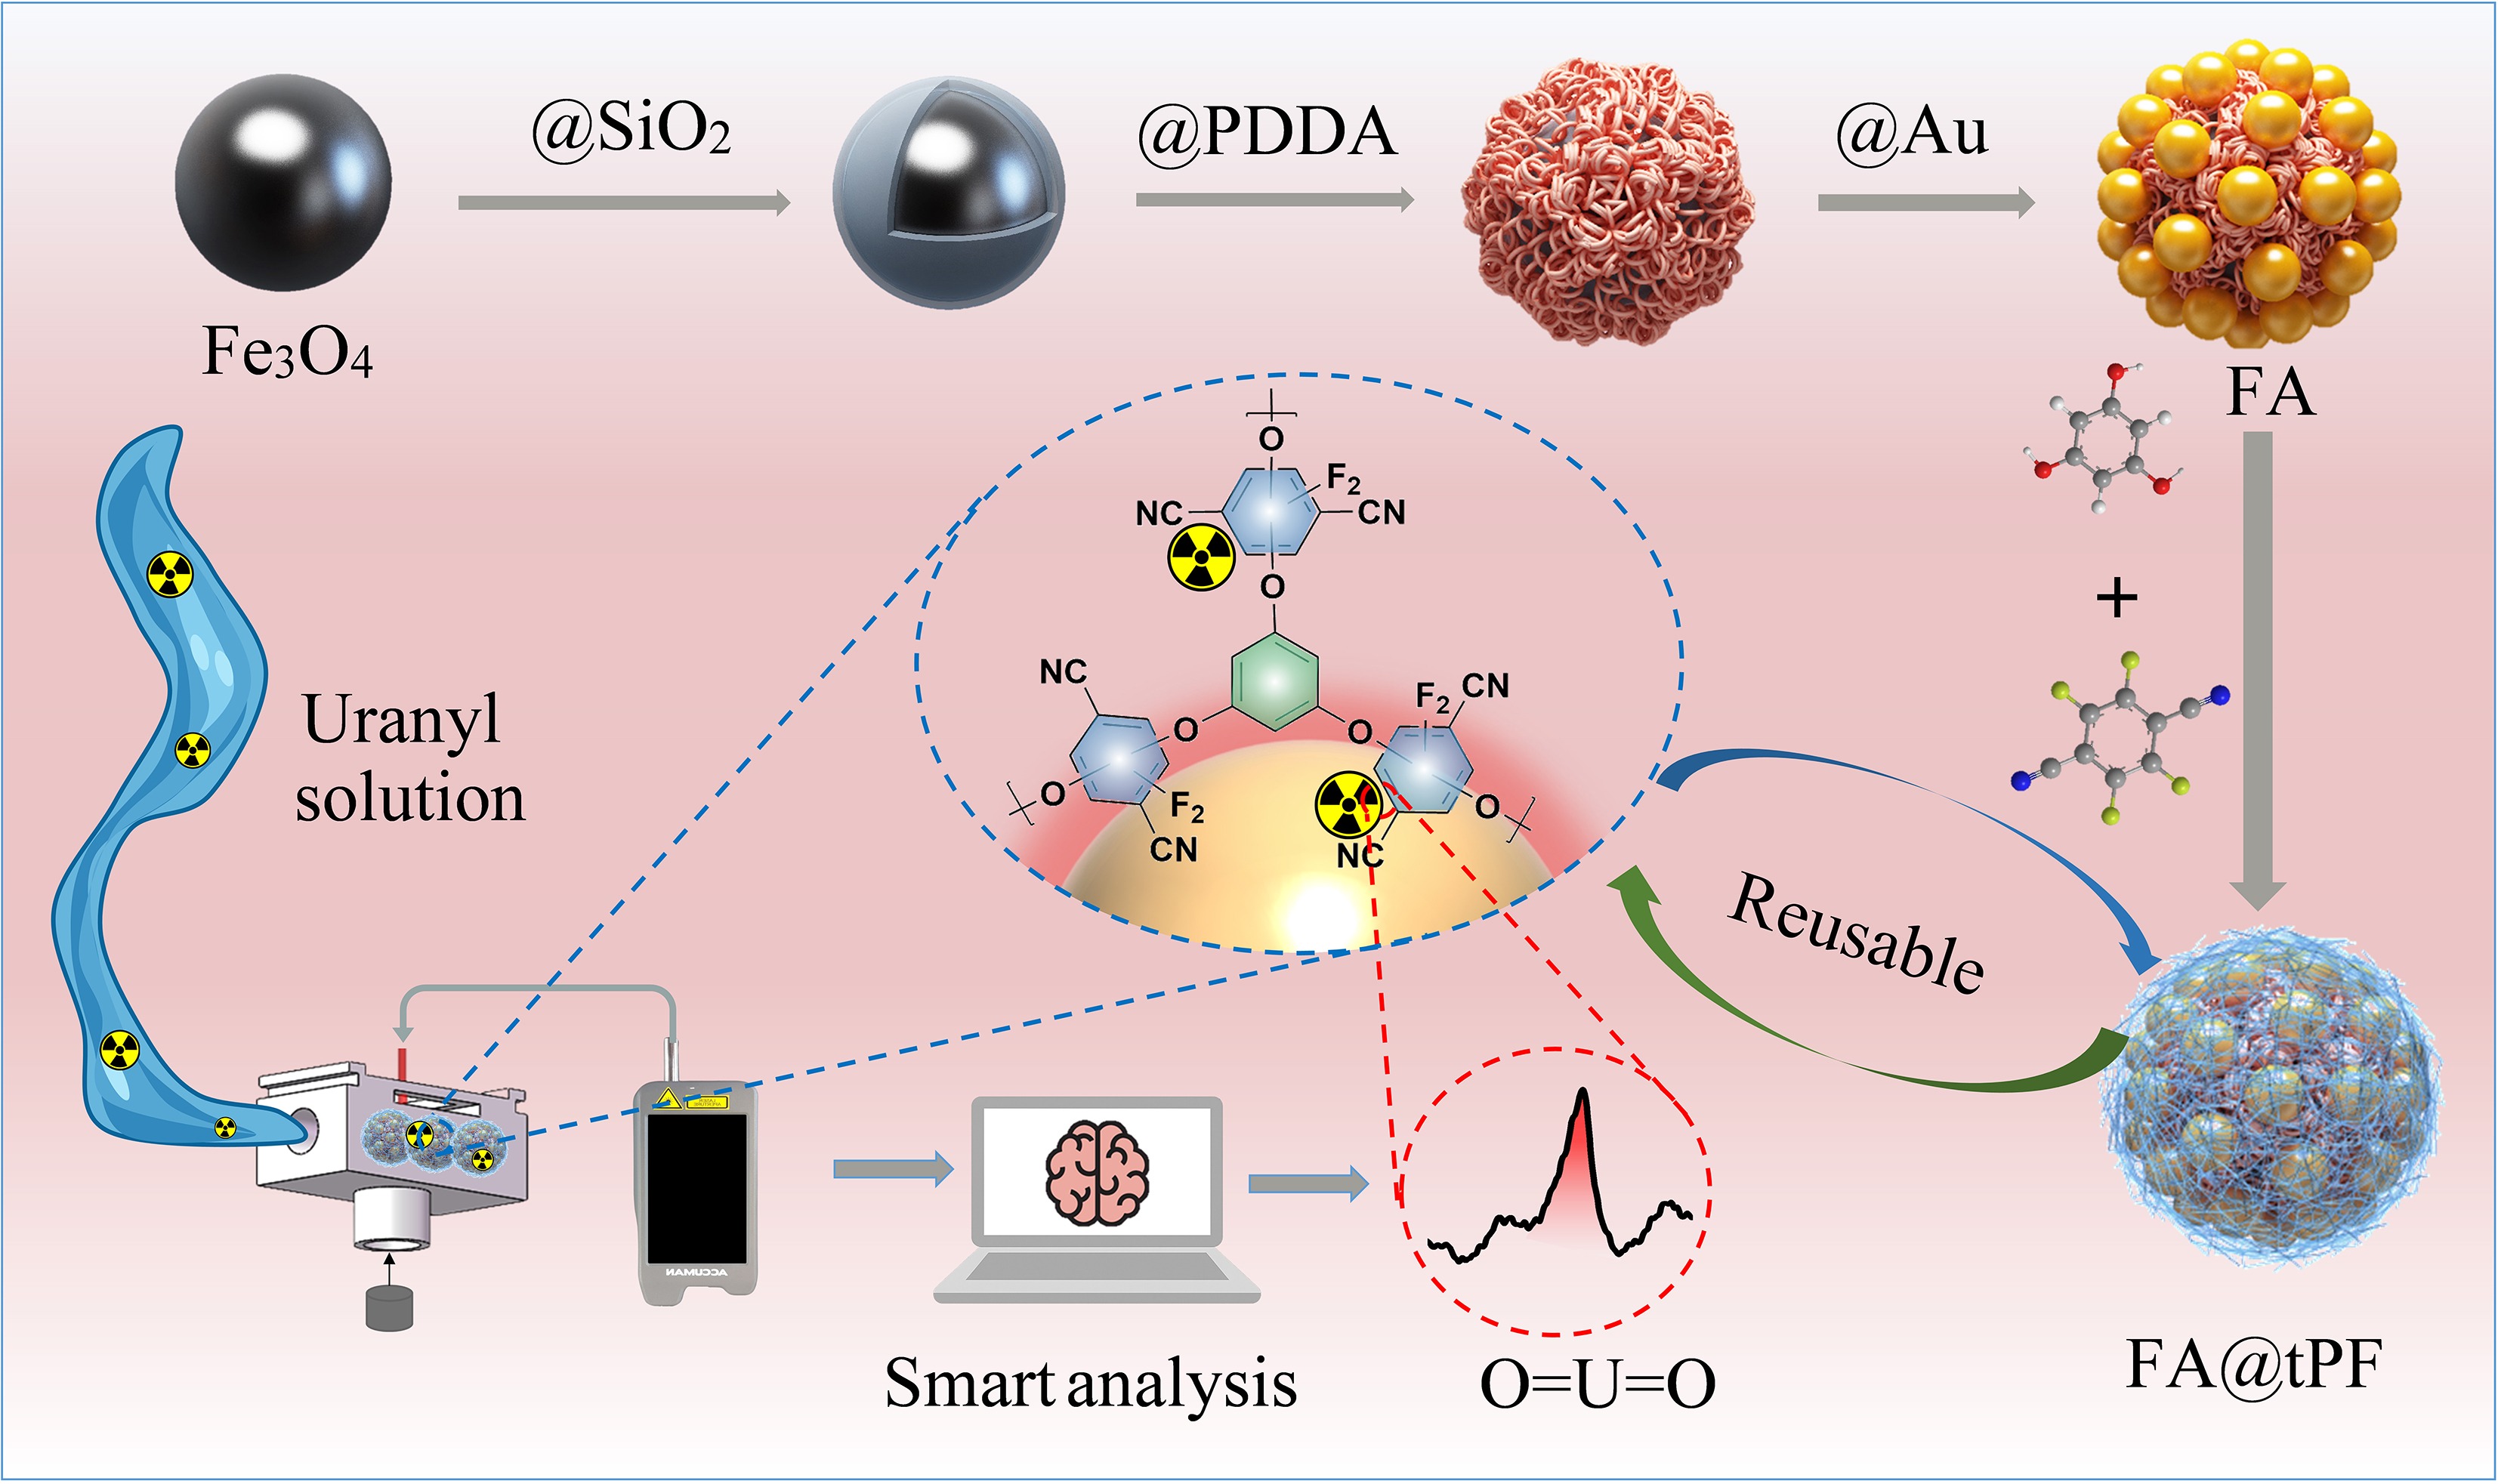
Figure 1.
Schematic representation of the synthesis and detection process of the FA@tPF nanocomposite. Fe3O4 nanoparticles were sequentially modified with SiO2, PDDA, Au, and tPF ligands. The composite enables uranyl ion adsorption, Na2CO3-assisted regeneration, portable SERS detection, and machine-learning based spectral analysis.
-
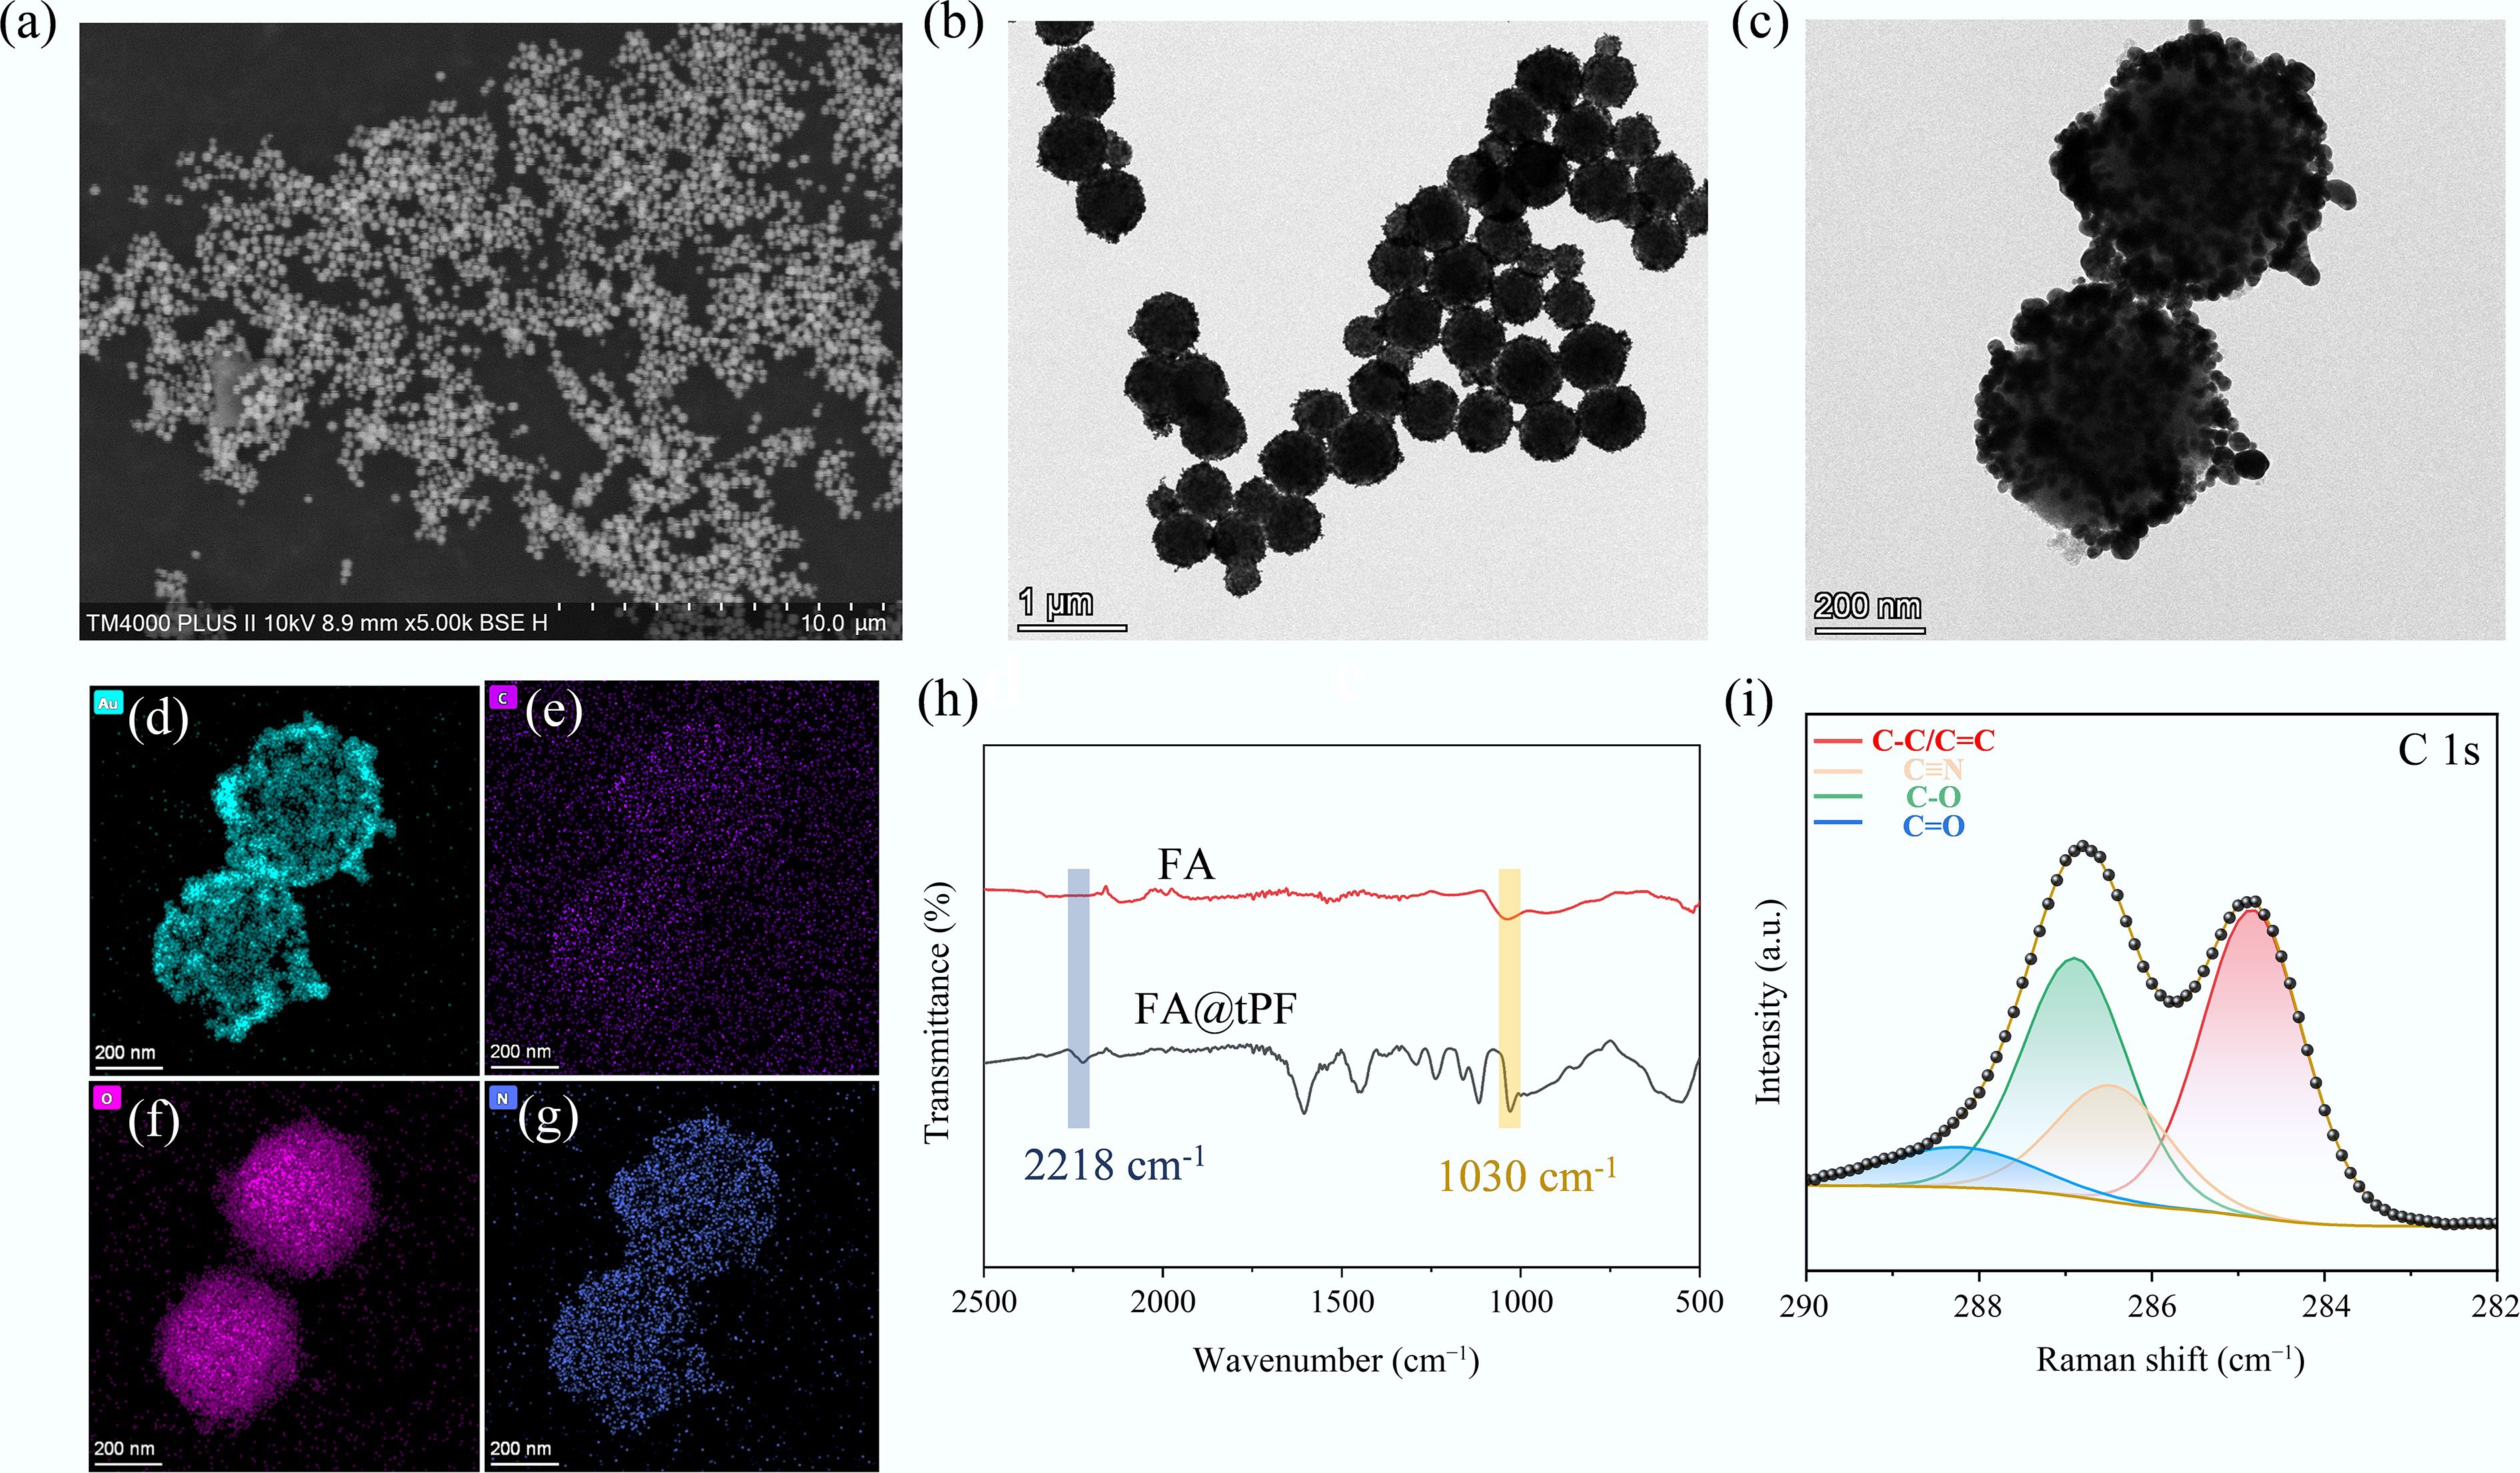
Figure 2.
(a) SEM image of Fe3O4@SiO2; (b), (c) TEM images of FA, and FA@tPF substrates; (d)–(g) TEM image of FA@tPF with elemental mappings for Au, C, O and N; (h) FT-IR spectra of FA and FA@tPF; (i) XPS spectra of FA and FA@tPF.
-
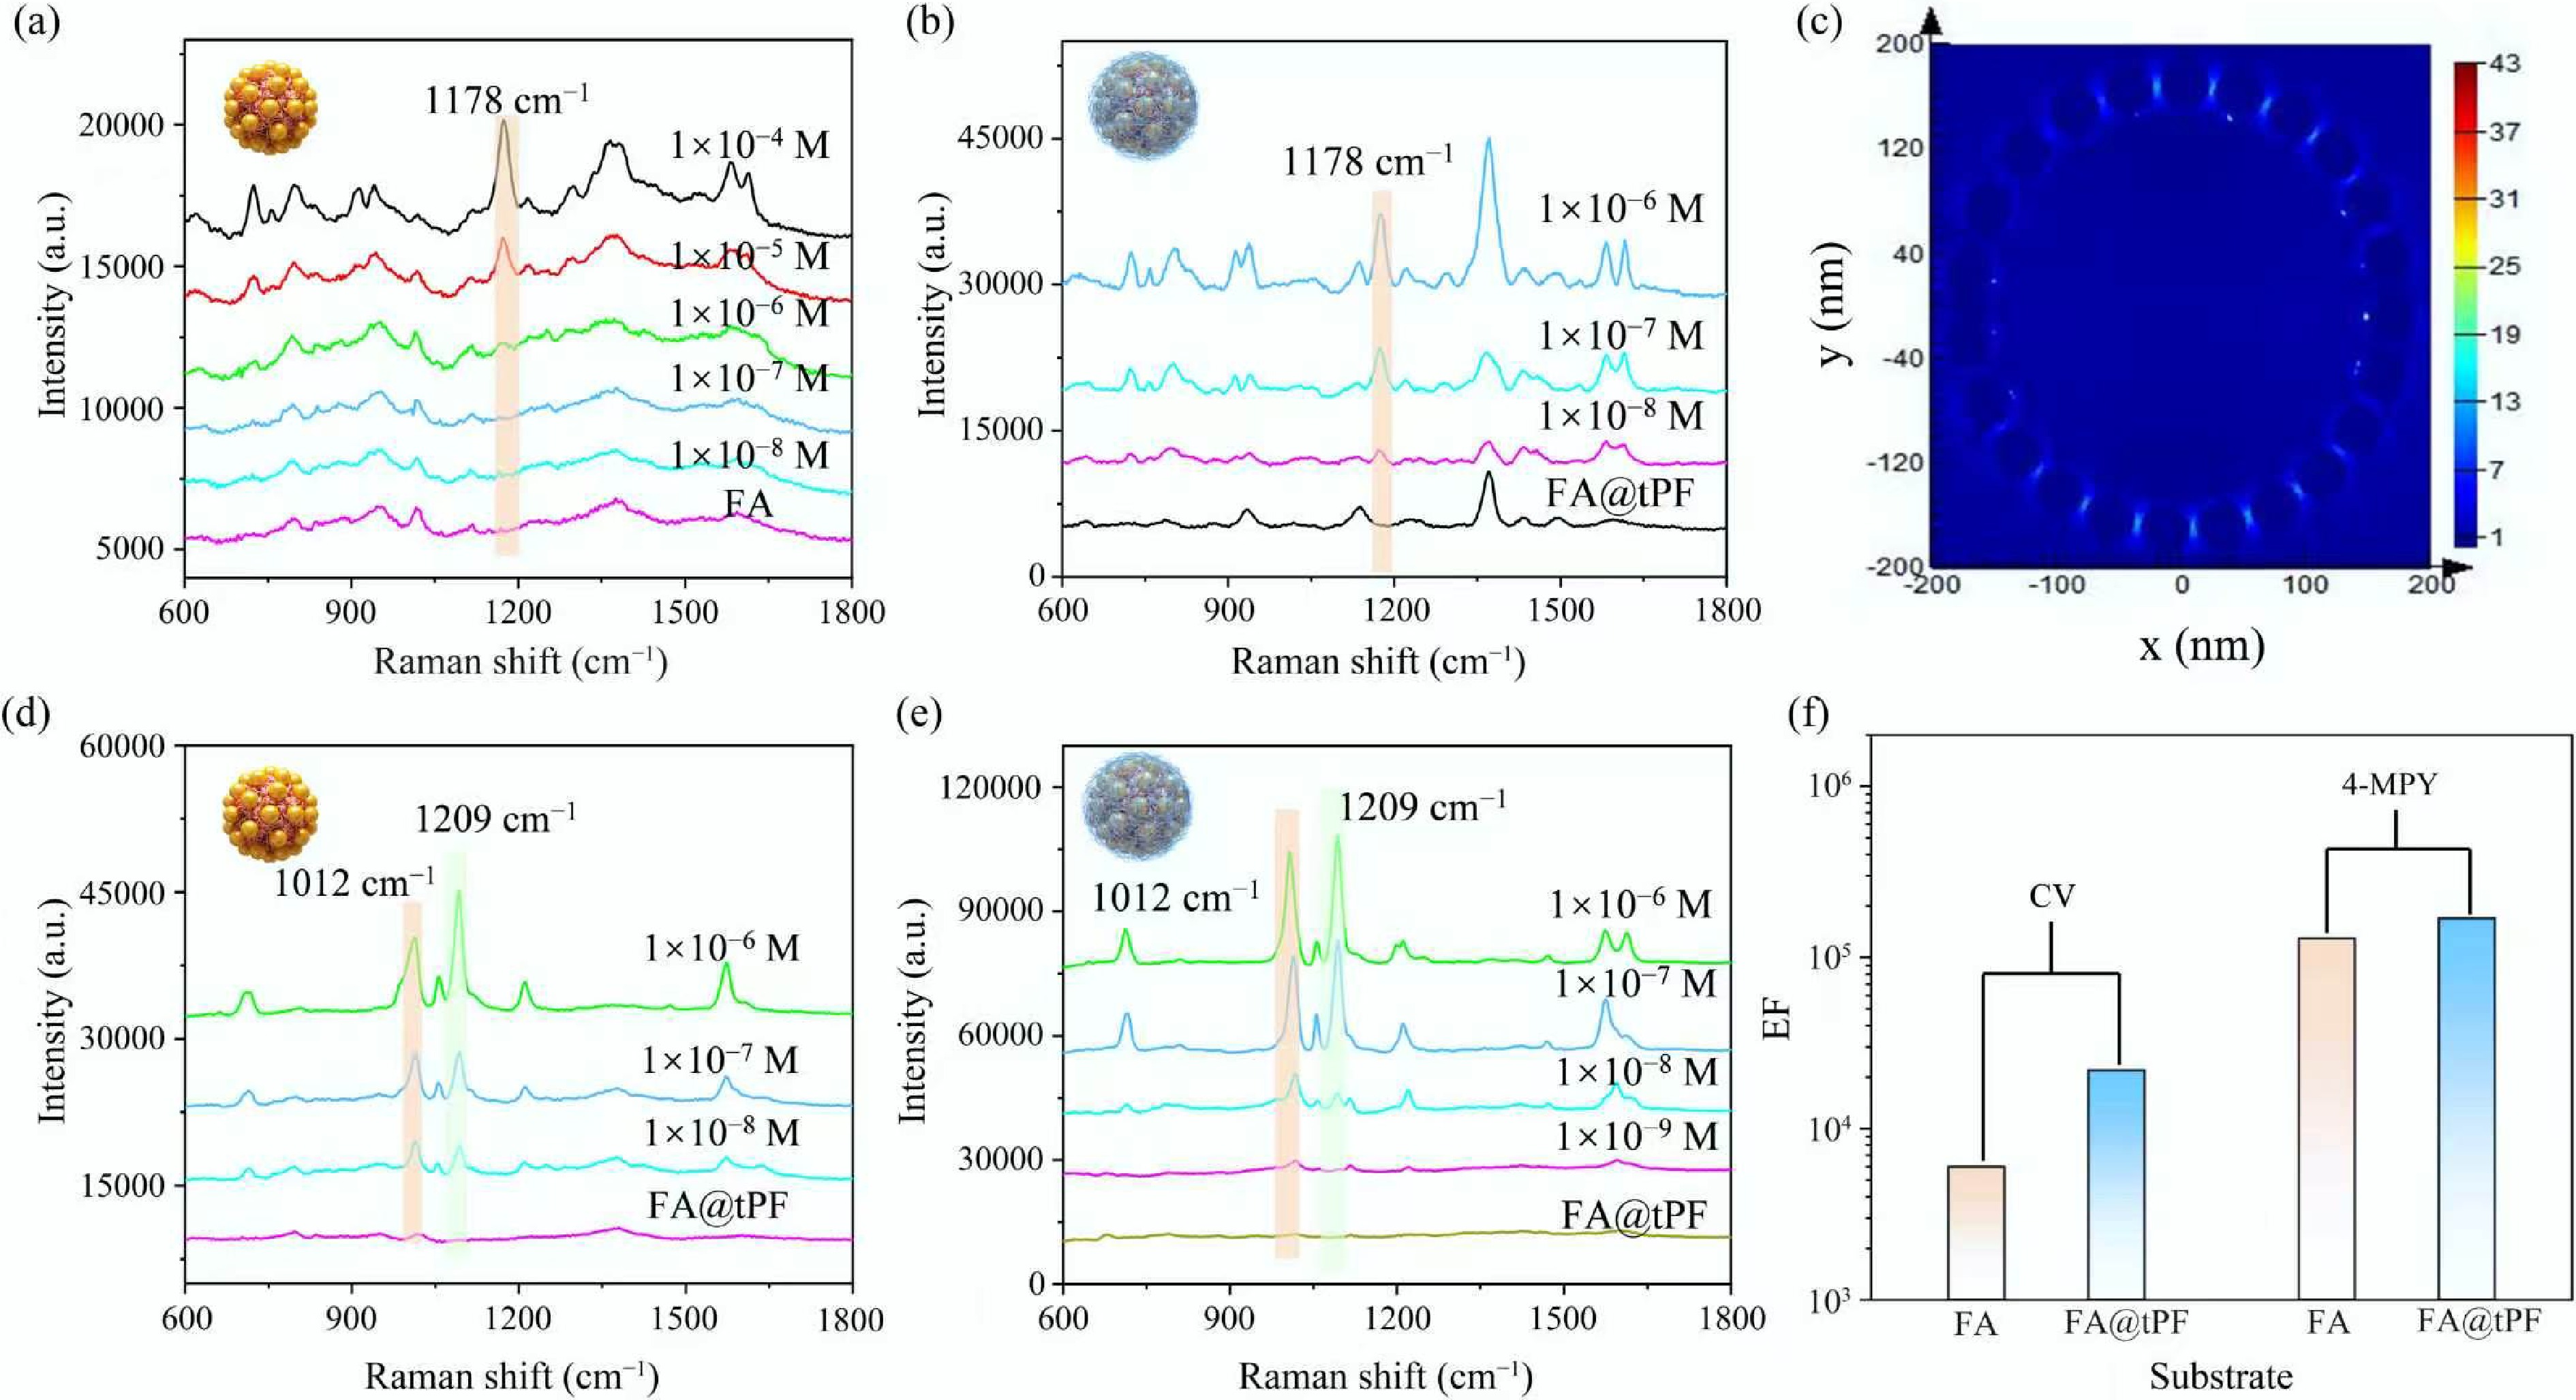
Figure 3.
(a), (b) SERS spectra of CV on FA and FA@tPF substrates at concentrations to 1 × 10⁻⁸ and 1 × 10⁻⁴ mol·L−1; (c) electromagnetic field simulation of FA; (d), (e) SERS spectra of 4-MPY on FA and FA@tPF substrates at concentrations from 1 × 10⁻⁹ to 1 × 10⁻⁶ mol·L−1; (f) enhancement factors (EF) of FA and FA@tPF for detecting CV and 4-MPY.
-
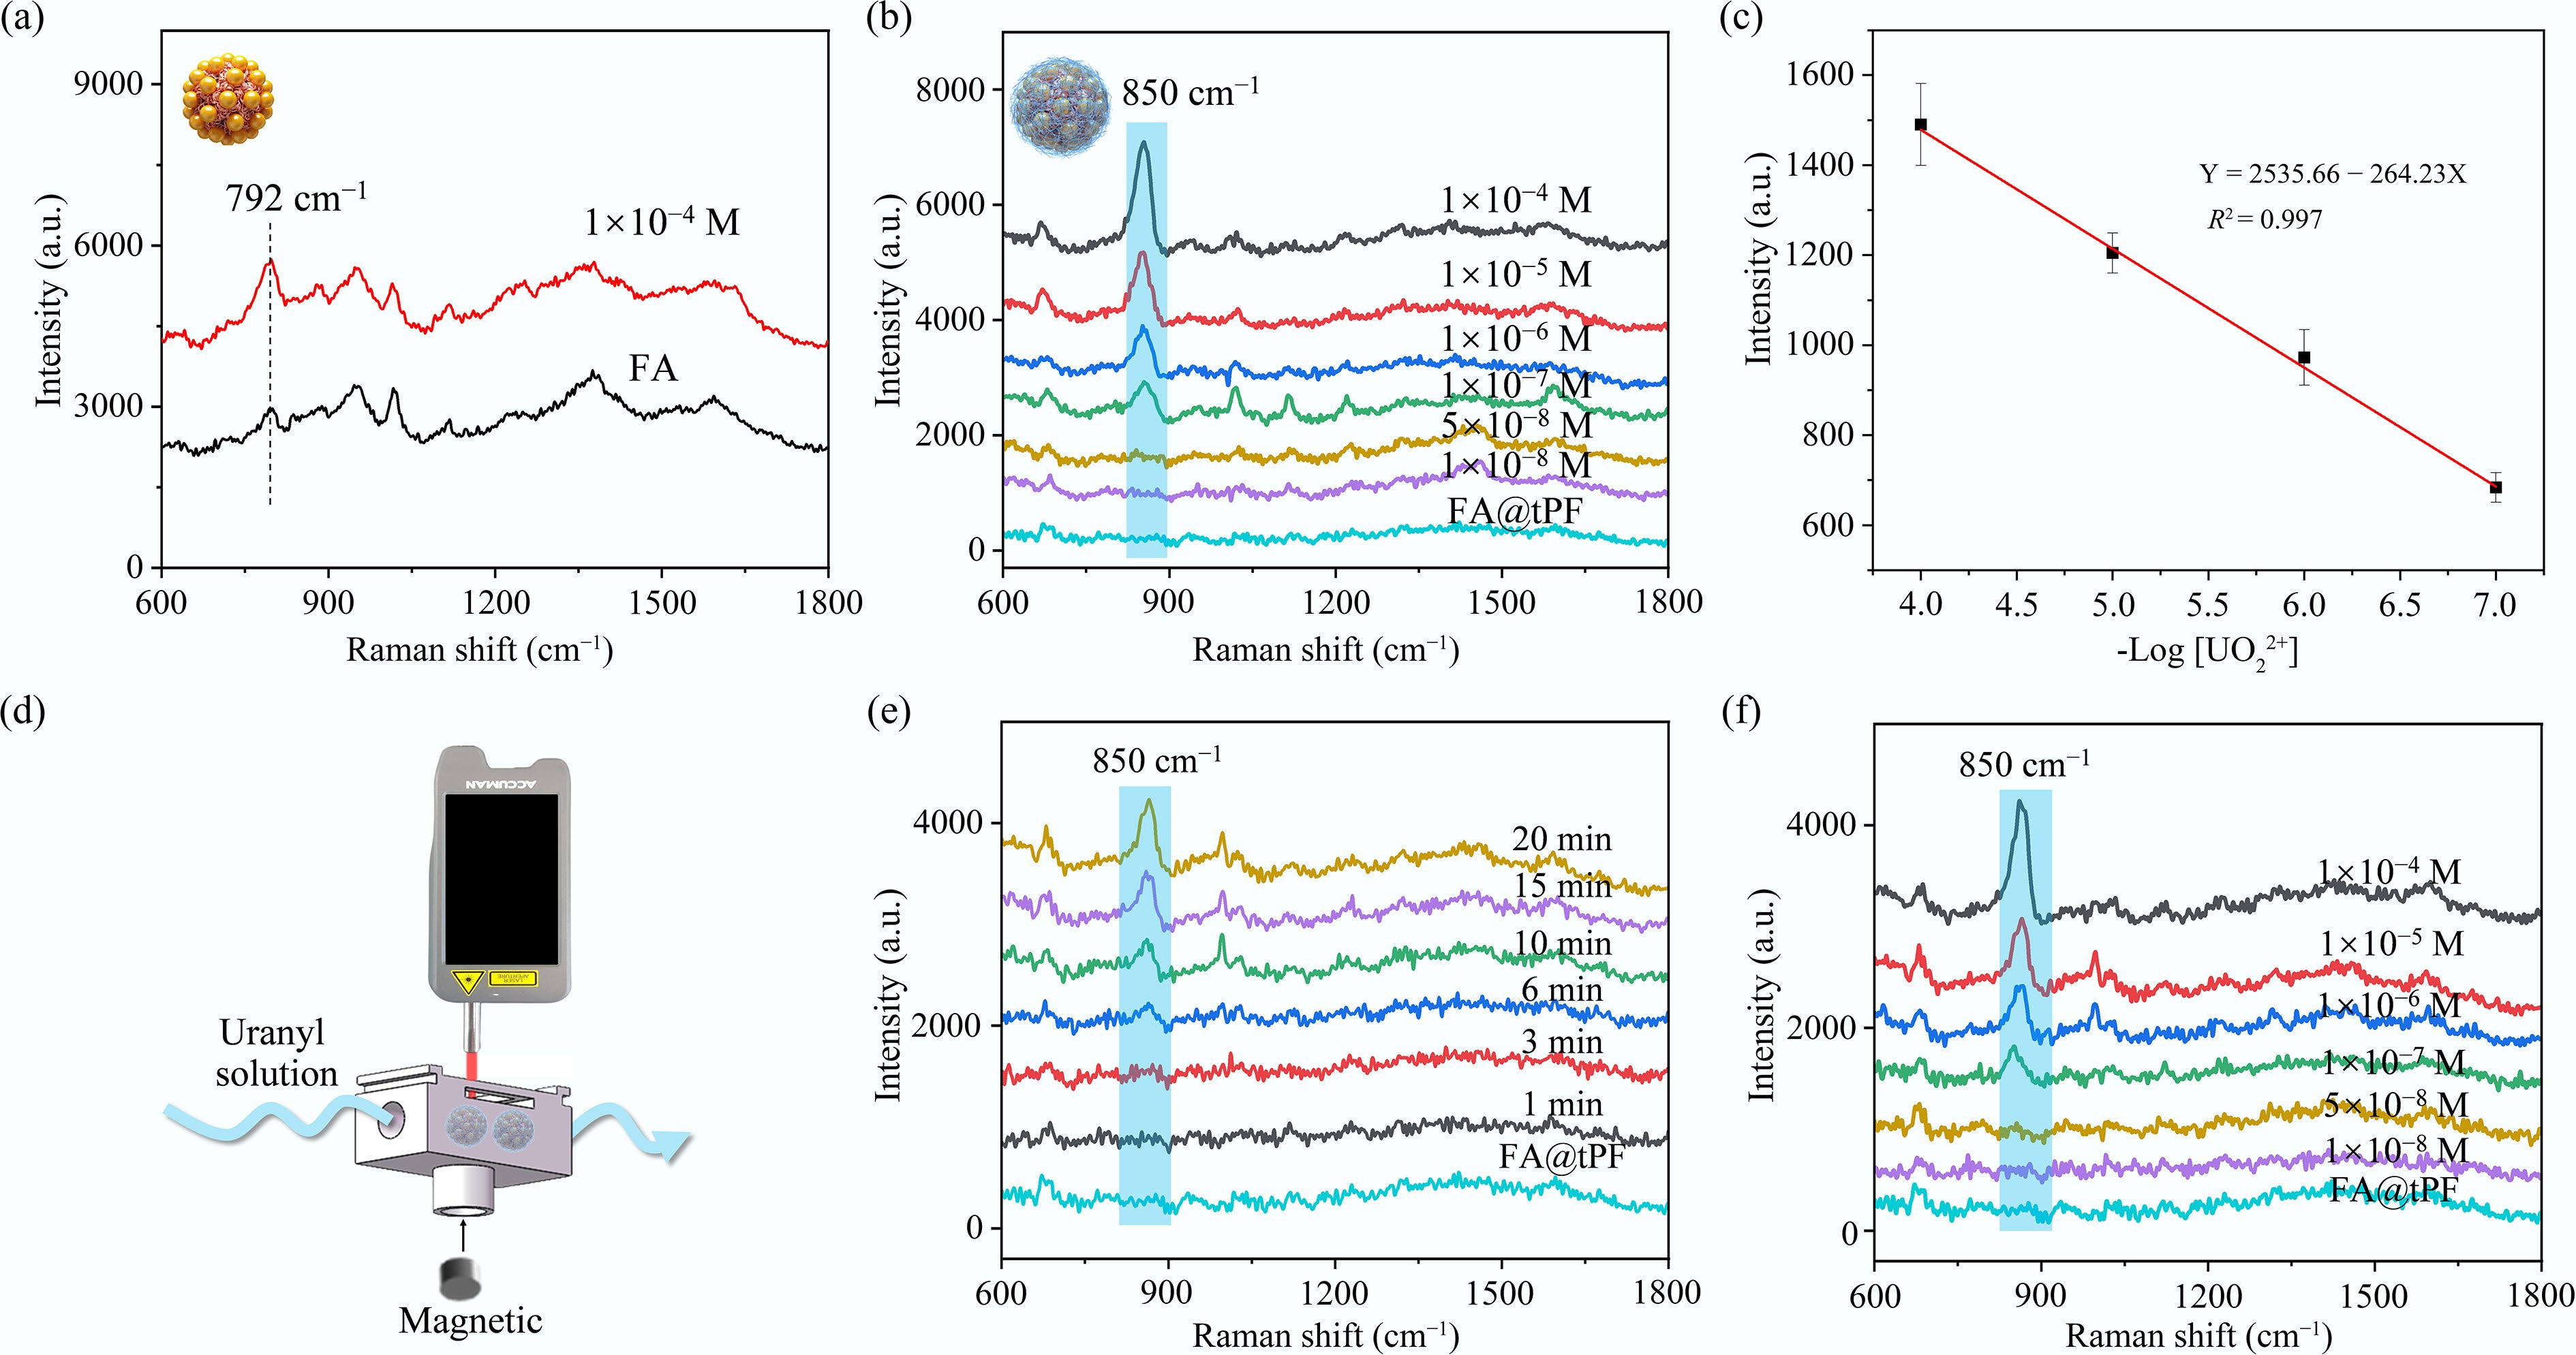
Figure 4.
(a) SERS spectra of 1 × 10⁻⁴ mol·L−1 UO22+ on FA substrates; (b) SERS spectra of uranyl ions at concentrations between 1 × 10⁻⁸ and 1 × 10⁻⁴ mol·L−1 on FA@tPF substrates; (c) linear fit for uranyl ion detection via SERS on FA@tPF; (d) schematic diagram of the flow cell; (e) Raman spectra at a concentration of 1 × 10⁻⁵ mol·L−1 as a function of flow time; (f) Raman spectra of the flow cell under flow conditions for 20 min at concentrations ranging from 1 × 10⁻⁸ to 1 × 10⁻⁴ mol·L−1.
-
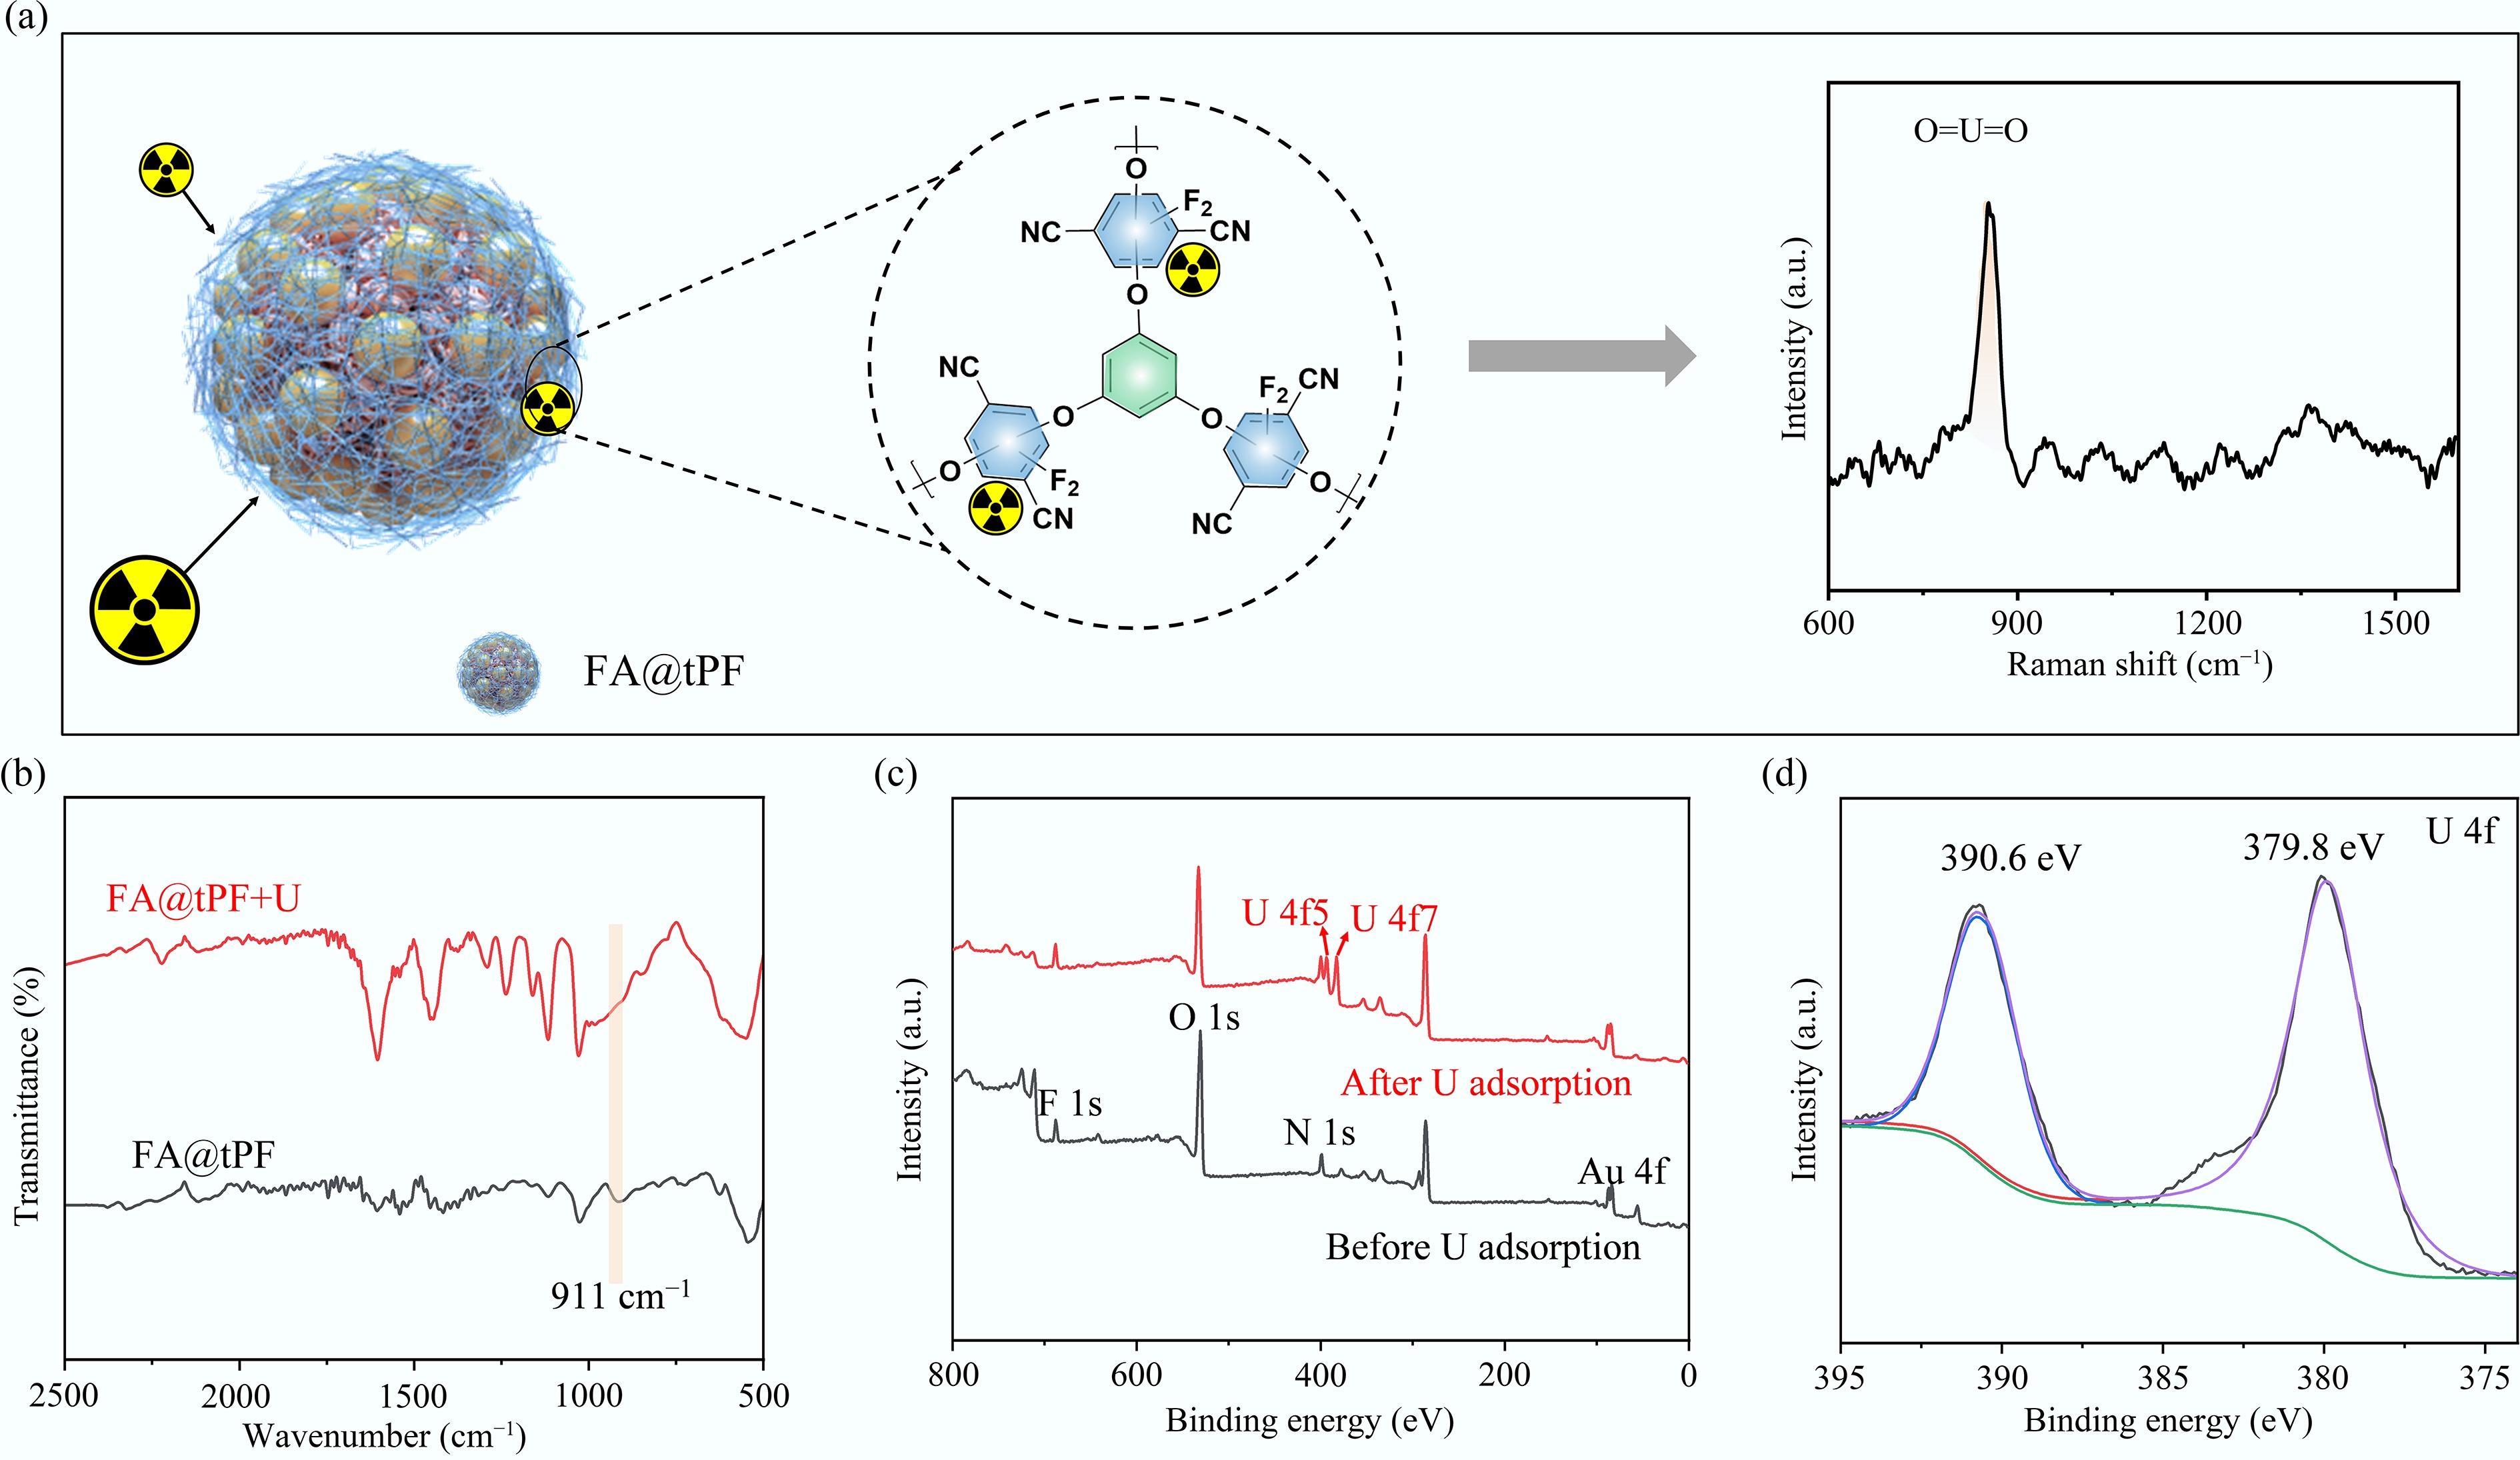
Figure 5.
(a) Schematic illustration of the uranyl ion detection mechanism on FA@tPF substrate. (b) FT-IR spectra of FA@tPF before and after U(VI) adsorption; (c) XPS survey spectra showing elemental changes on FA@tPF before and after uranyl adsorption; (d) U 4f for FA@tPF after uranyl loaded.
-
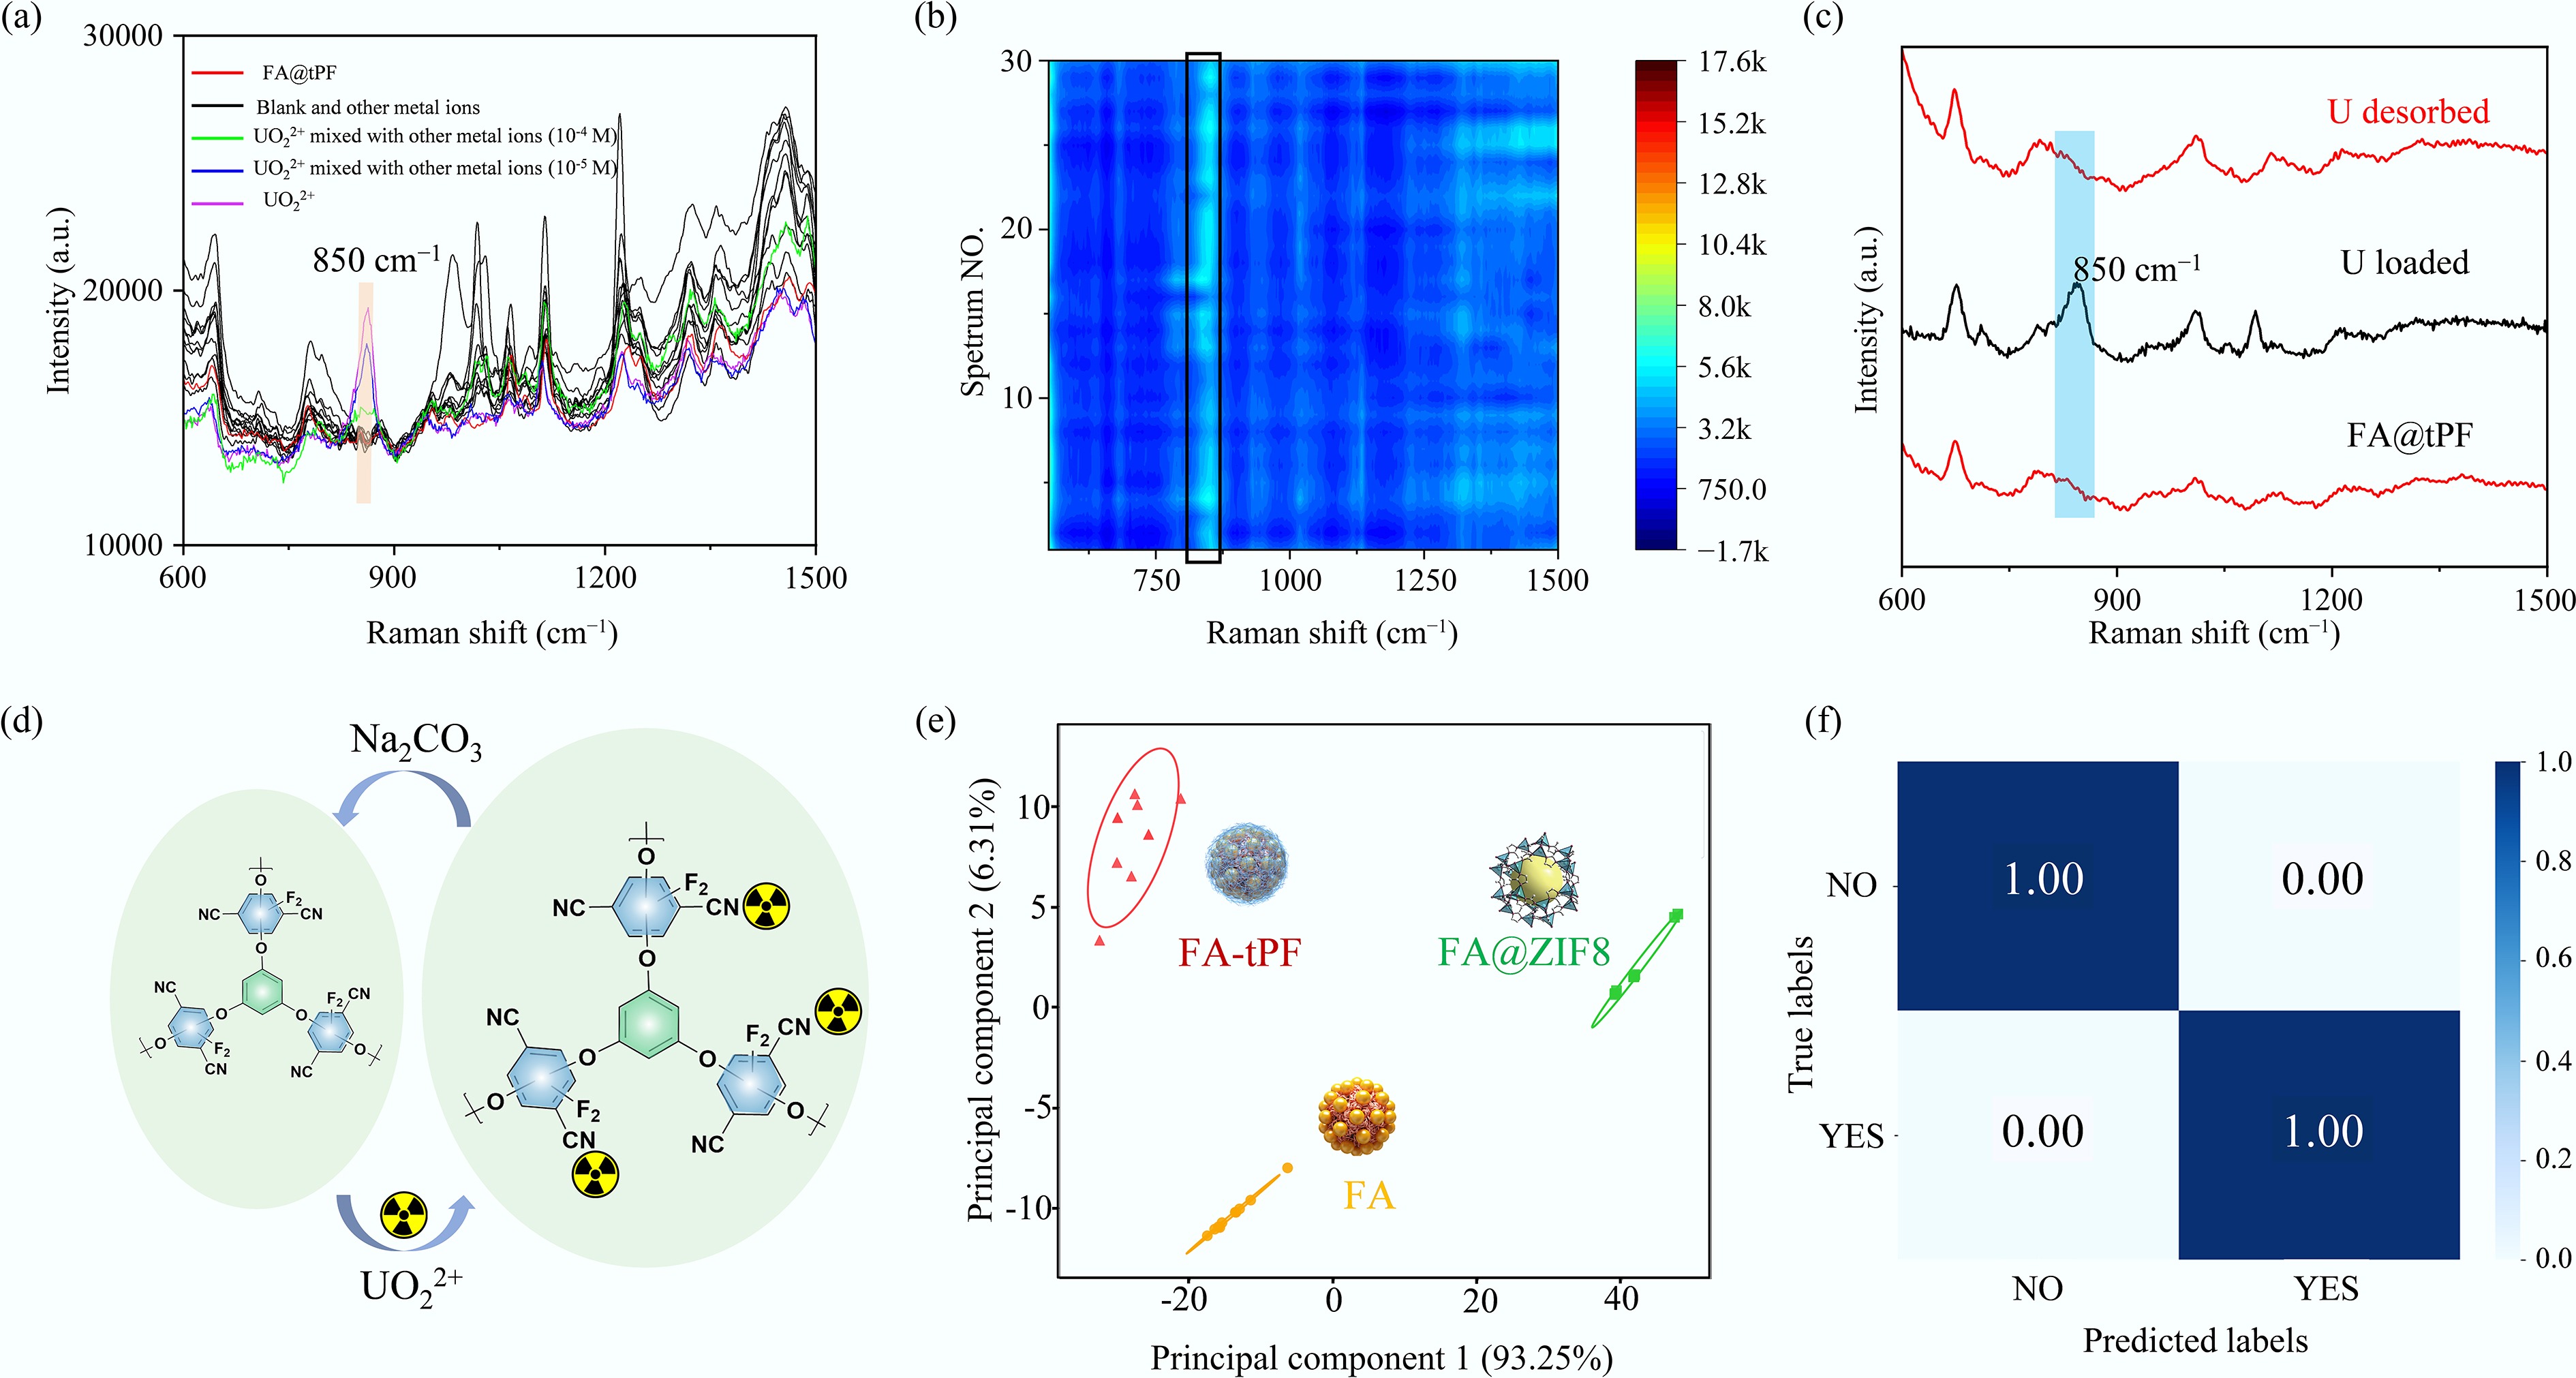
Figure 6.
(a) SERS spectra of FA@tPF for detecting uranyl ions in the presence of various interfering ions; (b) SERS spectra of FA@tPF before and after elution using Na2CO3; (c) SERS spectra of FA@tPF before and after one adsorption and desorption cycle; (d) schematic illustration of the regeneration mechanism of FA@tPF substrate with Na2CO3; (e) principal component analysis (PCA) plot of 10−5 mol·L−1 uranyl SERS spectra collected from FA, FA@ZIF-8, and FA@tPF substrates; (f) classification confusion matrix of SERS spectra before and after adsorption of uranyl on FA@tPF substrate by a CNN classification model.
Figures
(6)
Tables
(0)