-
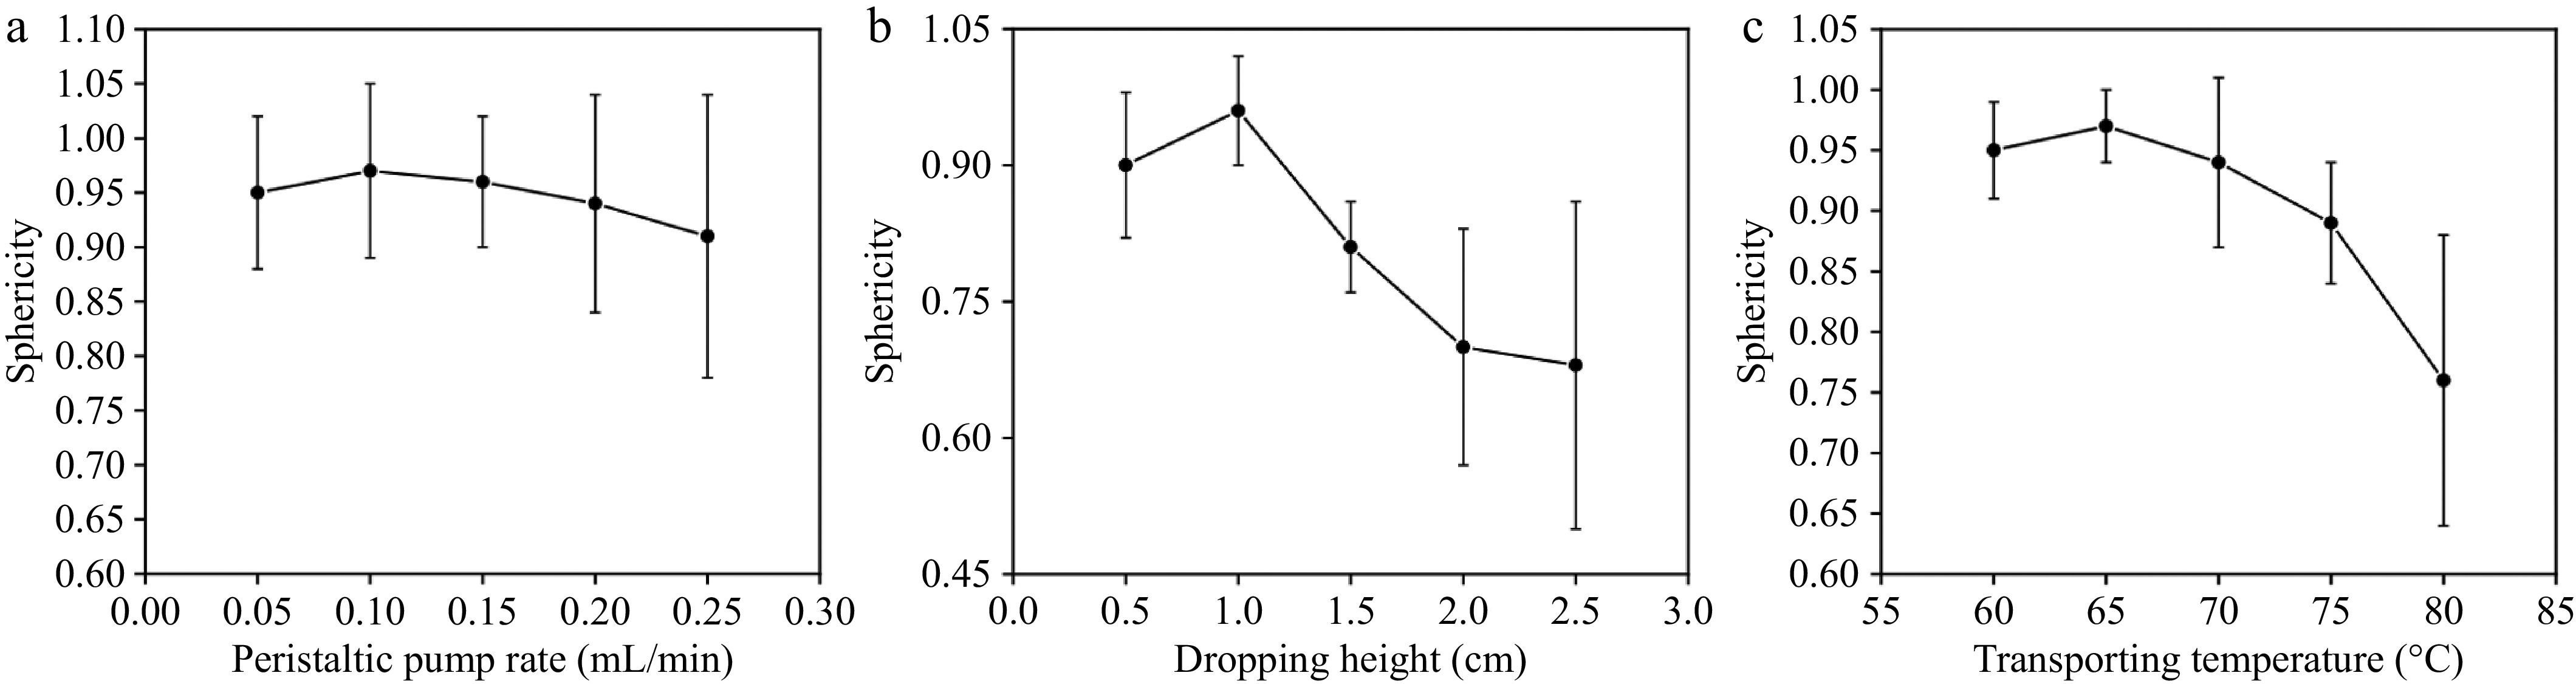
Figure 1.
Single factor experimental results for RSM.
-
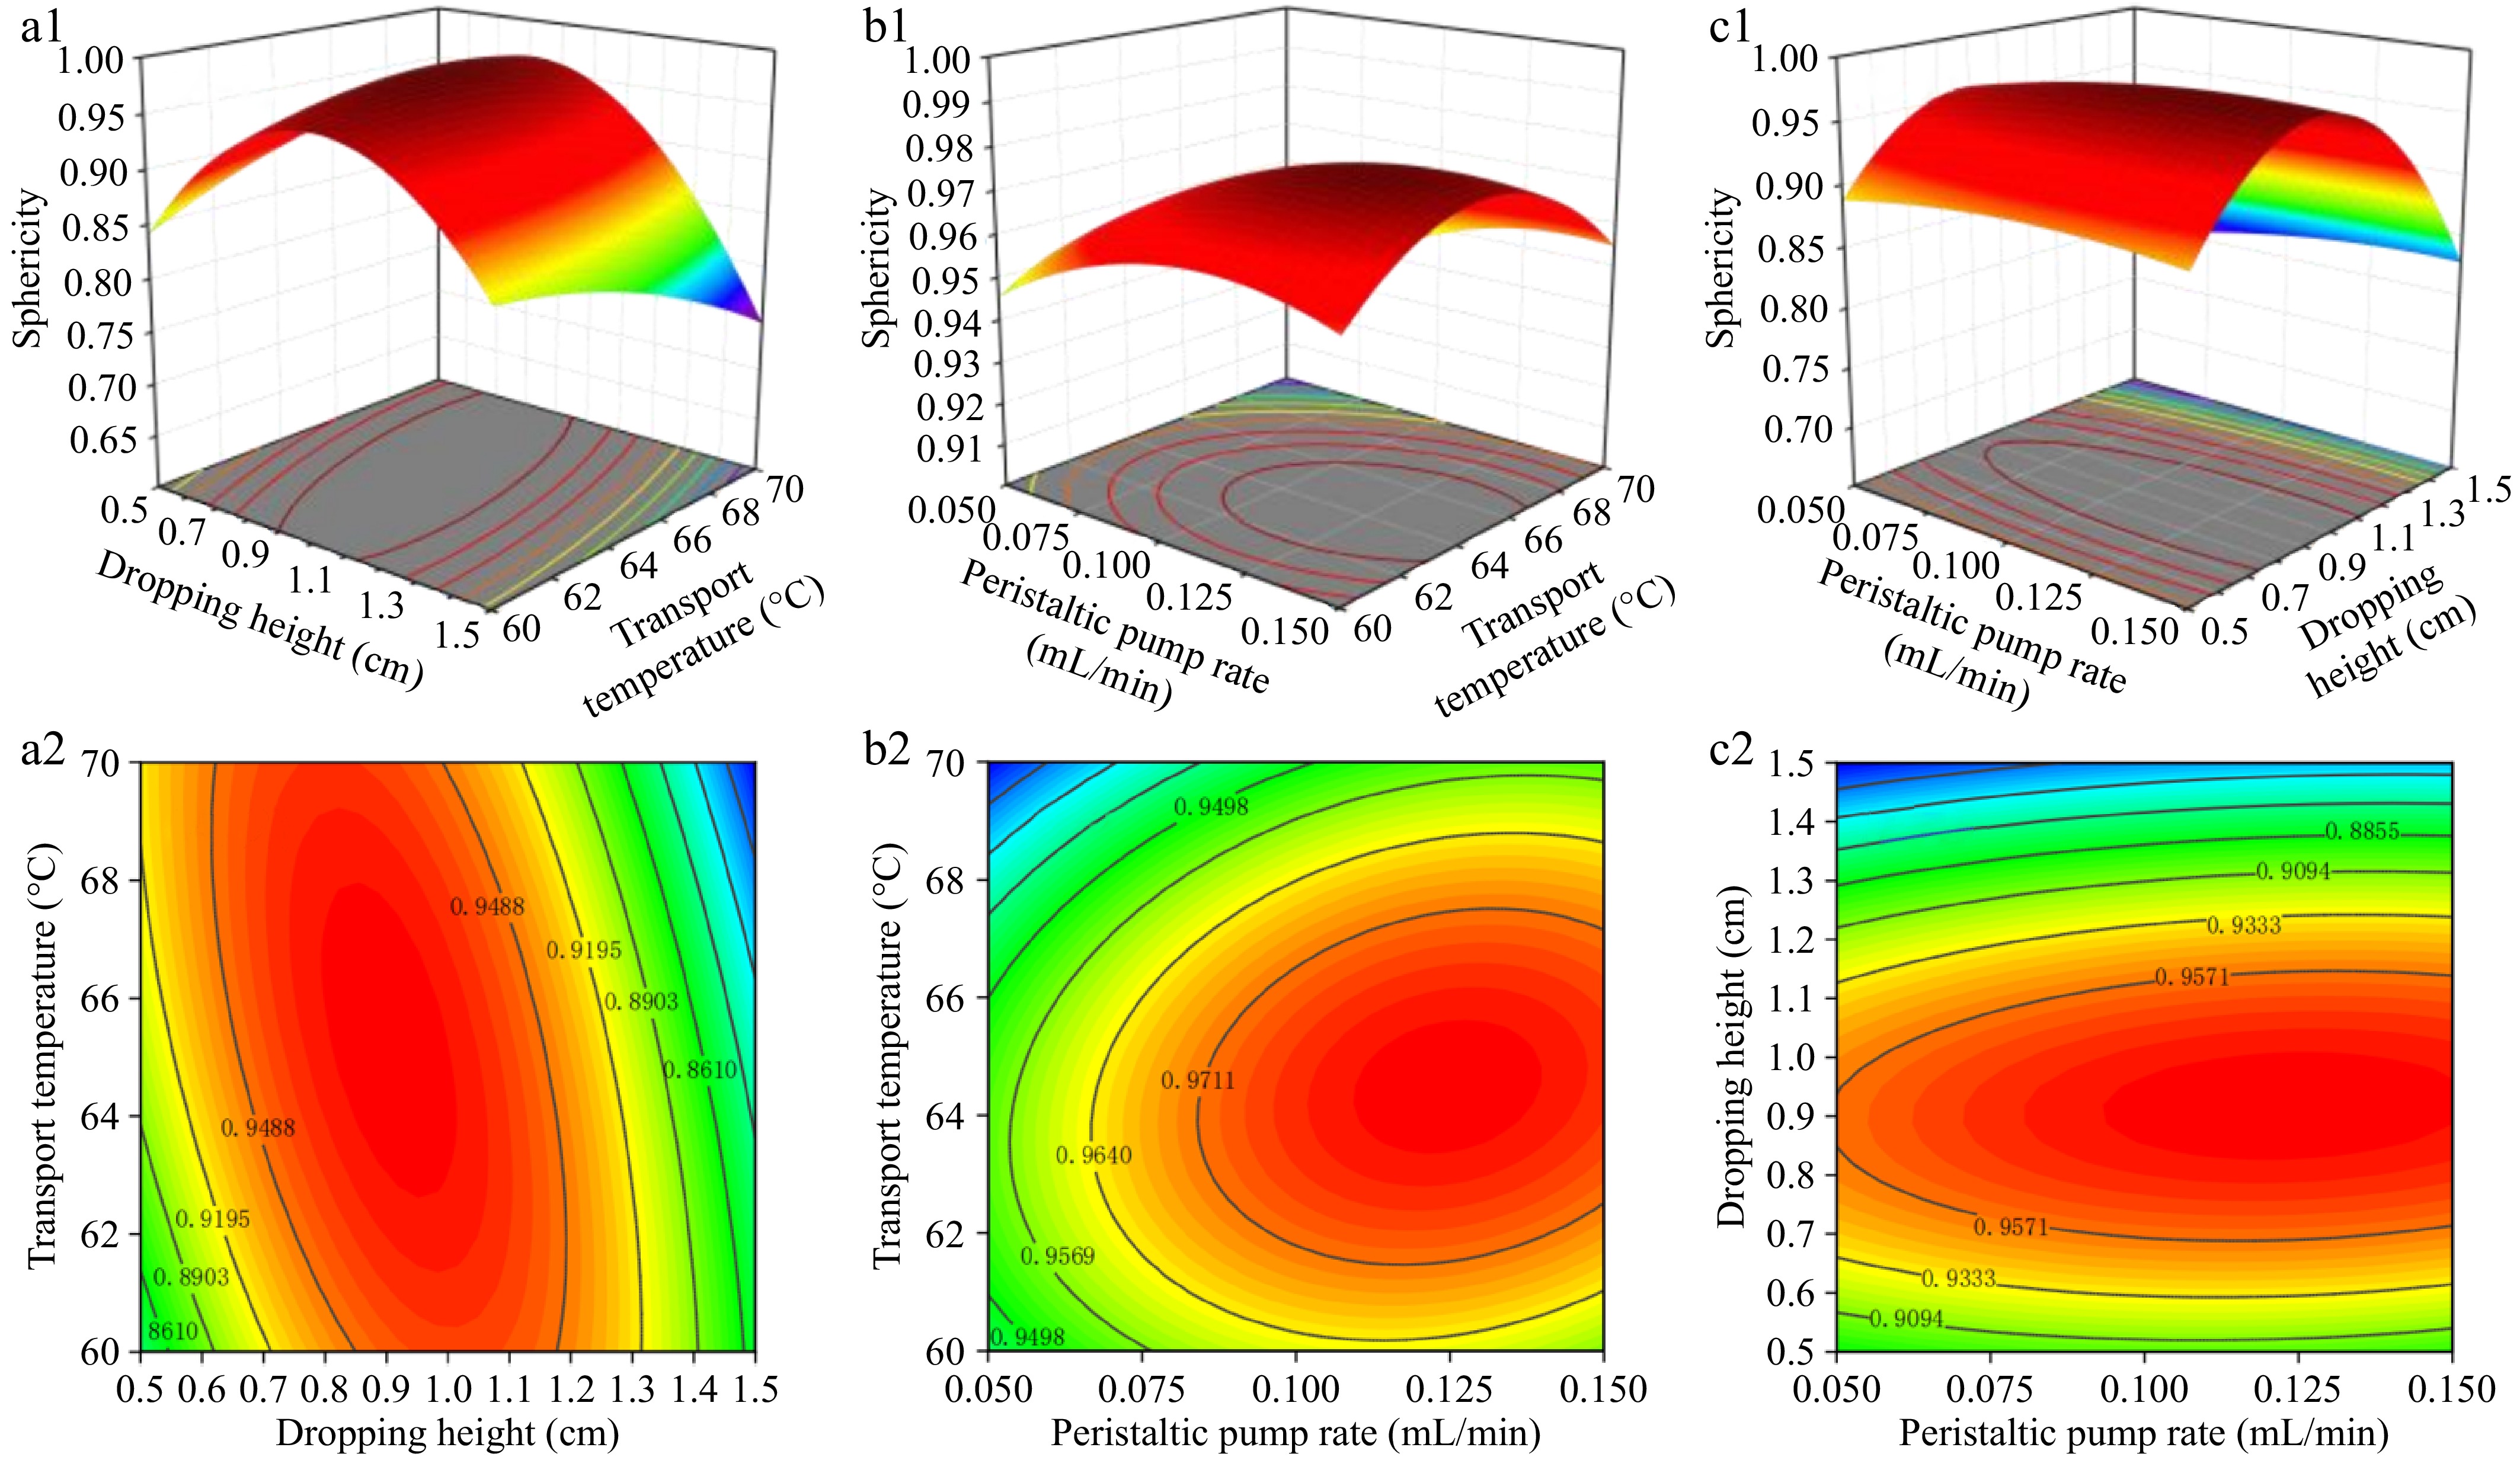
Figure 2.
Three-dimensional response surface and corresponding two-dimensional contour plots.
-
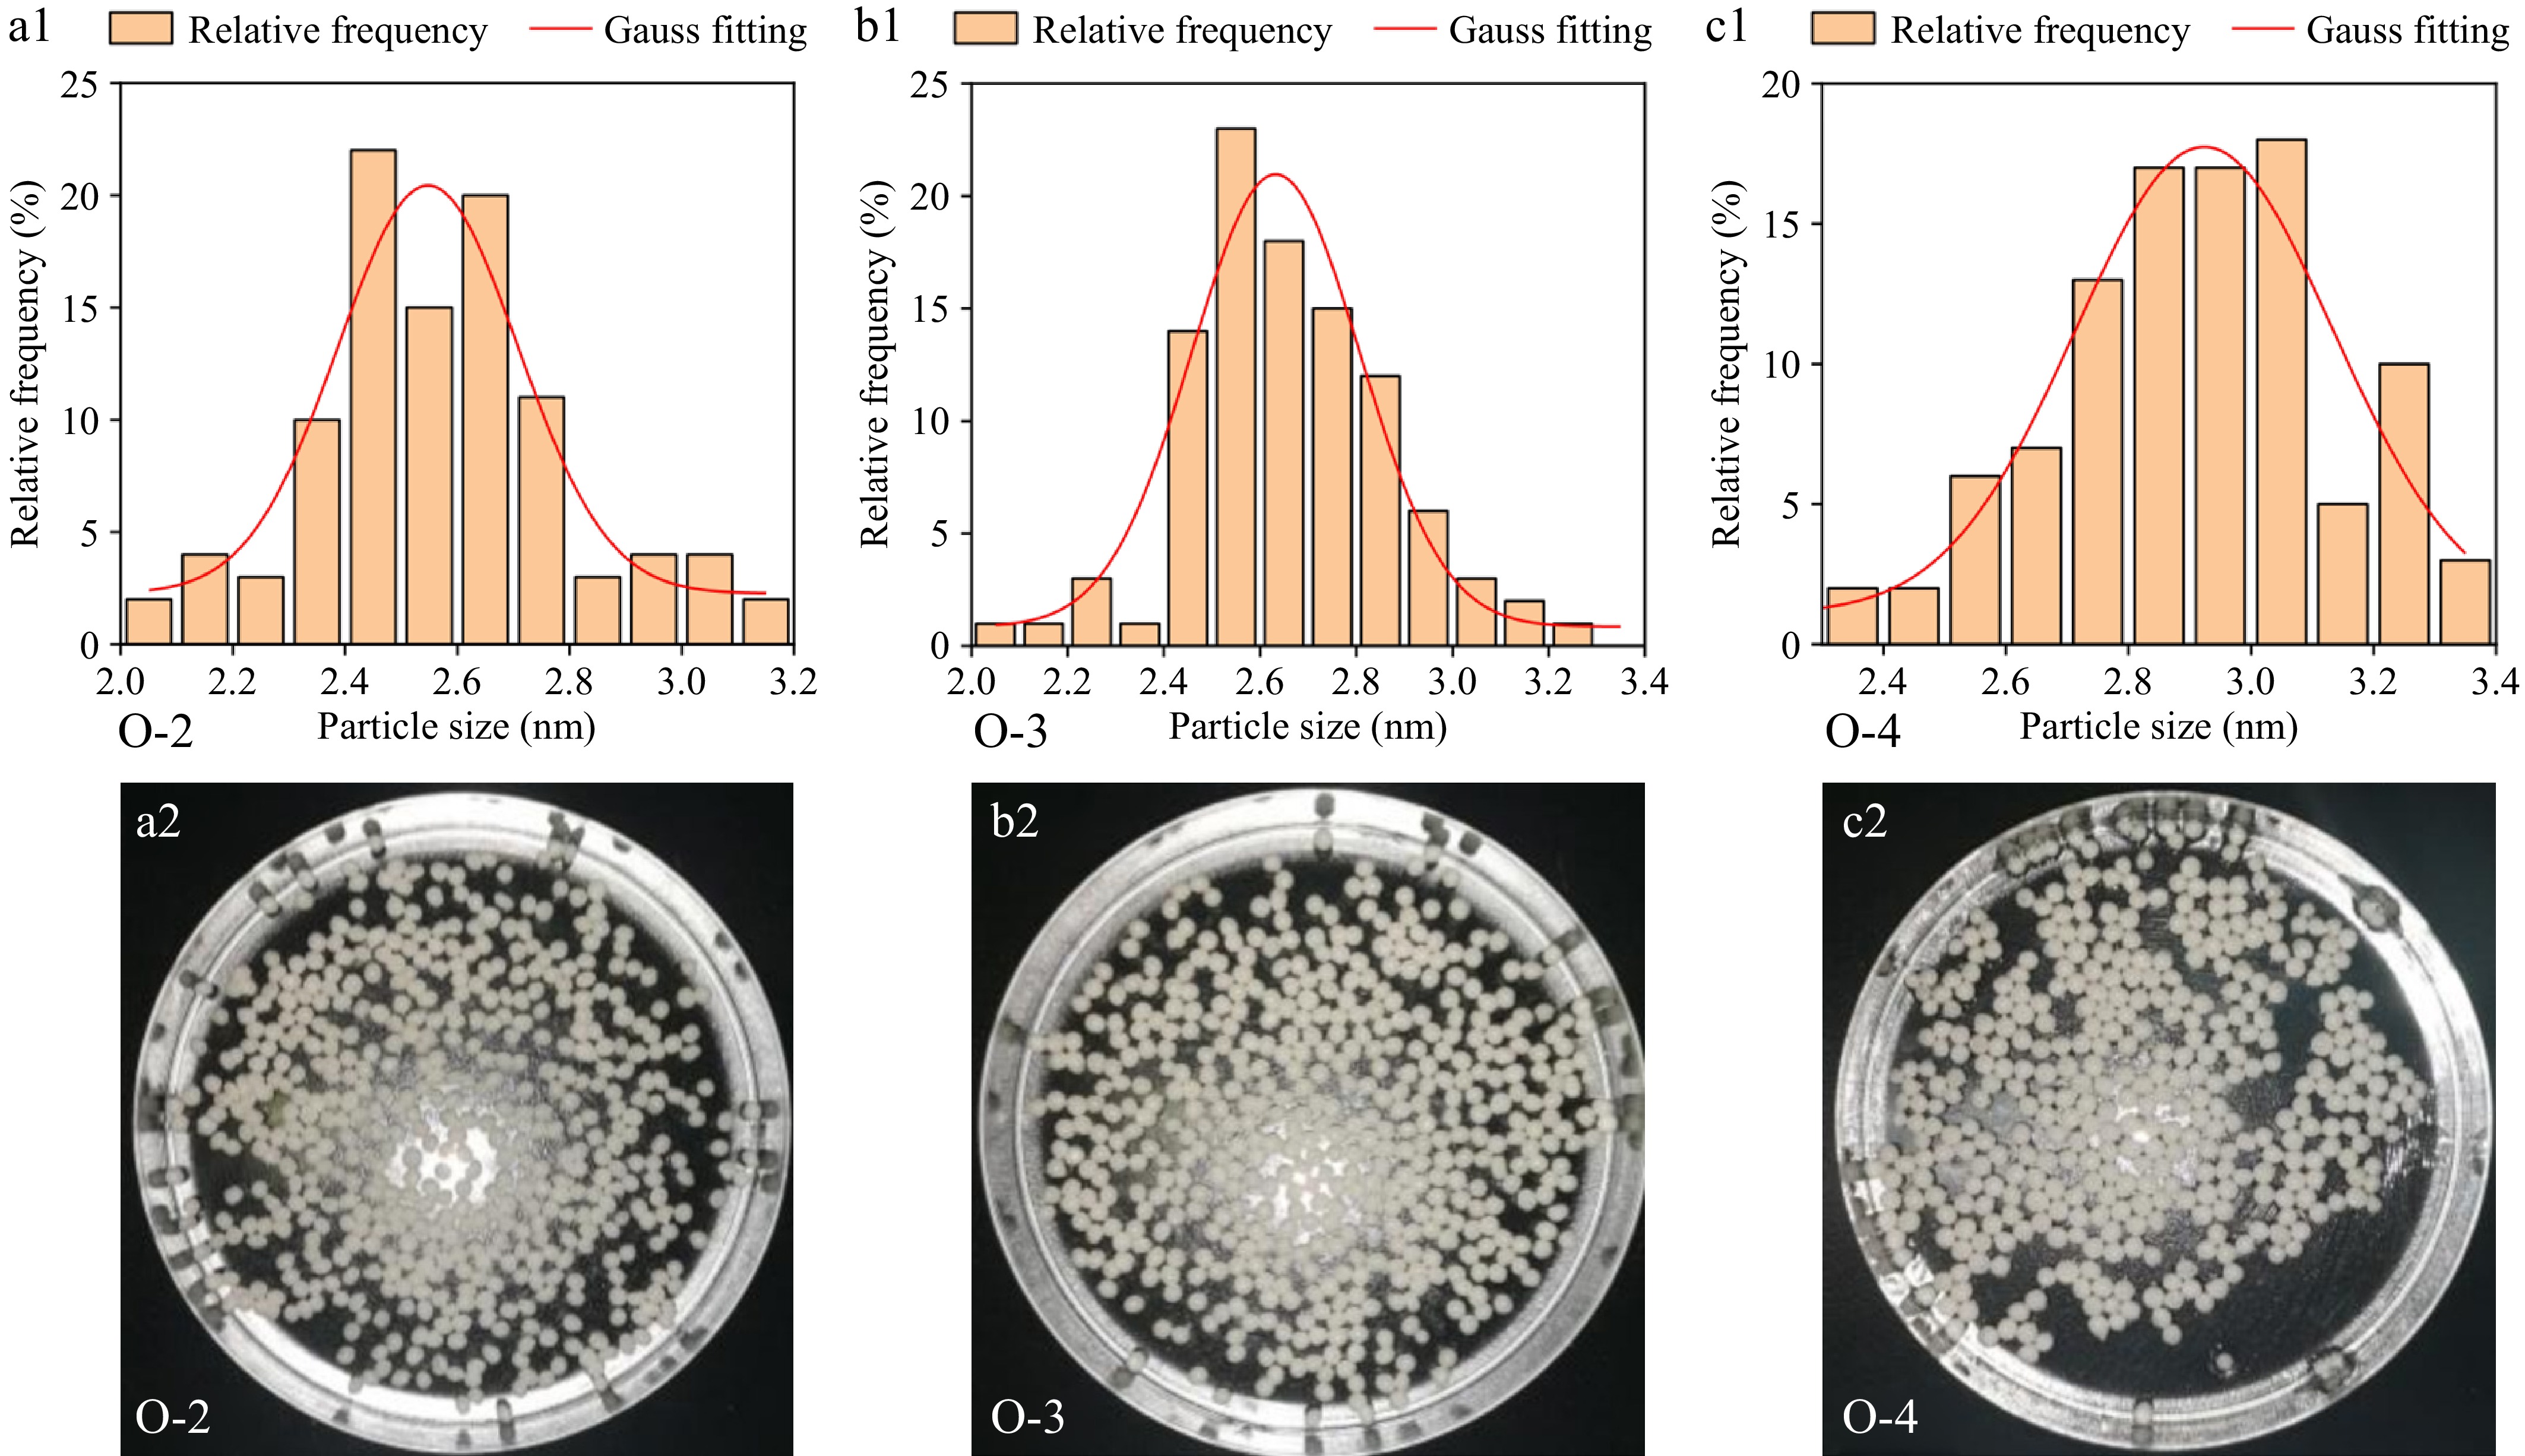
Figure 3.
Appearance and size distributions of bigel beads.
-
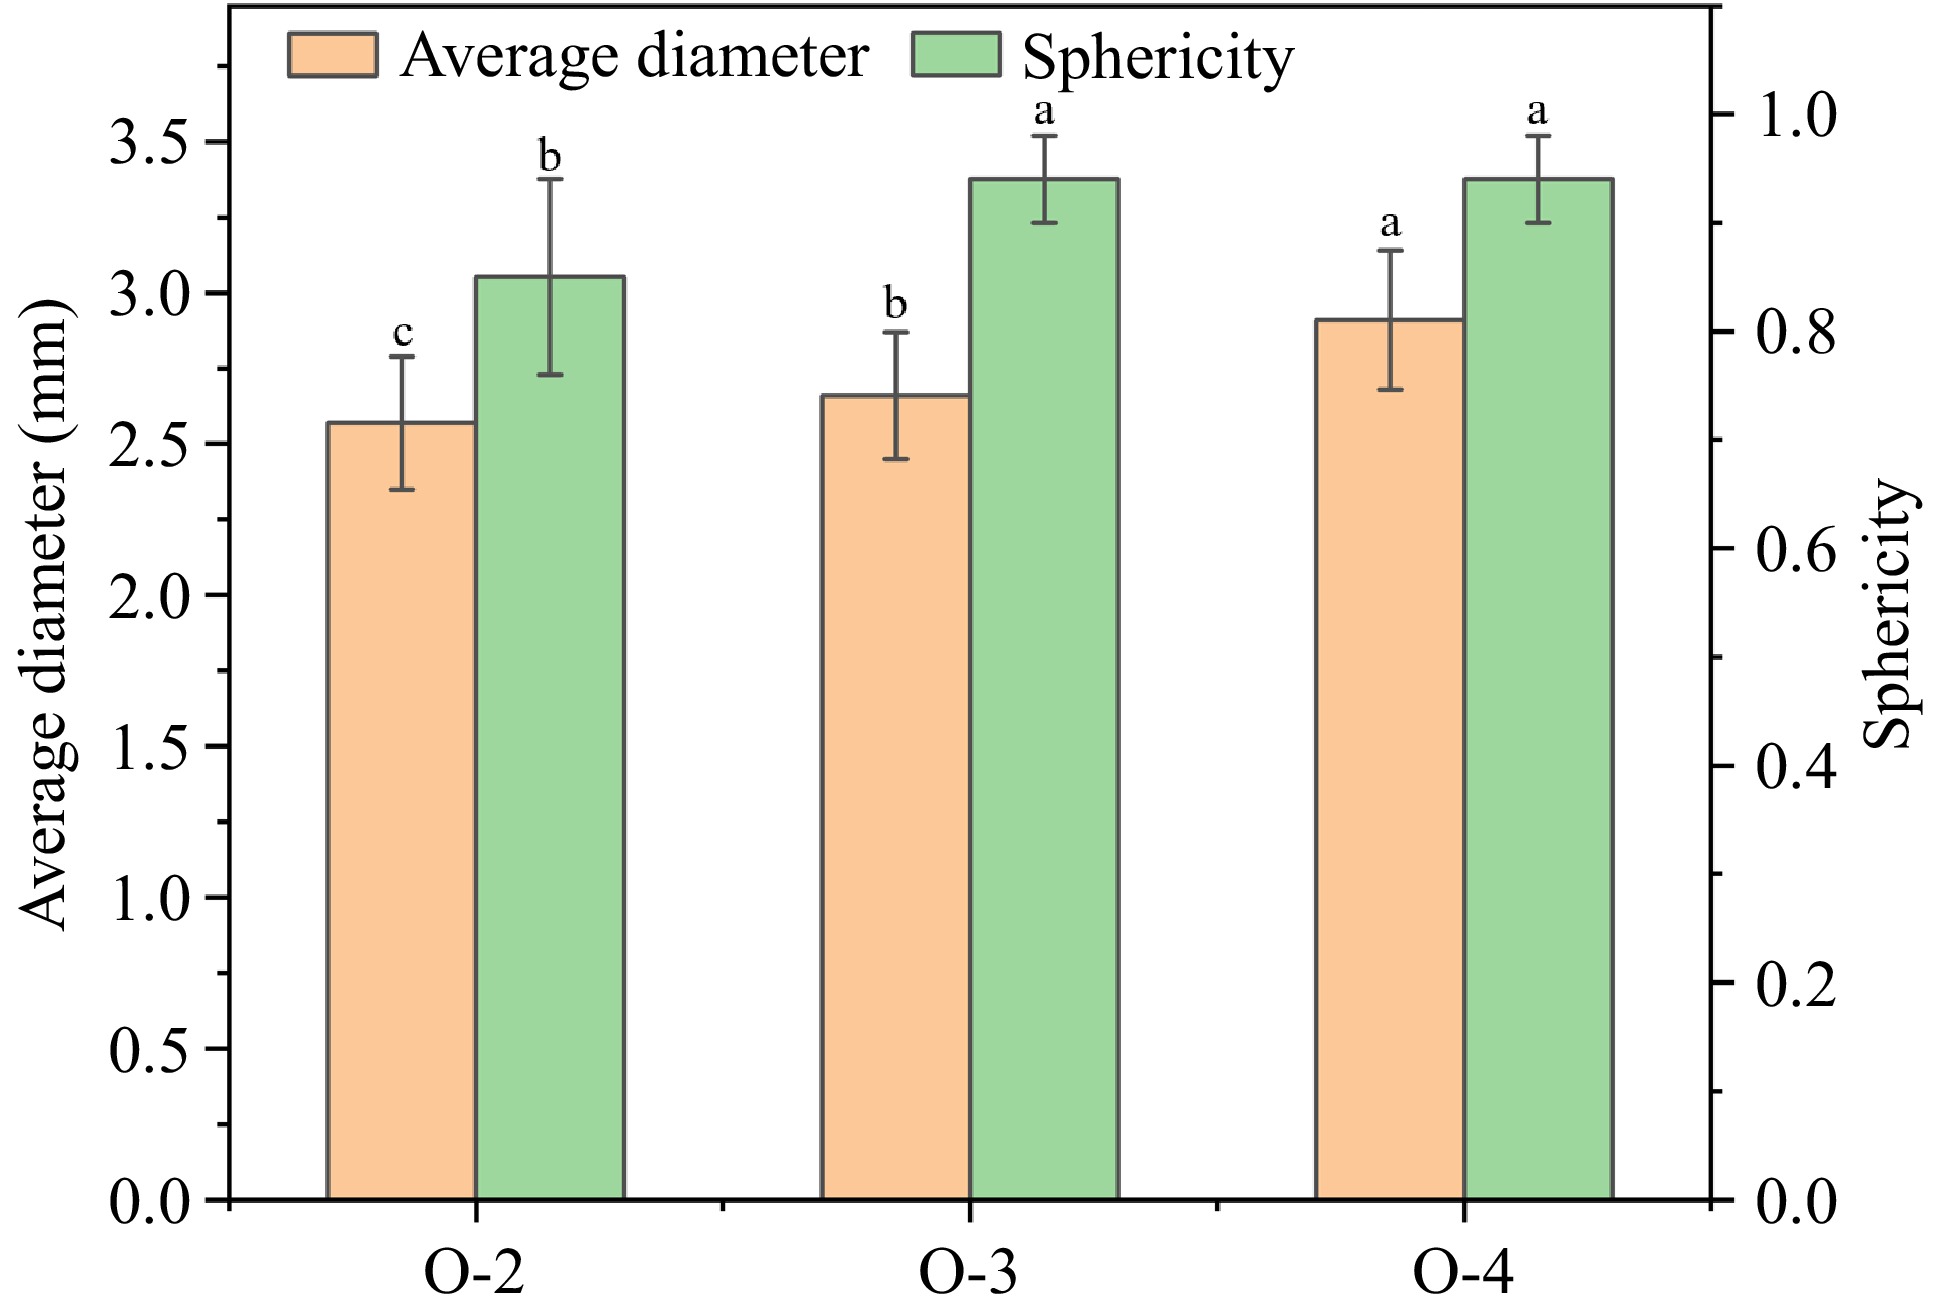
Figure 4.
Average diameter and sphericity of bigel beads. Different lowercase letters in the same row indicate significant differences (p < 0.05).
-
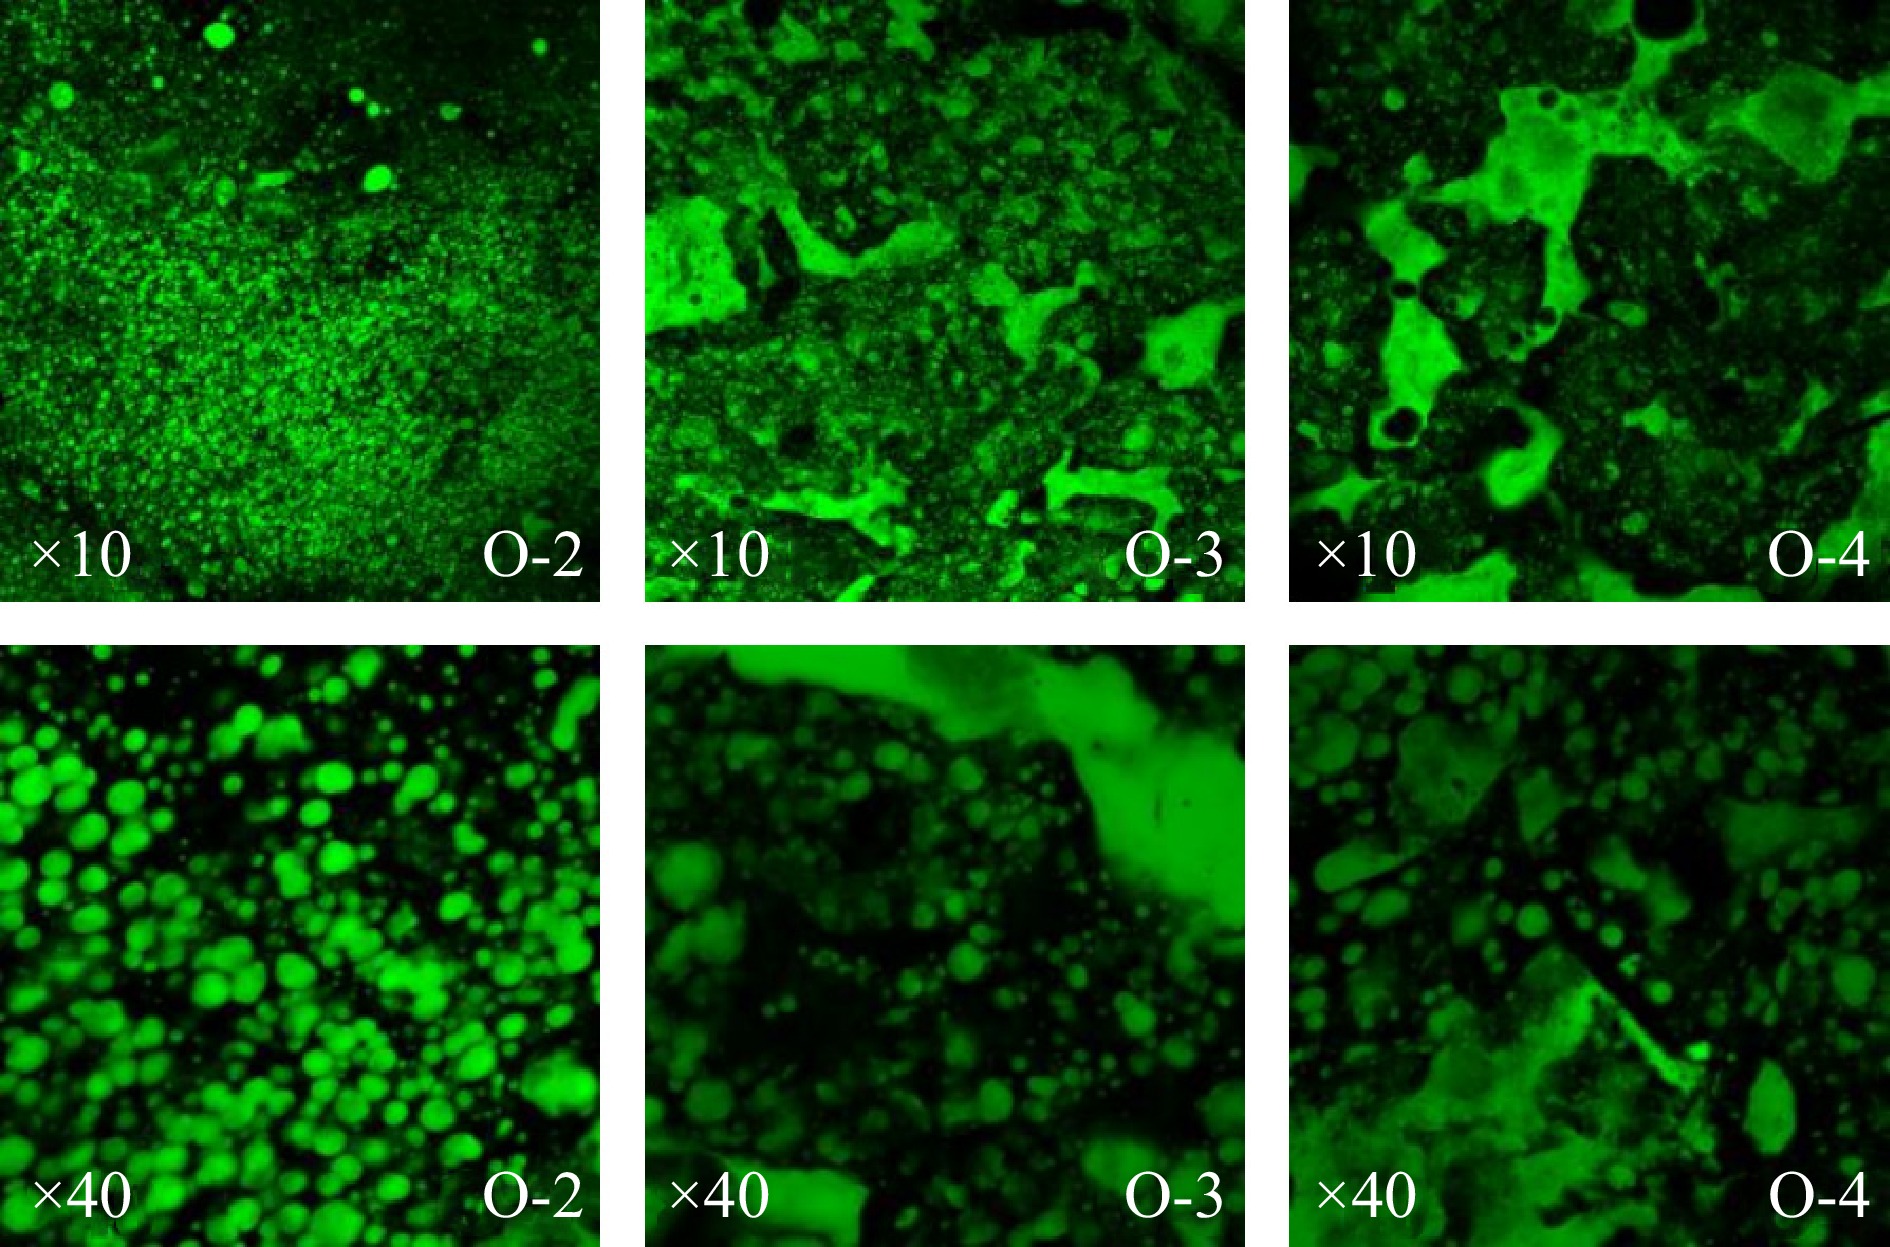
Figure 5.
Microstructure of bigel beads.
-
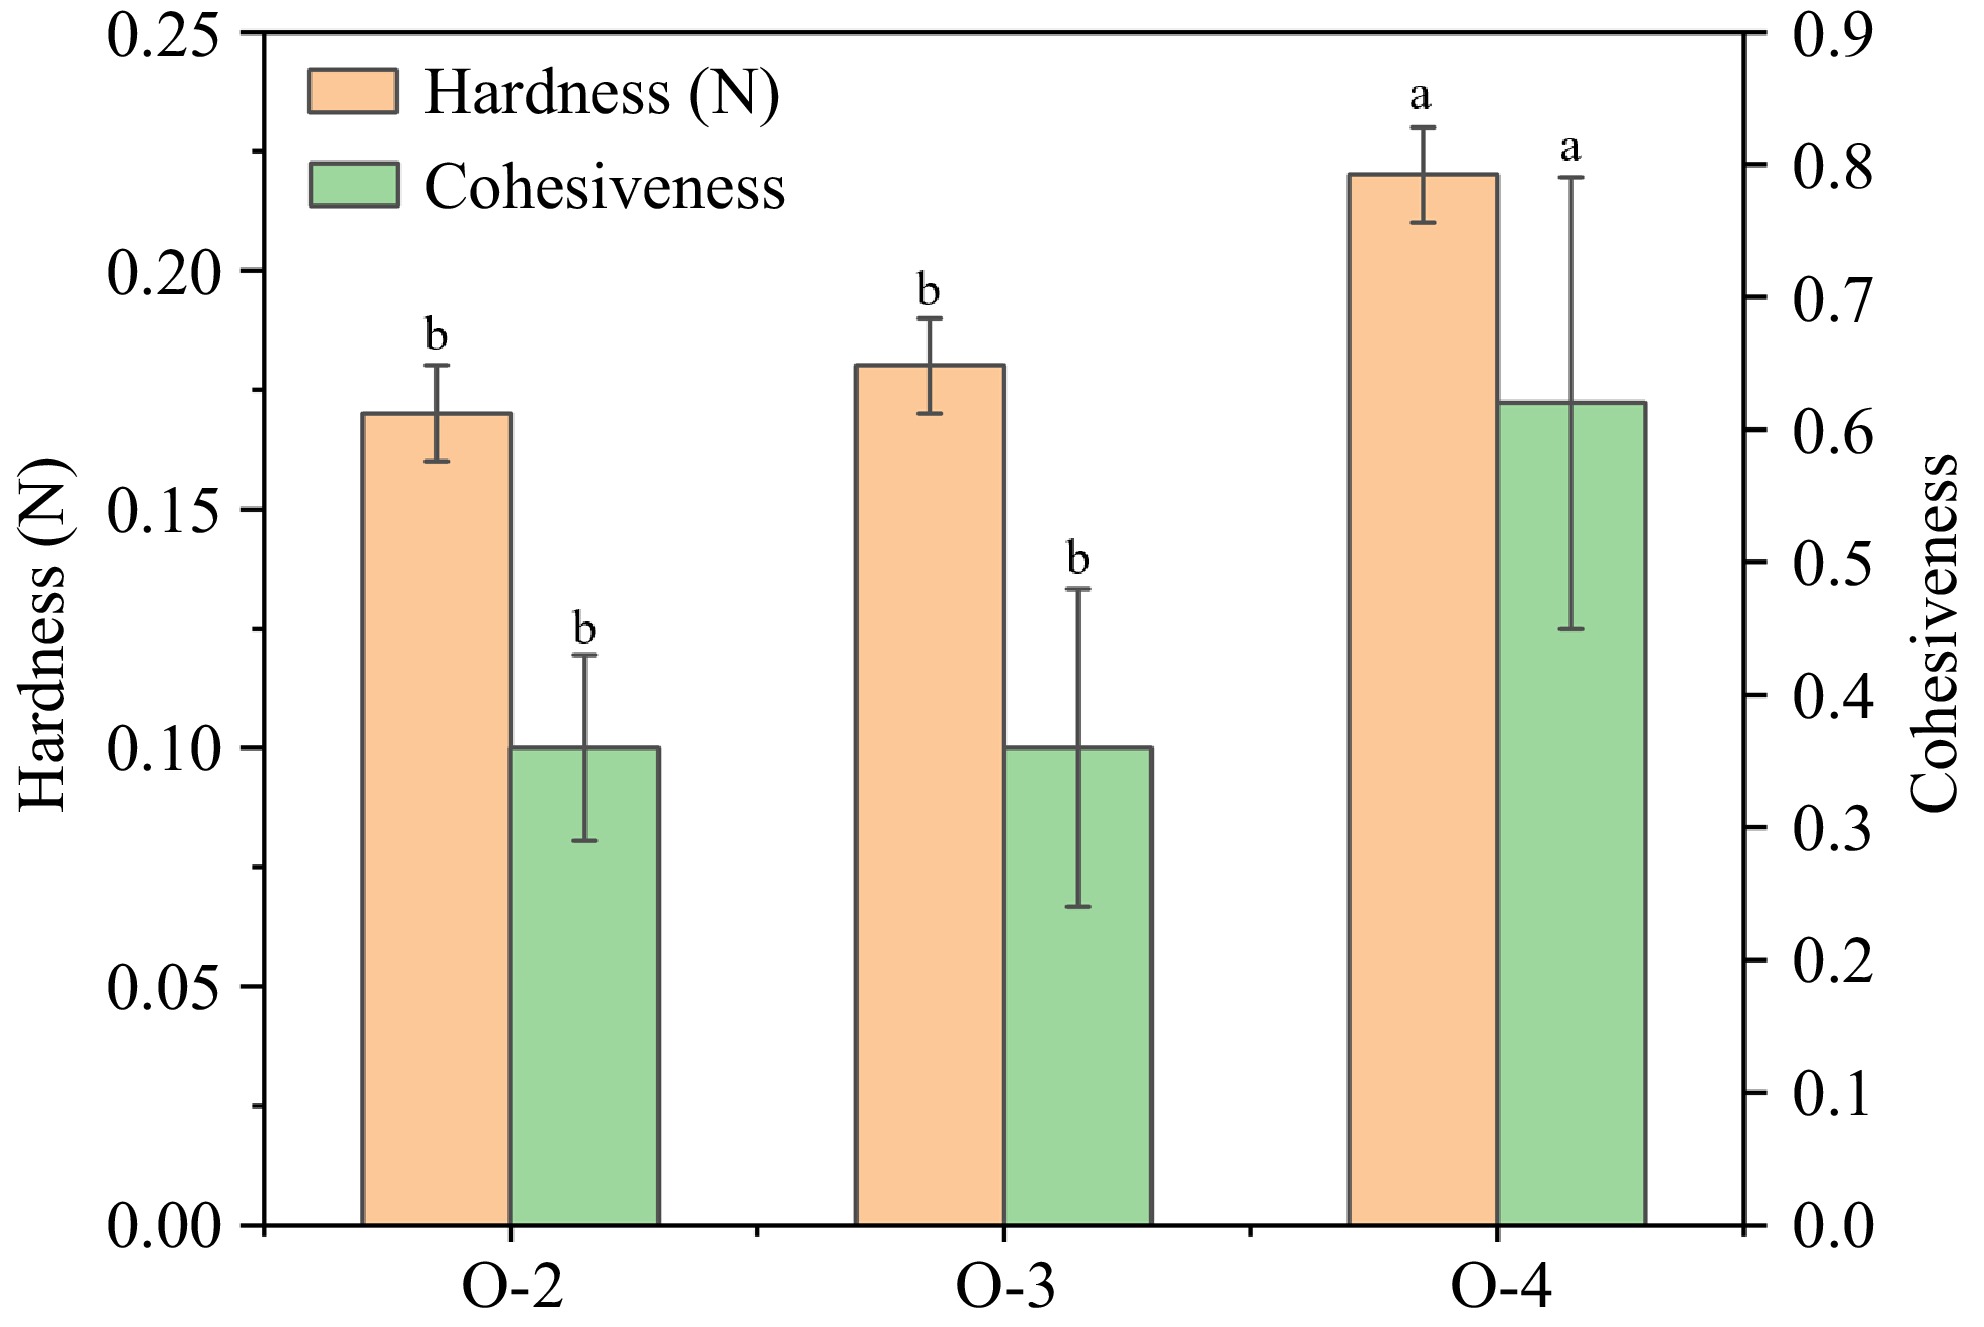
Figure 6.
Mechanical properties of bigel beads. Different lowercase letters in the same row indicate significant differences (p < 0.05).
-
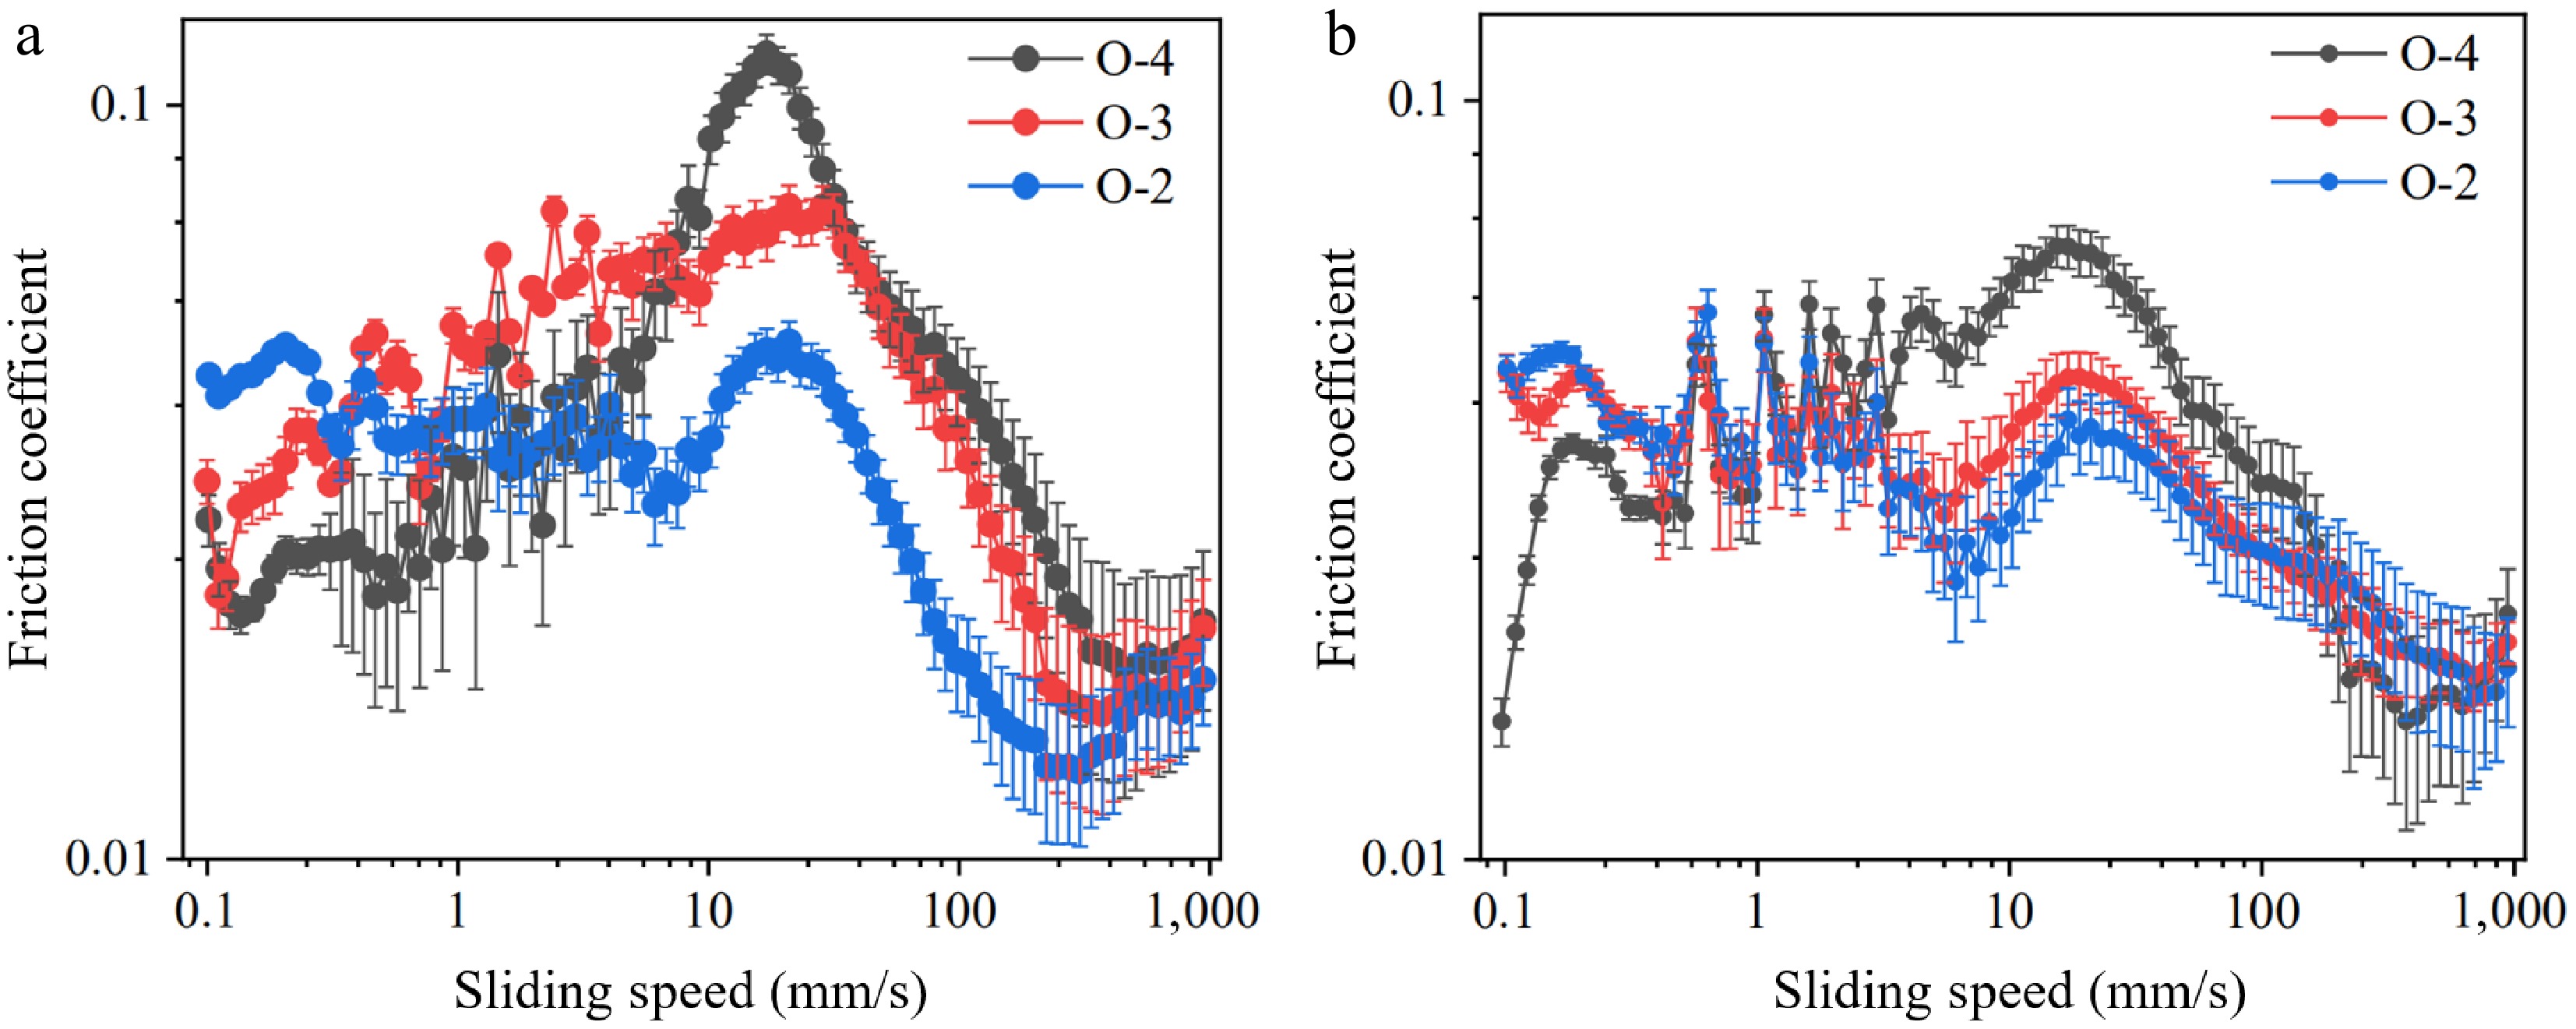
Figure 7.
Tribological properties of bigel beads. (a) 6% (w/w) and (b) 10% (w/w) bigel beads were added to yoghurt, respectively.
-
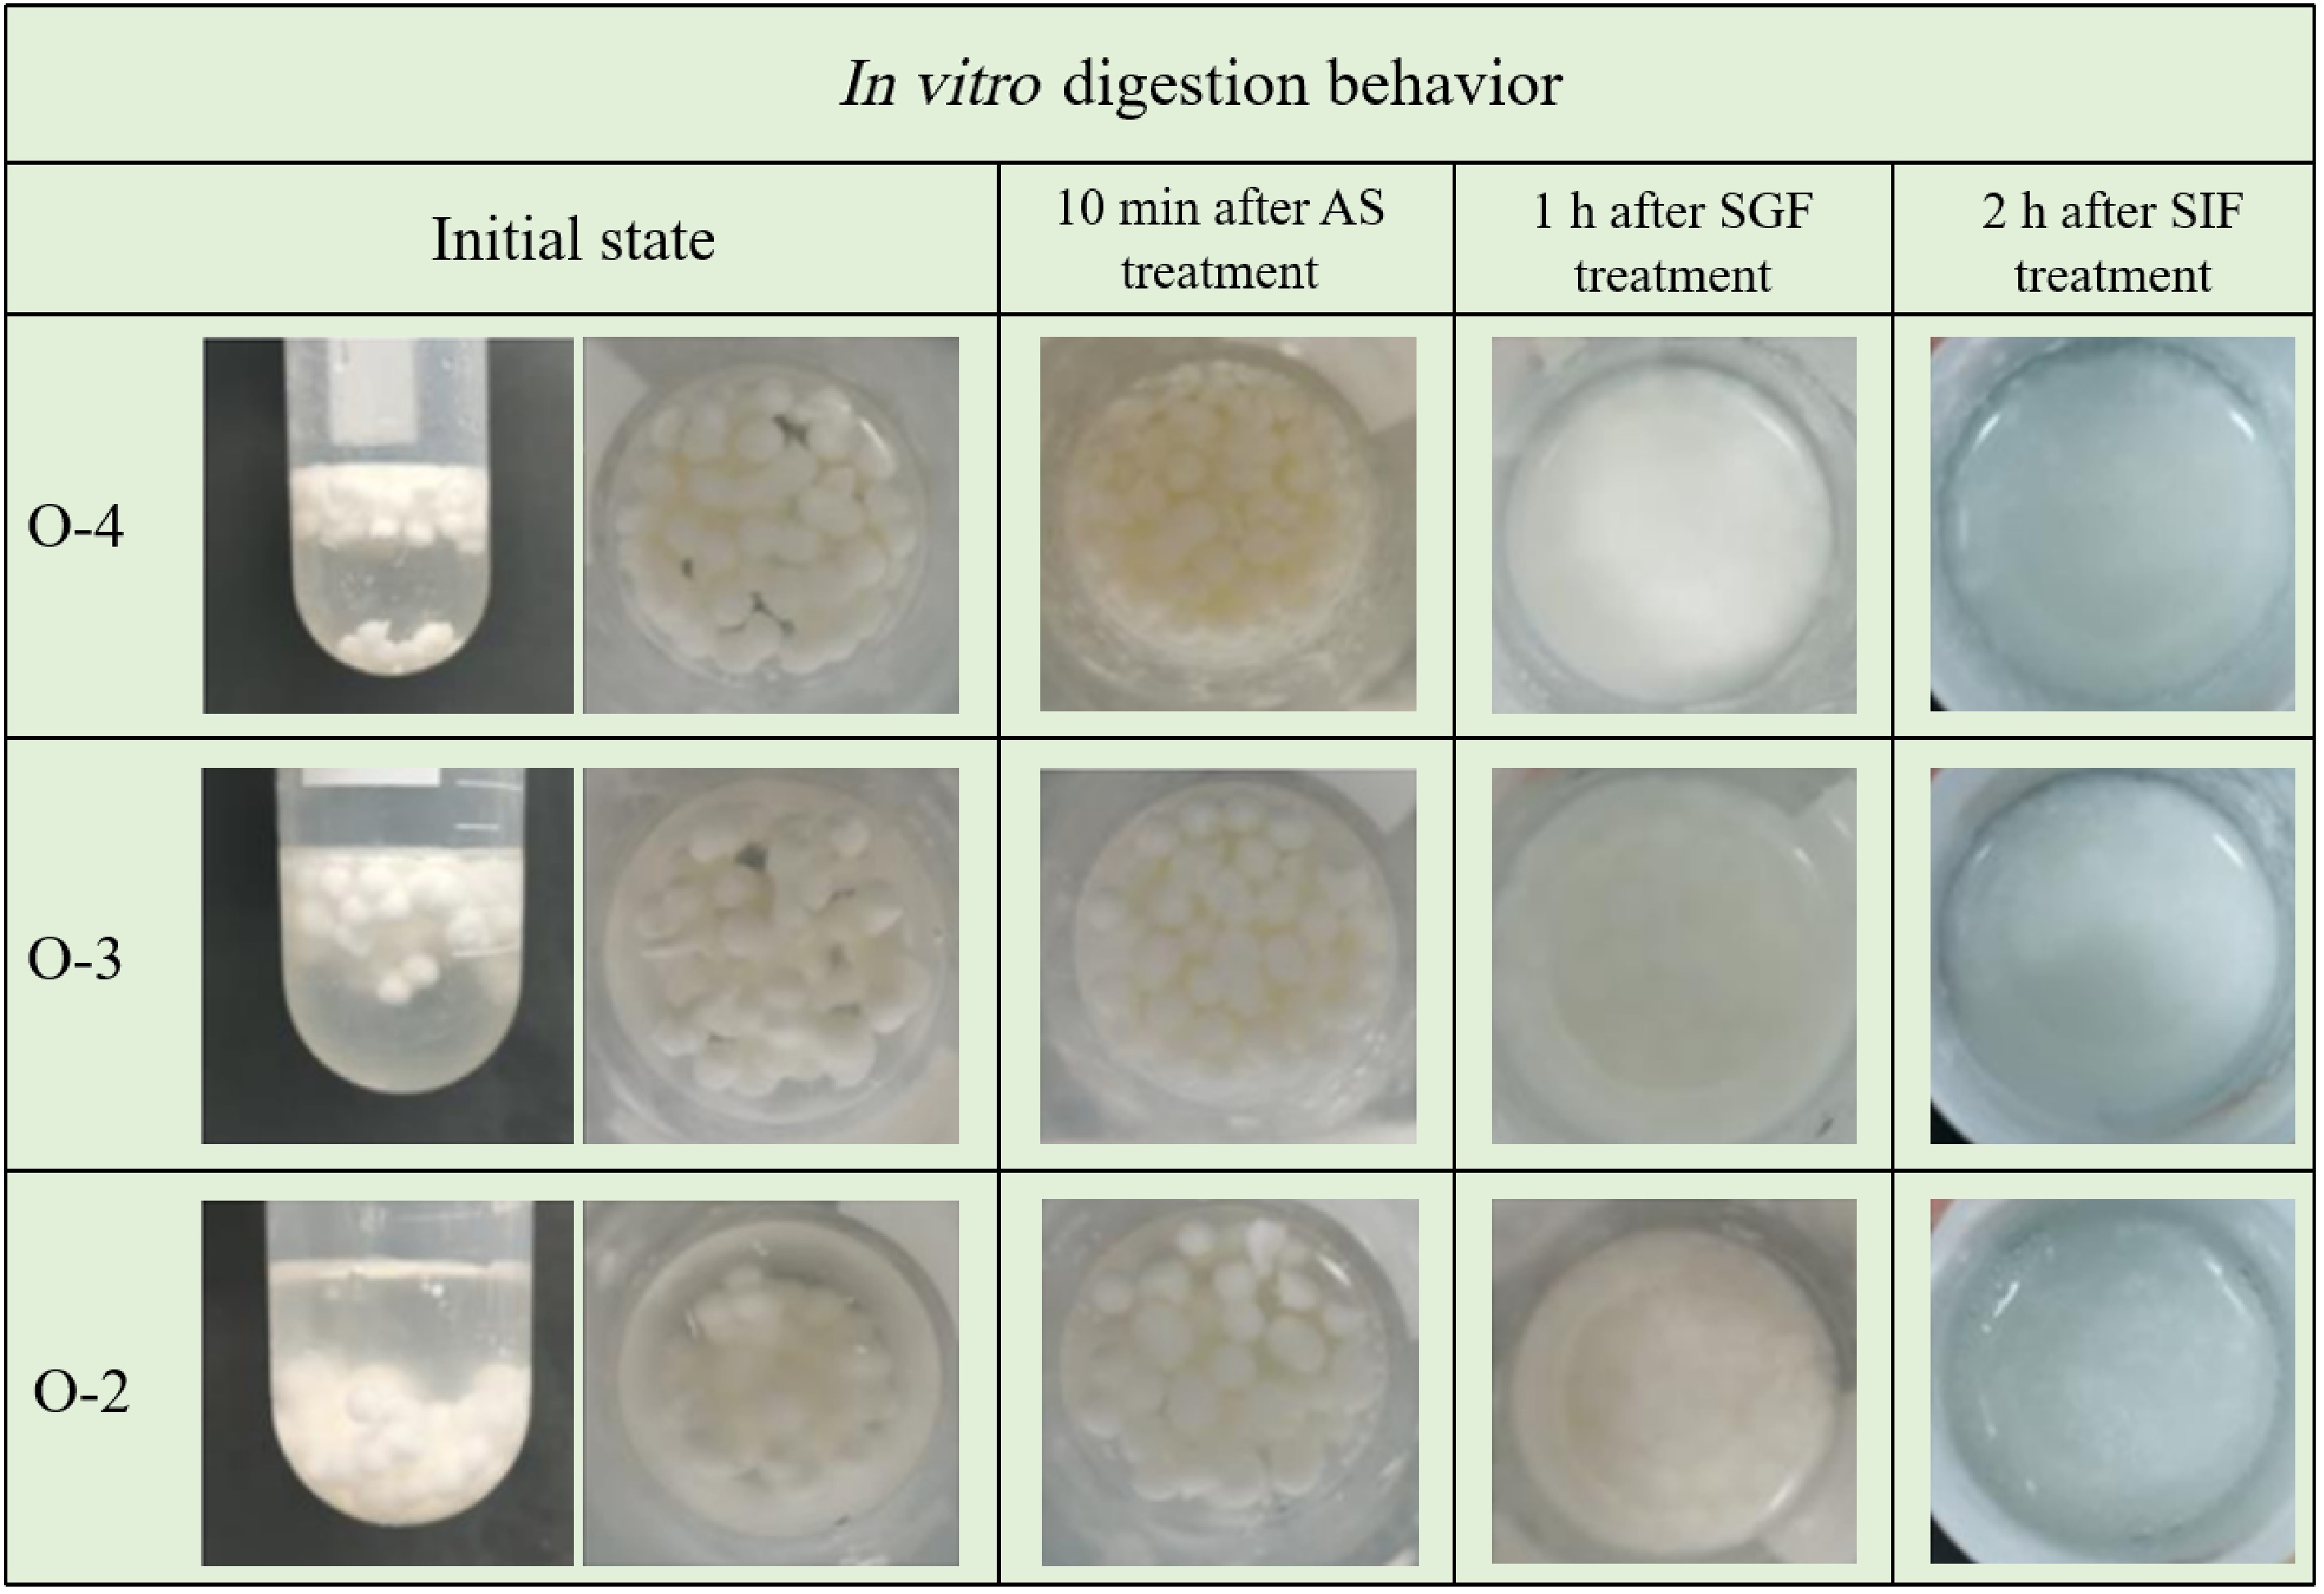
Figure 8.
In vitro digestion behavior of bigel beads. AS, SGF, and SIF stand for artificial saliva, simulated gastric fluid, and simulated intestinal fluid, respectively.
-
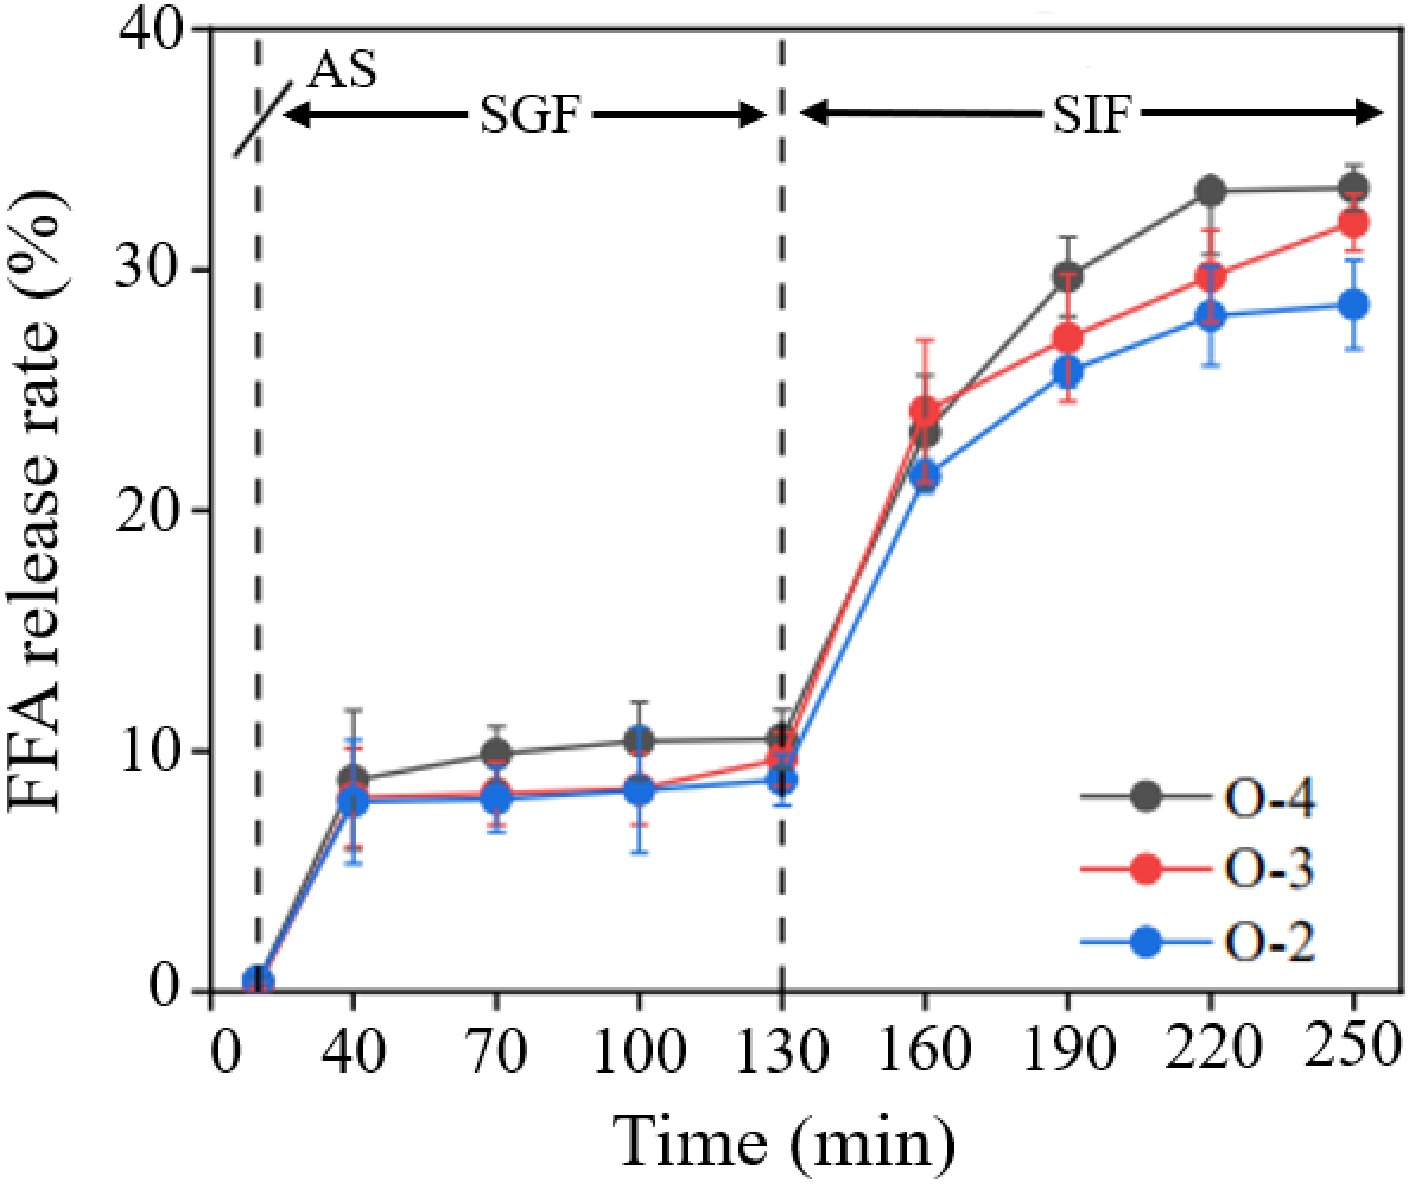
Figure 9.
In vitro free fatty acid release profile of bigel beads. AS, SGF, and SIF represent artificial saliva, simulated gastric fluid, and simulated intestinal fluid, respectively.
-
Factors 1 2 3 4 5 Ethanol concentration 0.3323 ± 0.0095 0.6511 ± 0.0145 0.8538 ± 0.0035 0.9693 ± 0.0089 0.8474 ± 0.0213 Gelling bath temperature 0.8418 ± 0.0191 0.9777 ± 0.0019 0.9844 ± 0.0037 0.9795 ± 0.0147 0.6391 ± 0.0099 Tween concentration 0.9856 ± 0.0099 0.9848 ± 0.0043 0.9431 ± 0.0047 0.8795 ± 0.0021 0.8076 ± 0.0758 Numbers 1 to 5 represent different levels of factors. Table 1.
Single-factor experimental results of the gelation rate.
-
Sample runs Factors Gelation rate Ethanol concentration (%) Gelling bath temperature (°C) Tween concentration (%) 1 50 −4 0 0.7799 2 50 0 0.5 0.8679 3 50 4 1 0.5948 4 75 −4 0.5 0.9727 5 75 0 1 0.9766 6 75 4 0 0.9483 7 100 −4 1 0.7685 8 100 0 0 0.9434 9 100 4 0.5 0.8276 k1 2.2426 2.5211 2.6716 k2 2.8976 2.7879 2.6682 k3 2.5395 2.3706 2.3399 R 0.2184 0.1391 0.1106 Rank 1 2 3 Table 2.
Orthogonal array design and analysis on the gelation rate.
-
Run A, peristaltic pump rate (mL/min) B, dropping height (cm) C, transport temperature (°C) Y, sphericity 1 0.05 0.5 65 0.8867 2 0.15 0.5 65 0.9010 3 0.05 1.5 65 0.7813 4 0.15 1.5 65 0.8256 5 0.05 1 60 0.9514 6 0.15 1 60 0.9562 7 0.05 1 70 0.9198 8 0.15 1 70 0.9457 9 0.1 0.5 60 0.8330 10 0.1 1.5 60 0.8532 11 0.1 0.5 70 0.9211 12 0.1 1.5 70 0.7525 13 0.1 1 65 0.9715 14 0.1 1 65 0.9771 15 0.1 1 65 0.9757 16 0.1 1 65 0.9671 17 0.1 1 65 0.9764 Table 3.
Experimental runs, and coded factors with the experimental response factor in the application of response surface methodology (RSM).
-
Source Sum of squares Degree of freedom Mean square F-Value p-Value Significance Model 0.0831 9 0.0092 158.45 < 0.0001 ** A 0.001 1 0.0010 17.12 0.0044 ** B 0.0135 1 0.0135 232.08 < 0.0001 ** C 0.0004 1 0.0004 6.40 0.0393 * AB 0.0002 1 0.0002 3.86 0.0901 NS AC 0.0001 1 0.0001 1.93 0.2077 NS BC 0.0089 1 0.0089 152.99 < 0.0001 ** A2 0.0005 1 0.0005 8.43 0.0229 * B2 0.0548 1 0.0548 940.42 < 0.0001 ** C2 0.0016 1 0.0016 27.48 0.0012 ** Residual 0.0004 7 0.0001 Lack of fit 0.0003 3 0.0001 6.24 0.0546 NS Pure error 0.0001 4 0 Corresponding total 0.0836 16 R2 0.9951 R2 (adjusted) 0.9888 Probability of F-test: ** p < 0.01; * p < 0.05; NS, nonsignificant difference. Table 4.
Analysis of variance (ANOVA) for the fitted quadratic polynomial model for optimization of extraction parameters.
Figures
(9)
Tables
(4)