-
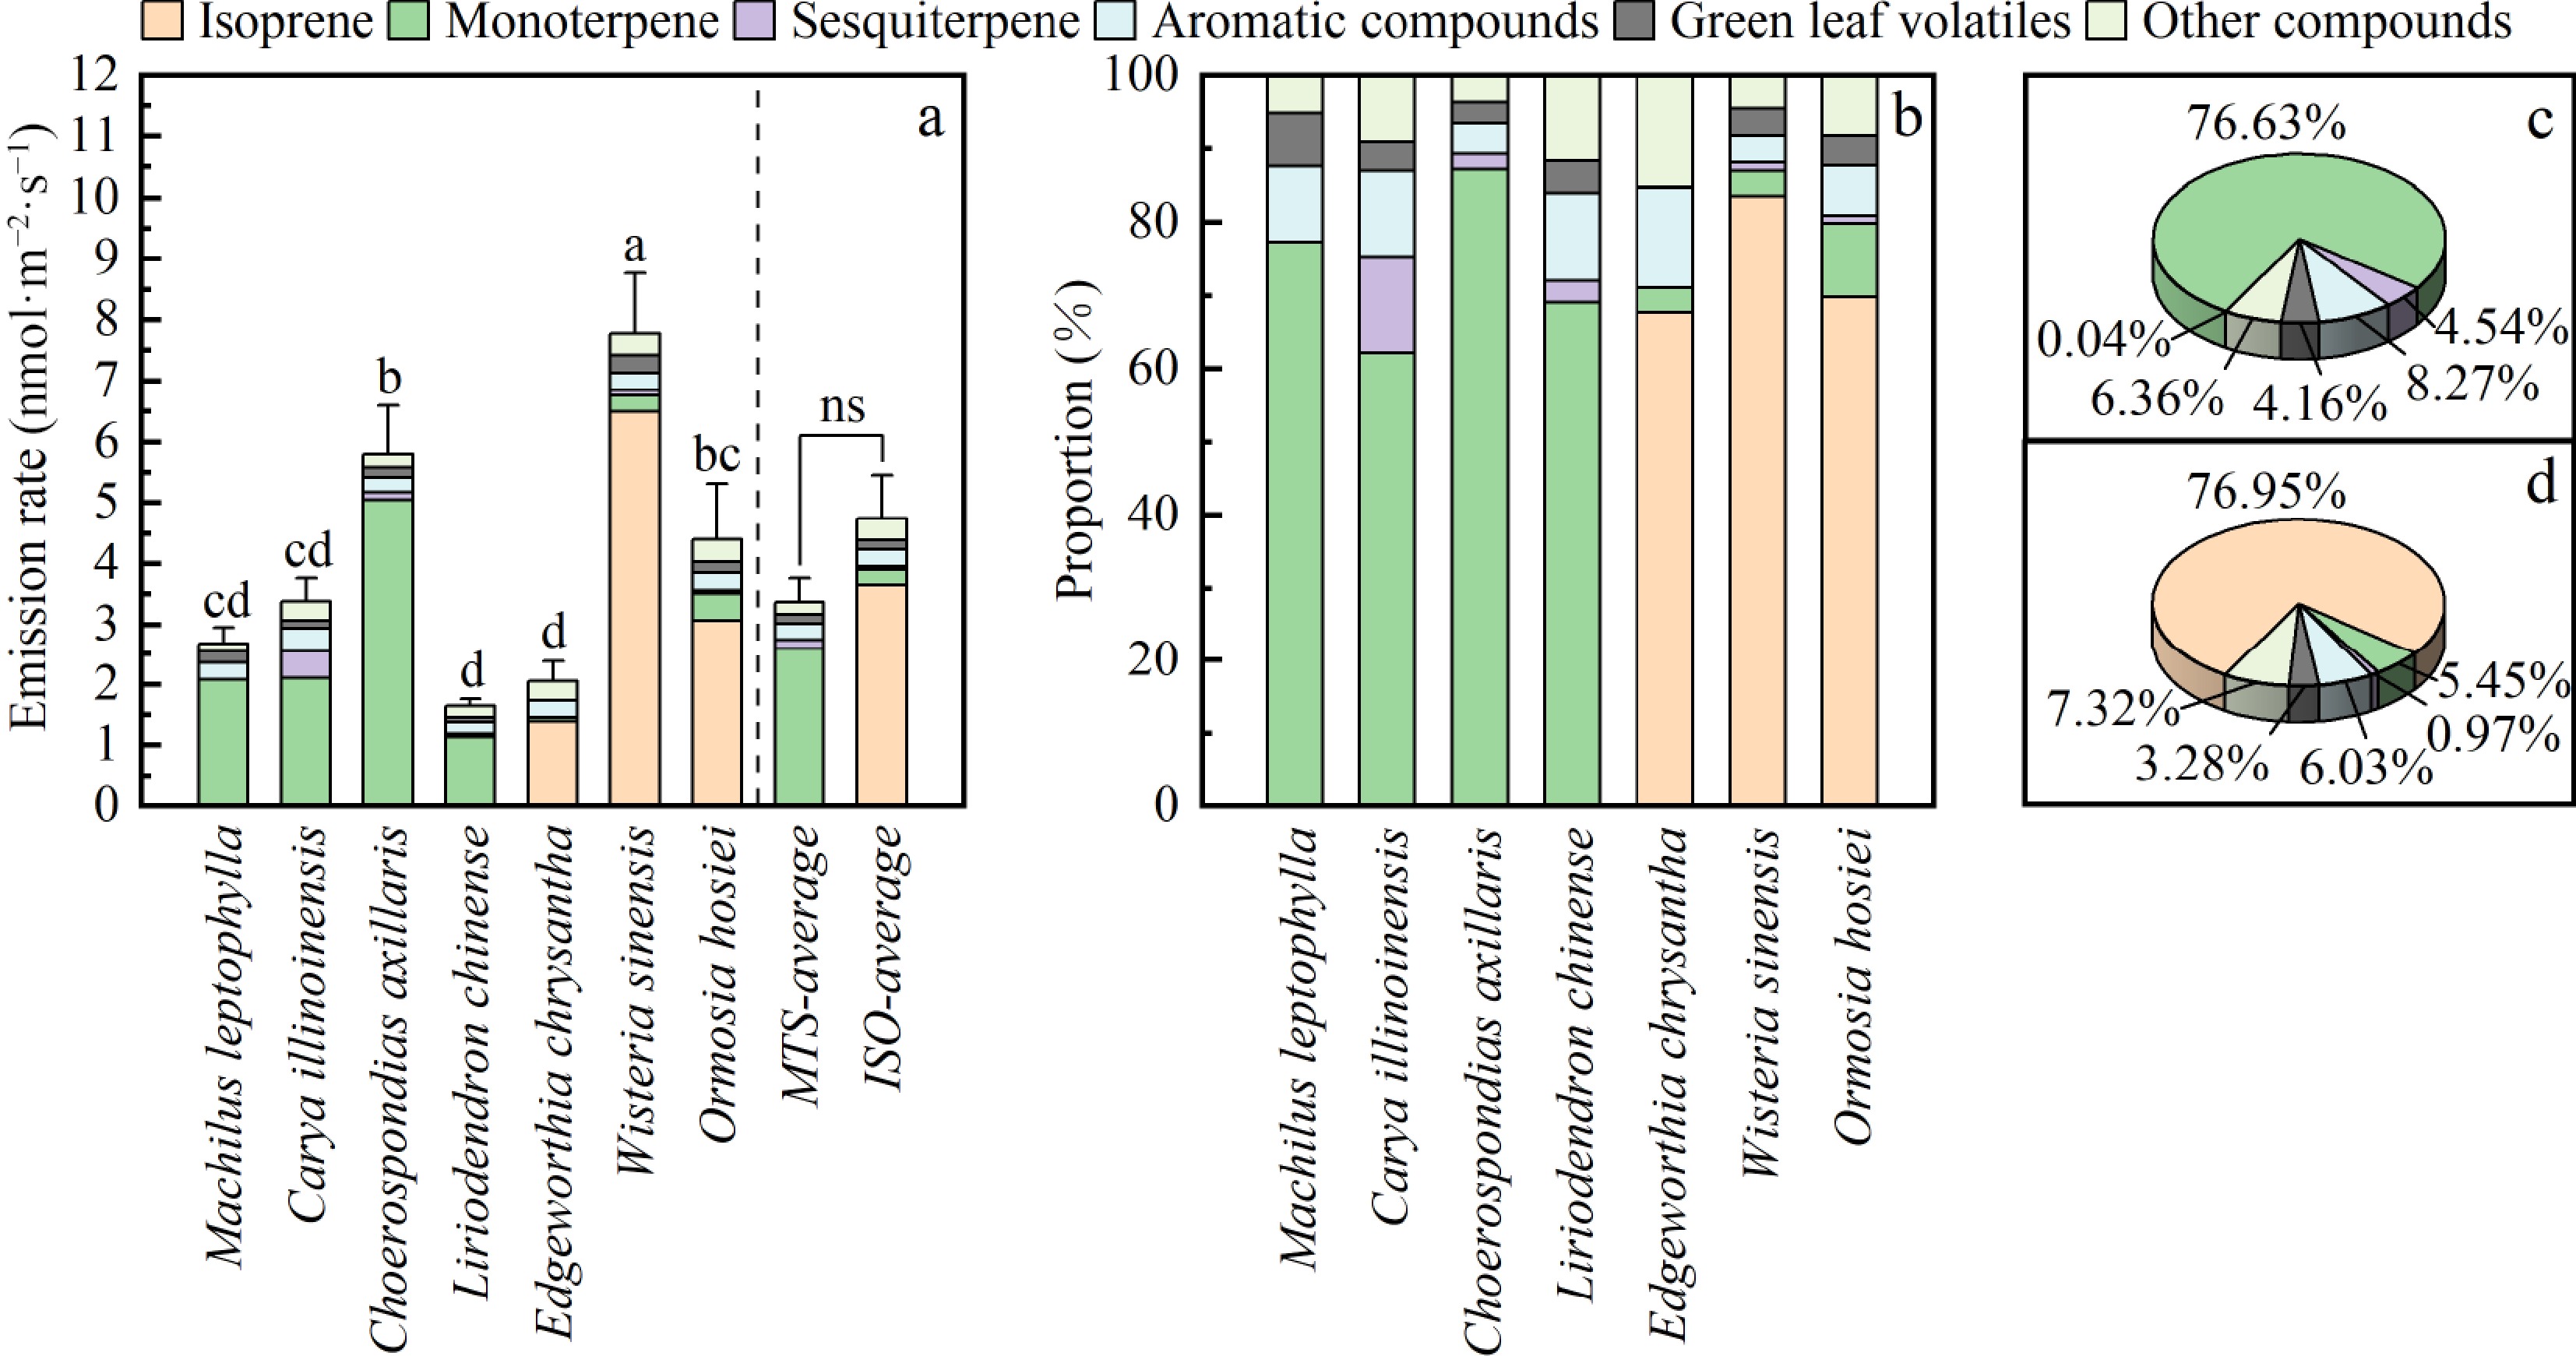
Figure 1.
BVOC emission profiles of seven plant species. (a) Total BVOC emission rates. (b) Relative compositional proportion of BVOCs for each species. (c) Compositional proportion of isoprene-dominant emitters (ISO). (d) Compositional proportion of monoterpene-dominant emitters (MTS). BVOC emission rates (nmol·m−2·s−1) for individual compounds and total emissions are provided in Supplementary Table S1. Different lowercase letters indicate significant differences among species (Tukey's test, p < 0.05). 'ns' denotes no significant difference between ISO and MTS groups (independent samples t-test, p > 0.05). Values are mean ± SE (n = 6).
-
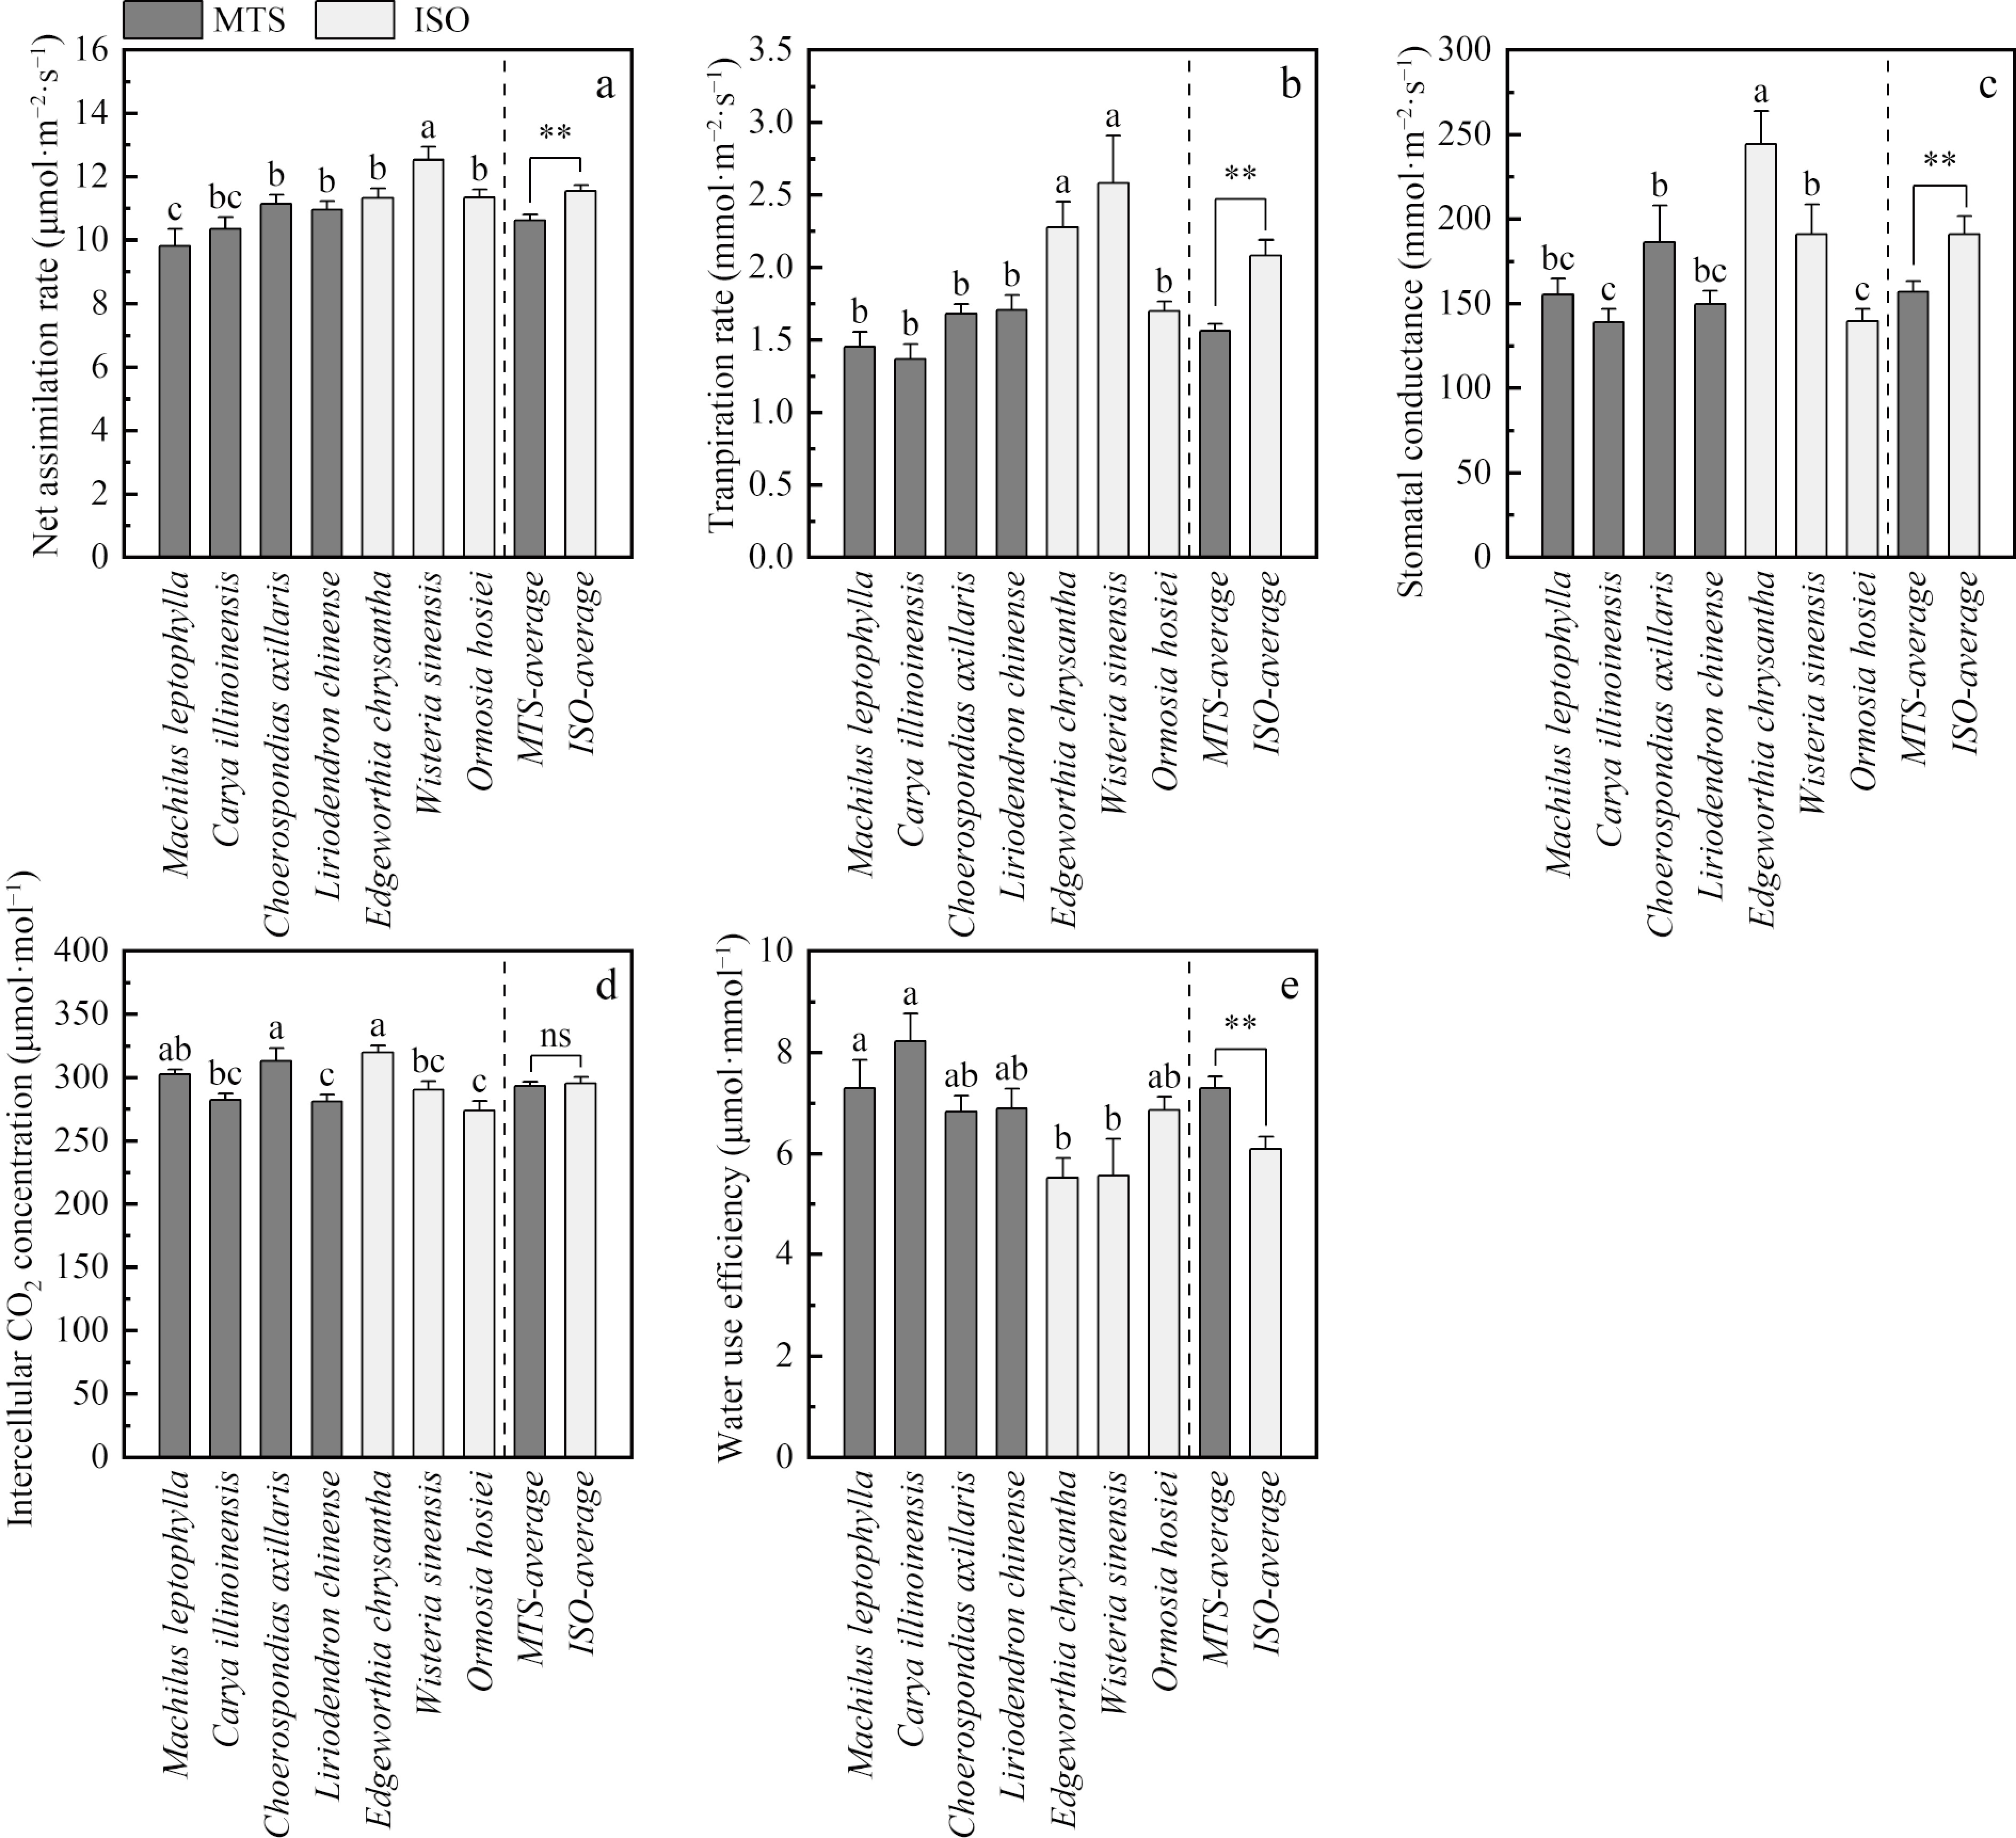
Figure 2.
Photosynthetic parameters under baseline conditions (PPFD 800 μmol·m−2·s−1, CO2 420 μmol·mol−1, 28 °C). MTS-average and ISO-average denote pooled values for monoterpene-dominant and isoprene-dominant types, respectively. Lowercase letters indicate significant differences among the seven species (Tukey's test, p < 0.05). Asterisks indicate significant differences between MTS and ISO groups (* p < 0.05, ** p < 0.01; independent samples t-test); 'ns' indicates no significant difference. Values are mean ± standard error (SE) (n = 6).
-
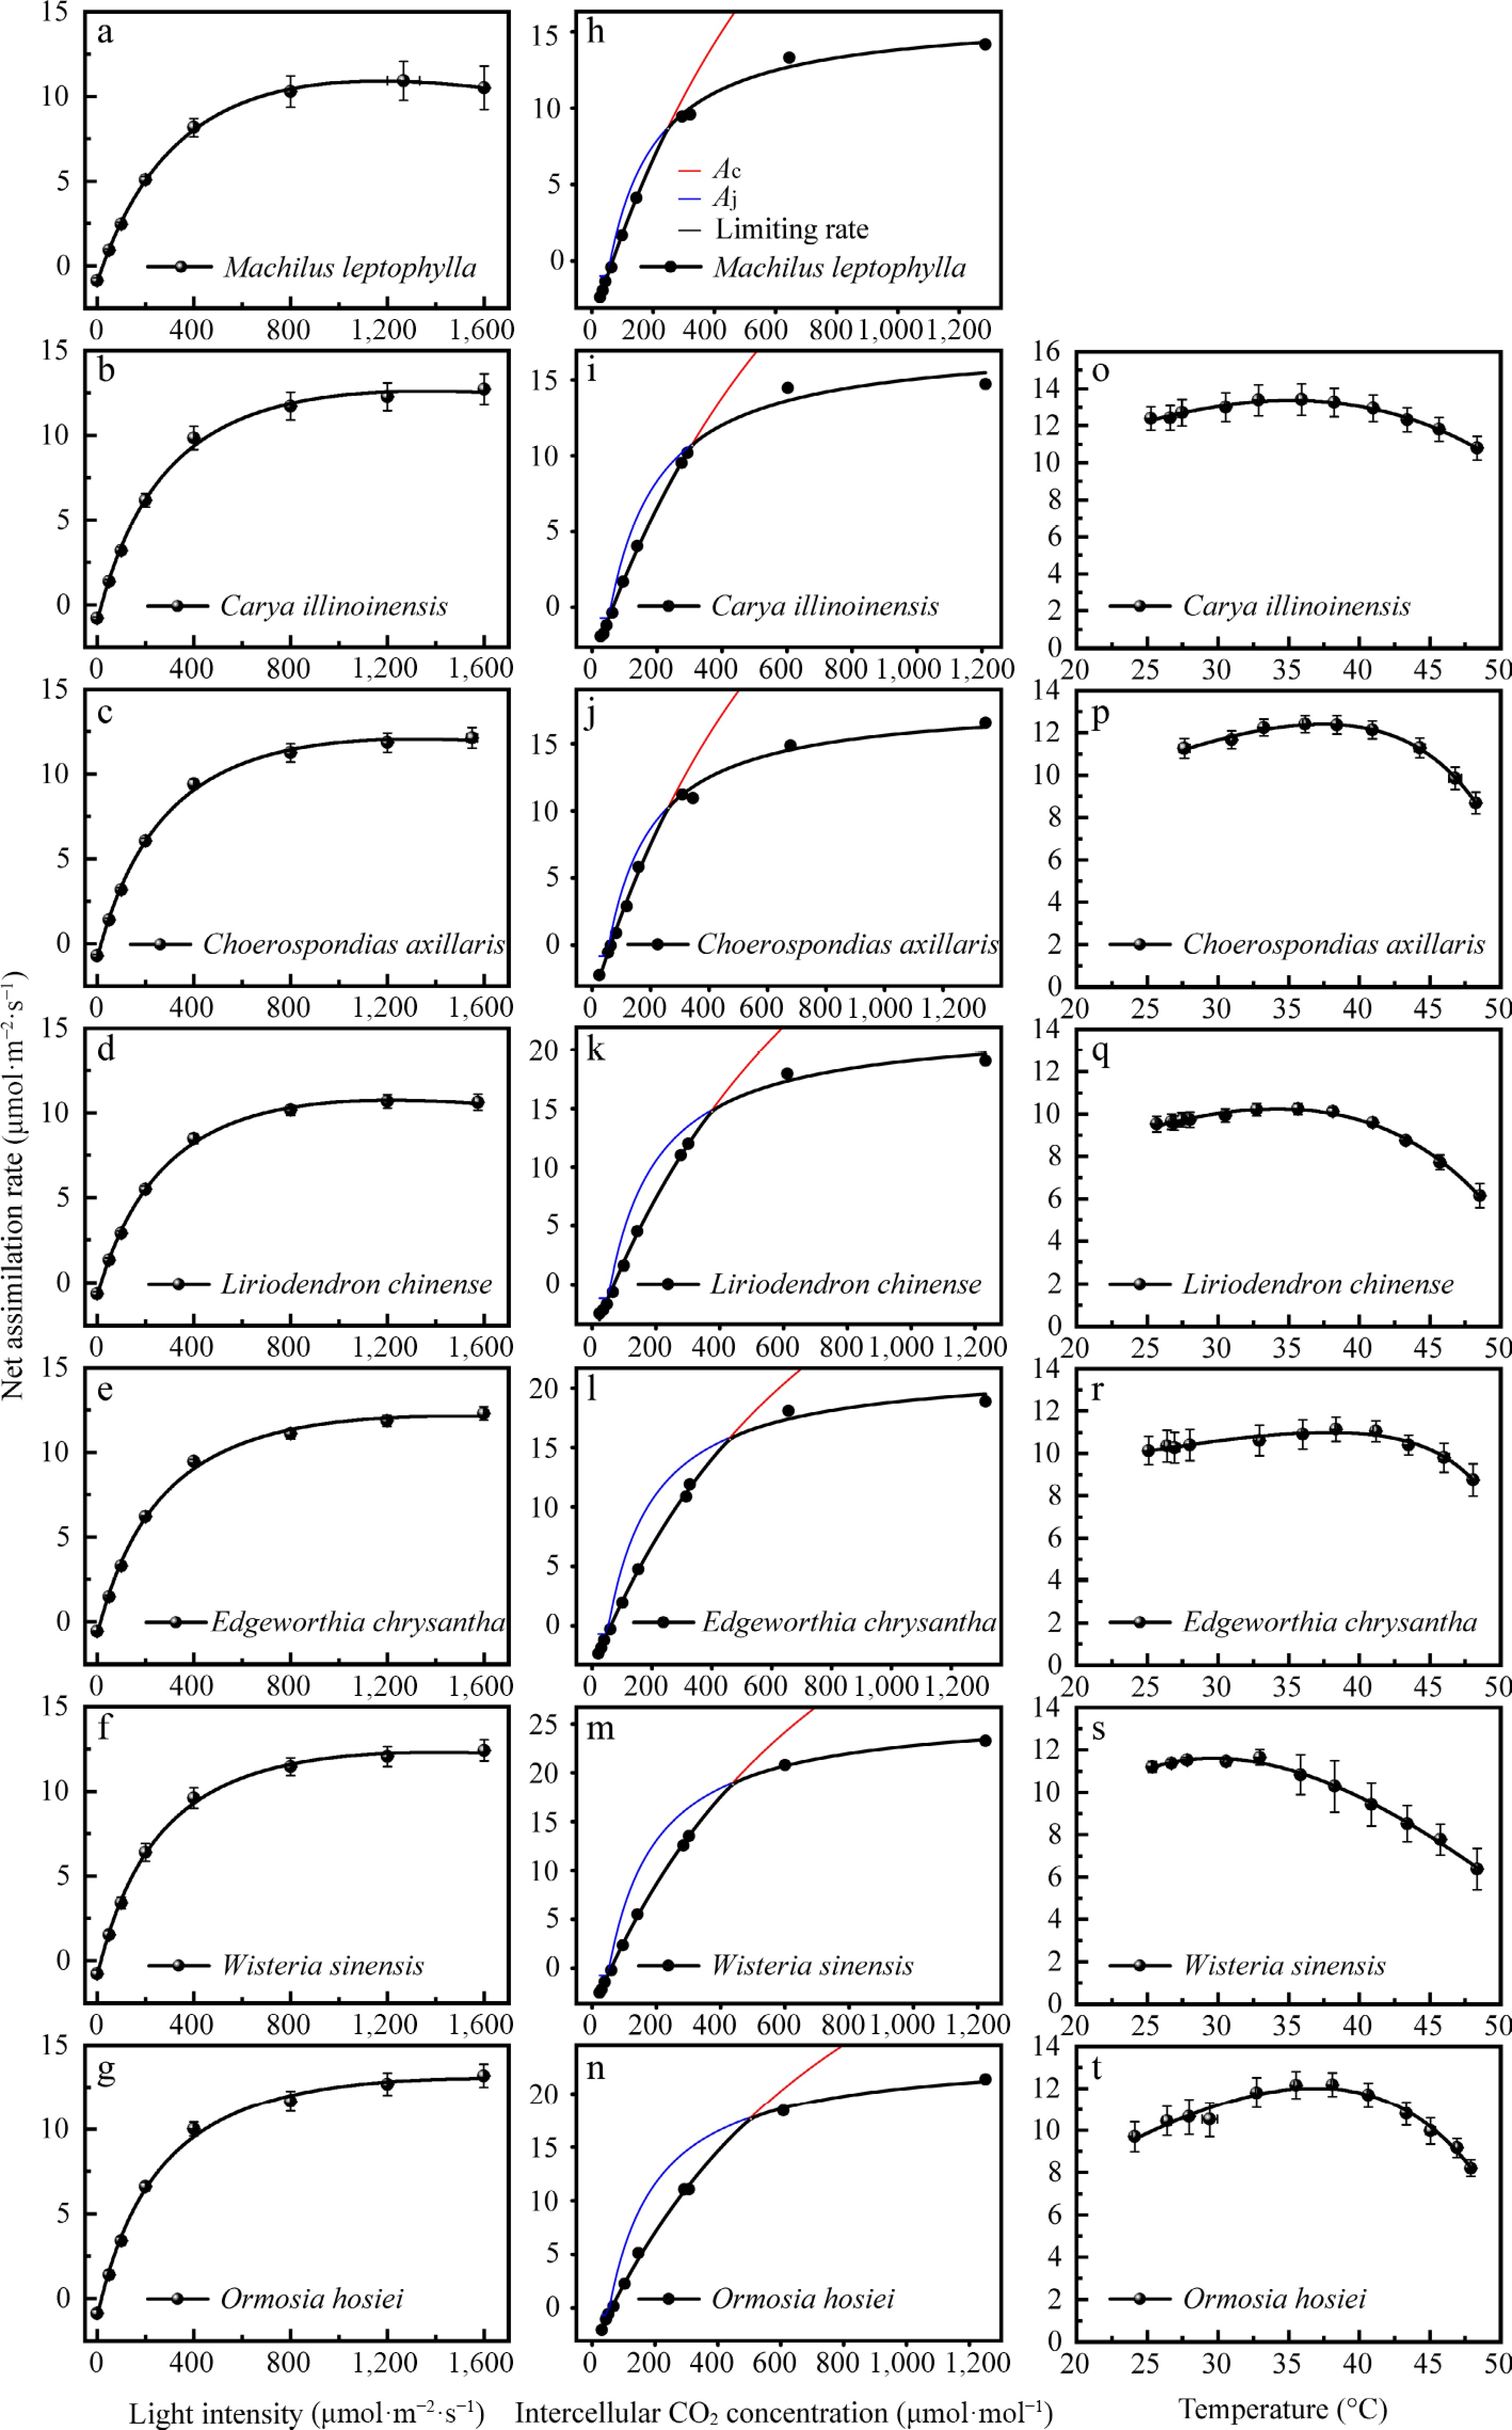
Figure 3.
Photosynthetic response curves. (a)−(g) Light response curves (A-L). (h)−(n) CO2 response curves (A-Ci). (o)−(t) Temperature response curves (A-T). A, net assimilation rate. Ac and Aj donate Rubisco activity-limited and RuBP regeneration-limited stages, respectively, derived from A-Ci curves. Curve fitting statistics are provided in Table 2 (R2 > 0.98, p < 0.05 for all fits).
-
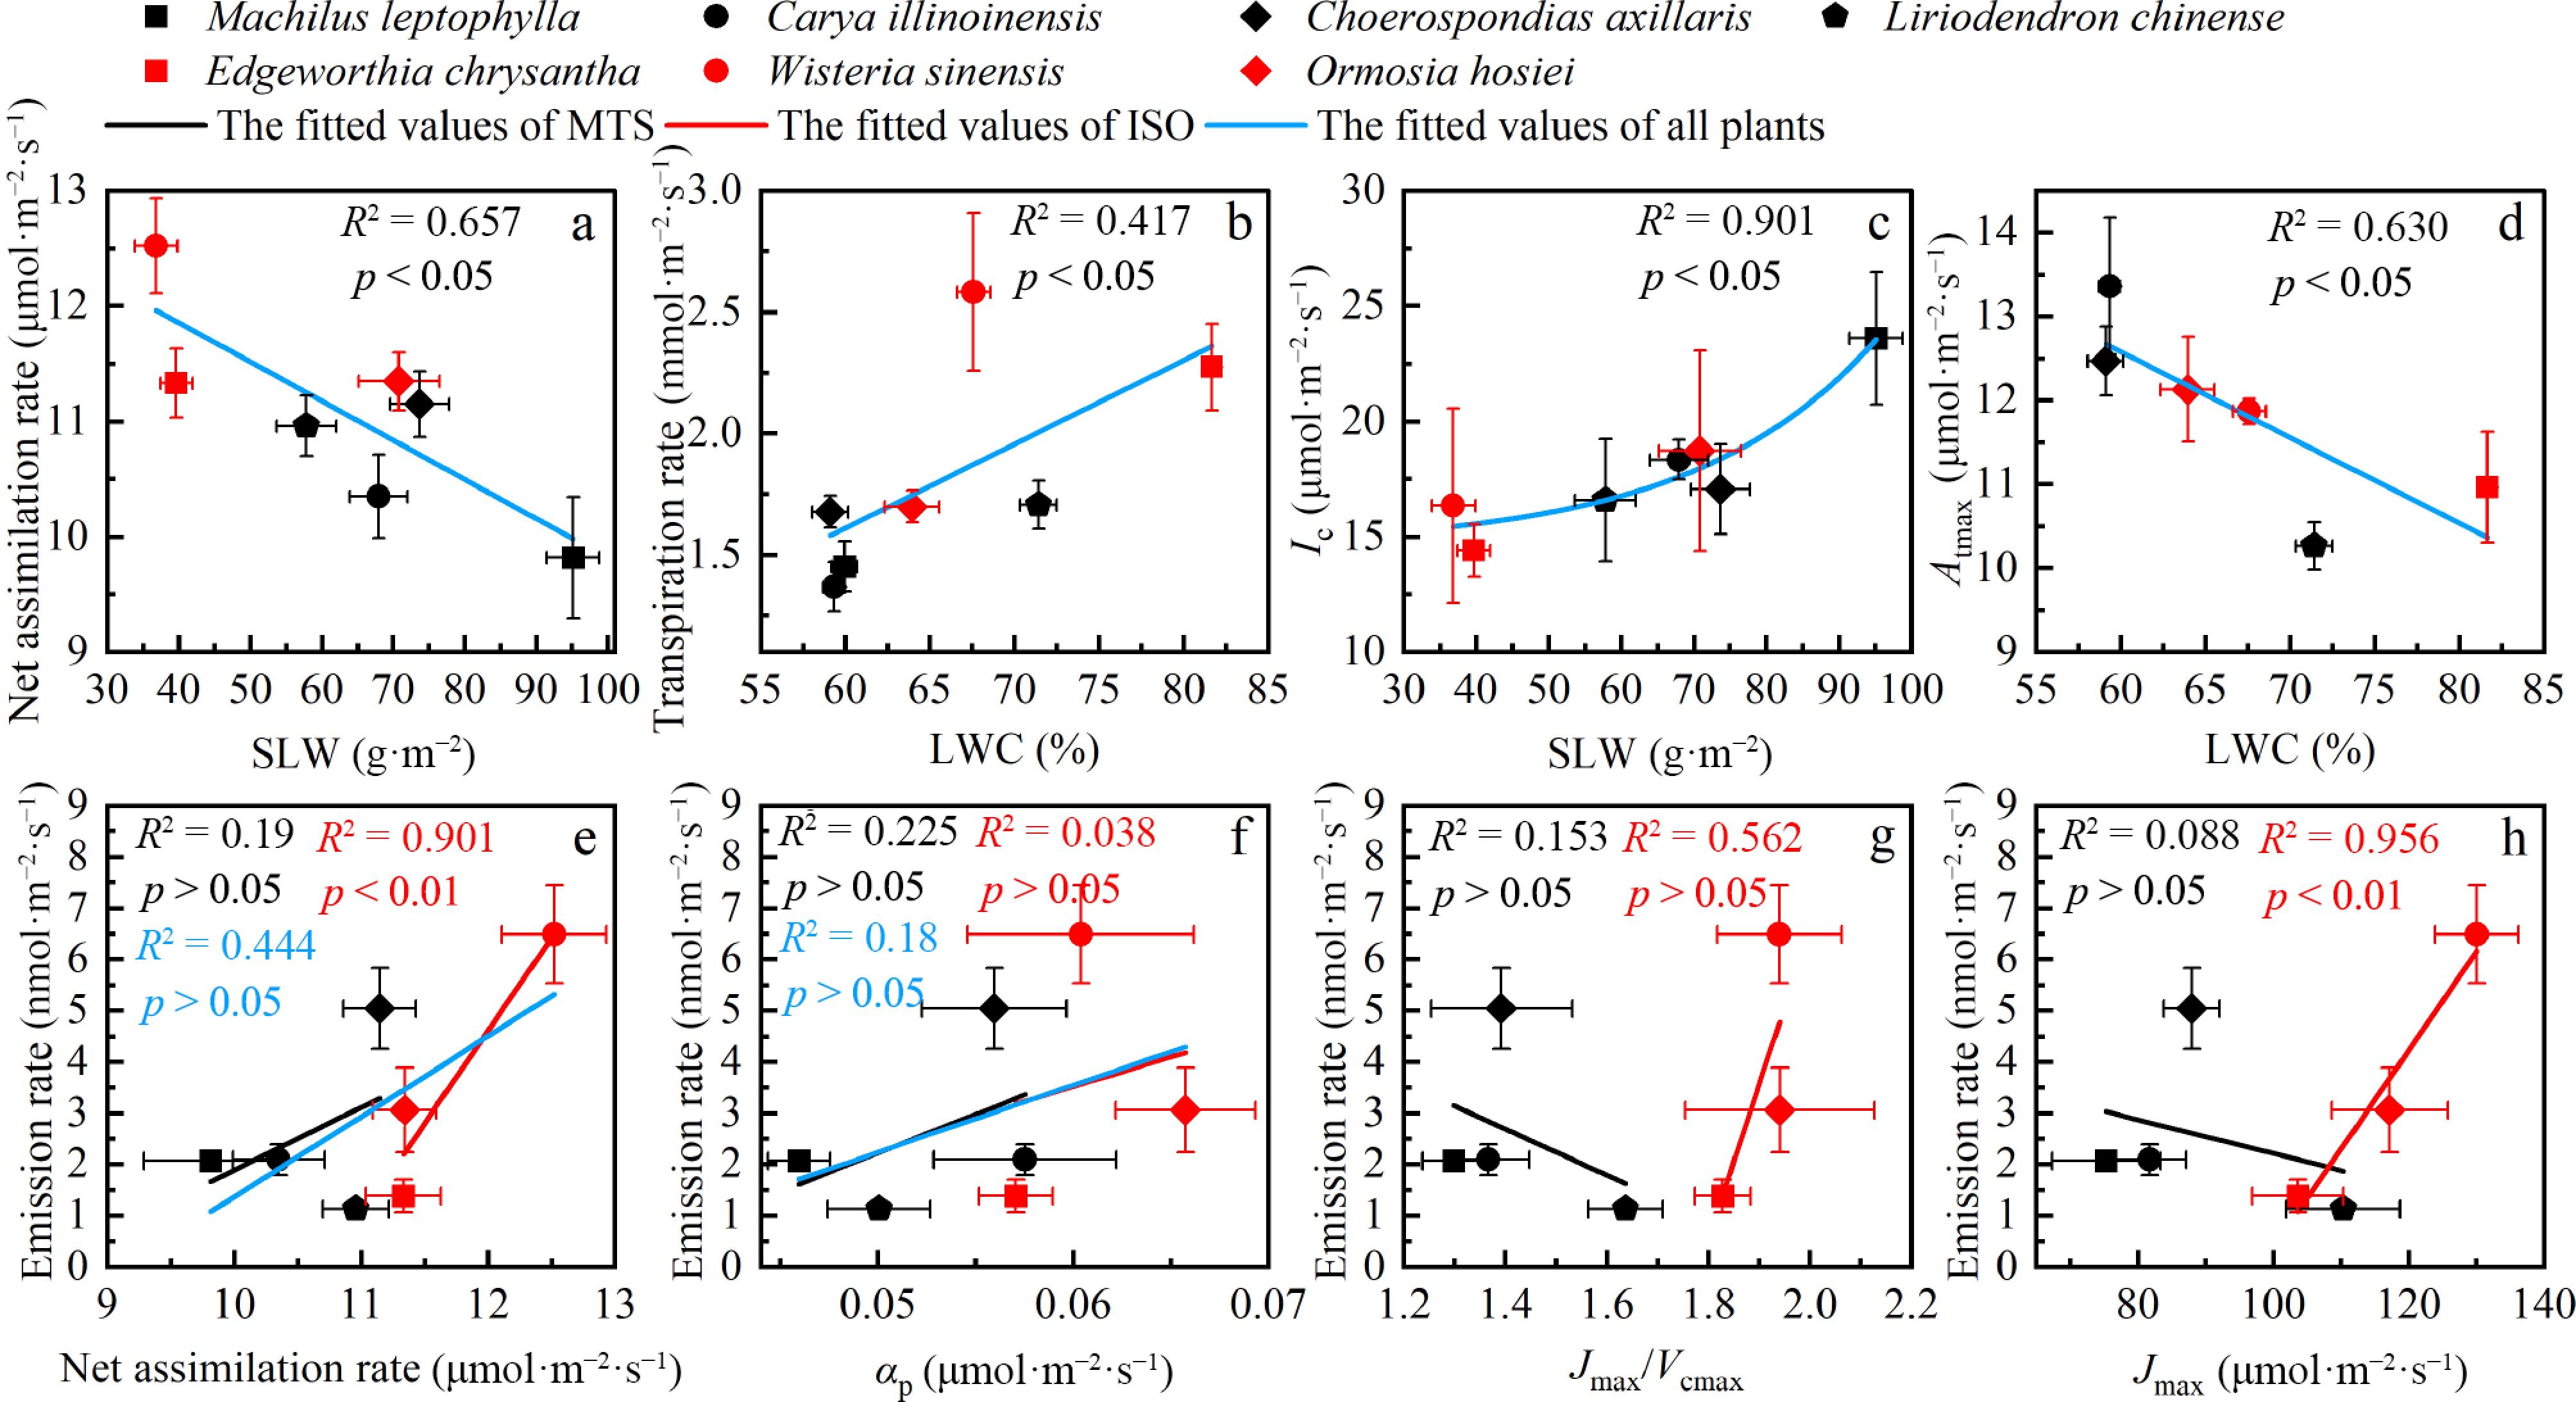
Figure 4.
Correlations among leaf traits, photosynthetic parameters, and BVOC emissions. (a)–(d) Leaf traits vs photosynthetic parameters; (e)–(h) BVOC emissions vs photosynthetic parameters. Correlation coefficients (R2) and significance levels are shown for each relationship (ns, p > 0.05; * p < 0.05; ** p < 0.01). Abbreviations: SLW, specific leaf weight; LWC, leaf water content; other parameters defined in Table 2.
-
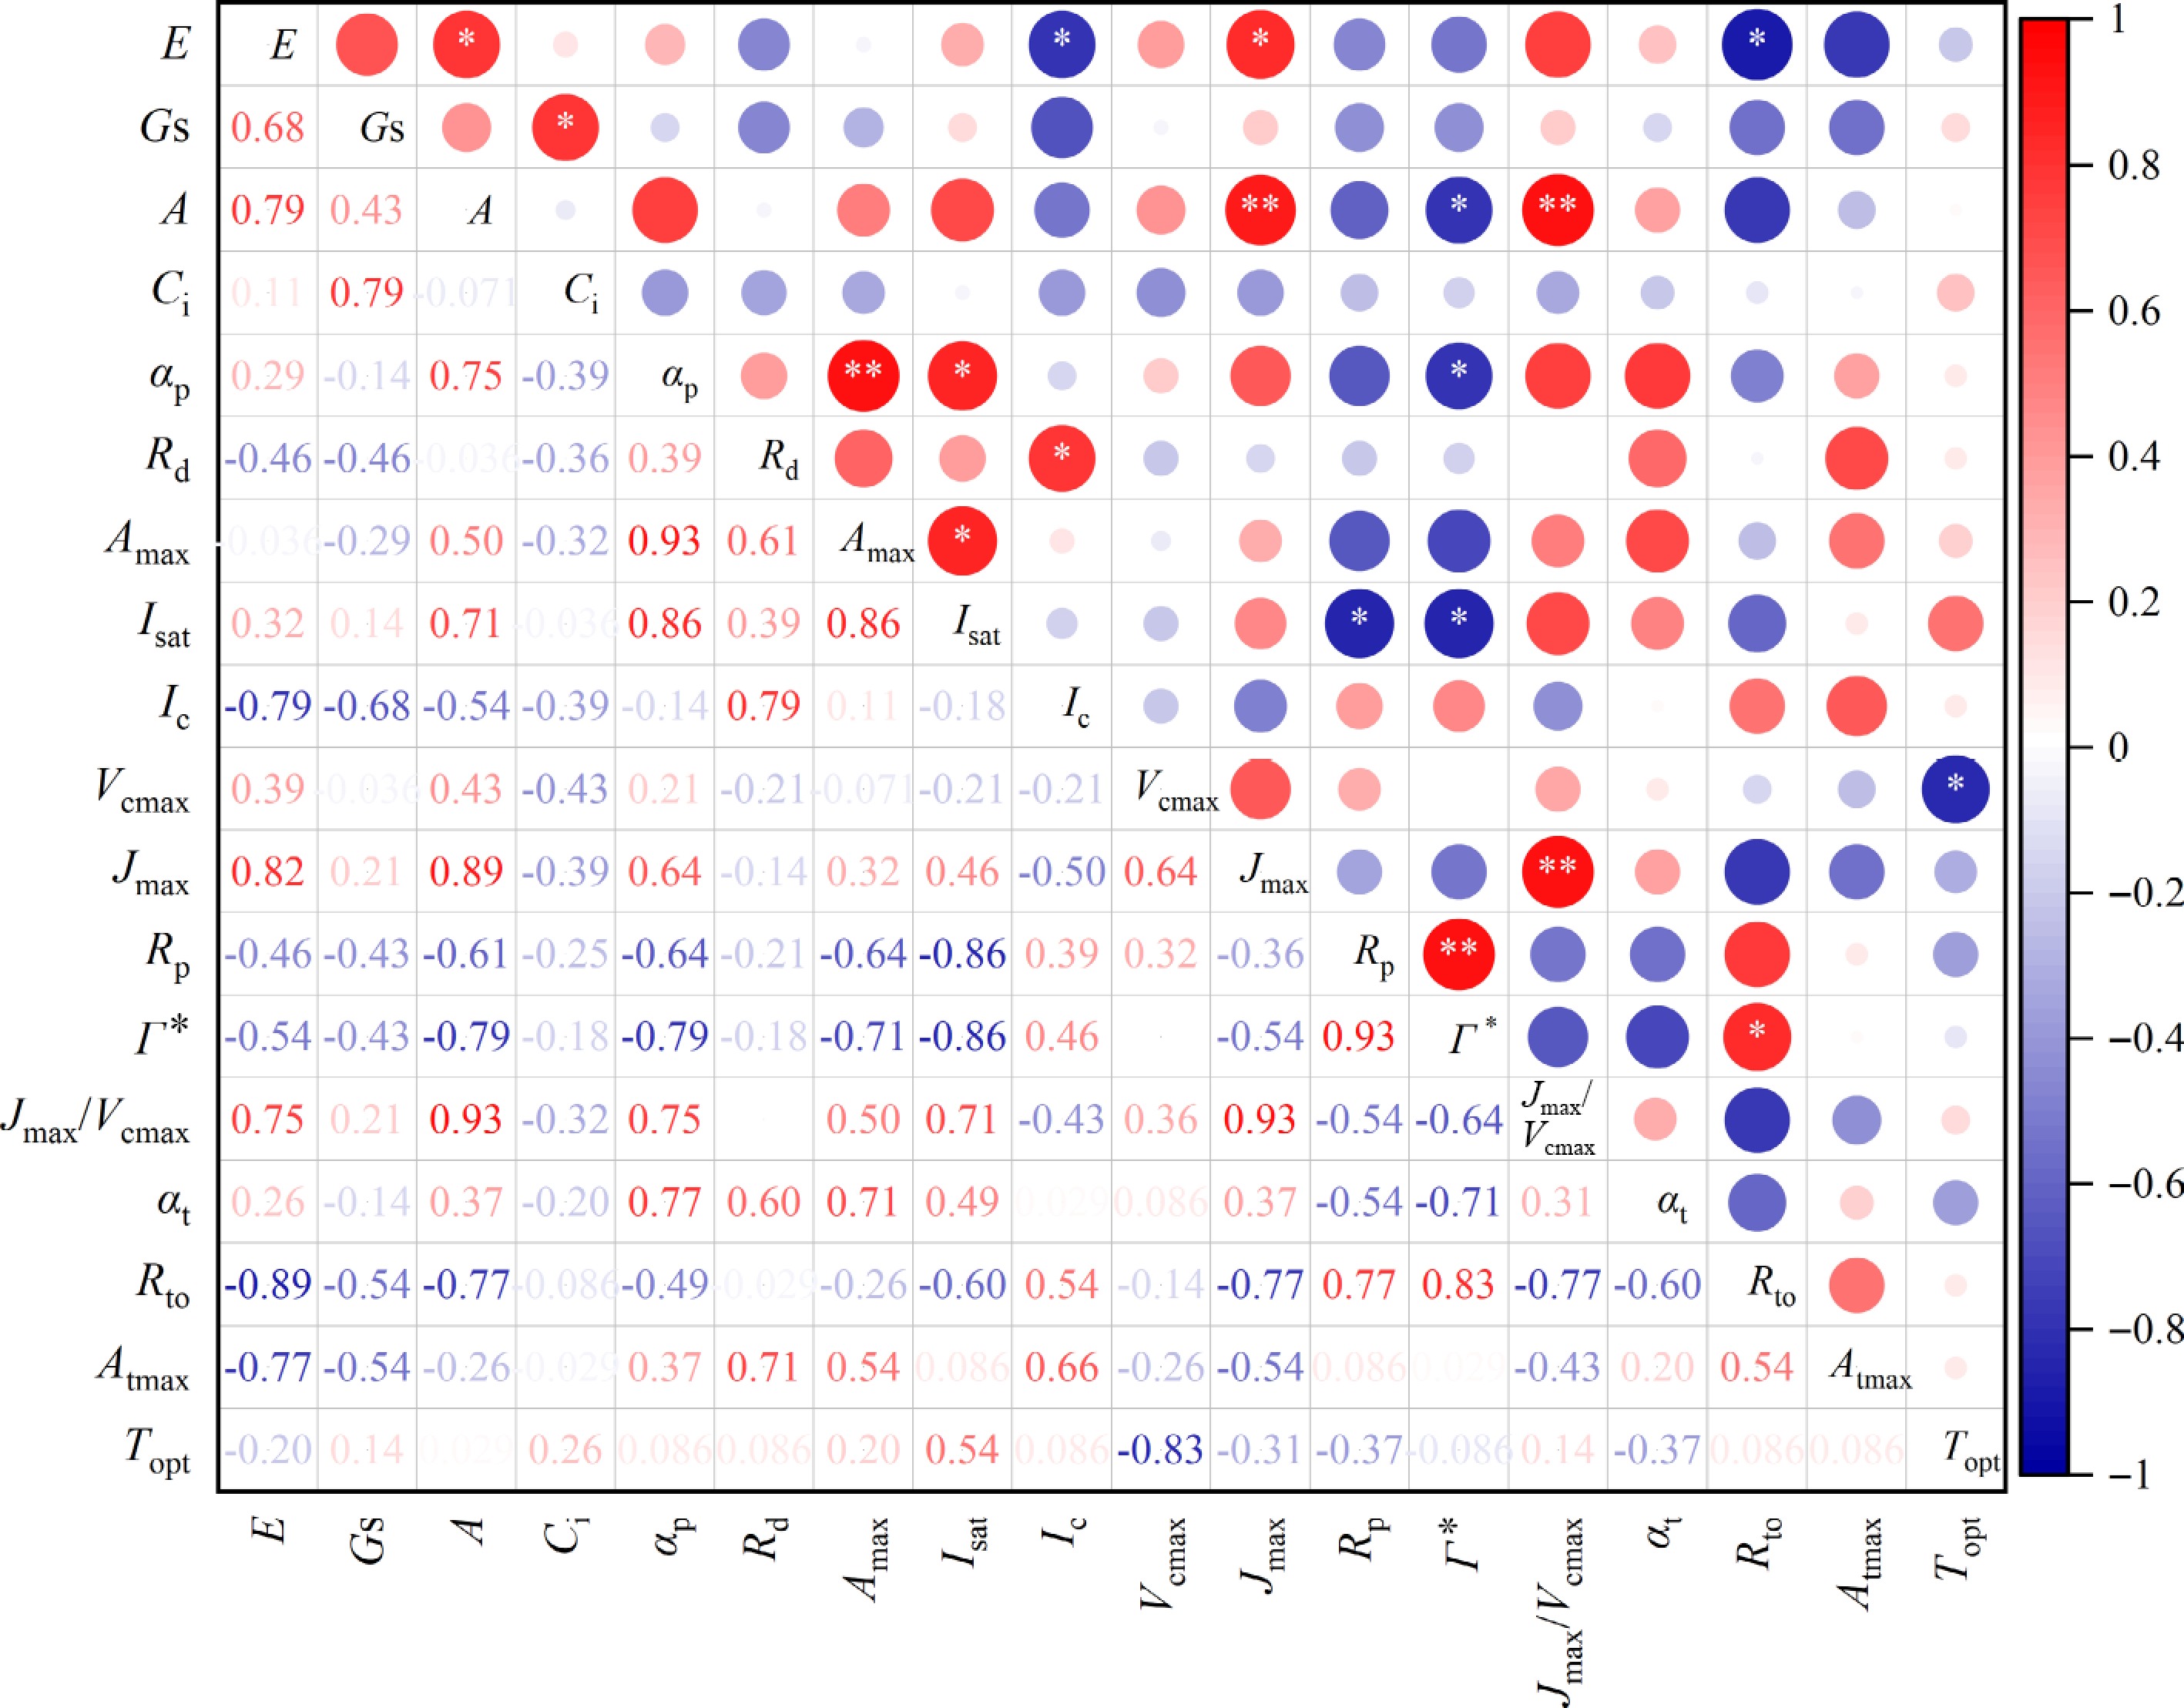
Figure 5.
Spearman correlation matrix of photosynthetic parameters. E, Transpiration rate, Gs: Stomatal conductance, A: Net assimilation rate, Ci: Intercellular CO2 concentration; other parameters (αp, Rd, Amax, Isat, Ic, Vcmax, Jmax, Rp, Γ*, Jmax/Vcmax, αt, Atmax, and Topt) defined in Table 2. Color scale indicates correlation coefficient (r). * p < 0.05, ** p < 0.01.
-
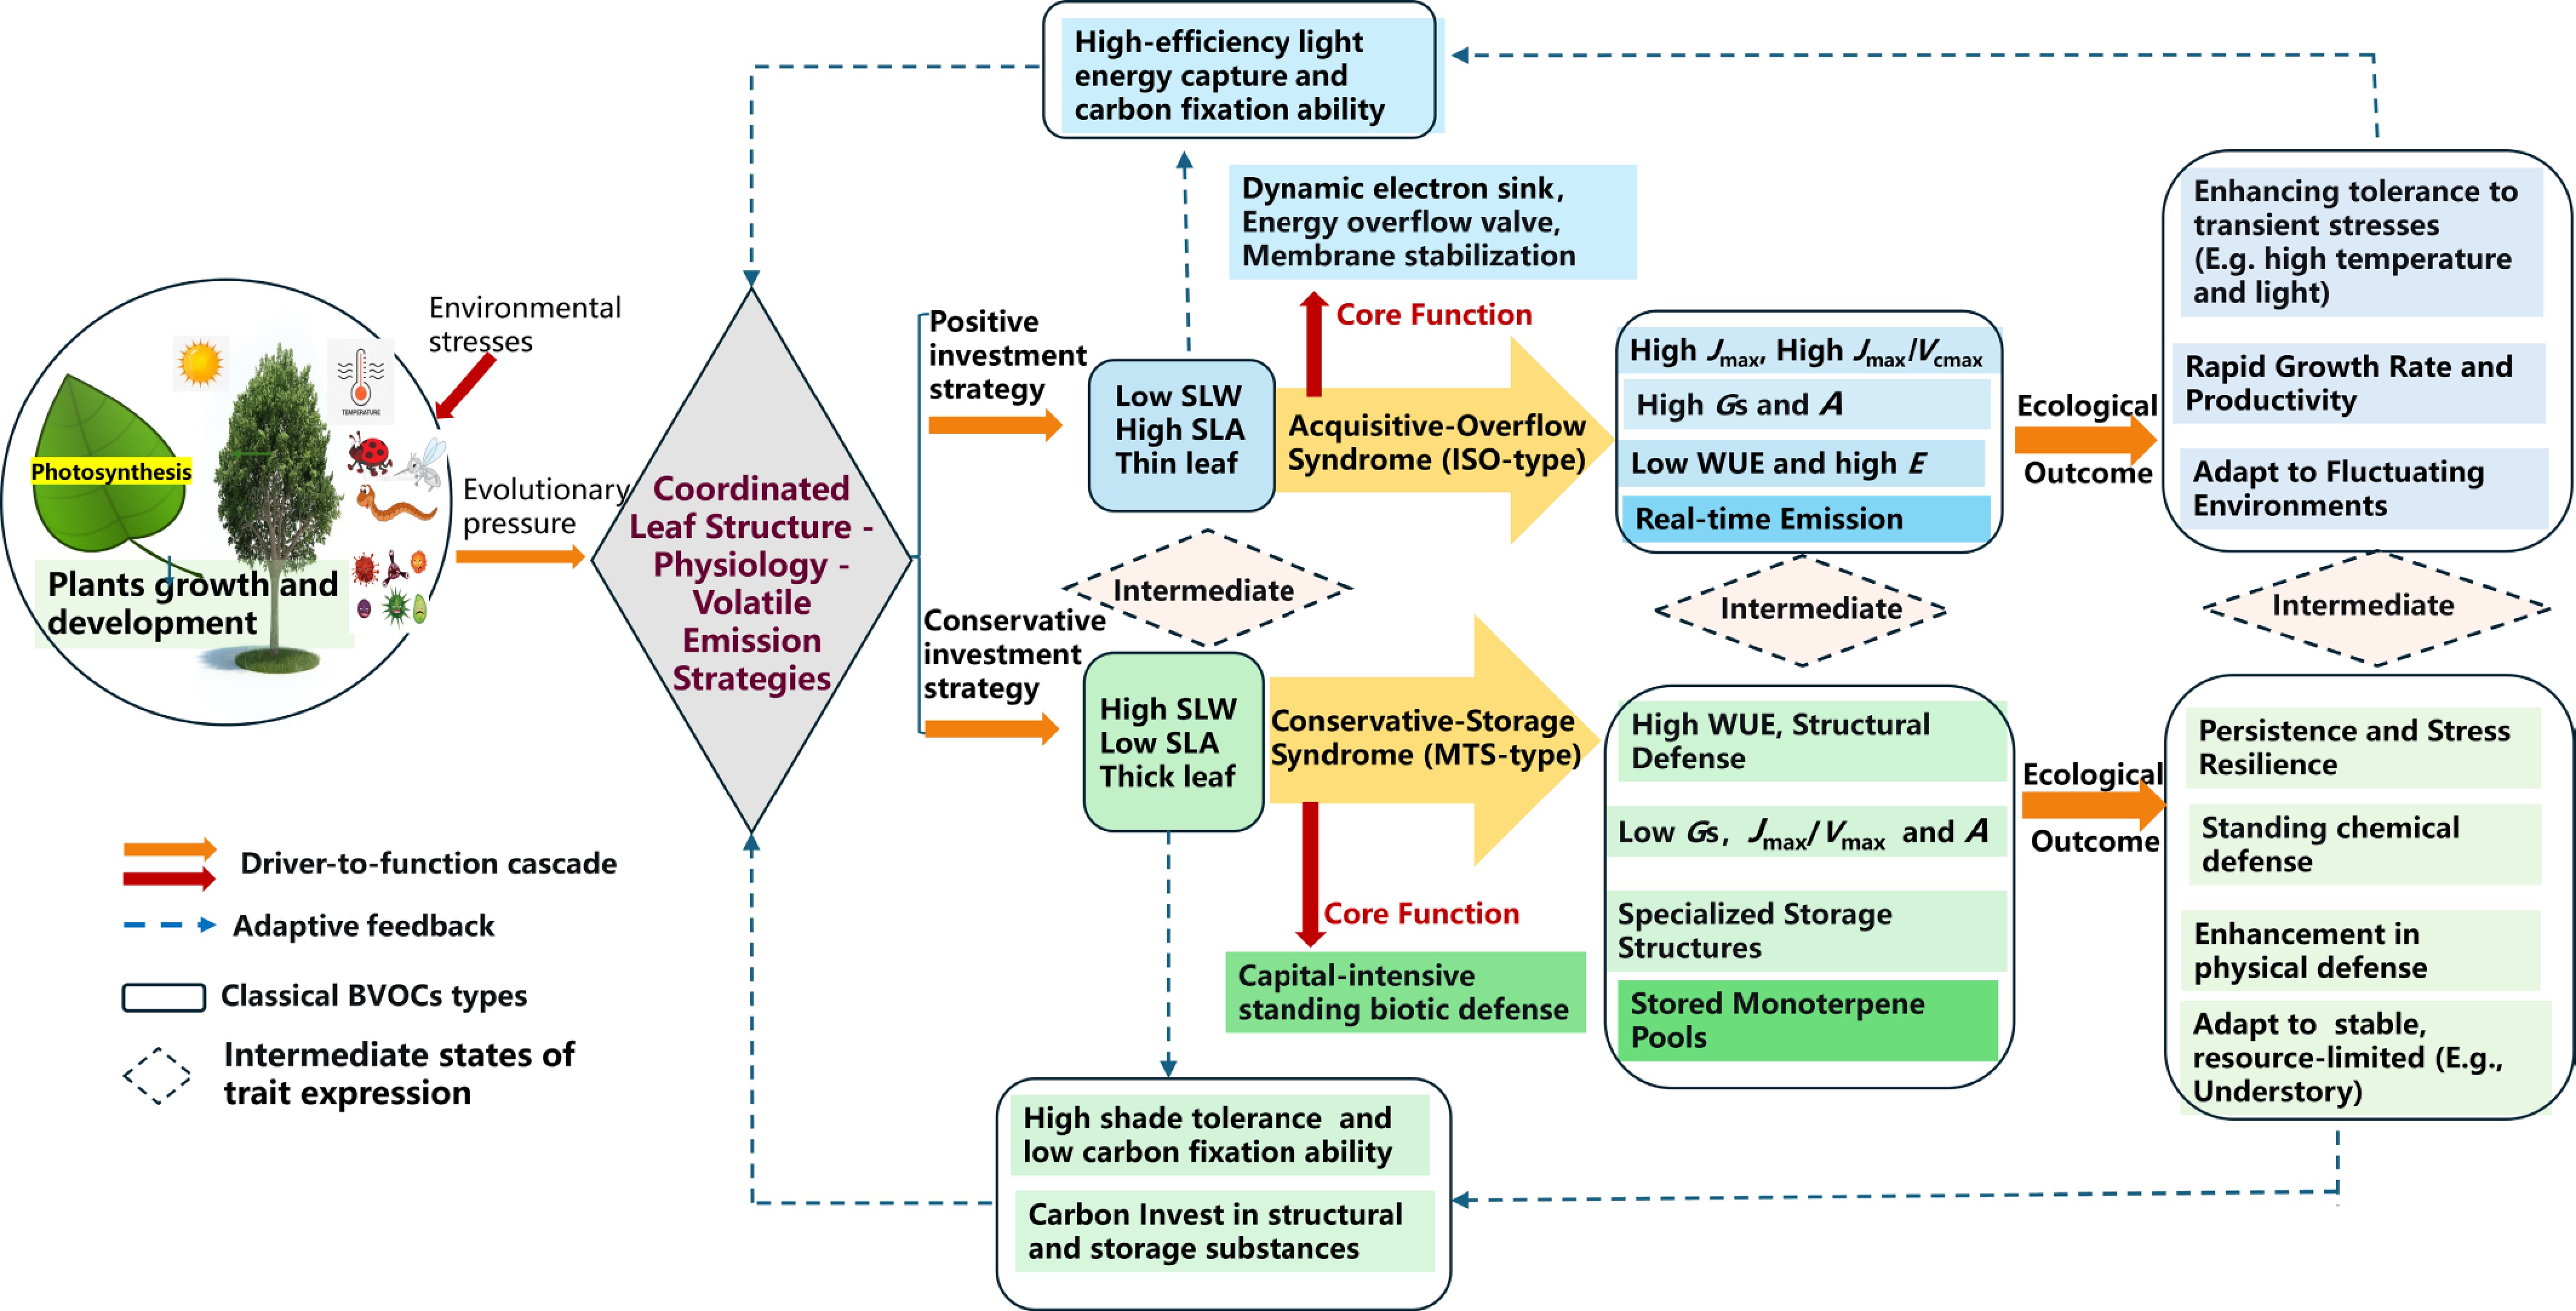
Figure 6.
Conceptual model of structure–function–volatile syndromes in subtropical woody species. Solid arrows indicate environmental drivers; dotted arrows indicate functional feedbacks; dashed box represent intermediate trait states; and solid boxes represent classical ISO/MTS emission traits. Abbreviations: ISO, isoprene-dominant; MTS, monoterpene-dominant; others defined in Tables 1 and 2.
-
Species Family Genus Leaf water content (LWC, %) Specific leaf dry weight (SLW, g·m−2) Specific leaf area (SLA, cm2·g−1) Ecological niche Machilus leptophylla Lauraceae Machilus 59.945 ± 0.743e 95.138 ± 3.69a 105.883 ± 3.993c ST, CT; evergreen understory tree in subtropical forests; prefers moist, well-drained soils Carya illinoinensis Juglandaceae Carya 59.331 ± 0.623e 67.961 ± 4.007bc 149.701 ± 8.718b CT; introduced deciduous tree, cultivated, adapted to full sun and deep soils Choerospondias axillaris Anacardiaceae Choerospondias 59.1 ± 1.043e 73.674 ± 4.081b 137.784 ± 7.432bc LT, ST; light-demanding and fast-growing deciduous tree, common on forest margins and open slopes Liriodendron chinense Magnoliaceae Liriodendron 71.424 ± 1.076b 57.852 ± 4.23c 177.605 ± 13.222b LT, HT, CT; fast-growing, pioneer deciduous tree of valleys and moist mountainous forests Edgeworthia chrysantha Thymelaeaceae Edgeworthia 81.657 ± 0.346a 39.692 ± 2.254d 255.901 ± 14.084a LT, ST; deciduous understory shrub, tolerates semi-shade; often found along streams or in moist ravines Wisteria sinensis Fabaceae Wisteria 67.593 ± 0.975c 36.846 ± 3.01d 281.382 ± 24.679a LT, ST, CT, DT, WT; light-demanding deciduous liana, climbing on forest edges, open areas, and riparian zones Ormosia hosiei Fabaceae Ormosia 63.953 ± 1.604d 70.813 ± 5.667b 145.939 ± 11.994bc LT, ST, CT; semi-evergreen tree of mixed broadleaf forests, tolerating partial shade LT, light-tolerant; ST, shade-tolerant; HT, heat-tolerant; CT, cold-tolerant; DT, drought-tolerant; WT, waterlogging-tolerant. Values are mean ± SE (n = 6). Different lowercase letters with a column indicate significant differences (Tukey's test, p < 0.05). Table 1.
Leaf functional traits and ecological characteristics of seven woody species.
-
Species Machilus leptophylla Carya illinoinensis Choerospondias axillaris Liriodendron chinense Edgeworthia chrysantha Wisteria sinensis Ormosia hosiei Fitting parameters of the light response curve Amax 11.118 ± 1.156a 12.61 ± 0.876a 12.117 ± 0.602a 10.85 ± 0.381a 12.154 ± 0.378a 12.333 ± 0.592a 13.1 ± 0.691a Isat 1,309.962 ± 67.986b 1,351.746 ± 28.021b 1,325.645 ± 67.633b 1,269.557 ± 82.395b 1,474.862 ± 47.225b 1,429.707 ± 116.537b 1,877.378 ± 166.234a Ic 23.599 ± 2.874a 18.335 ± 0.856a 17.051 ± 1.956a 16.578 ± 2.646a 14.387 ± 1.131a 16.335 ± 4.216a 18.709 ± 4.339a αp 0.046 ± 0.002c 0.058 ± 0.005ab 0.056 ± 0.004abc 0.05 ± 0.003bc 0.057 ± 0.002ab 0.06 ± 0.006ab 0.066 ± 0.004a Rd 1.031 ± 0.143a 1.005 ± 0.097a 0.895 ± 0.095a 0.776 ± 0.124a 0.784 ± 0.063a 0.932 ± 0.233a 1.113 ± 0.208a R2 0.998 0.997 0.998 0.998 0.997 0.998 0.995 Fitting parameters of CO2 response curve Vcmax 57.66 ± 4.595a 60.462 ± 4.331a 65.766 ± 5.802a 67.173 ± 3.386a 56.394 ± 2.309a 67.213 ± 1.684a 62.018 ± 4.381a Jmax 75.331 ± 8.063e 81.705 ± 5.382de 87.955 ± 4.147cde 110.347 ± 8.418abc 103.649 ± 6.705bcd 130.073 ± 6.155a 117.24 ± 8.541ab Rp 0.99 ± 0.111ab 0.798 ± 0.114ab 1.134 ± 0.195ab 1.328 ± 0.305a 0.714 ± 0.073b 0.74 ± 0.042ab 0.778 ± 0.109ab Γ* 68.527 ± 3.059ab 64.978 ± 2.238ab 67.686 ± 3.06ab 70.201 ± 4.286a 62.787 ± 1.173ab 59.053 ± 0.322b 63.008 ± 2.015ab Jmax/Vcmax 1.299 ± 0.061b 1.366 ± 0.082b 1.393 ± 0.139b 1.637 ± 0.073ab 1.828 ± 0.055a 1.94 ± 0.123a 1.941 ± 0.186a R2 0.996 0.995 0.989 0.997 0.997 0.999 0.997 Fitting parameters of temperature response curve αt 0.594 ± 0.214b 0.364 ± 0.054b 0.407 ± 0.053b 0.473 ± 0.12b 1.403 ± 0.872a 0.493 ± 0.064b Atmax 13.359 ± 0.815a 12.465 ± 0.411ab 10.262 ± 0.285c 10.963 ± 0.662bc 11.868 ± 0.15abc 12.129 ± 0.626abc Topt 35.2 ± 0.43a 37.086 ± 0.965a 34.39 ± 0.85a 37.593 ± 1.078a 31.024 ± 1.89b 37.282 ± 0.636a R2 0.985 0.988 0.995 0.972 0.975 0.967 Note: abbreviations: Amax: maximum net assimilation rate (μmol·m−2·s−1); Isat: light saturation point (μmol·m−2·s−1); Ic: light compensation point (μmol·m−2·s−1); αp: initial quantum efficiency (μmol CO2 μmol–1 photons); Rd: dark respiration rate (μmol·m-2·s−1); Vcmax: maximum carboxylation rate of Rubisco enzyme (μmol·m−2·s−1); Jmax: maximum electron transfer rate (μmol·m−2·s−1); Rp: respiratory rate under light (μmol·m−2·s−1); Γ*: CO2 compensation point (μmol·mol−1); Jmax/Vcmax: the ratio of Jmax to Vcmax (μmol electrons [μmol CO2]−1); αt: initial slope (μmol·m−2·s−1); Atmax: maximum net assimilation rate in temperature response curve (μmol·m−2·s−1); Topt: optimal temperature (°C) corresponding to maxima net assimilation rate; R2: fitting coefficient. Values are mean ± SE (n = 6). Different letters within a row indicate significant differences (LSD test, p < 0.05). Table 2.
Photosynthetic parameters derived from the response curves to light (A-L), CO2 (A-Ci) and temperature (A-T.) in seven woody species.
Figures
(6)
Tables
(2)