-
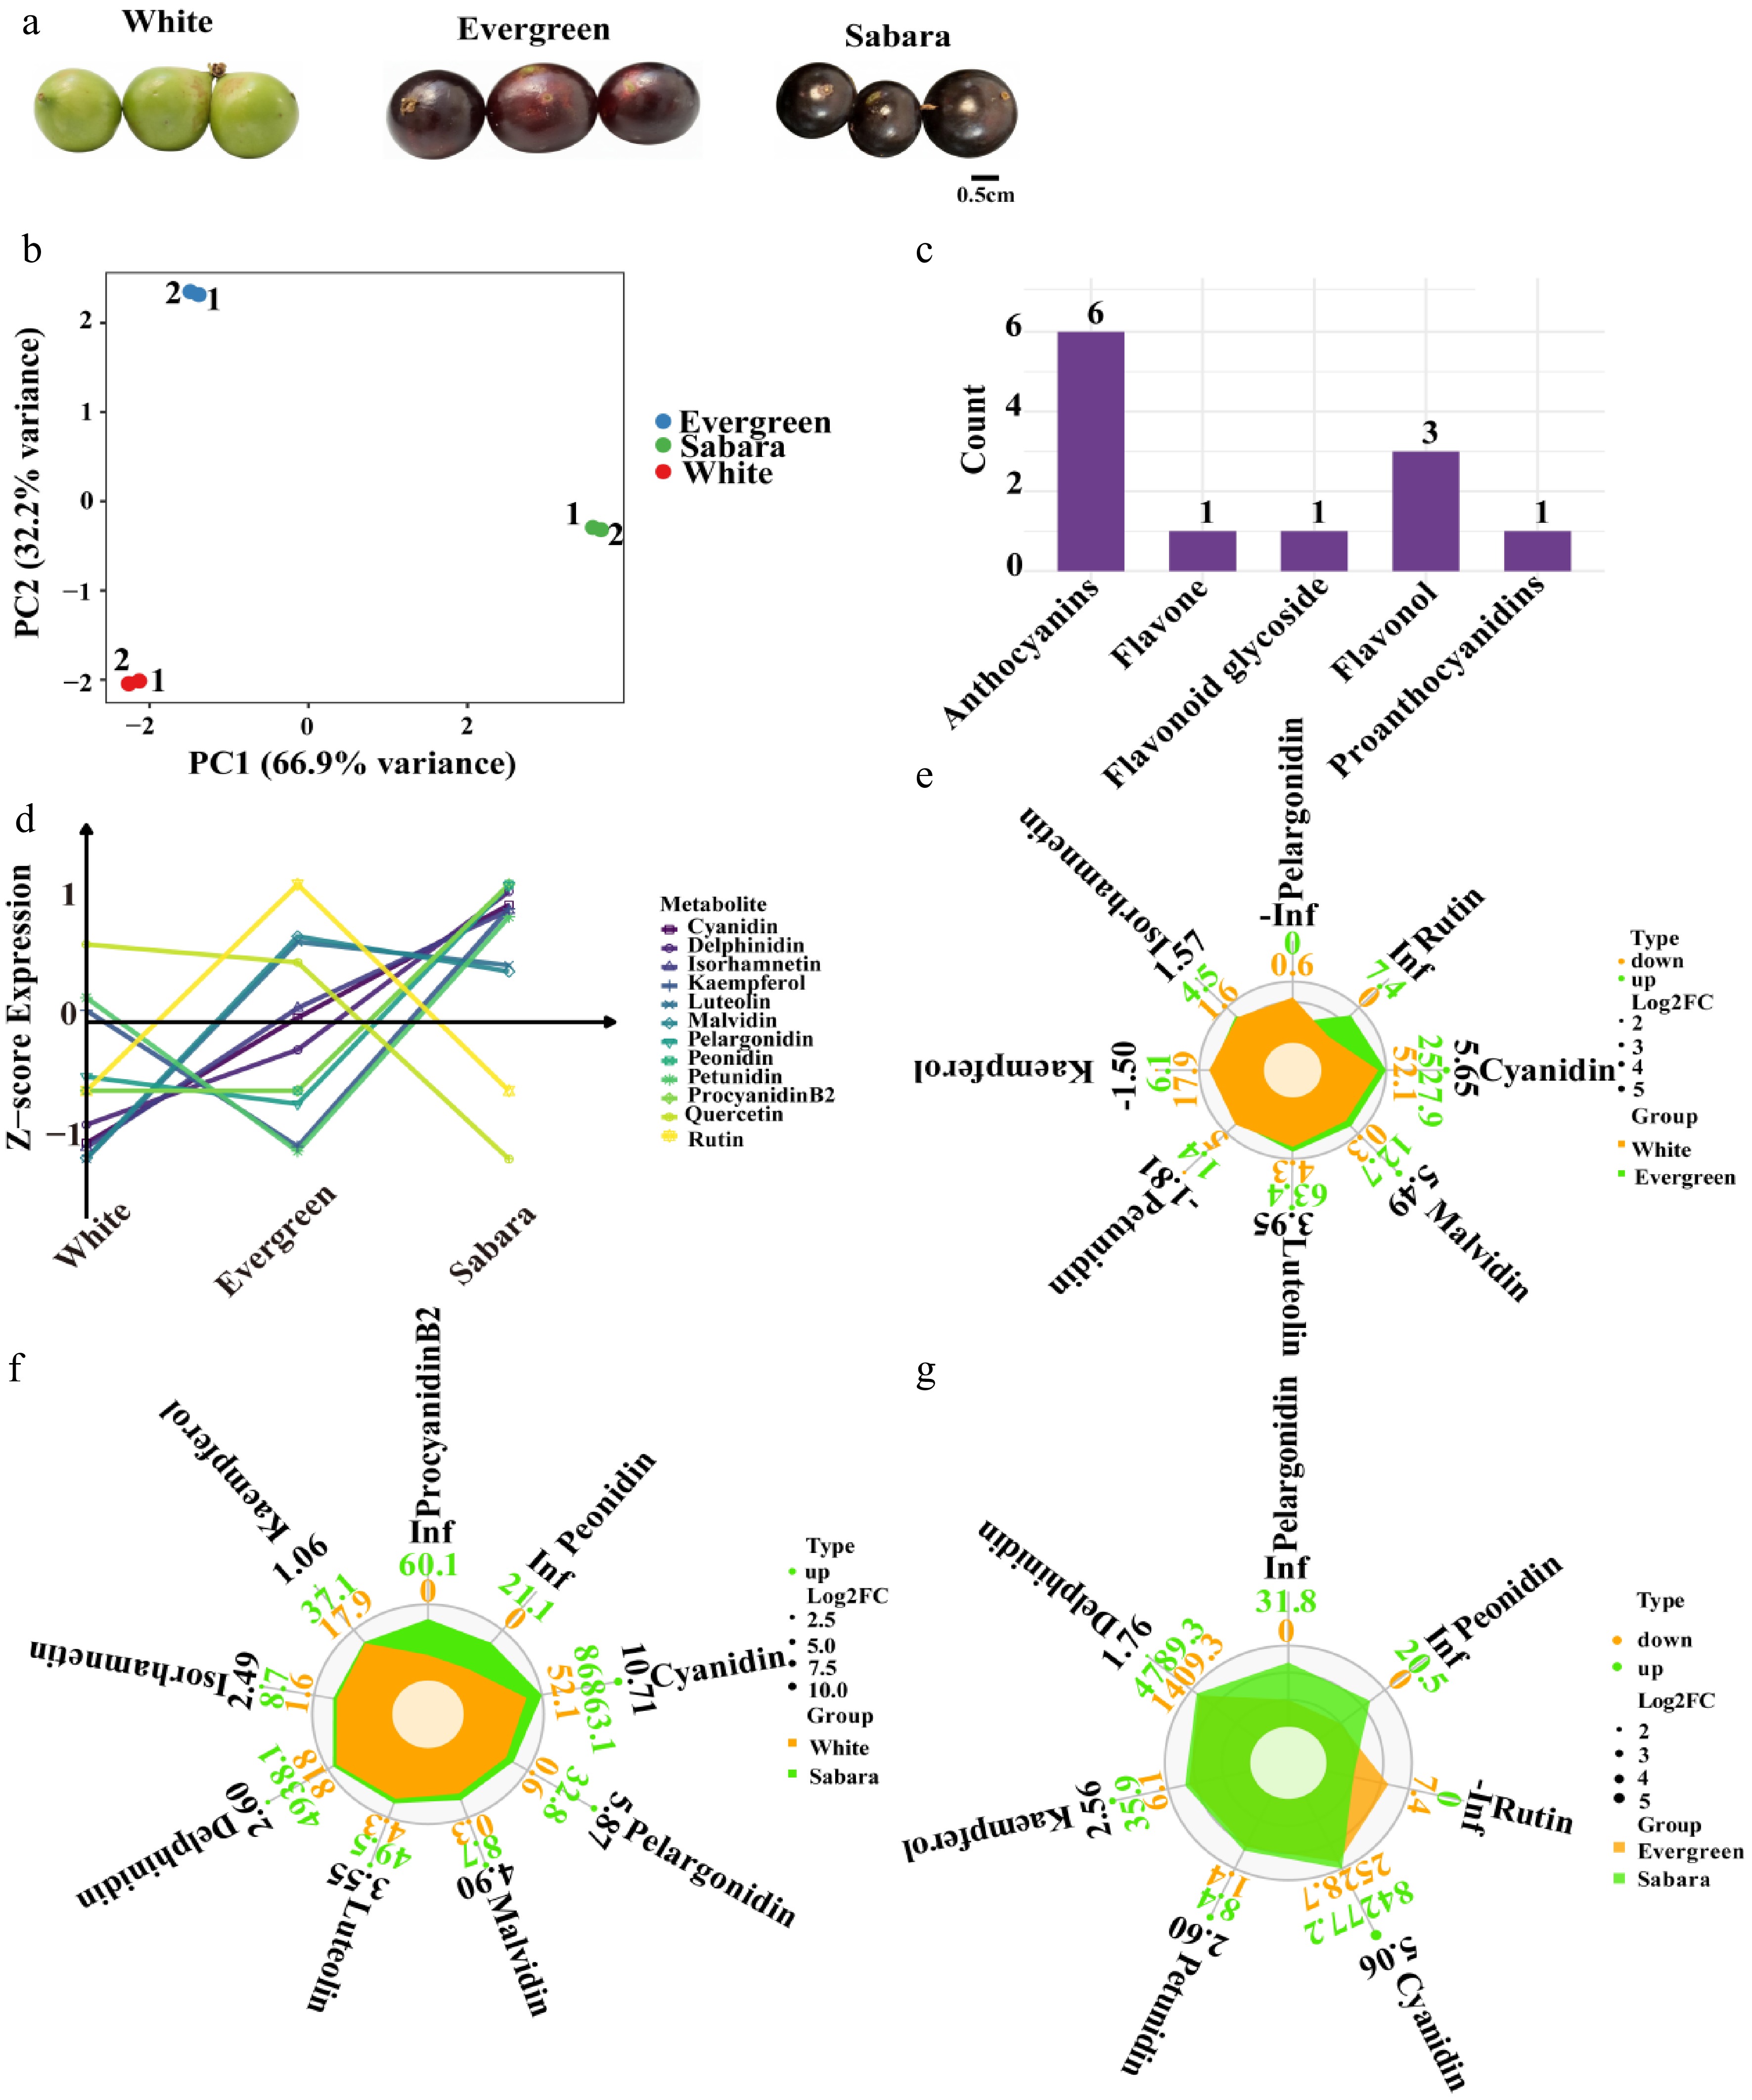
Figure 1.
Targeted anthocyanin data analysis of the pericarp from three jaboticaba cultivars. (a) Phenotypic differences in pericarp coloration among 'White', 'Evergreen', and 'Sabara' cultivars. (b) Principal component analysis on the anthocyanin targeted metabolomics data of the fruit peels from these three cultivars using the "prcomp" function in the R stats package. (c) Classification histograms of 12 detected metabolites plotted using the ggplot2 package in R. (d) Line graph representing the targeted anthocyanin data across the three cultivars (log-transformed and z-standardized). (e)–(g) Radar plots plotted using the ggplot2 package in R to show the differentially accumulated metabolites (DAMs) compared to Evergreen and White, Sabara and White, and Sabara and Evergreen.
-
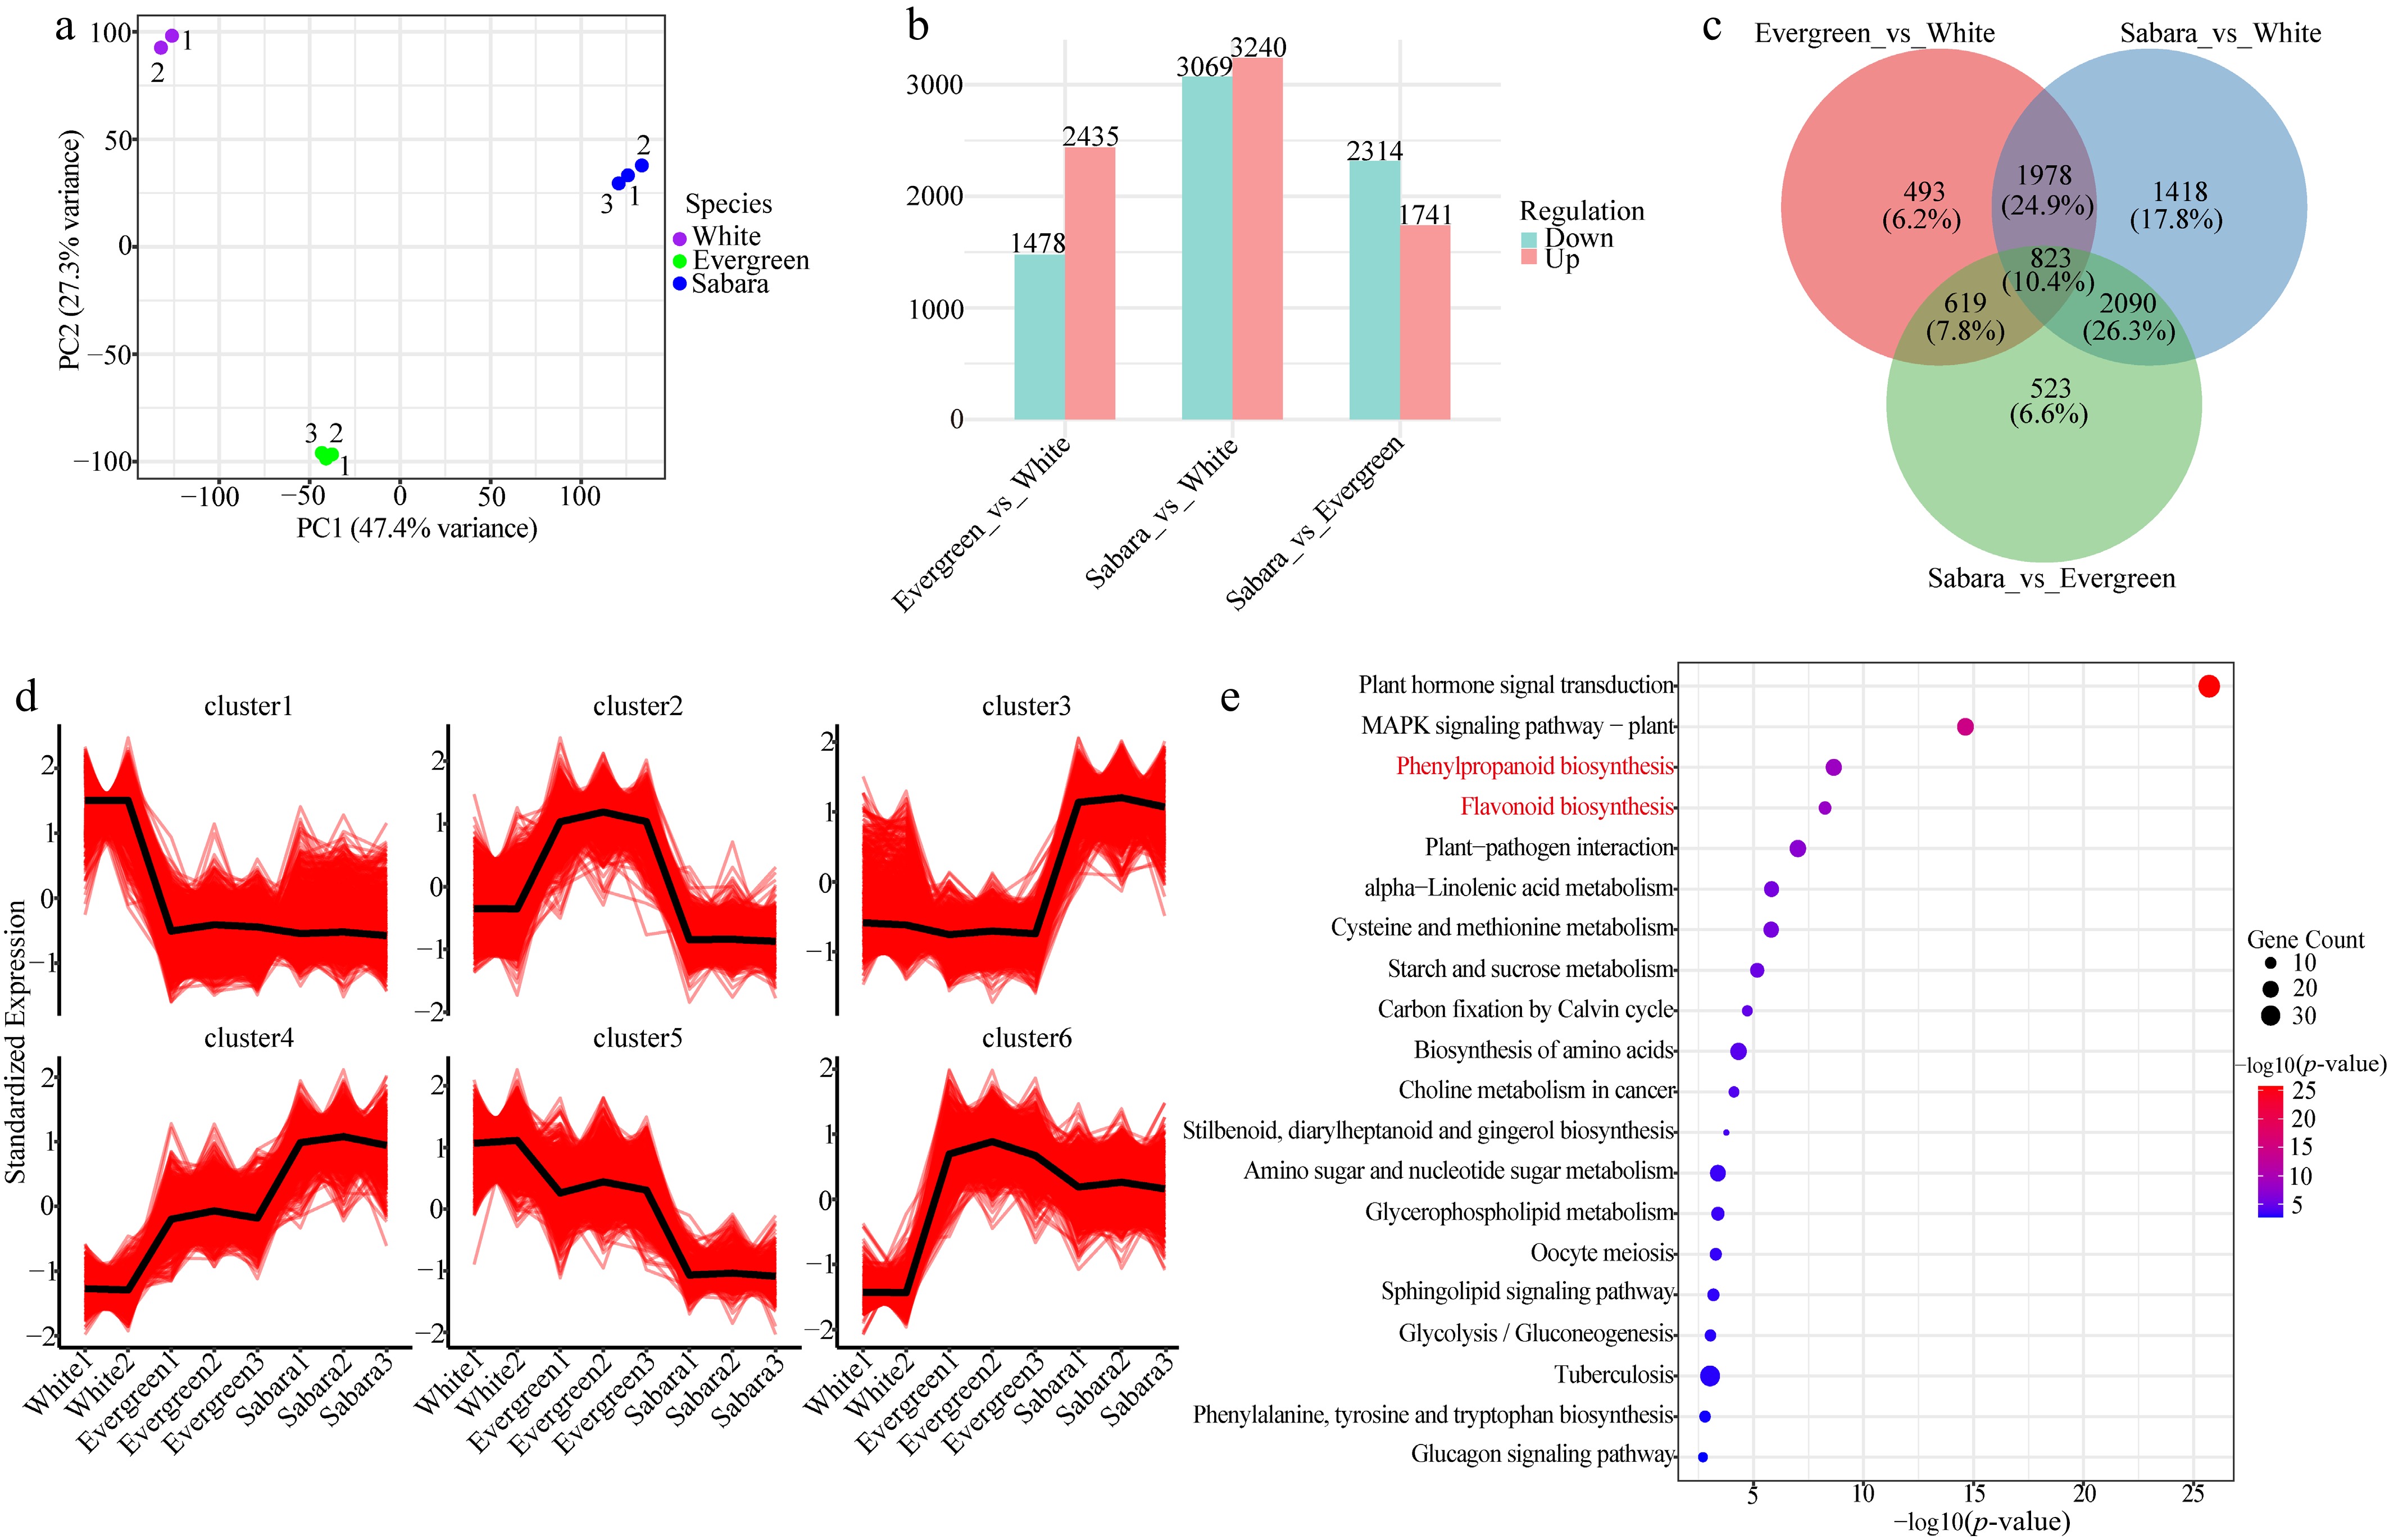
Figure 2.
Transcriptome analysis of the pericarp from three jabuticaba cultivars. (a) Principal component analysis (PCA) of the transcriptomes for 'White', 'Evergreen', and 'Sabara'. (b) Differential expression analyses for the three comparison groups—Evergreen_vs_White, Sabara_vs_White, and Sabara_vs_Evergreen—using DESeq2, and the identity and number of differentially expressed genes (DEGs) for each. (c) Venn analysis of the differentially expressed genes (DEGs) across the Evergreen_vs_White, Sabara_vs_White, and Sabara_vs_Evergreen comparison groups using the VennDiagram package in R. (d) Mfuzz soft clustering analysis on all differentially expressed genes (DEGs) using the Mfuzz package in R. (e) KEGG enrichment analysis on the differentially expressed genes in the fourth cluster using the clusterProfiler and KEGGREST packages in R, with red-highlighted entries representing pathways related to anthocyanin biosynthesis.
-
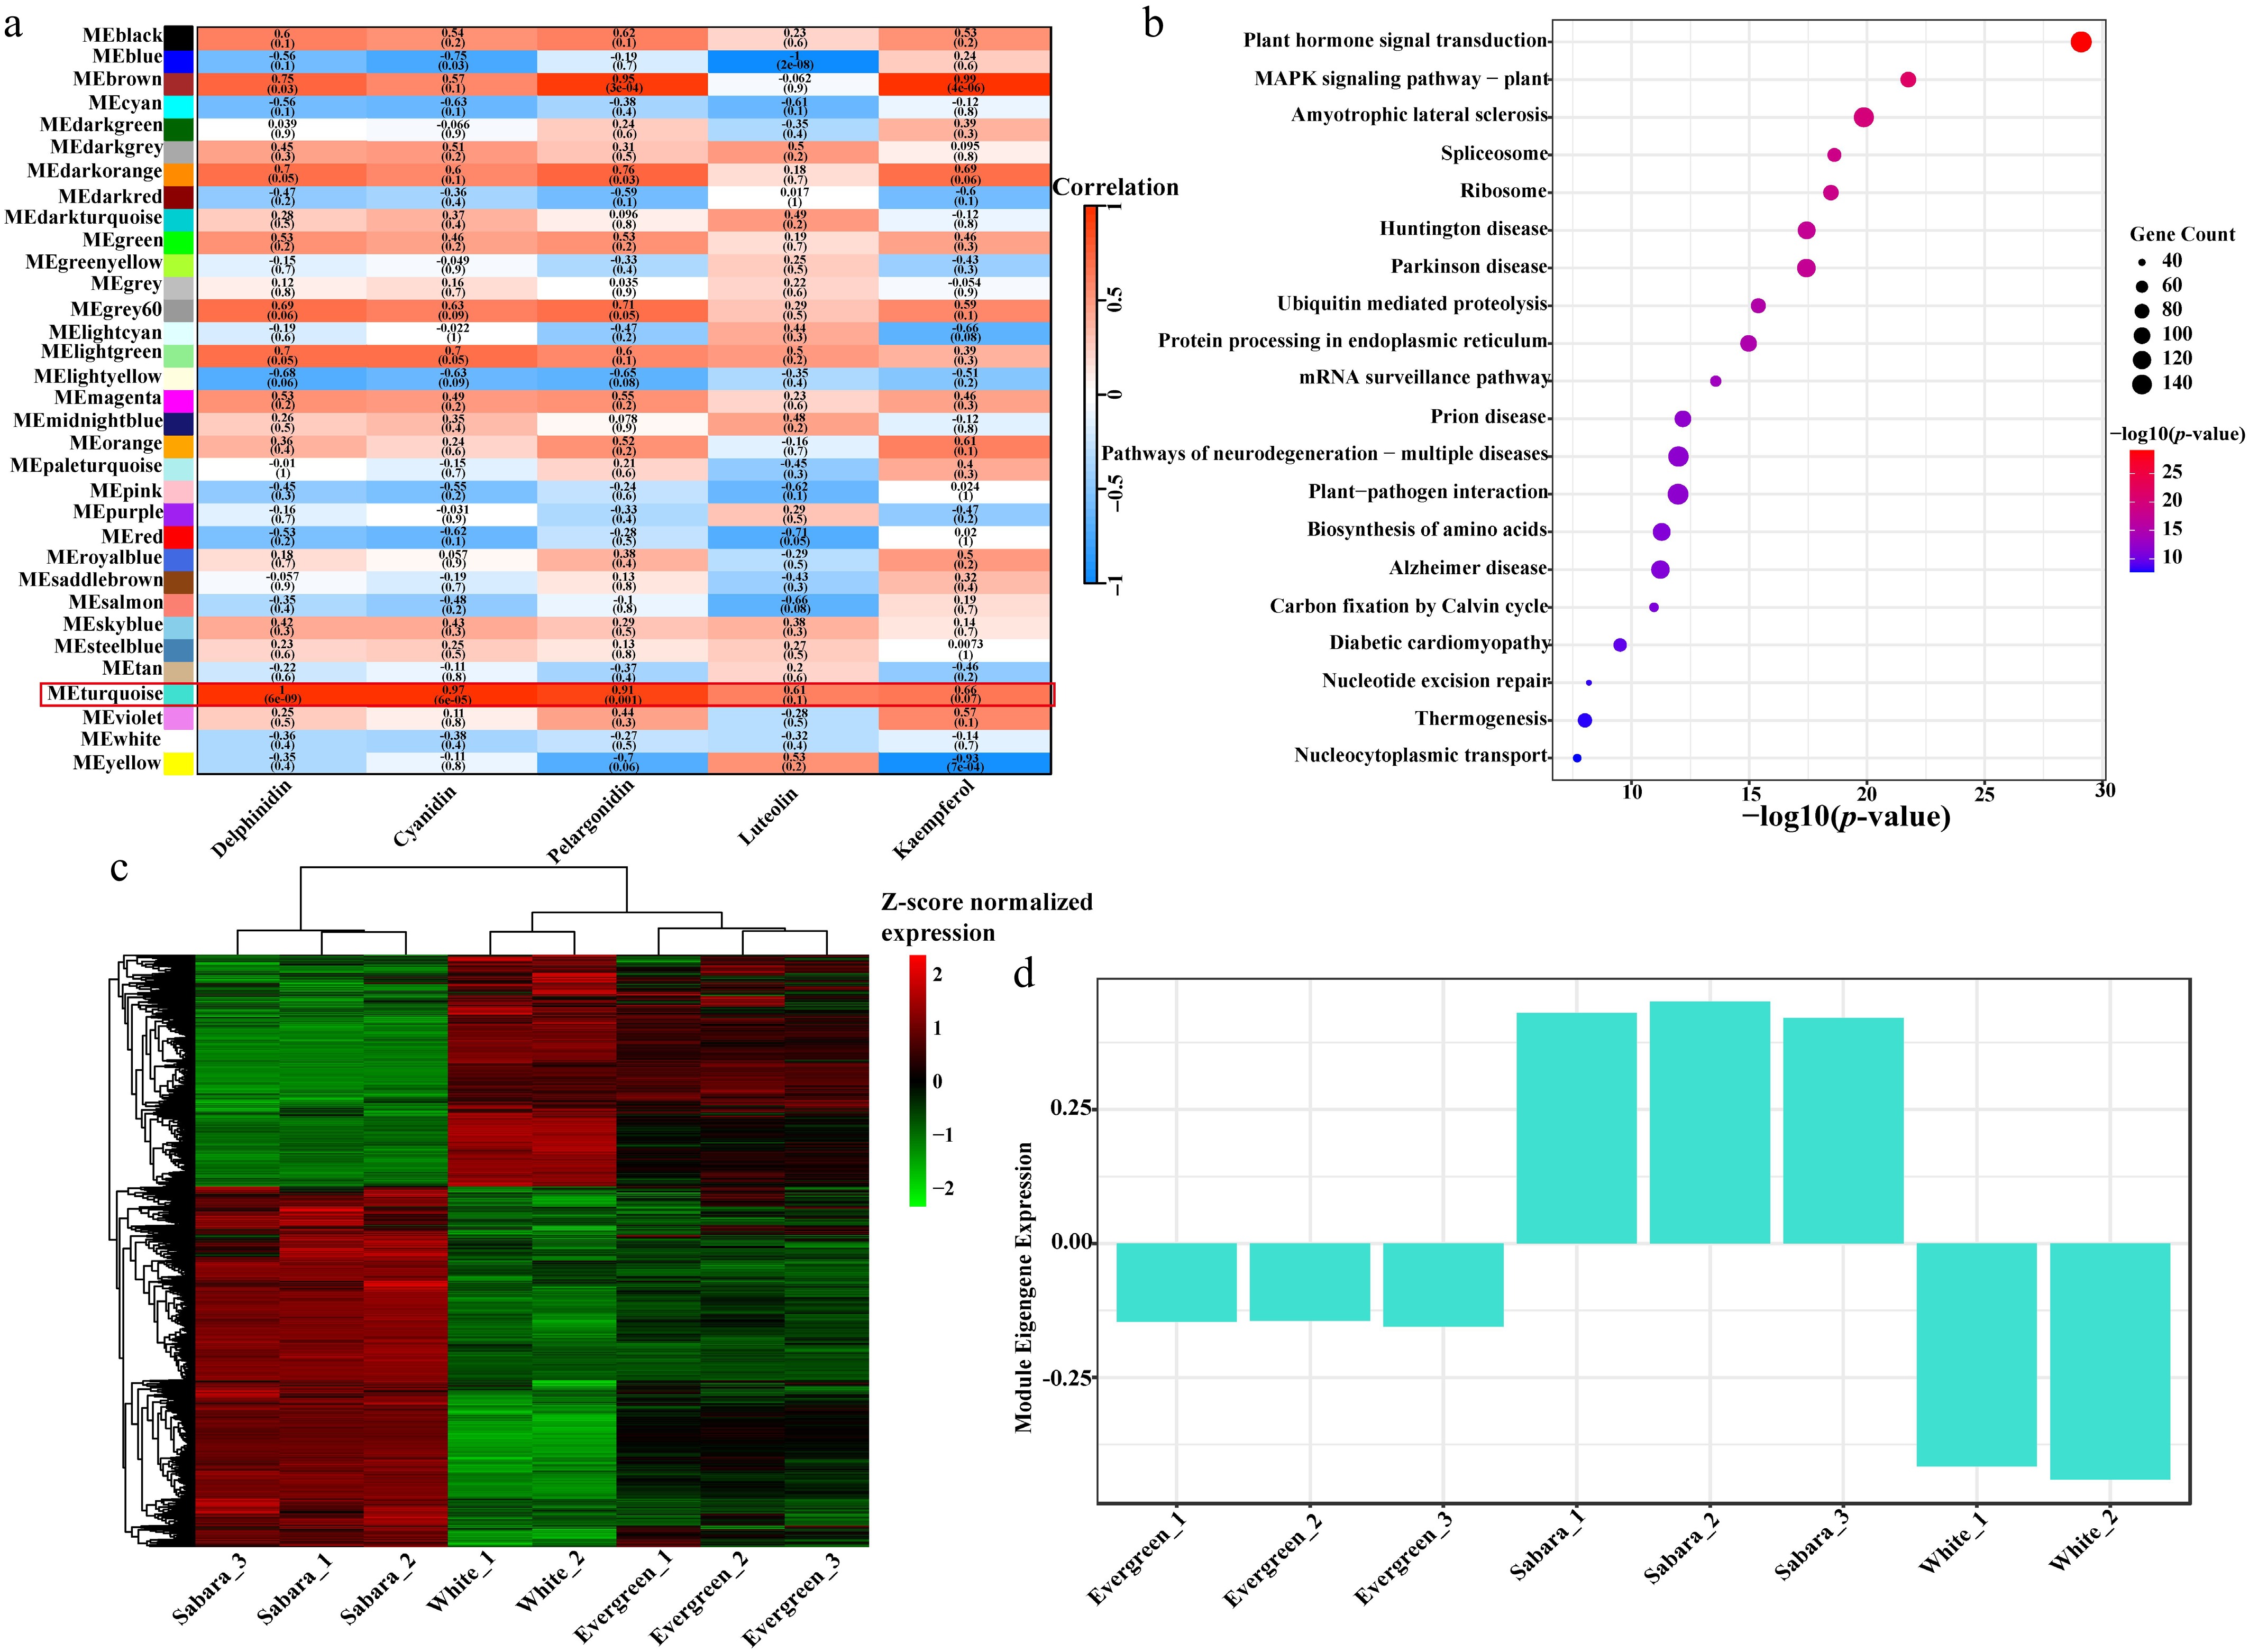
Figure 3.
Identification of regulatory modules associated with anthocyanin accumulation using weighted gene co-expression network analysis (WGCNA). (a) Heatmap of WGCNA module-trait correlations utilizing the WGCNA, pheatmap, and Hmisc R packages. (b) KEGG pathway enrichment analysis for genes in the MEturquoise module using the clusterProfiler and KEGGREST packages in R. (c) Heatmap of gene expression patterns within the MEturquoise module using the pheatmap package in R. (d) Bar chart showing the expression levels of the module eigengene for the MEturquoise module.
-
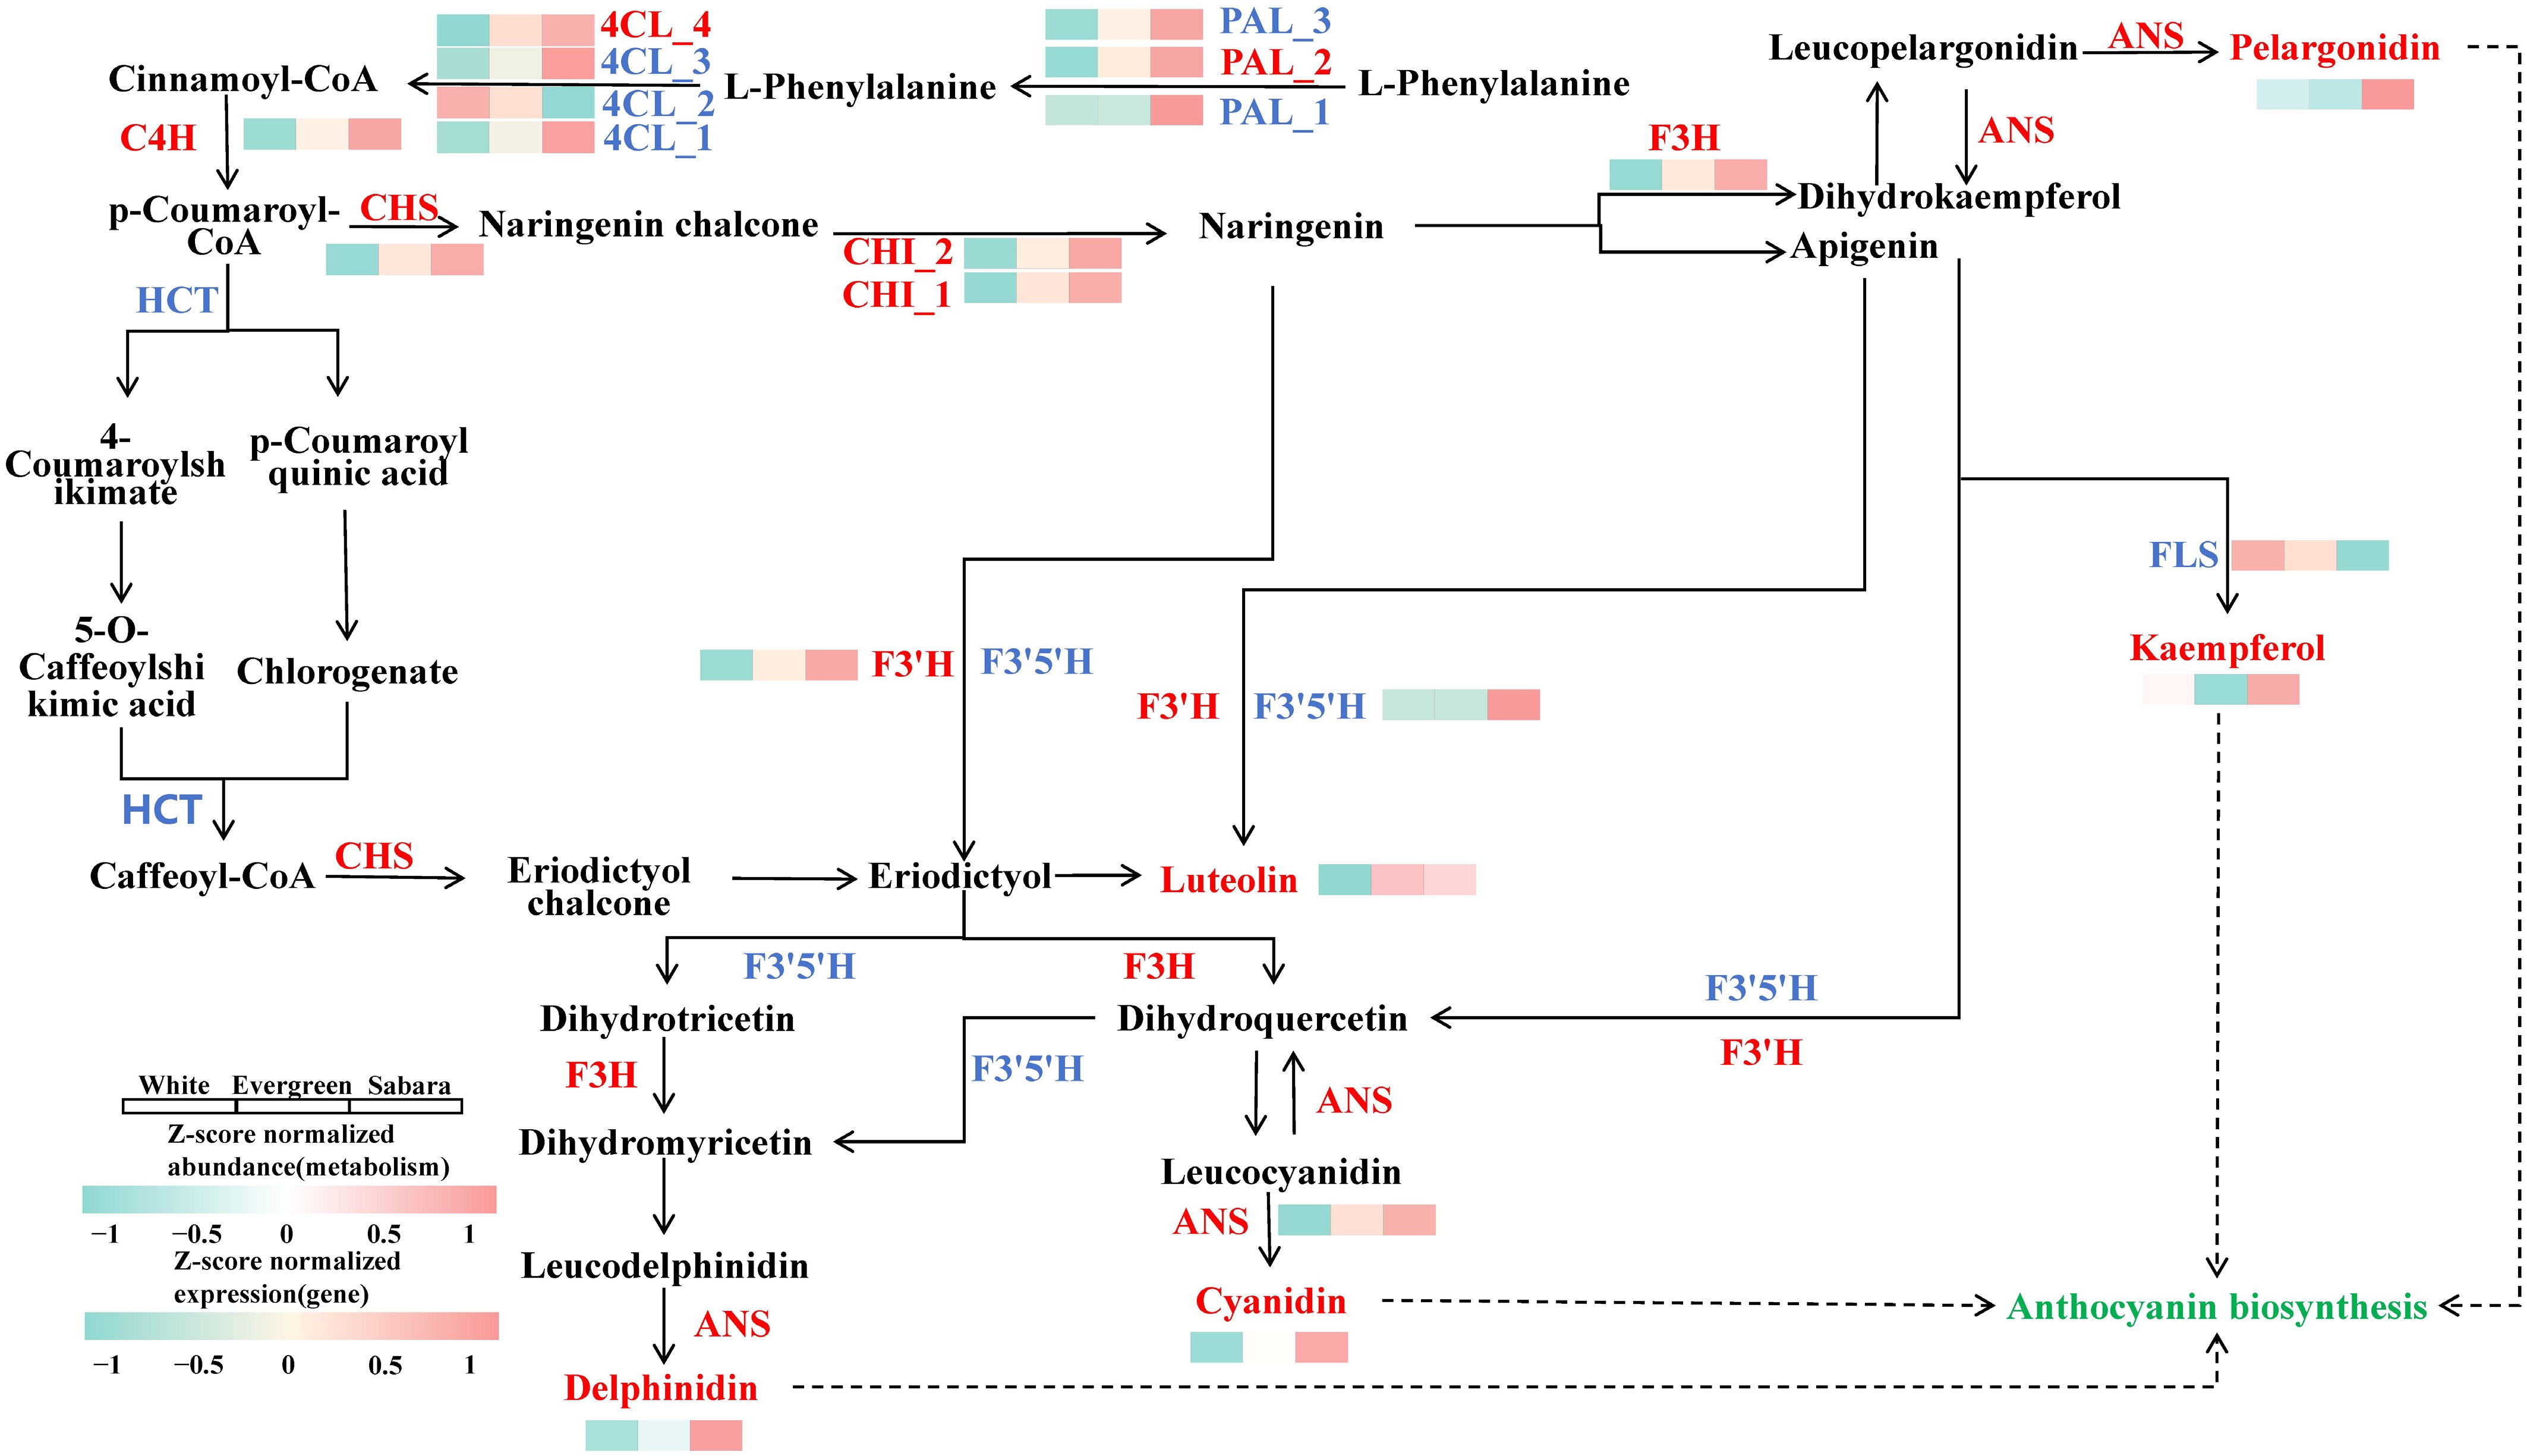
Figure 4.
Combined analysis. Biosynthetic pathways of five DAMs (indicated in red font), illustrating the metabolite accumulation levels and expression profiles of key enzyme genes across the 'White', 'Evergreen', and 'Sabara' cultivars (normalized using log-transformed and z-standardized methods). Key structural genes identified in Cluster 4 are highlighted in red. Enzyme abbreviations are as follows: CHS, chalcone synthase; CHI, chalcone isomerase; F3H, flavanone 3-hydroxylase; F3'H, flavonoid 3'-hydroxylase; F3'5'H, flavonoid 3',5'-hydroxylase; FLS, flavonol synthase; and ANS, anthocyanidin synthase.
-
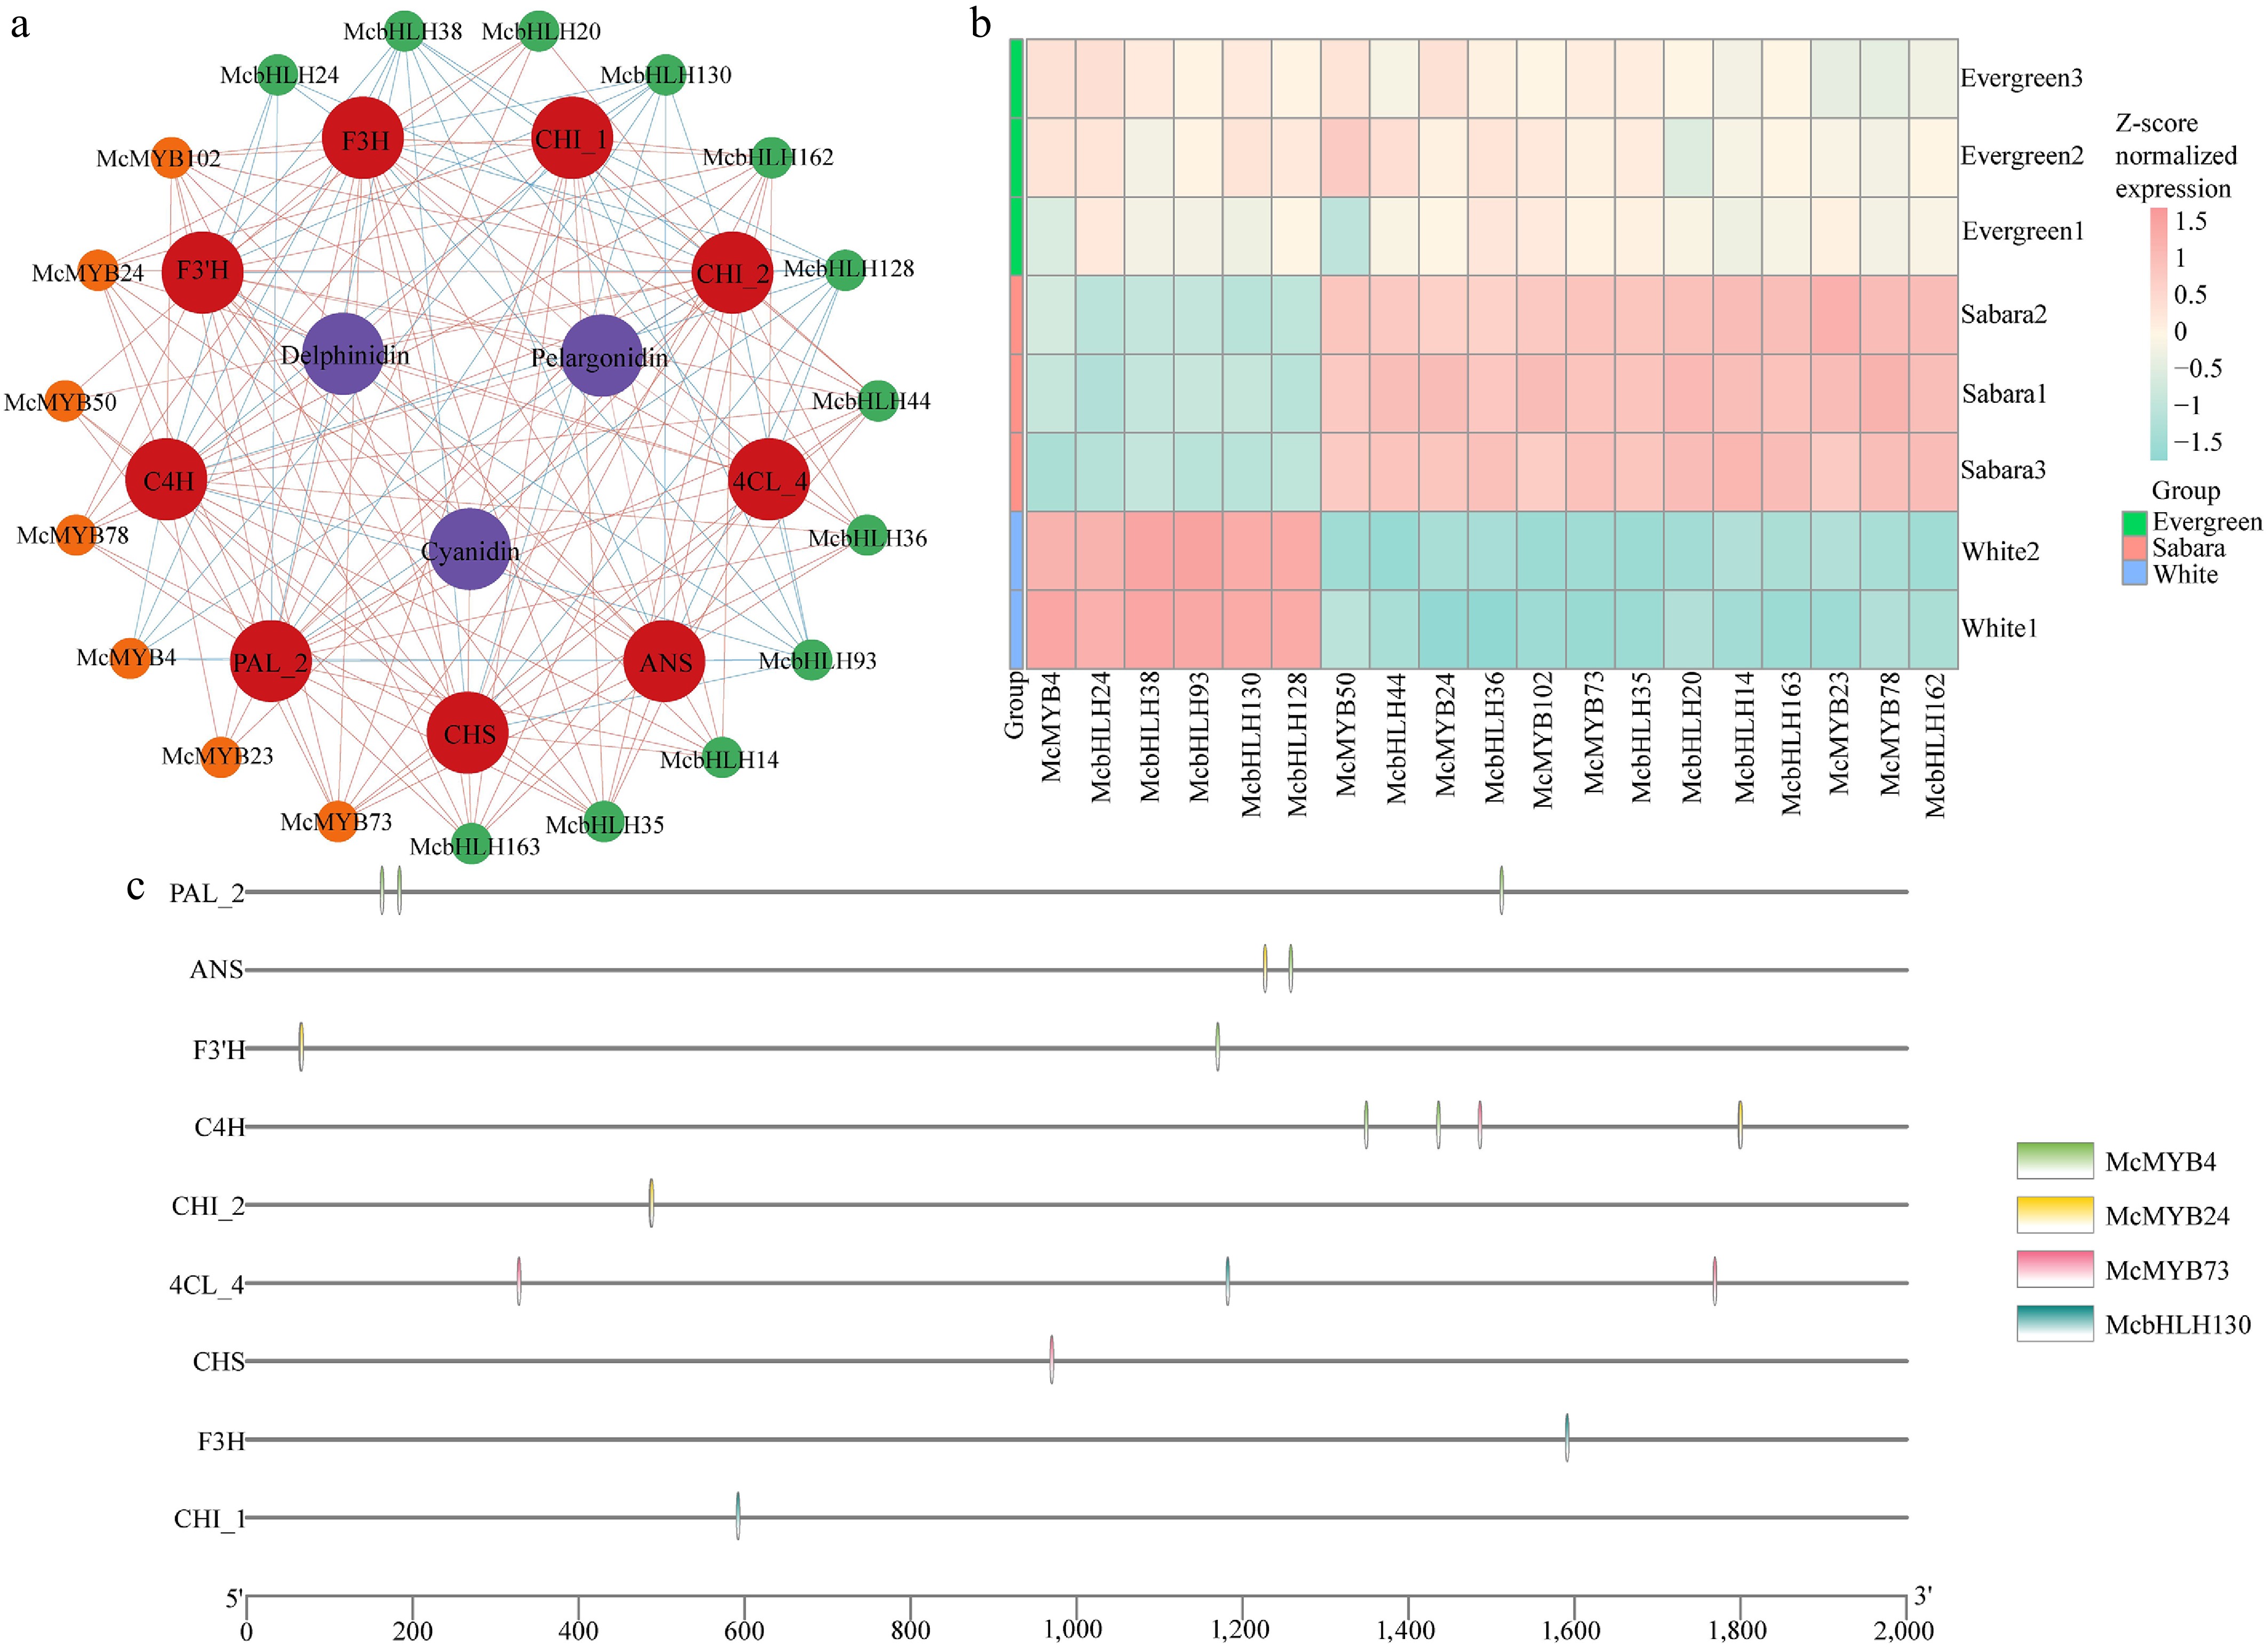
Figure 5.
Co-expression network and cis-acting element analysis. (a) A co-expression network of McMYB and McbHLH transcription factors, structural genes, and metabolites within the MEturquoise module was constructed using the WGCNA package in R and then beautified using Cytoscape. (b) TPM expression heatmaps of the McMYB and McbHLH transcription factor families were generated using the pheatmap package in R. (c) Motif scans of promoter regions of nine key structural genes were performed using the JASPAR CORE plant database to predict their cis-regulatory elements (plotted with TBtools).
-
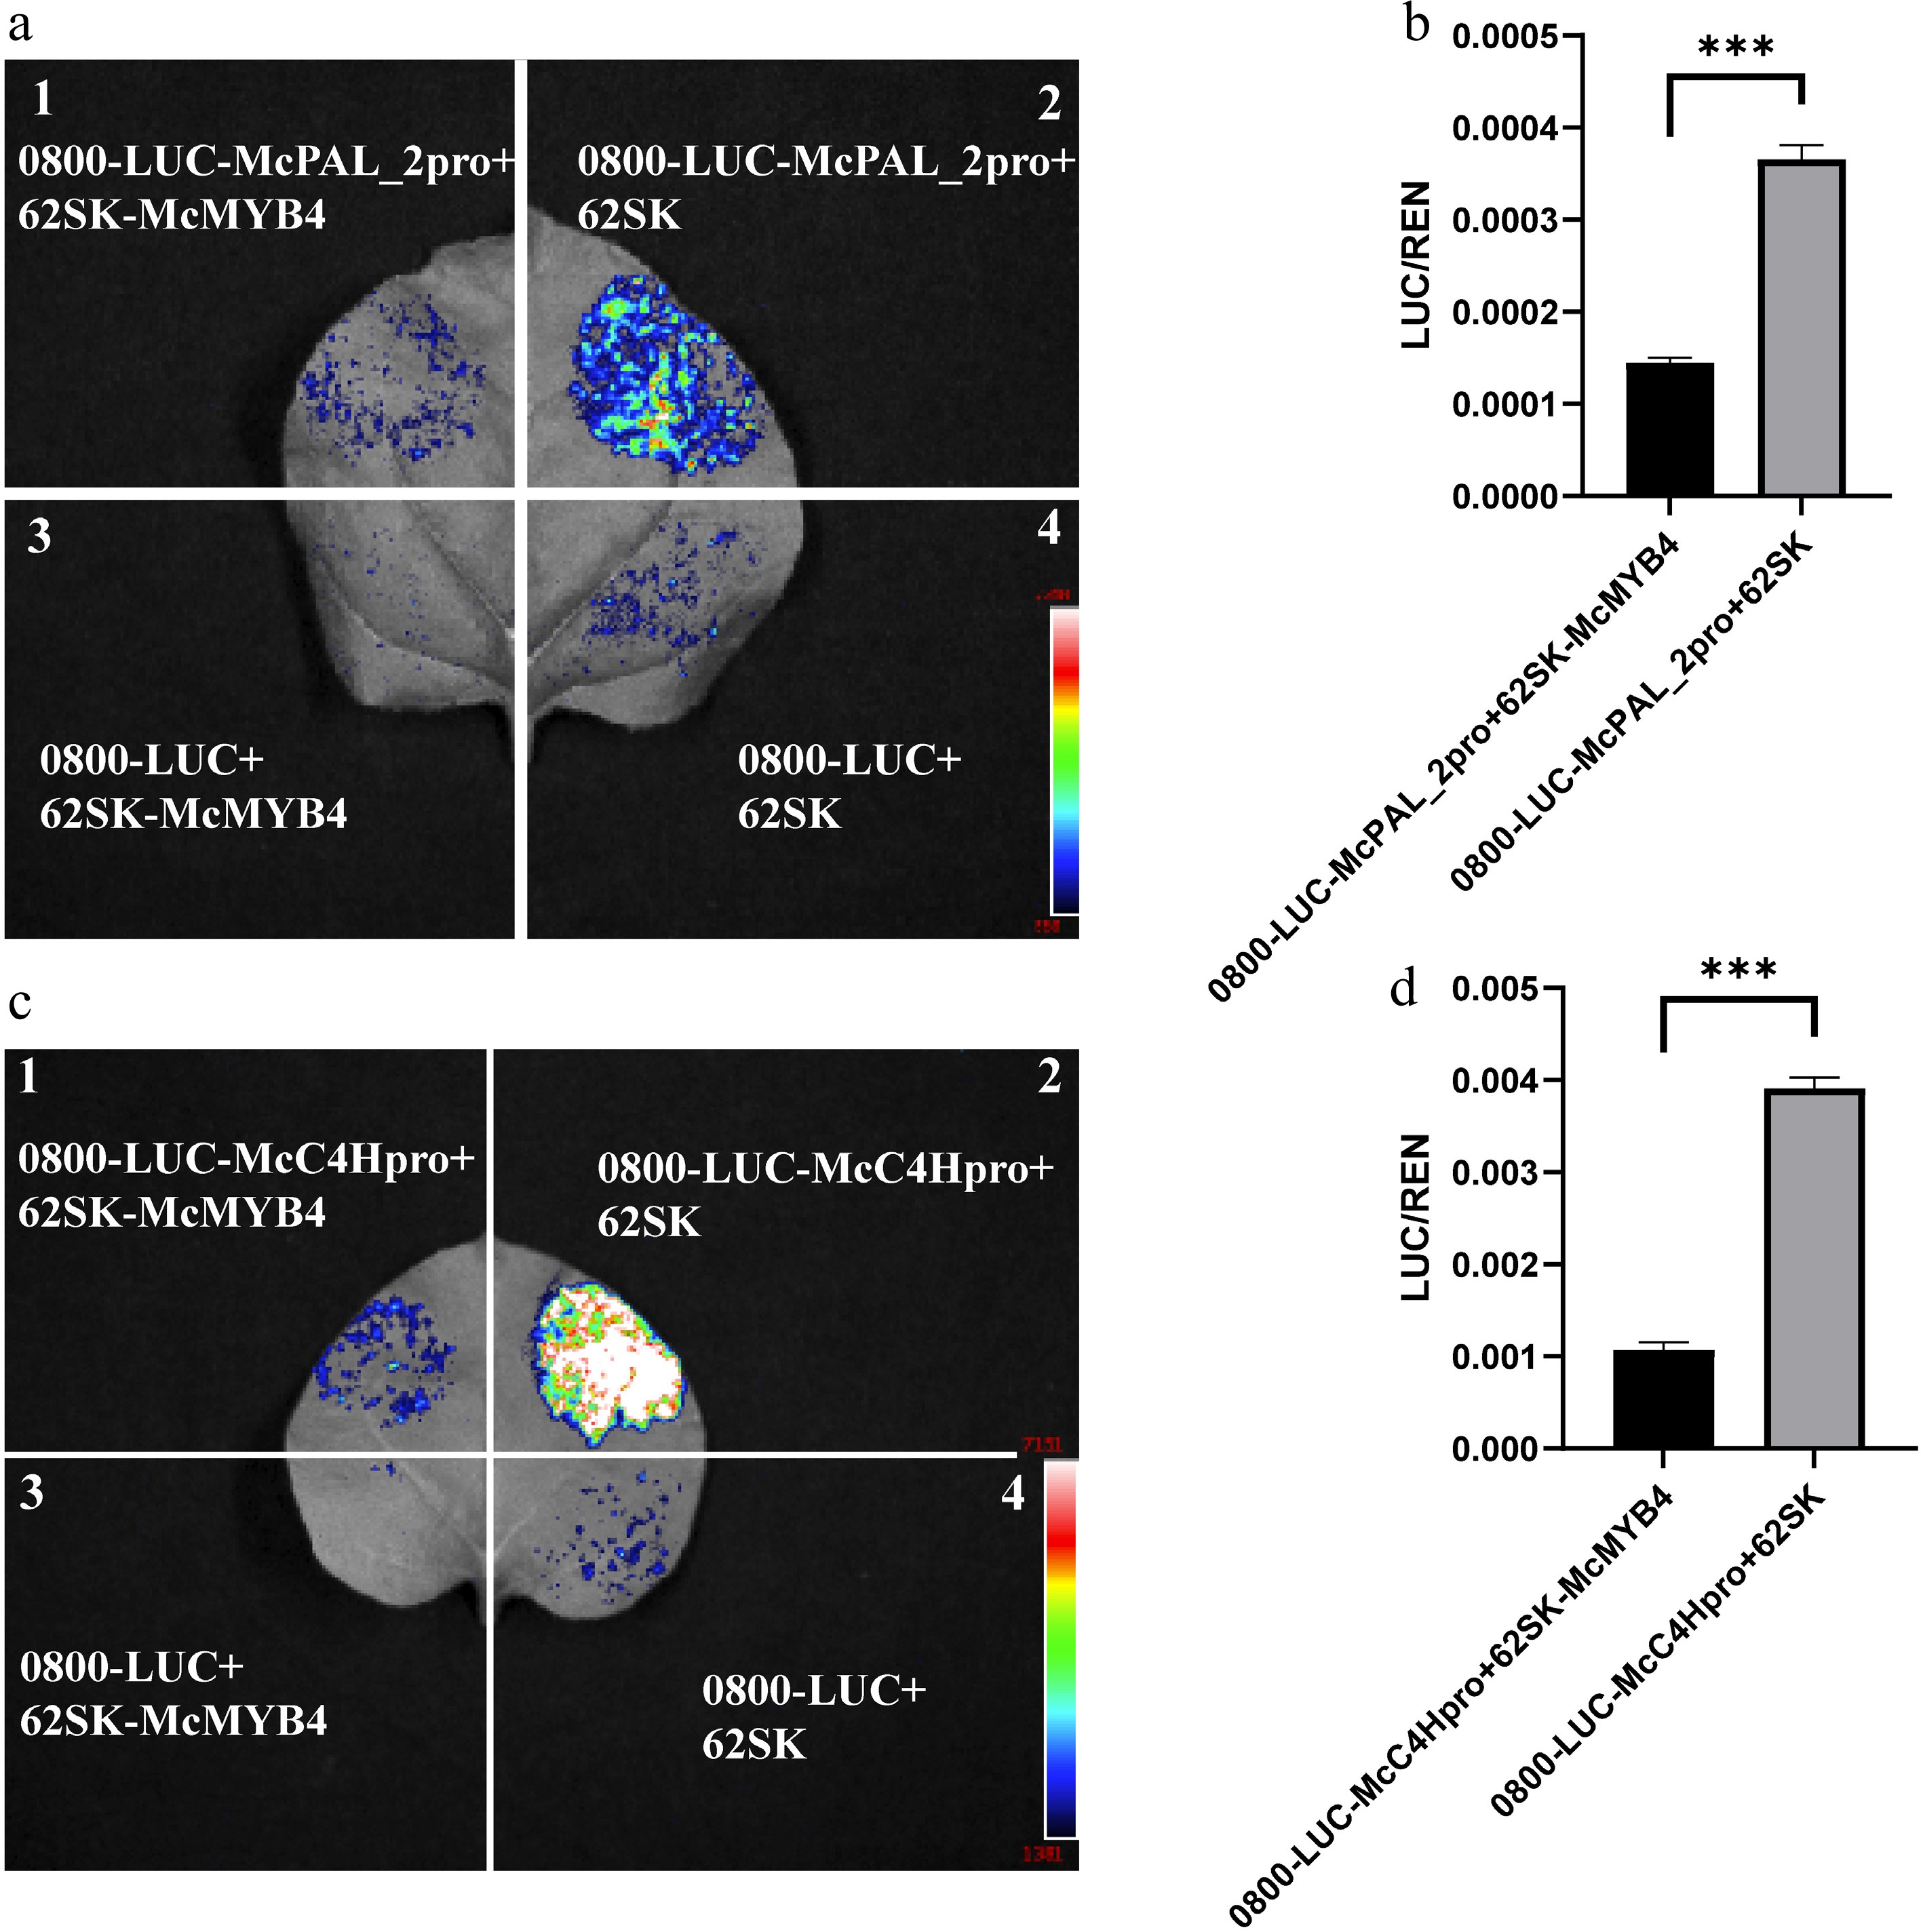
Figure 6.
Dual-luciferase reporter assay demonstrating the regulatory effects of McMYB4 on the promoters of McPAL_2 and McC4H. (a) Transient dual-luciferase assay of McMYB4 on the McPAL_2 promoter in Nicotiana benthamiana leaves. Region 1 represents the experimental group co-infiltrated with pGreenII 0800-LUC-McPAL_2pro and pGreenII-62SK-McMYB4; Region 2 represents the negative control co-infiltrated with pGreenII 0800-LUC-McPAL_2pro and the empty pGreenII-62SK vector; Region 3 represents the negative control co-infiltrated with the empty pGreenII 0800-LUC vector and pGreenII-62SK-McMYB4; Region 4 represents the negative control co-infiltrated with the empty pGreenII 0800-LUC and empty pGreenII-62SK vectors. (b) Quantification of dual-luciferase activity (LUC/REN) driven by the McPAL_2 promoter. (c) Transient dual-luciferase assay of McMYB4 on the McC4H promoter in N. benthamiana leaves. The four infiltration regions correspond to those described in panel (a), with McPAL_2pro replaced by McC4Hpro. (d) Quantification of dual-luciferase activity (LUC/REN) driven by the McC4H promoter. Data are presented as the mean ± SE of three biological replicates. Asterisks indicate significant differences between treatments (*** p < 0.001).
Figures
(6)
Tables
(0)