-
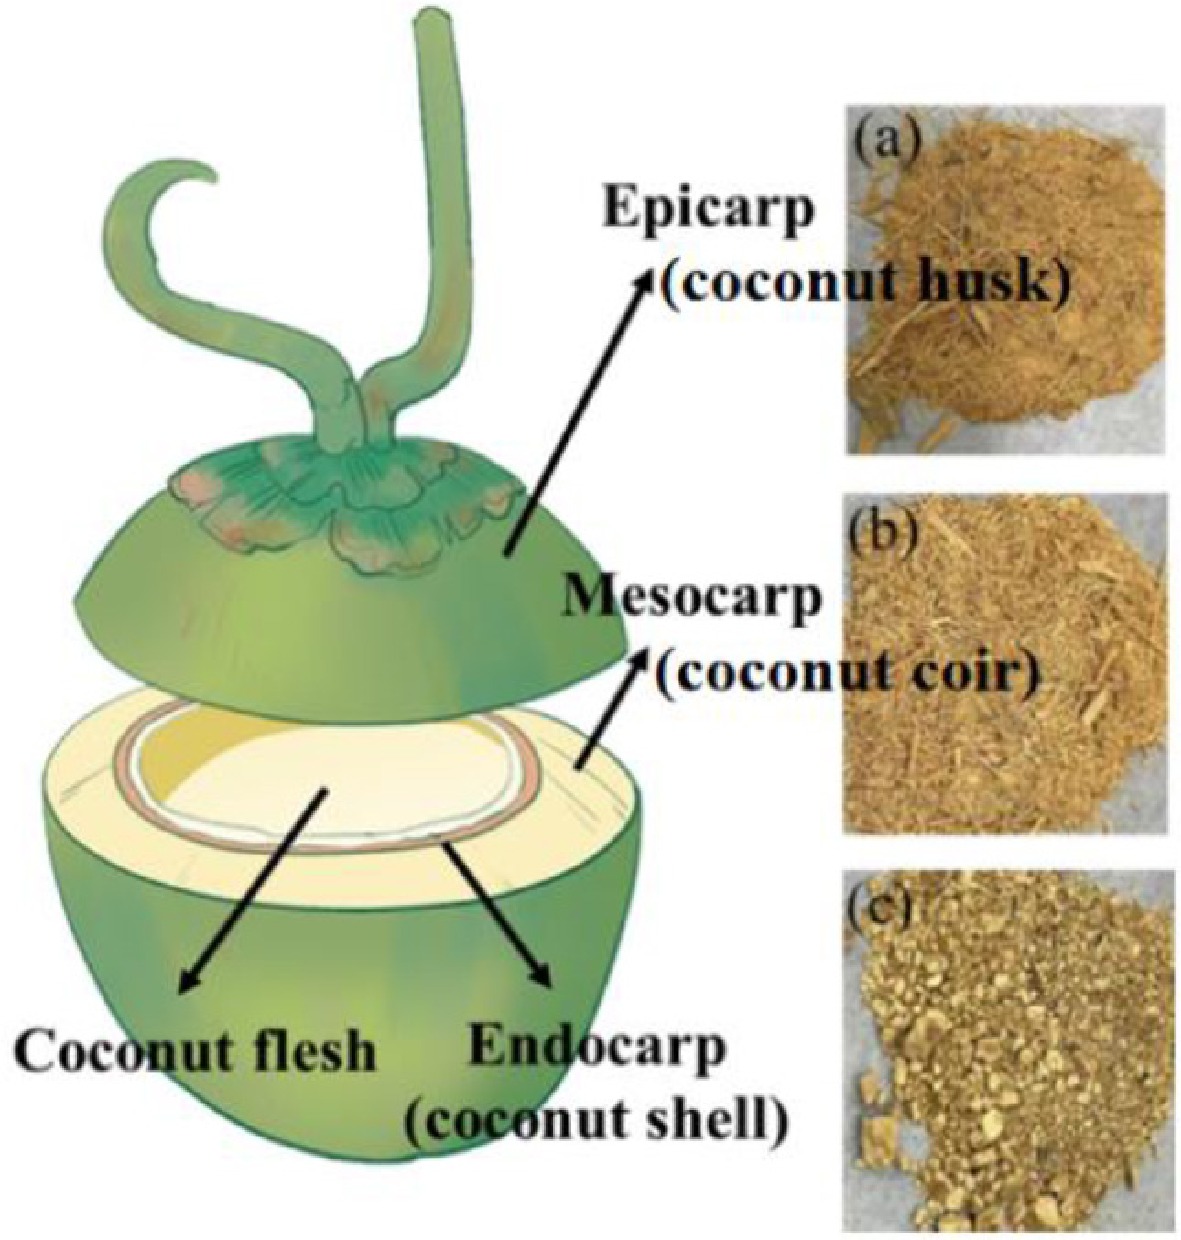
Figure 1.
Schematic diagram of coconut residues: (a) En, (b) Me, (c) Ep.
-
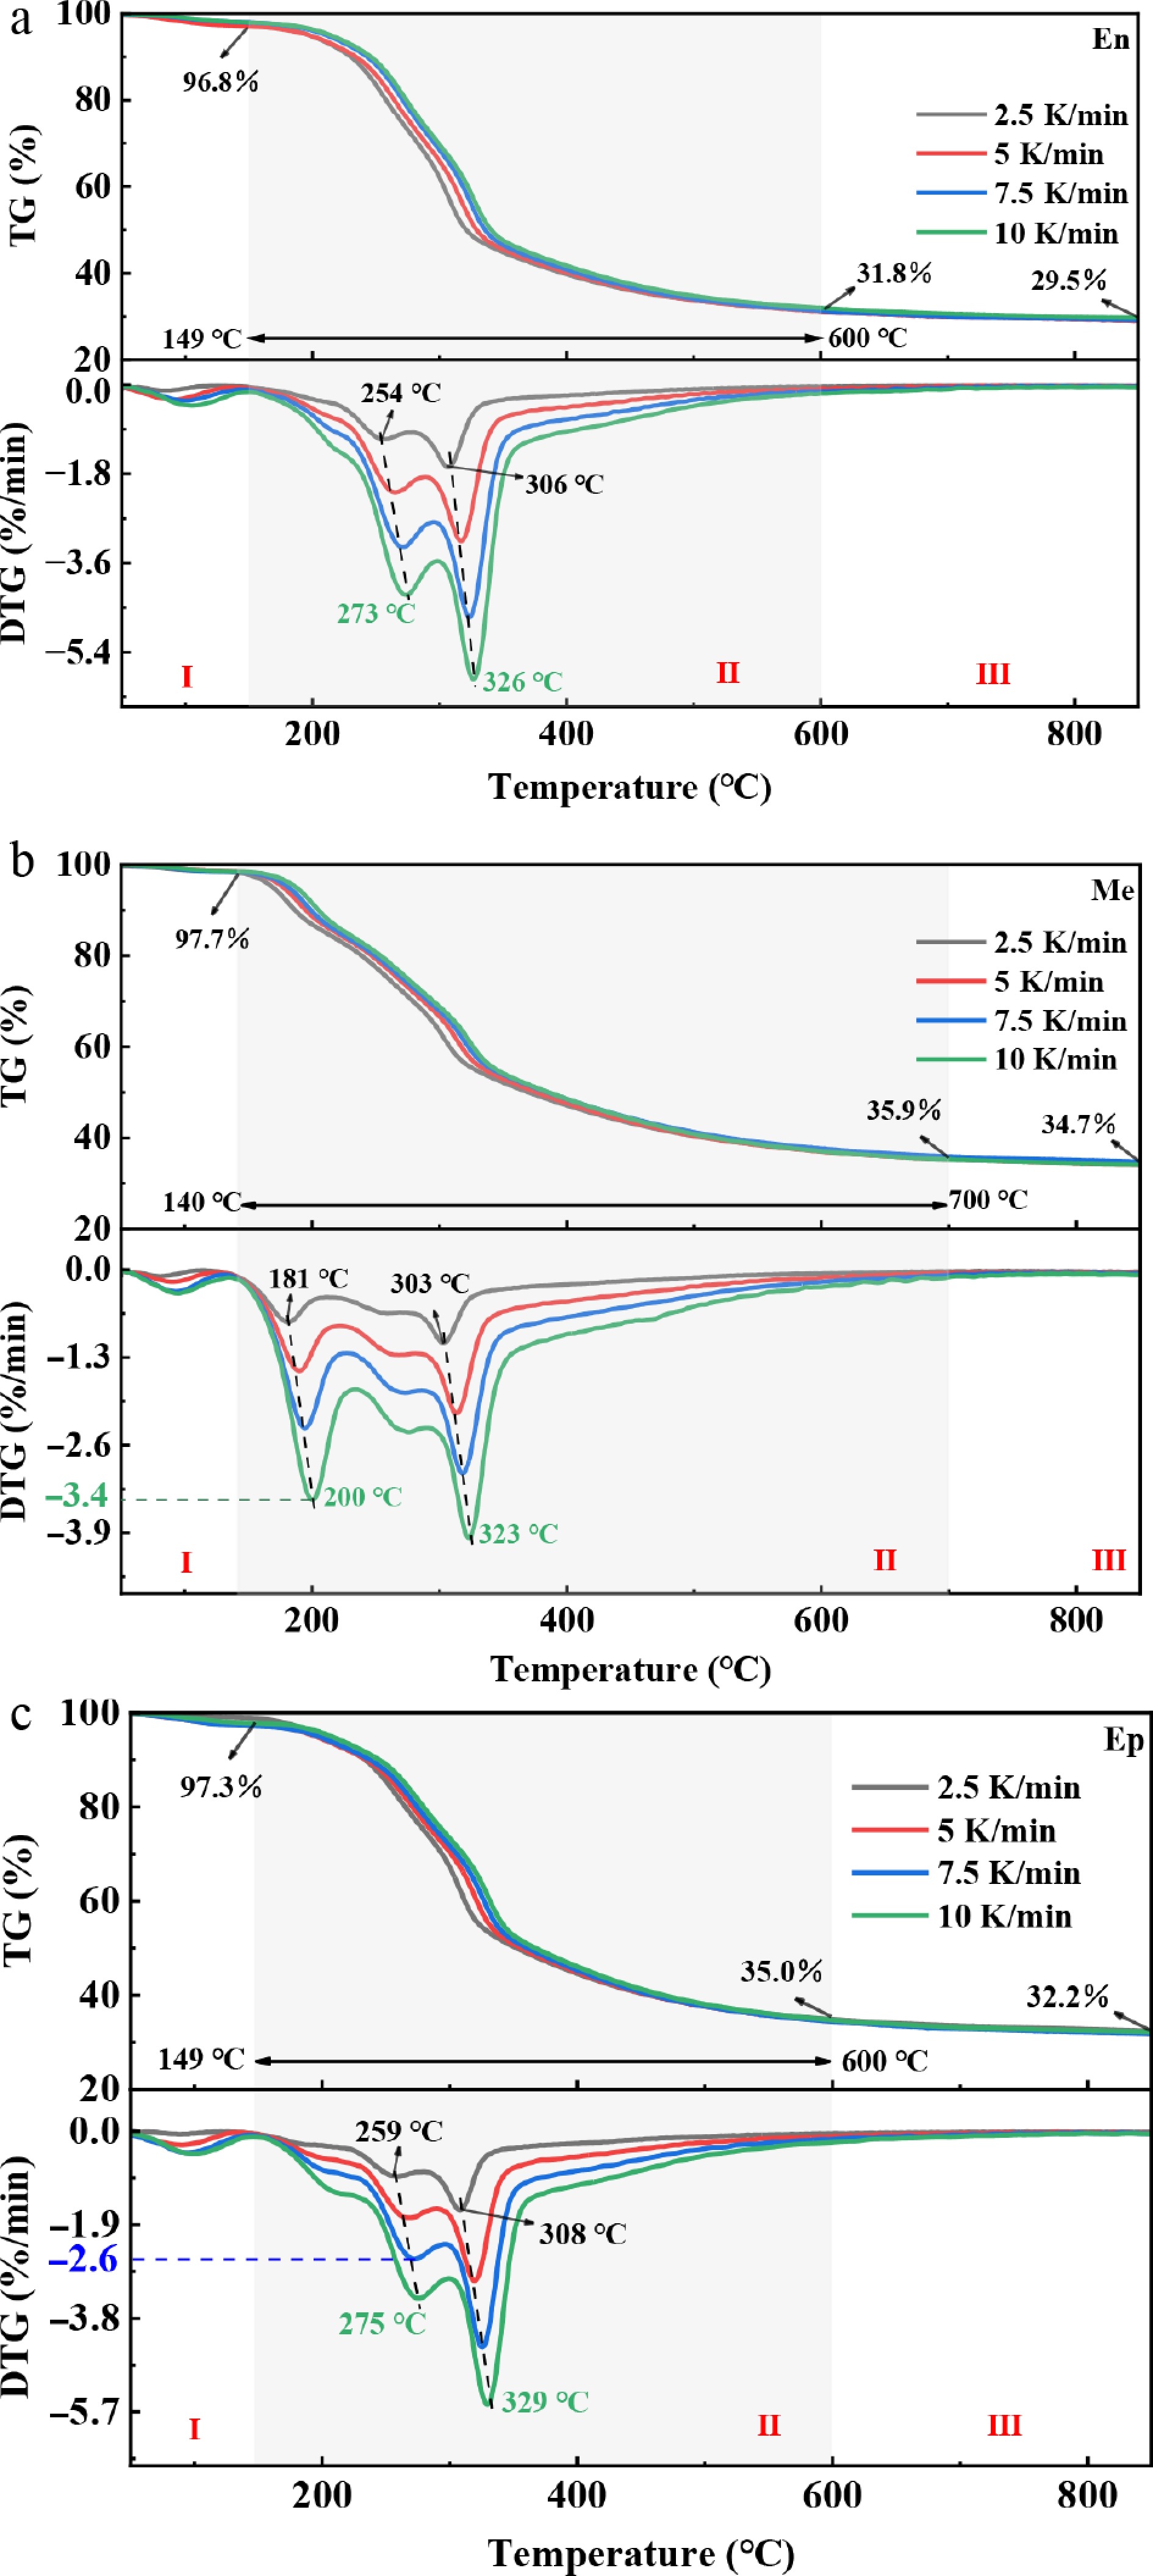
Figure 2.
TG and DTG curves of coconut wastes with different temperatures: (a) coconut shell (En), (b) coir (Me), and (c) husk (Ep).
-
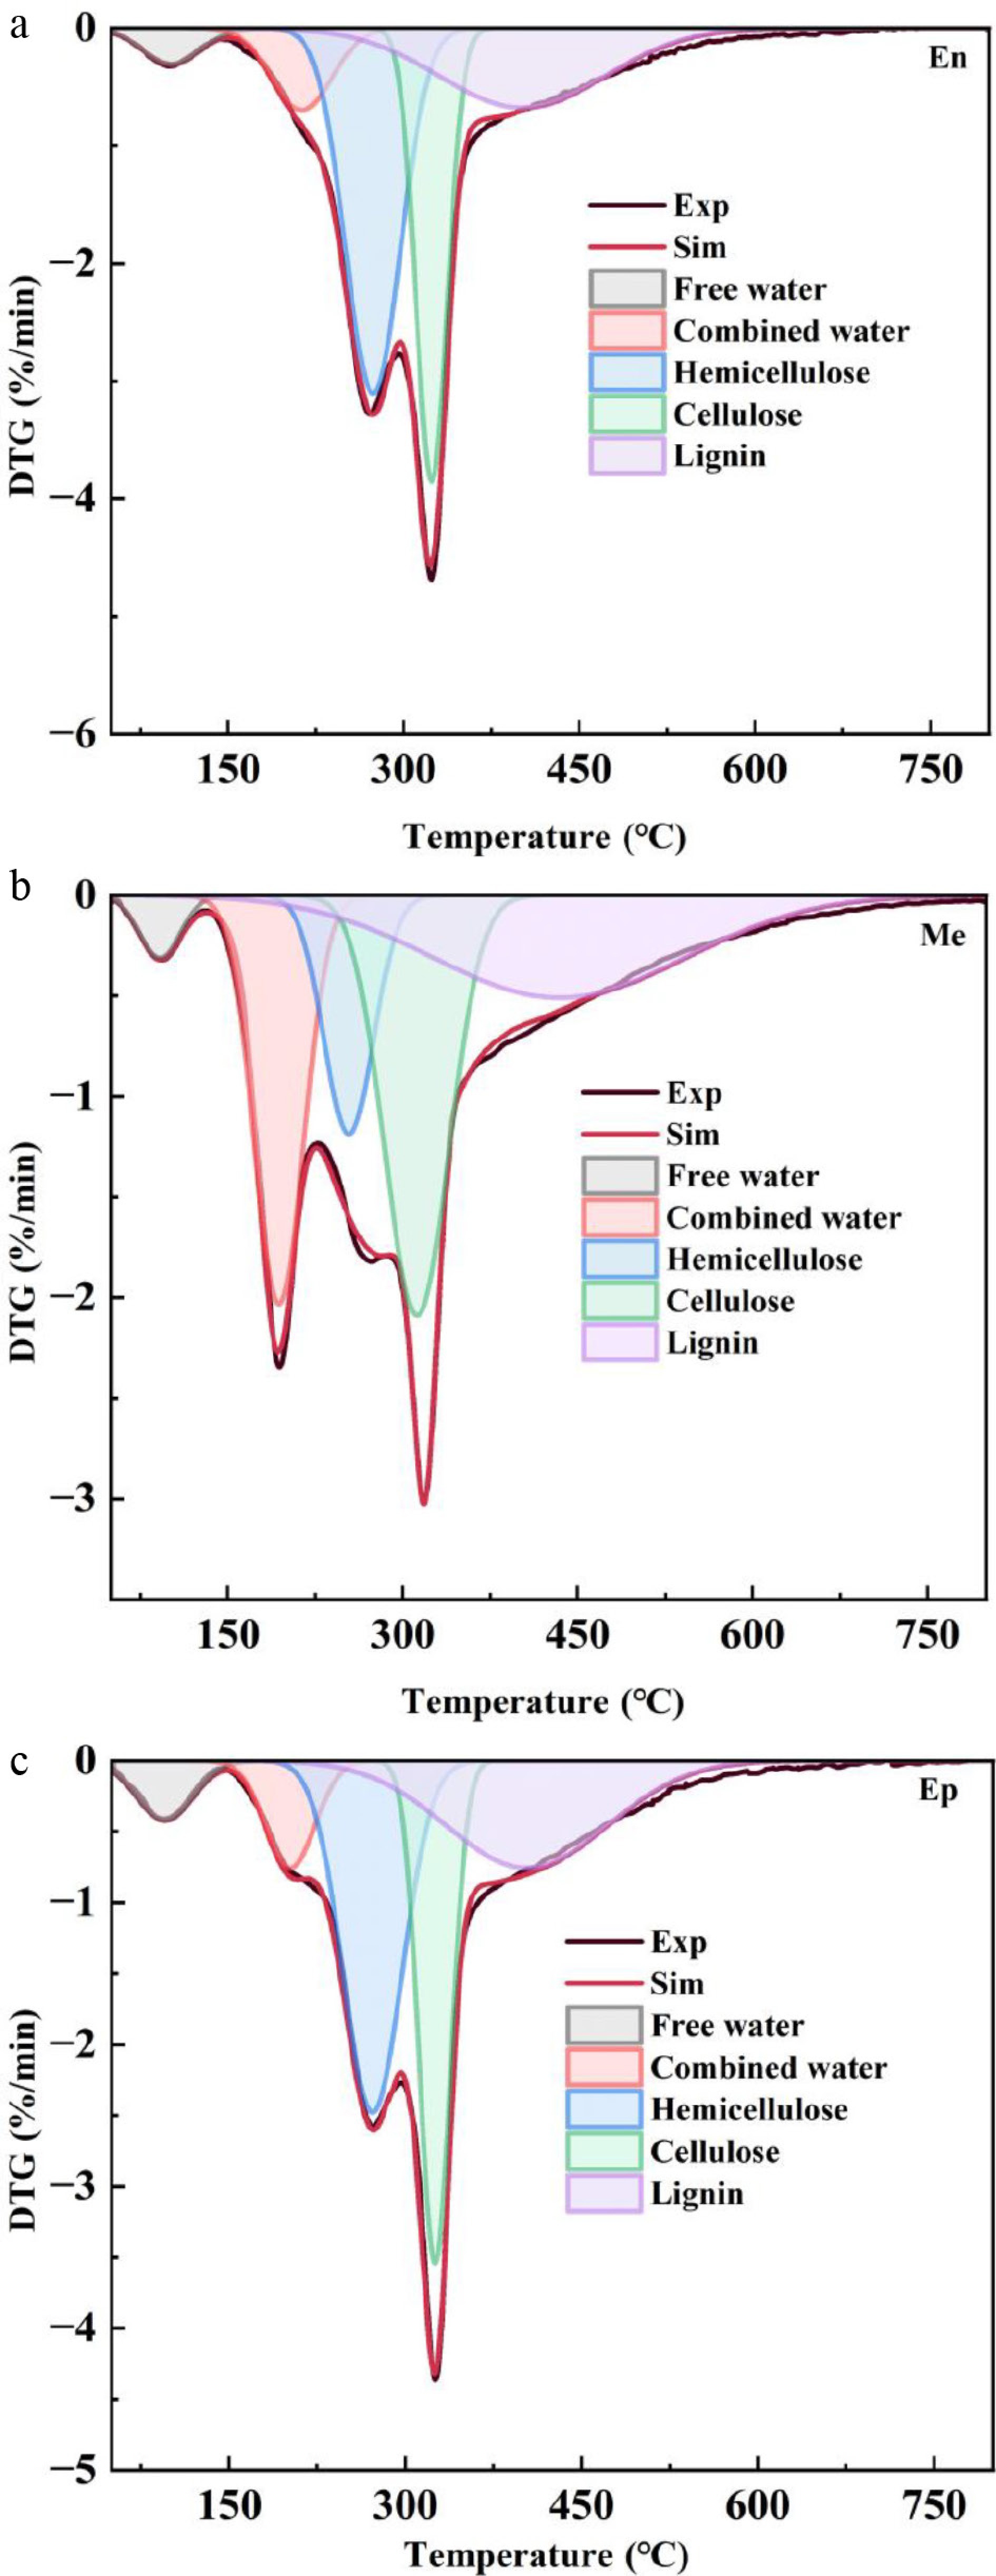
Figure 3.
Simulated DTG curves for (a) coconut shell (En), (b) coir (Me), and (c) husk (Ep).
-
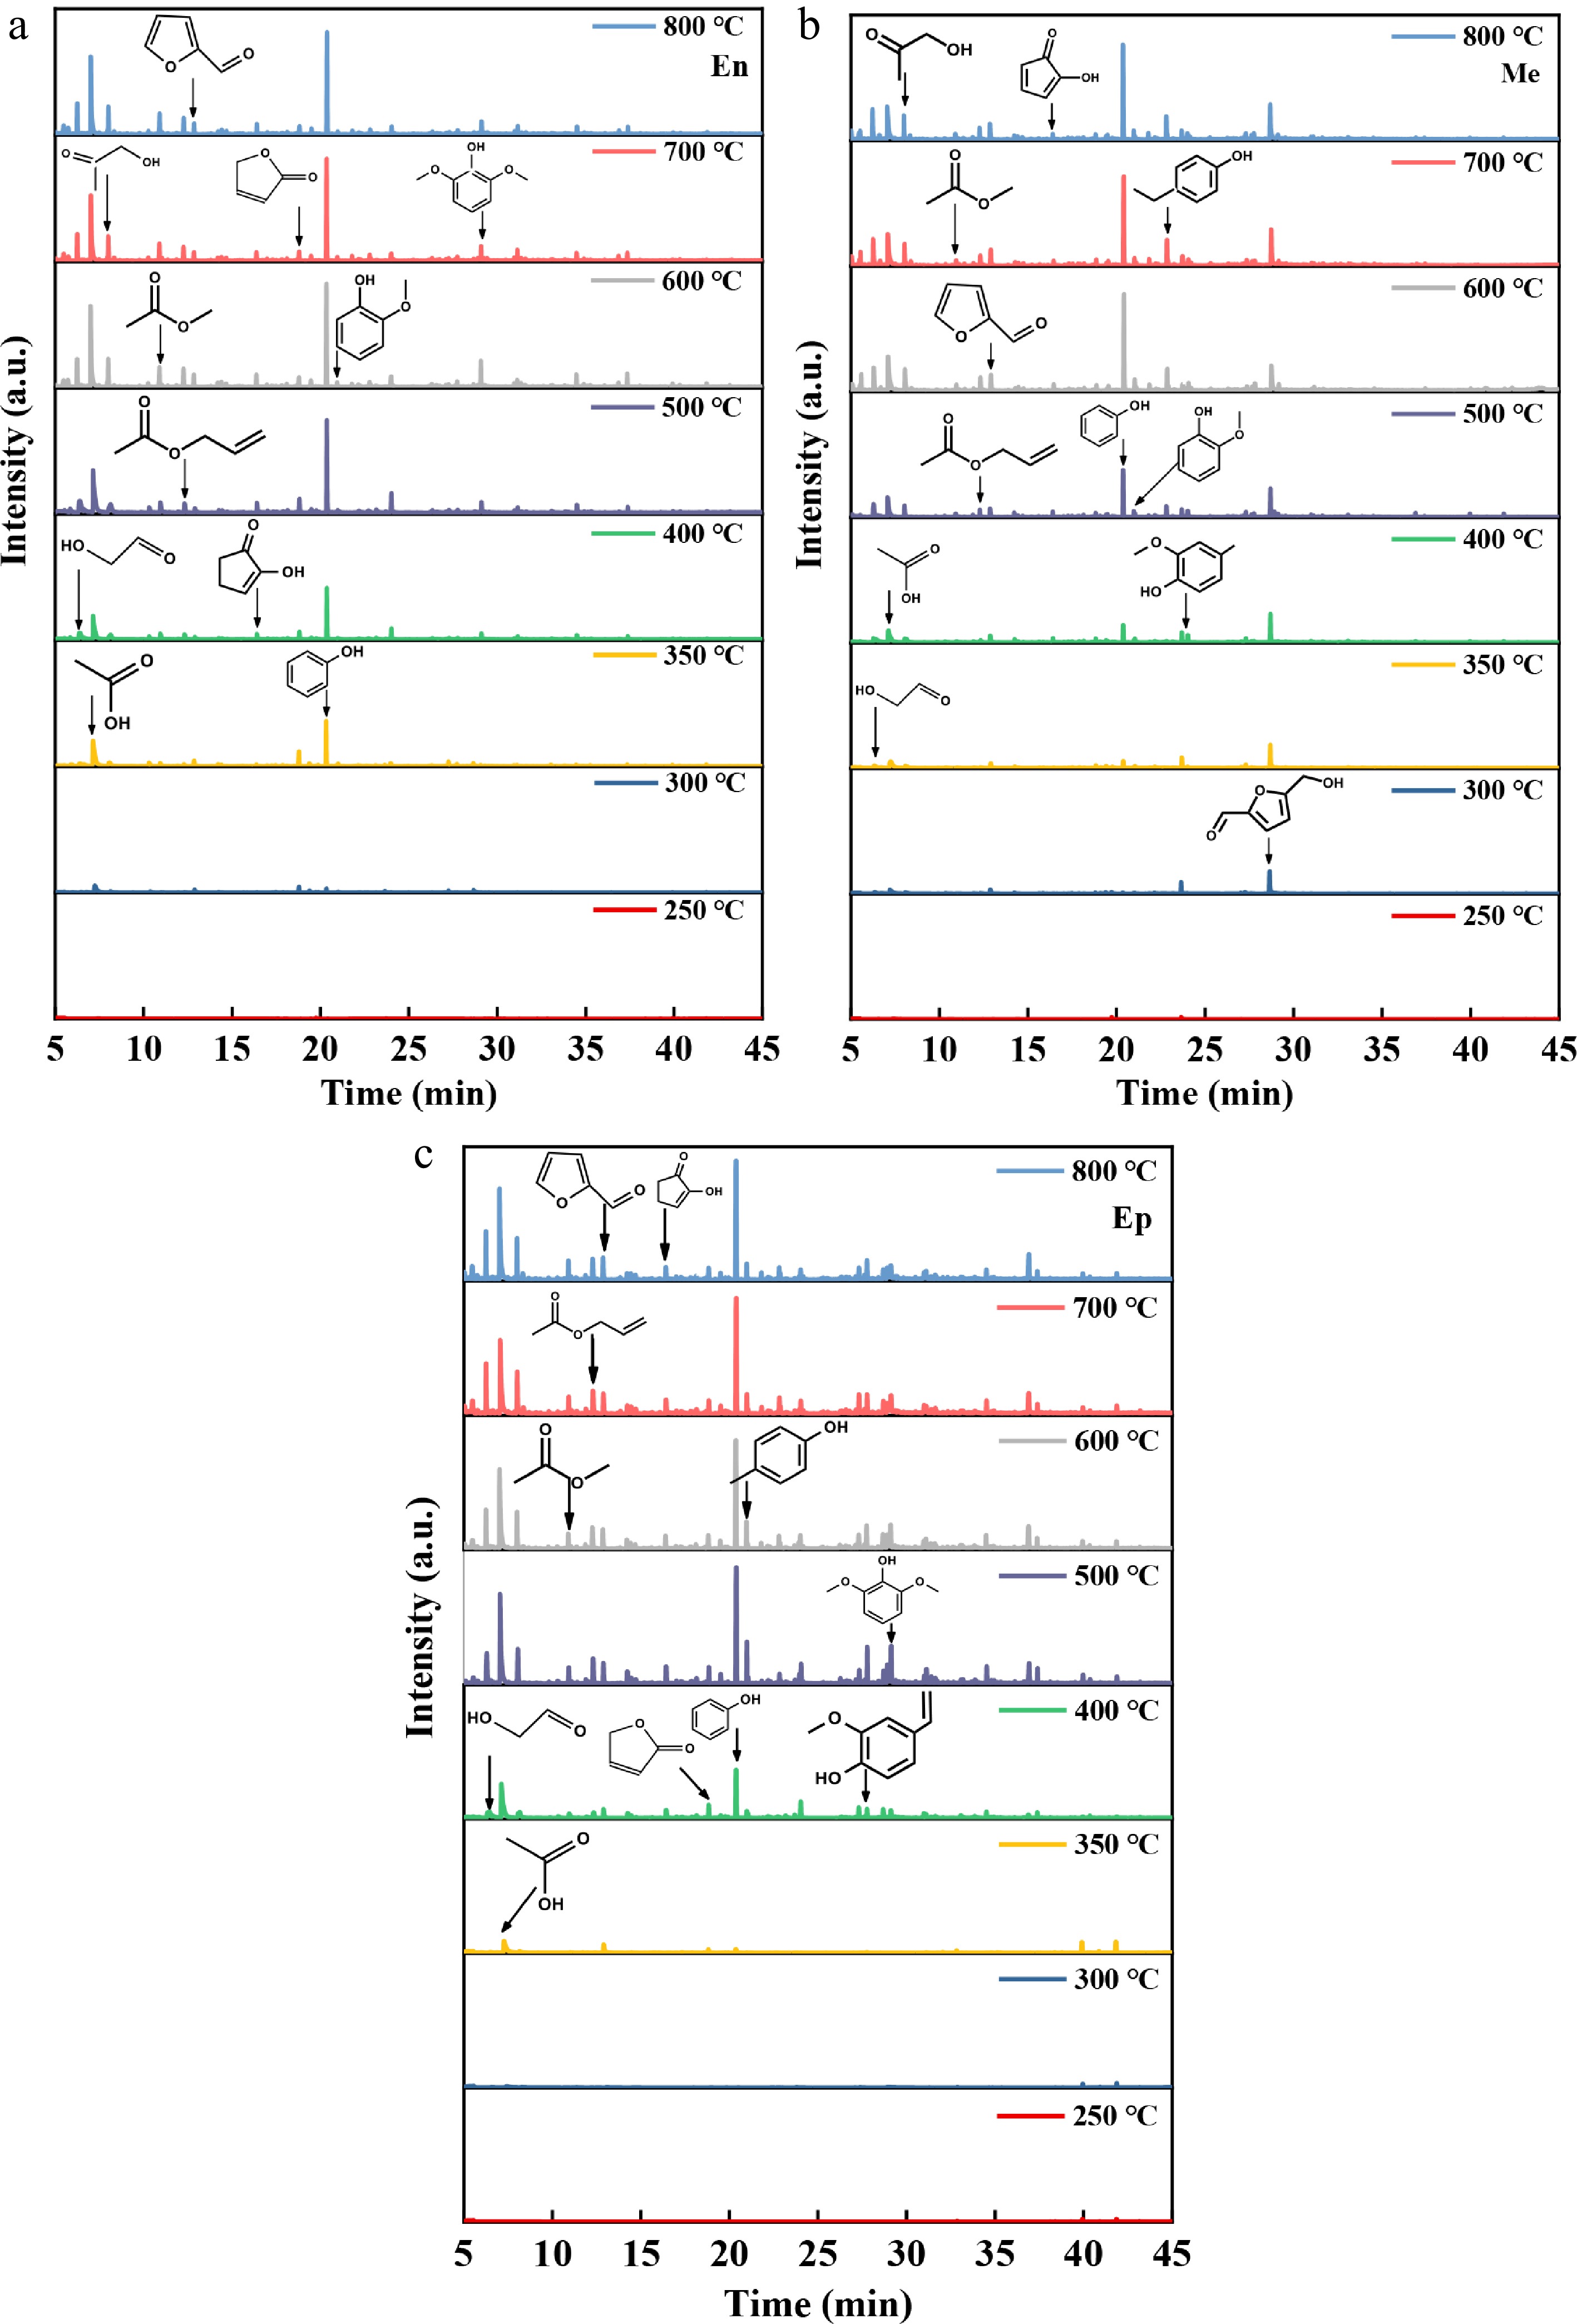
Figure 4.
The gas chromatogram spectra for fast pyrolysis products of (a) coconut shell (En), (b) coir (Me), and (c) husk (Ep) at different temperatures.
-
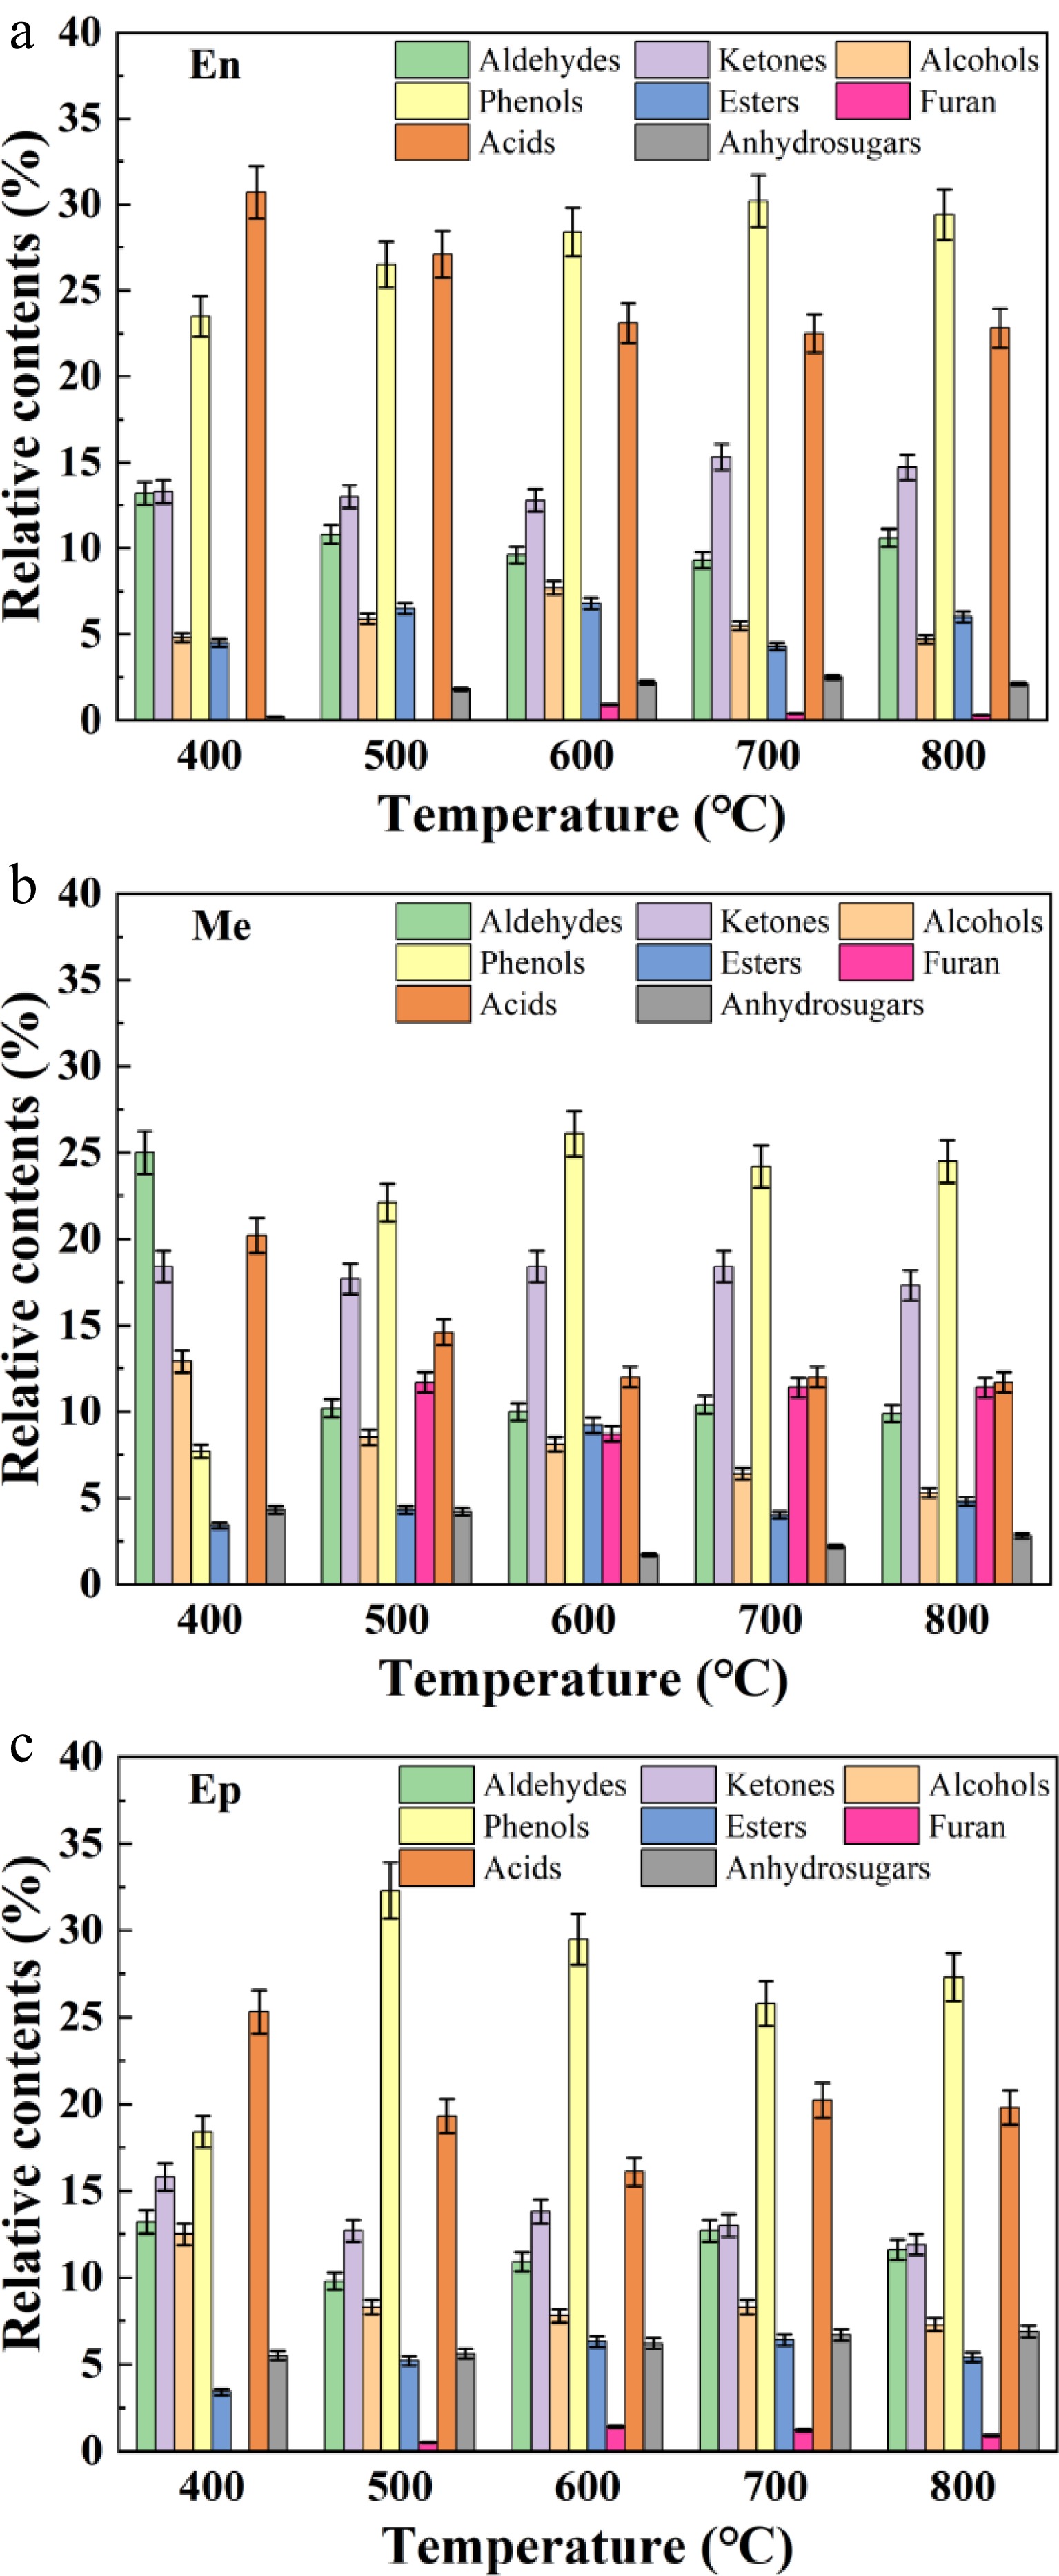
Figure 5.
Distribution of fast pyrolysis products from (a) coconut shell (En), (b) coir (Me) and (c) husk (Ep) at different temperatures.
-
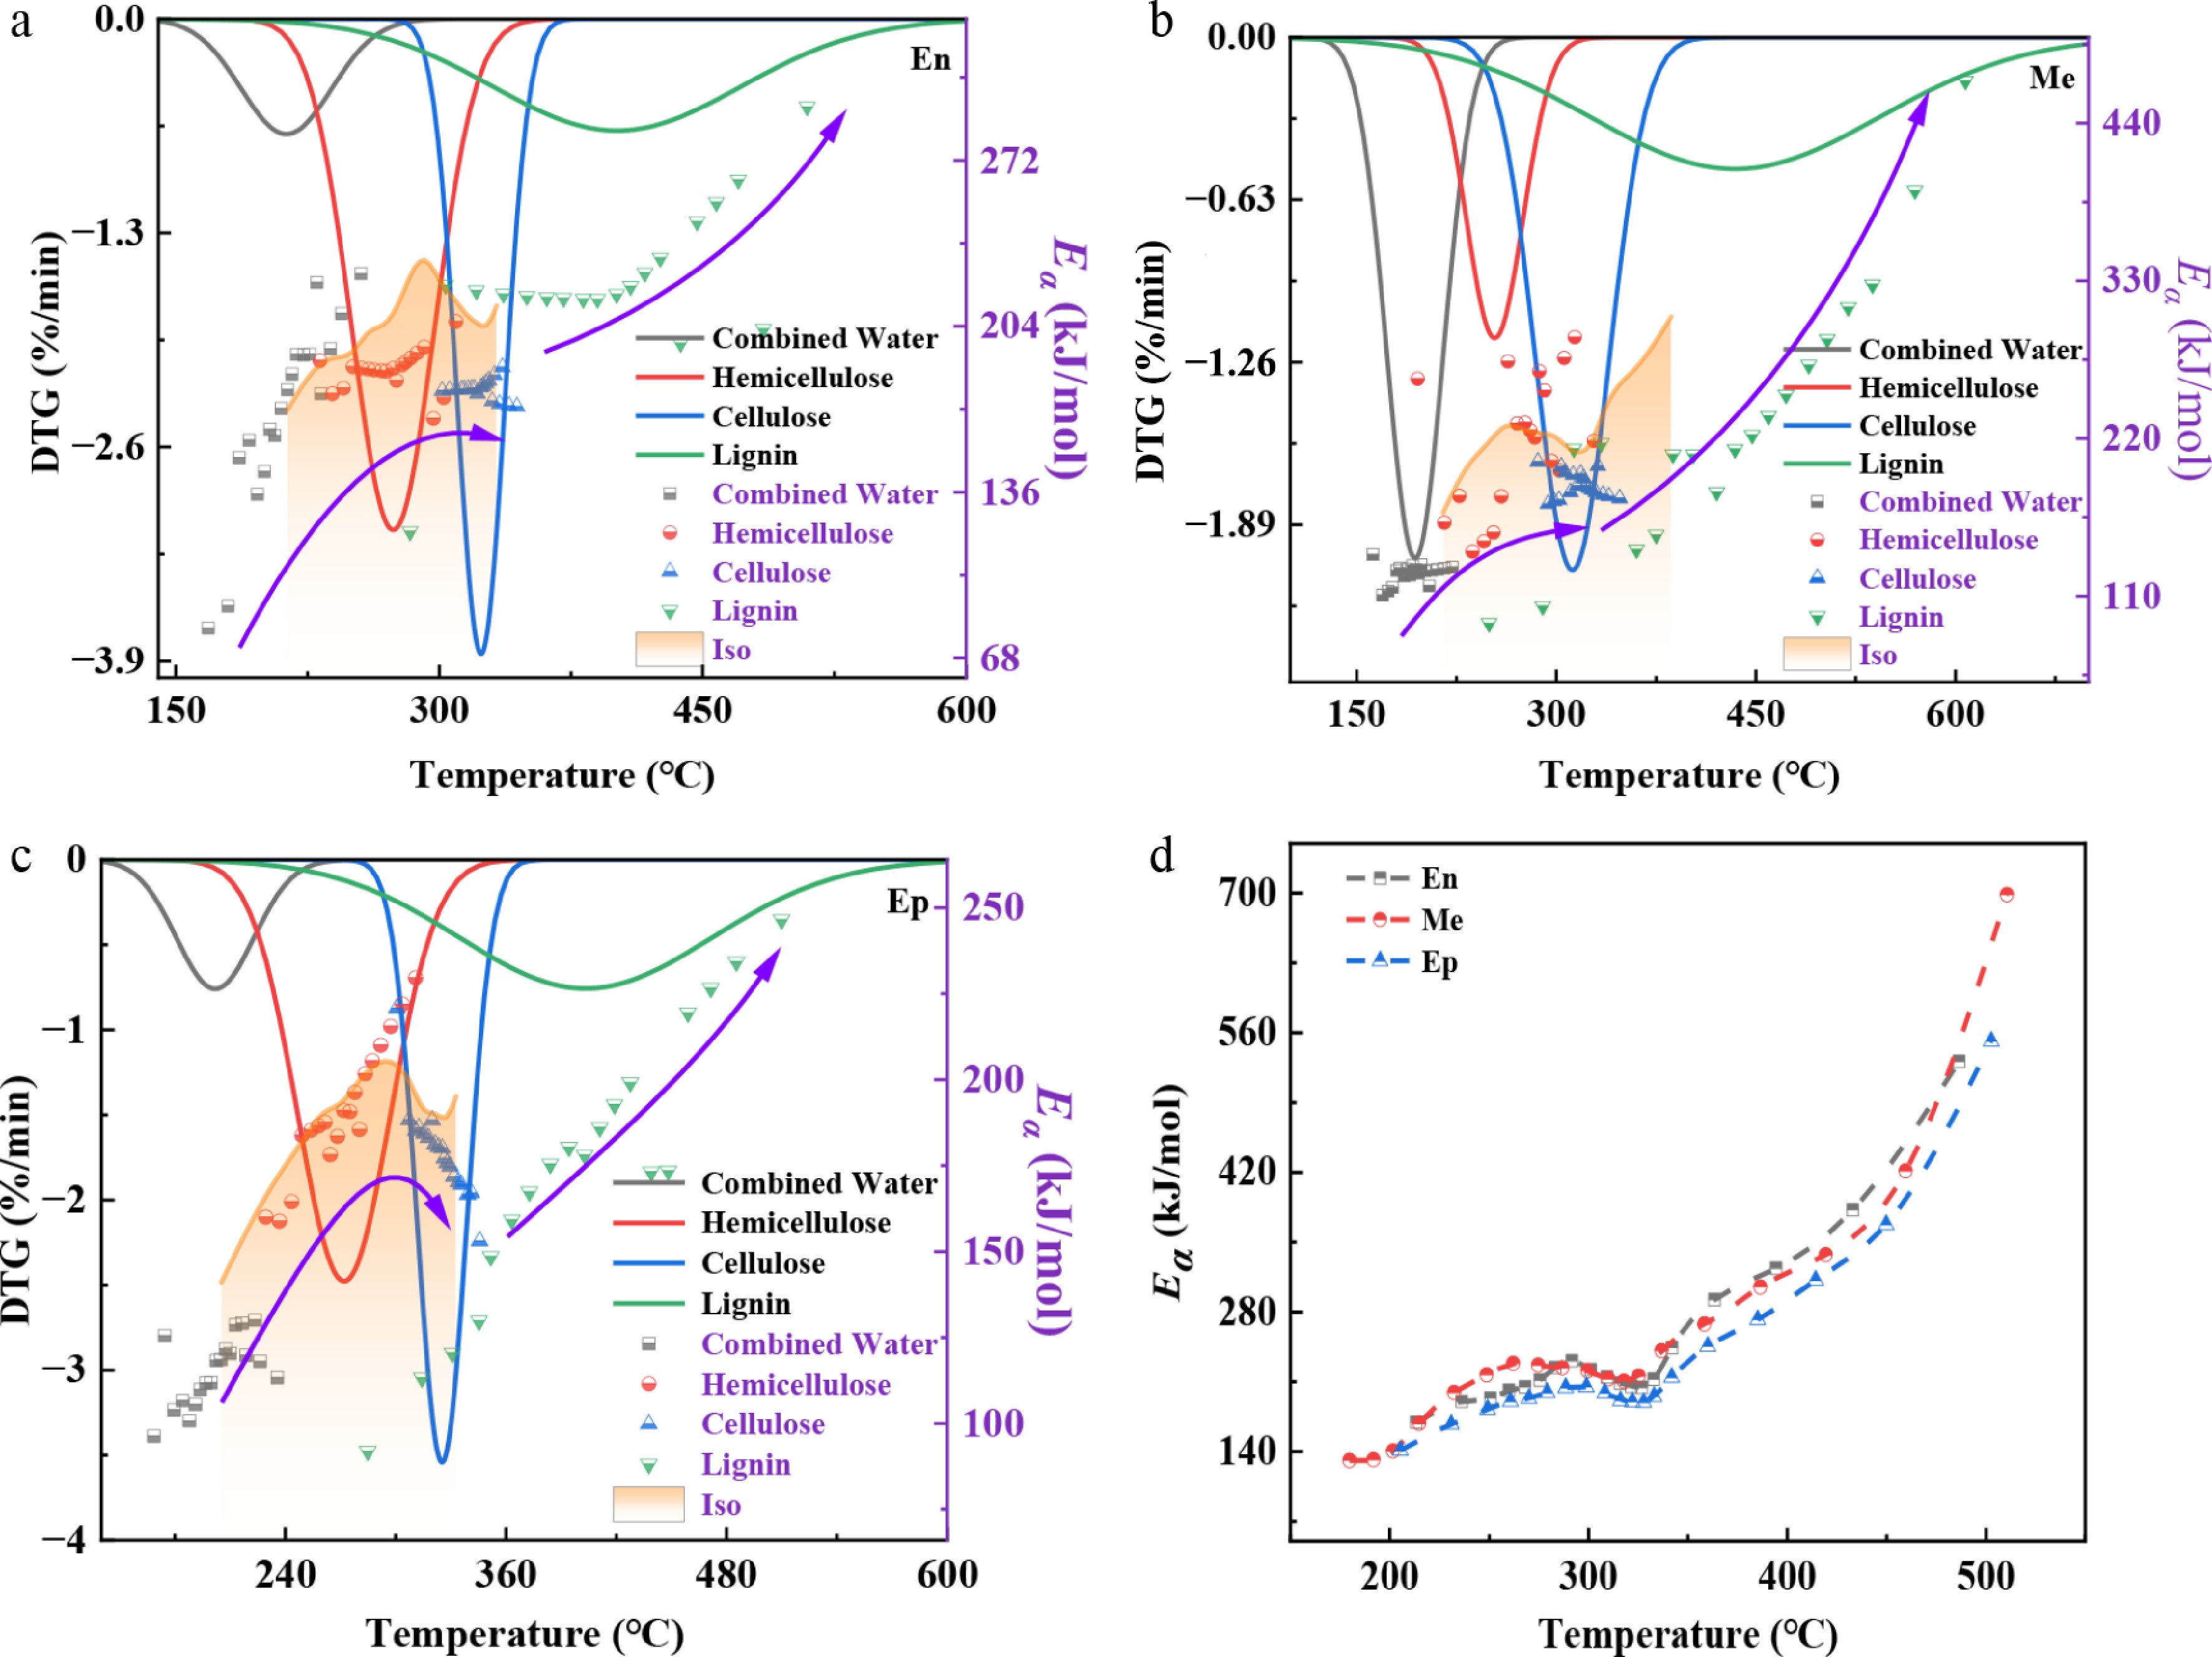
Figure 6.
Activation energy curves with temperature. Comparison of the results of each component of (a) coconut shell (En), (b) coir (Me), and (c) husk (Ep) with the isoconversional method in the reference interval. (d) Comparison of the results of the isoconversional method within the intact intervals of En, Me, and Ep.
-
Sample Combined water
wt%Hemicellulose
wt%Cellulose
wt%Lignin
wt%En 9.44 38.20 27.20 25.10 Me 24.09 13.91 32.04 29.96 Ep 8.98 35.07 26.74 29.20 Table 1.
The comparative results of each component of coconut shell (En), coir (Me), and husk (Ep).
-
Sample Ea (kJ/mol) En Me Ep Total 245.65 252.52 232.09 Combined water 169.23 125.93 115.27 Hemicellulose 186.05 216.56 191.38 Cellulose 177.98 187.37 179.14 Lignin 221.53 236.97 174.50 Table 2.
Total average Ea compared with the Ea of each component after deconvolution.
Figures
(6)
Tables
(2)