-
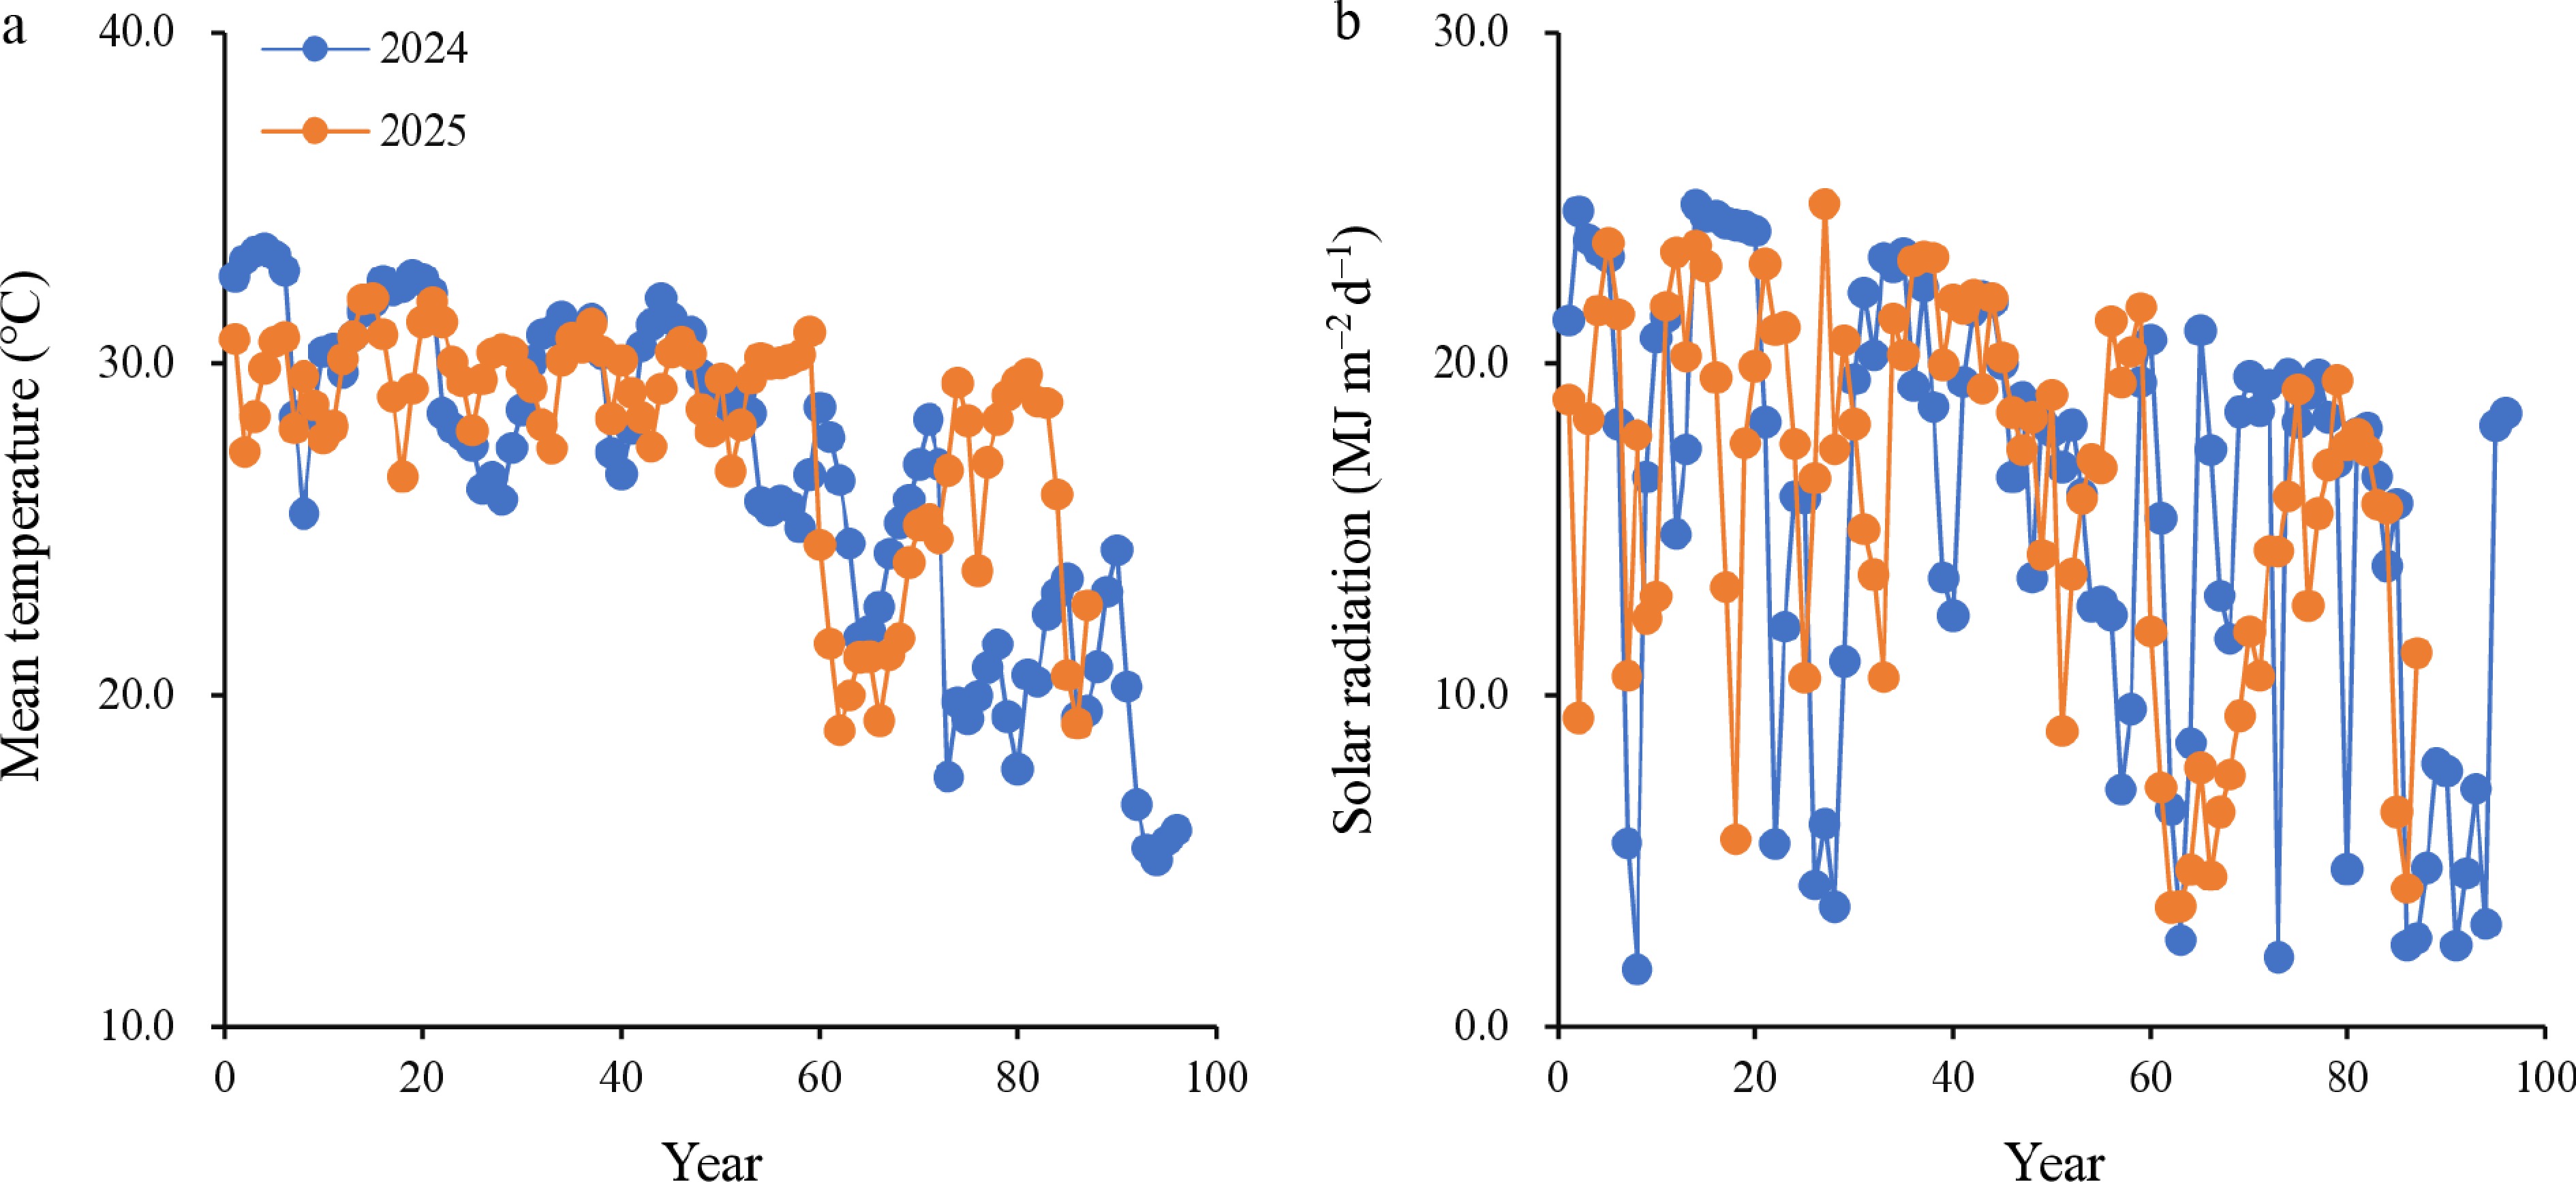
Figure 1.
Daily mean temperature (a) and solar radiation (b) during the rice-growing season (from transplanting to maturity) in 2024 and 2025.
-
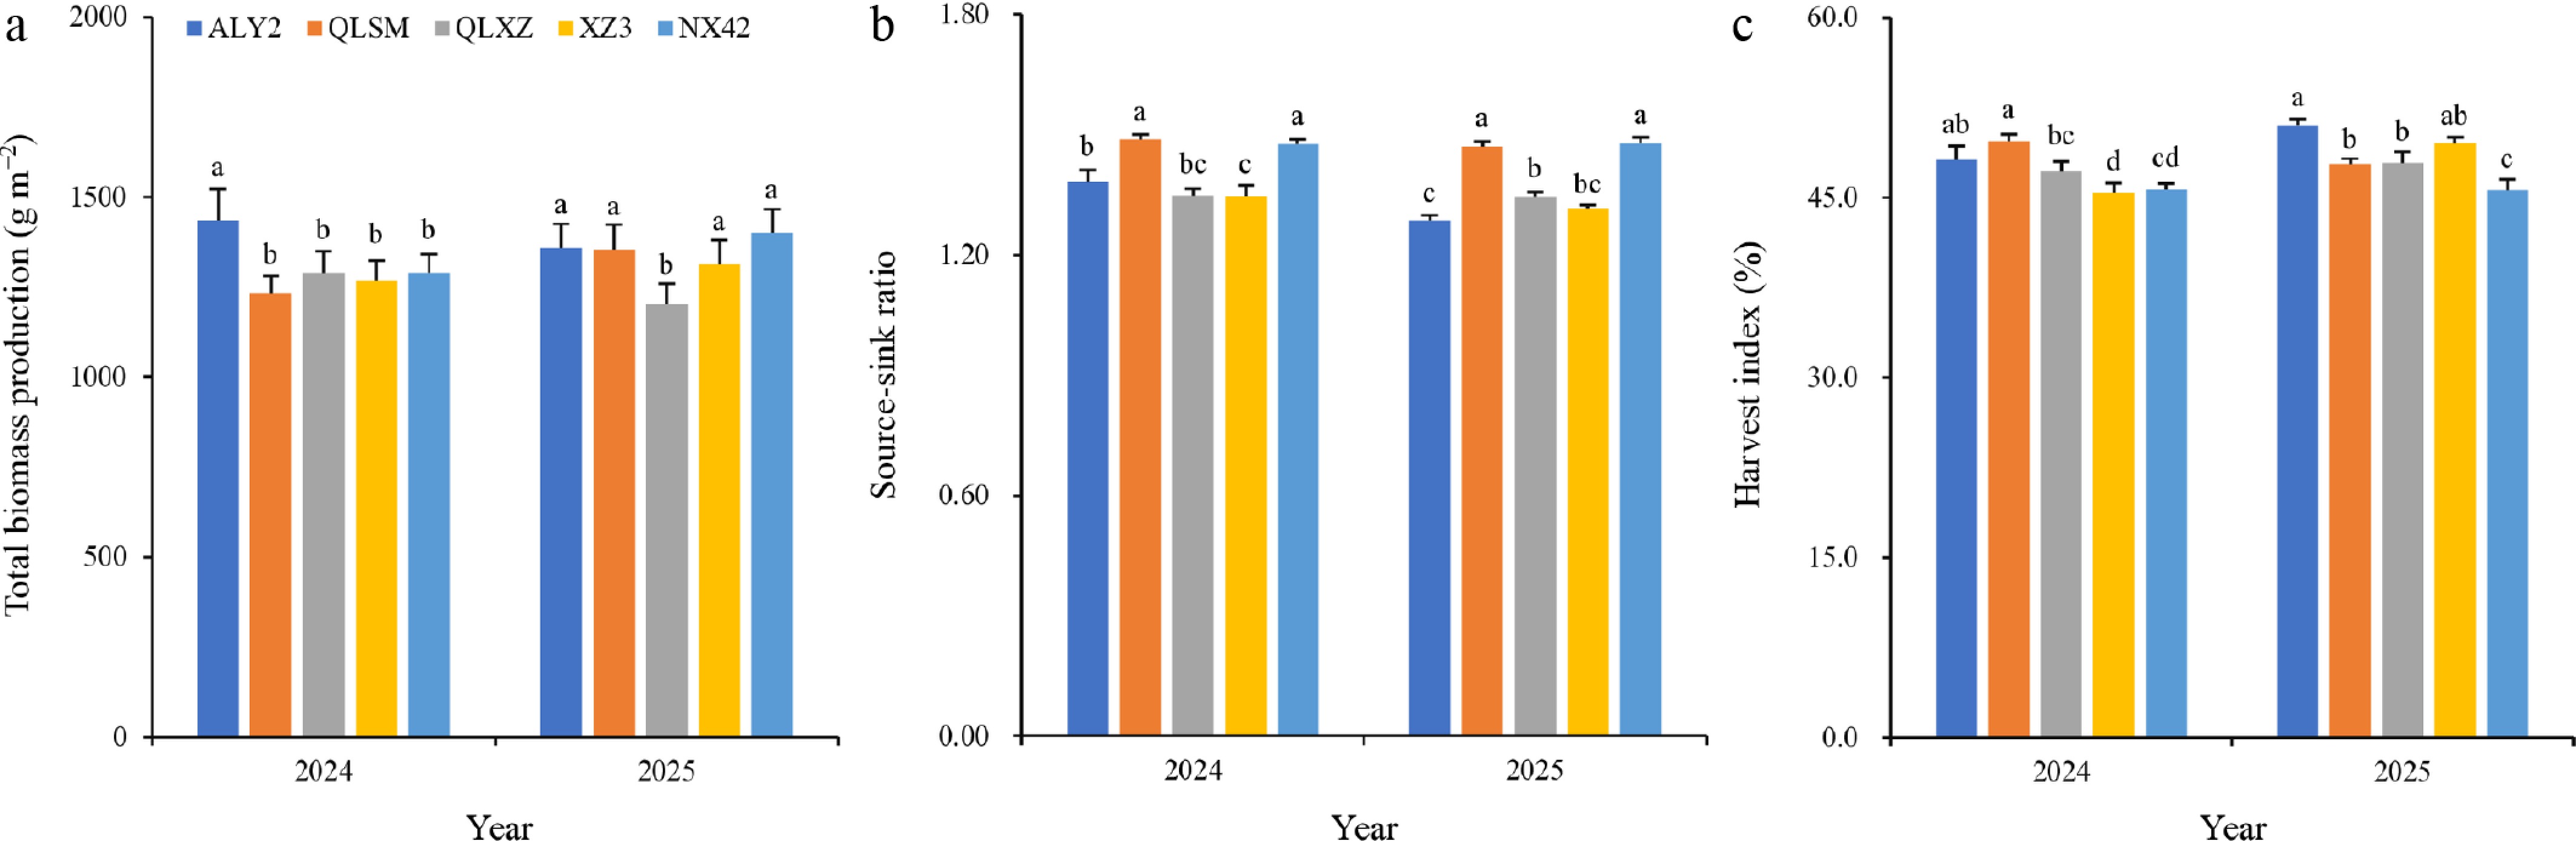
Figure 2.
(a) Total biomass production, (b) source–sink ratio, and (c) harvest index of five rice varieties in 2024 and 2025. Columns and error bars represent the means and standard errors, respectively, across five nitrogen (N) application rates, with three replicates per N application rate (n = 15). Within each year, means sharing the same letters are not significantly different at the 0.05 probability level. ALY2, QLSM, QLXZ, XZ3, and NX42 refer to the newly developed low-cadmium (Cd) rice varieties Anliangyou 2, Qingliansimiao, Qinglianxiangzhan, and Xizi 3 and the widely grown non-low-Cd variety Nongxiang 42, respectively.
-
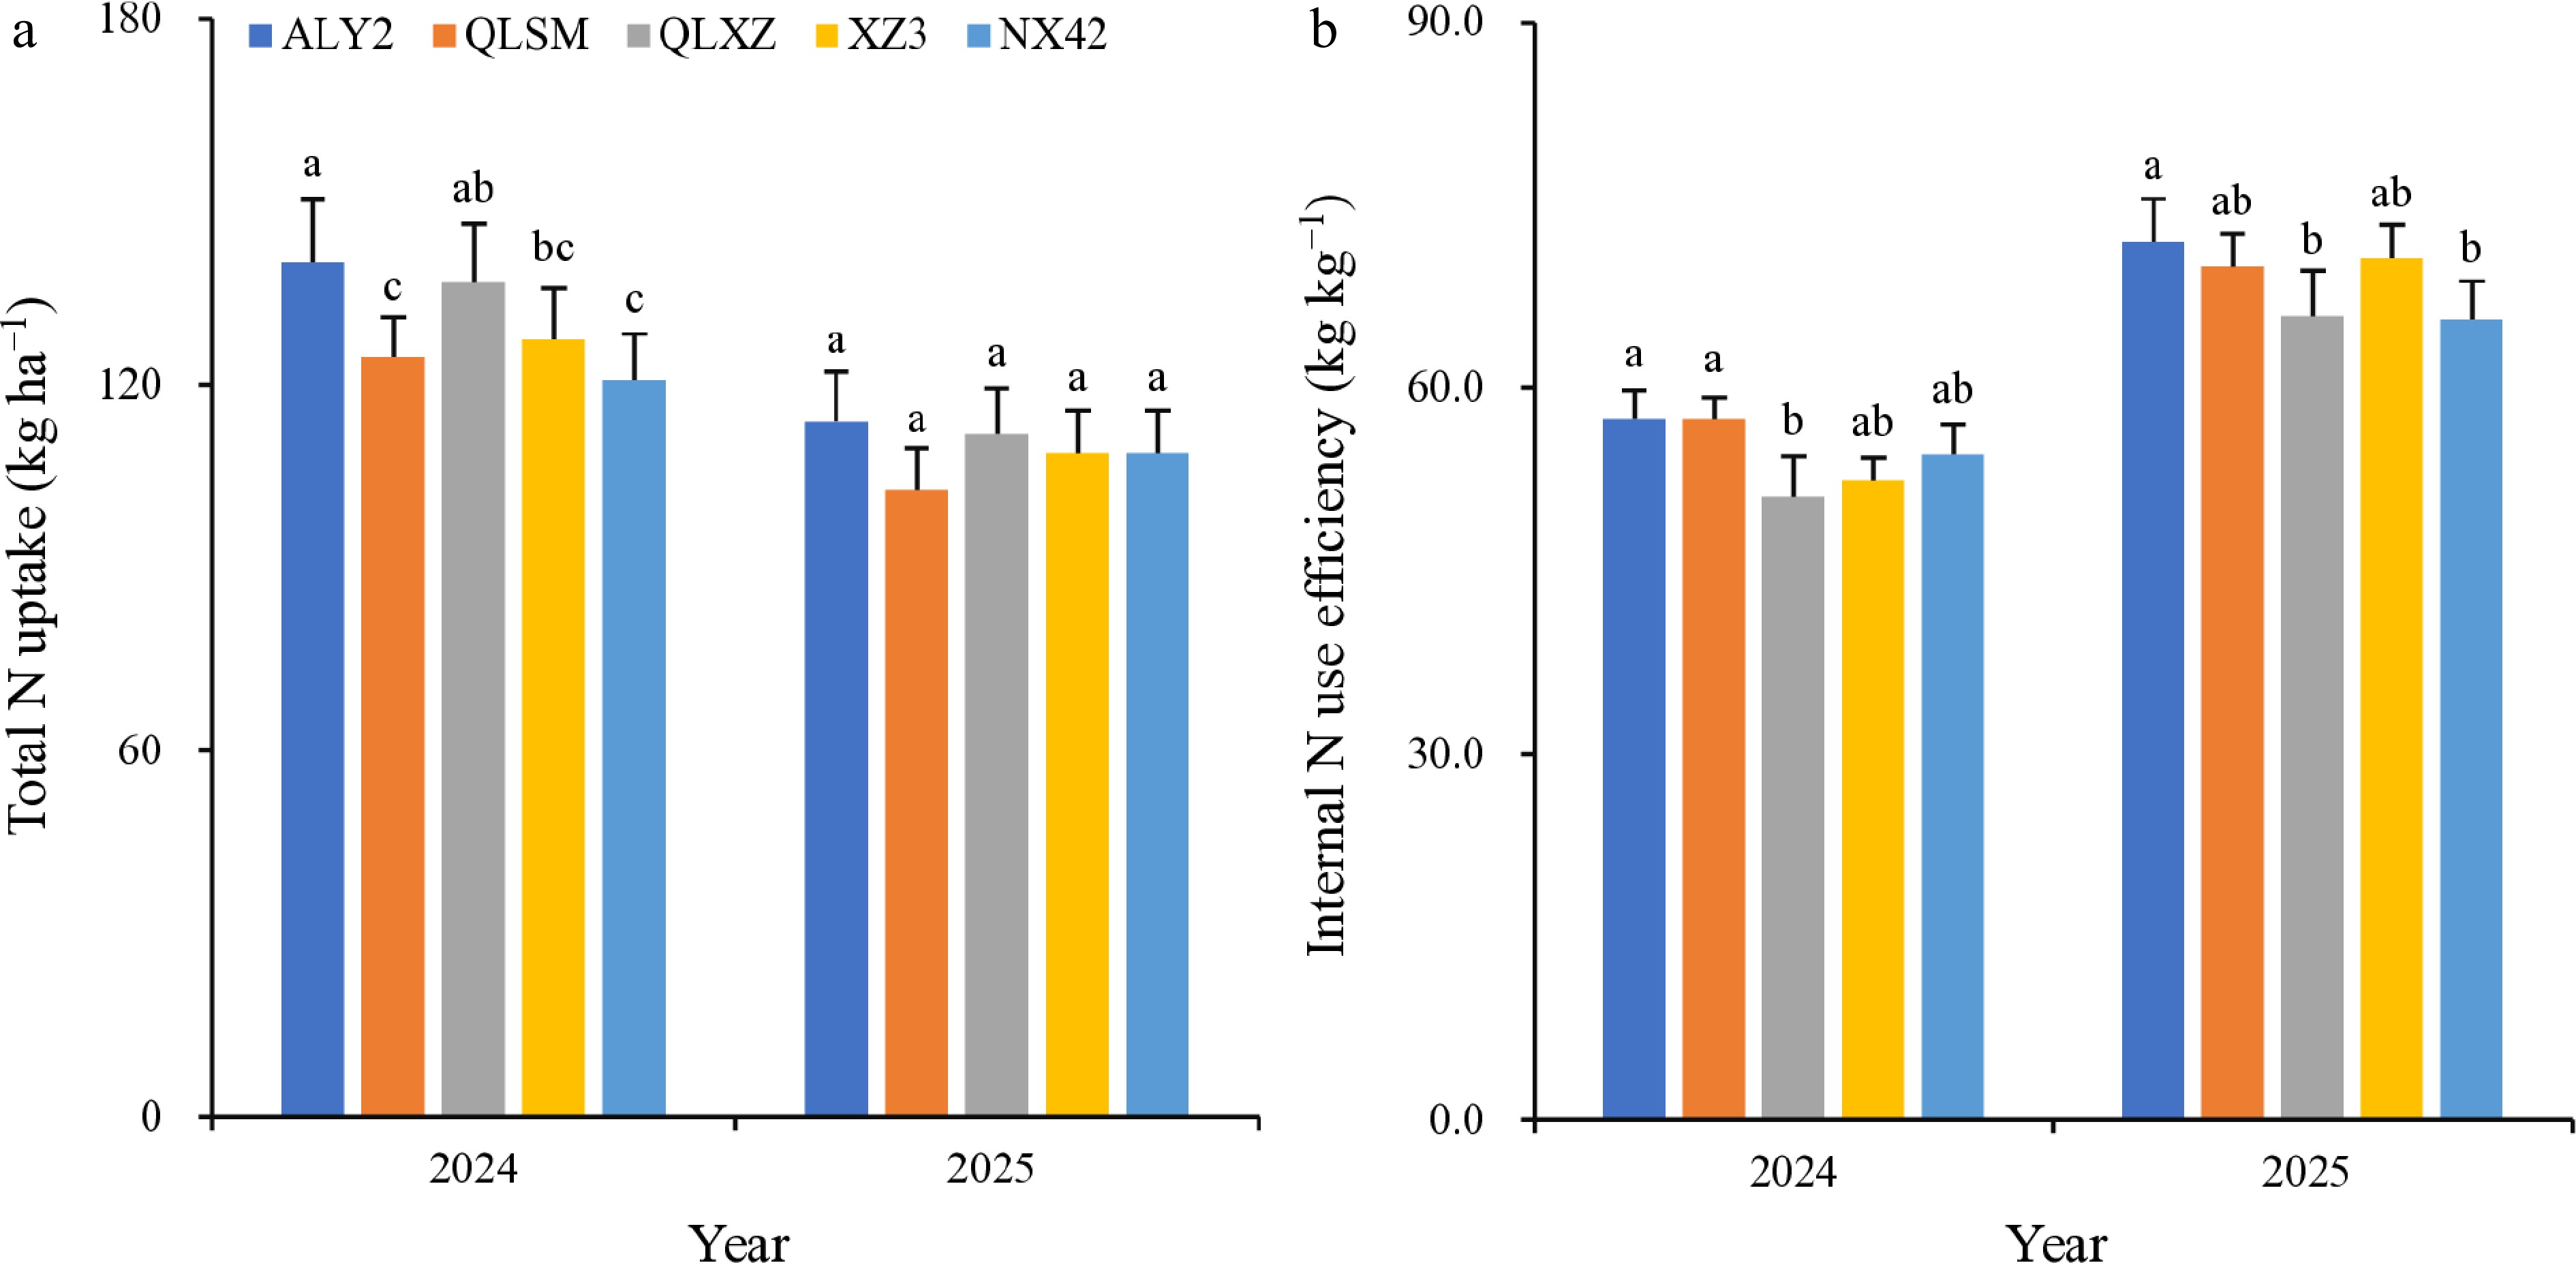
Figure 3.
(a) Total nitrogen (N) uptake and (b) internal N use efficiency of five rice varieties in 2024 and 2025. Columns and error bars represent the means and standard errors, respectively, across five N application rates, with three replicates per N application rate (n = 15). Within each year, means sharing the same letters are not significantly different at the 0.05 probability level. ALY2, QLSM, QLXZ, XZ3, and NX42 refer to the newly developed low-cadmium (Cd) rice varieties Anliangyou 2, Qingliansimiao, Qinglianxiangzhan, and Xizi 3 and the widely grown non-low-Cd variety Nongxiang 42, respectively.
-
Soil chemical property Value pH 6.61 Organic matter (g kg–1) 28.7 Total N (g kg–1) 2.19 Available N
(mg kg–1)171 Total P (g kg–1) 0.500 Available P (mg kg–1) 9.28 Total K (g kg–1) 17.2 Available K (mg kg–1) 103 Total Cd (mg kg–1) 0.366 Available Cd (mg kg–1) 0.255 N, P, K, and Cd are nitrogen, phosphorus, potassium, and cadmium, respectively. Table 1.
Soil chemical properties of the top 20 cm of the experimental field.
-
Varietya Type Grain Cd content (mg kg−1)b Parentc Release year Female Male ALY2 Low-Cd 0.000−0.159 An 1S Dige 2 2024 QLSM Low-Cd 0.000−0.130 Huazhan/Guangchaosimiao Dige 1 2024 QLXZ Low-Cd 0.000−0.150 Dige 1 Xiangzhan 2024 XZ3 Low-Cd 0.000−0.098 Huanghuazhan Luohong 4A/IR28 2023 NX42 Non-low-Cd Not available Xiangwanxian 17 Gumei 4 2020 a ALY2, QLSM, QLXZ, XZ3, and NX42 refer to the rice varieties Anliangyou 2, Qingliansimiao, Qinglianxiangzhan, Xizi 3, and Nongxiang 42, respectively. b Data on grain Cd content were sourced from the China Rice Data Center ( www.ricedata.cn/variety ). For ALY2, QLSM, and QLXZ, the data were derived from analyses of brown rice samples obtained through regional trials, production trials, and pond cultivation identification experiments conducted in Hunan Province. In the pond cultivation identification experiments, soil pH ranged from 5.0 to 6.0, and two soil Cd contents were applied: 0.7 ± 0.1 and 1.5 ± 0.1 mg kg−1. For XZ3, the data were obtained from analyses of brown rice samples collected in regional trials carried out in the middle and lower reaches of the Yangtze River. In China, the permissible limit for grain Cd content in rice is 0.2 mg kg−1. c Dige 1, Dige 2, and Luohong 4A are low-Cd rice germplasms carrying OsNRAMP5 mutations.Table 2.
Information on the four newly developed low-cadmium (Cd) rice varieties and the widely grown non-low-Cd rice variety used in this study.
-
Variable F-value 2024 2025 Grain yield 1.40NS 0.77NS Panicles m−2 0.82NS 0.66NS Spikelets panicle−1 1.74NS 0.59NS Spikelets m−2 0.79NS 0.74NS Spikelet filling percentage 2.76** 3.06** Grain weight 0.92NS 1.21NS Total biomass production 1.83NS 0.35NS Harvest index 5.07** 1.52NS Sink capacity 0.81NS 0.54NS Source–sink ratio 6.50** 1.39NS Total N uptake 1.04NS 0.43NS Internal N use efficiency 0.80NS 1.47NS ** indicates significance at the 0.01 probability level, and NS indicates nonsignificance at the 0.05 probability level. Table 3.
Analysis of variance of the interactive effects of variety and nitrogen application rate on yield formation characteristics in rice in 2024 and 2025.
-
Experimental factor Grain yield (t ha−1) 2024 2025 Varietya ALY2 7.79 ± 0.37a 8.01 ± 0.25a QLSM 7.02 ± 0.25b 7.72 ± 0.35a QLXZ 6.62 ± 0.25c 6.49 ± 0.26b XZ3 6.52 ± 0.32c 7.67 ± 0.33a NX42 6.36 ± 0.21c 6.89 ± 0.27b N application rate (kg ha−1) 0 5.32 ± 0.12d 5.94 ± 0.17c 90 6.18 ± 0.16c 7.08 ± 0.24b 120 7.27 ± 0.22b 7.48 ± 0.29b 150 7.82 ± 0.19a 8.16 ± 0.35a 180 7.72 ± 0.21a 8.12 ± 0.15a Data for each variety are presented as the mean ± standard error across five N application rates, with three replicates per N application rate (n = 15), and for each N application rate as mean ± standard error across five varieties, with three replicates per variety (n = 15). Within a column for each experimental factor (variety or N application rate), means sharing the same letters are not significantly different at the 0.05 probability level. a ALY2, QLSM, QLXZ, XZ3, and NX42 refer to the newly developed low-cadmium (Cd) rice varieties Anliangyou 2, Qingliansimiao, Qinglianxiangzhan, and Xizi 3 and the widely grown non-low-Cd variety Nongxiang 42, respectively. Table 4.
Grain yield of five rice varieties grown under five nitrogen (N) application rates in 2024 and 2025.
-
Varietya Panicles m−2 Spikelets panicle−1 Spikelets m−2 (×103) Spikelet filling (%) Grain weight (mg) Sink capacity (g m−2) 2024 ALY2 252 ± 10b 176 ± 4a 44.4 ± 1.9a 76.4 ± 0.7b 23.3 ± 0.1b 1,033 ± 45a QLSM 223 ± 10cd 162 ± 4c 36.1 ± 1.7c 85.5 ± 0.8a 23.0 ± 0.1b 831 ± 37d QLXZ 239 ± 8bc 165 ± 4bc 39.4 ± 1.6b 73.4 ± 0.7c 24.3 ± 0.2a 958 ± 42b XZ3 274 ± 11a 173 ± 4ab 47.4 ± 1.8a 70.6 ± 1.6d 20.0 ± 0.2c 948 ± 34bc NX42 211 ± 4d 168 ± 4abc 35.4 ± 1.3c 78.0 ± 0.9b 24.5 ± 0.1a 868 ± 35cd 2025 ALY2 274 ± 11b 152 ± 2a 41.6 ± 2.1b 75.9 ± 0.9bc 25.4 ± 0.1c 1,058 ± 55a QLSM 276 ± 13b 133 ± 2c 36.7 ± 1.7c 81.4 ± 1.2a 25.0 ± 0.1d 918 ± 43c QLXZ 264 ± 10b 127 ± 3c 33.5 ± 1.3d 74.6 ± 1.6c 26.8 ± 0.2a 899 ± 37c XZ3 295 ± 13a 153 ± 1a 45.1 ± 2.1a 75.4 ± 1.1bc 22.0 ± 0.1e 993 ± 48b NX42 260 ± 12b 140 ± 3b 36.4 ± 1.8c 78.1 ± 2.0b 26.0 ± 0.2b 946 ± 48bc Data are presented as the mean ± standard error across five nitrogen (N) application rates, with three replicates per N application rate (n = 15). Within a column for each year, means sharing the same letters are not significantly different at the 0.05 probability level. aALY2, QLSM, QLXZ, XZ3, and NX42 refer to the newly developed low-cadmium (Cd) rice varieties Anliangyou 2, Qingliansimiao, Qinglianxiangzhan, and Xizi 3 and the widely grown non-low-Cd variety Nongxiang 42, respectively. Table 5.
Yield components of five rice varieties in 2024 and 2025.
Figures
(3)
Tables
(5)