-
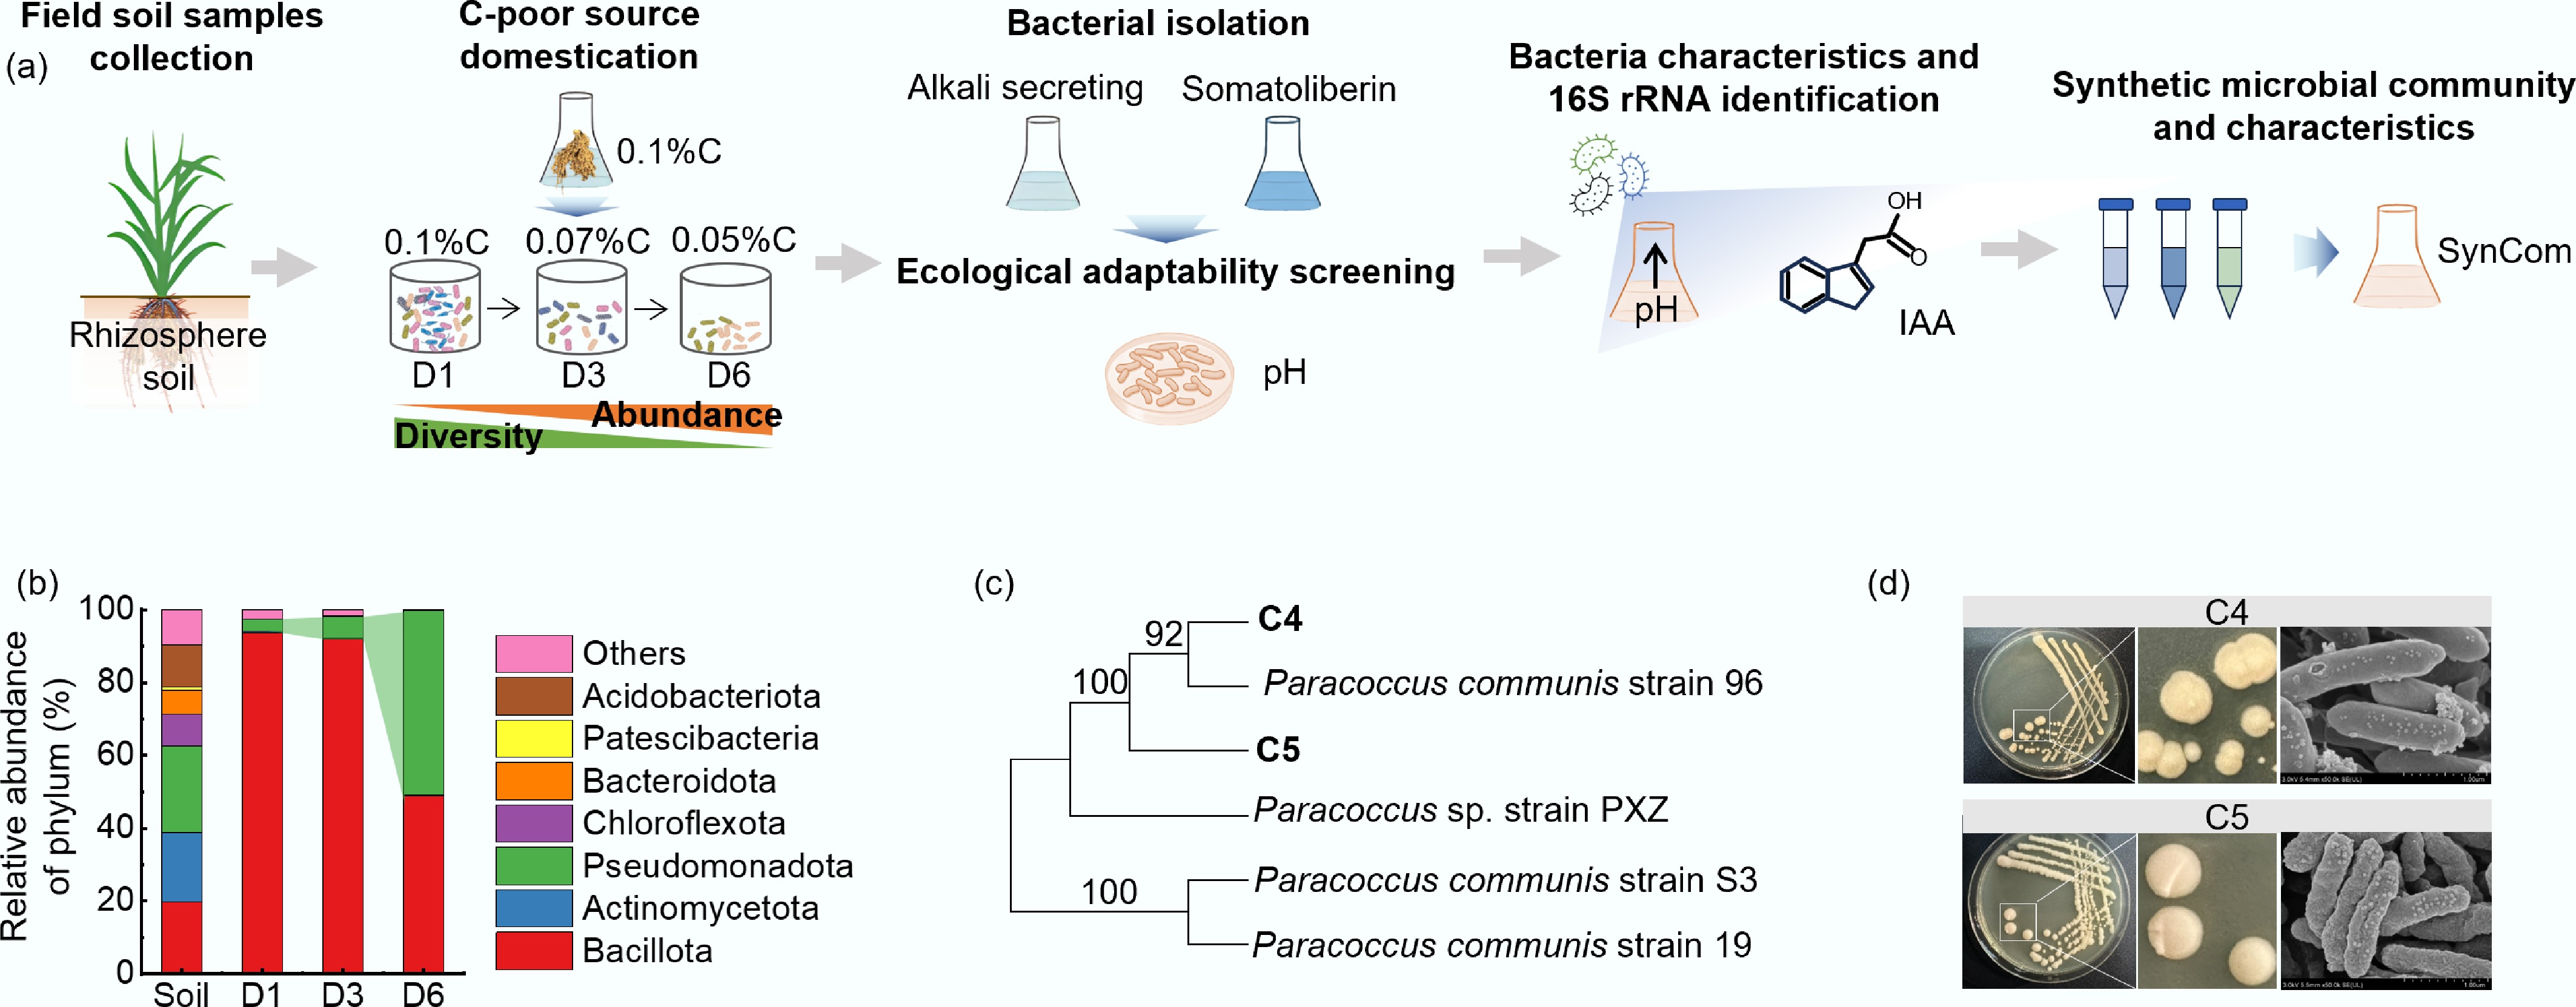
Figure 1.
Screening of candidate strains for synthetic communities based on acidic red soil. (a) Schematic of alkali-producing and growth-promoting SynCom obtained from rhizosphere soil. (b) Microbial diversity and abundance of rhizosphere soil microorganisms cultured after acclimation with low C sources. (c) Evolutionary tree. (d) Community morphology, and SEM of dominant species isolated from D6 culture. D1, D3, and D6 represent soil microorganisms of rhizosphere soil acclimated by 0.1%, 0.07%, and 0.05% (w/w) C sources, respectively.
-
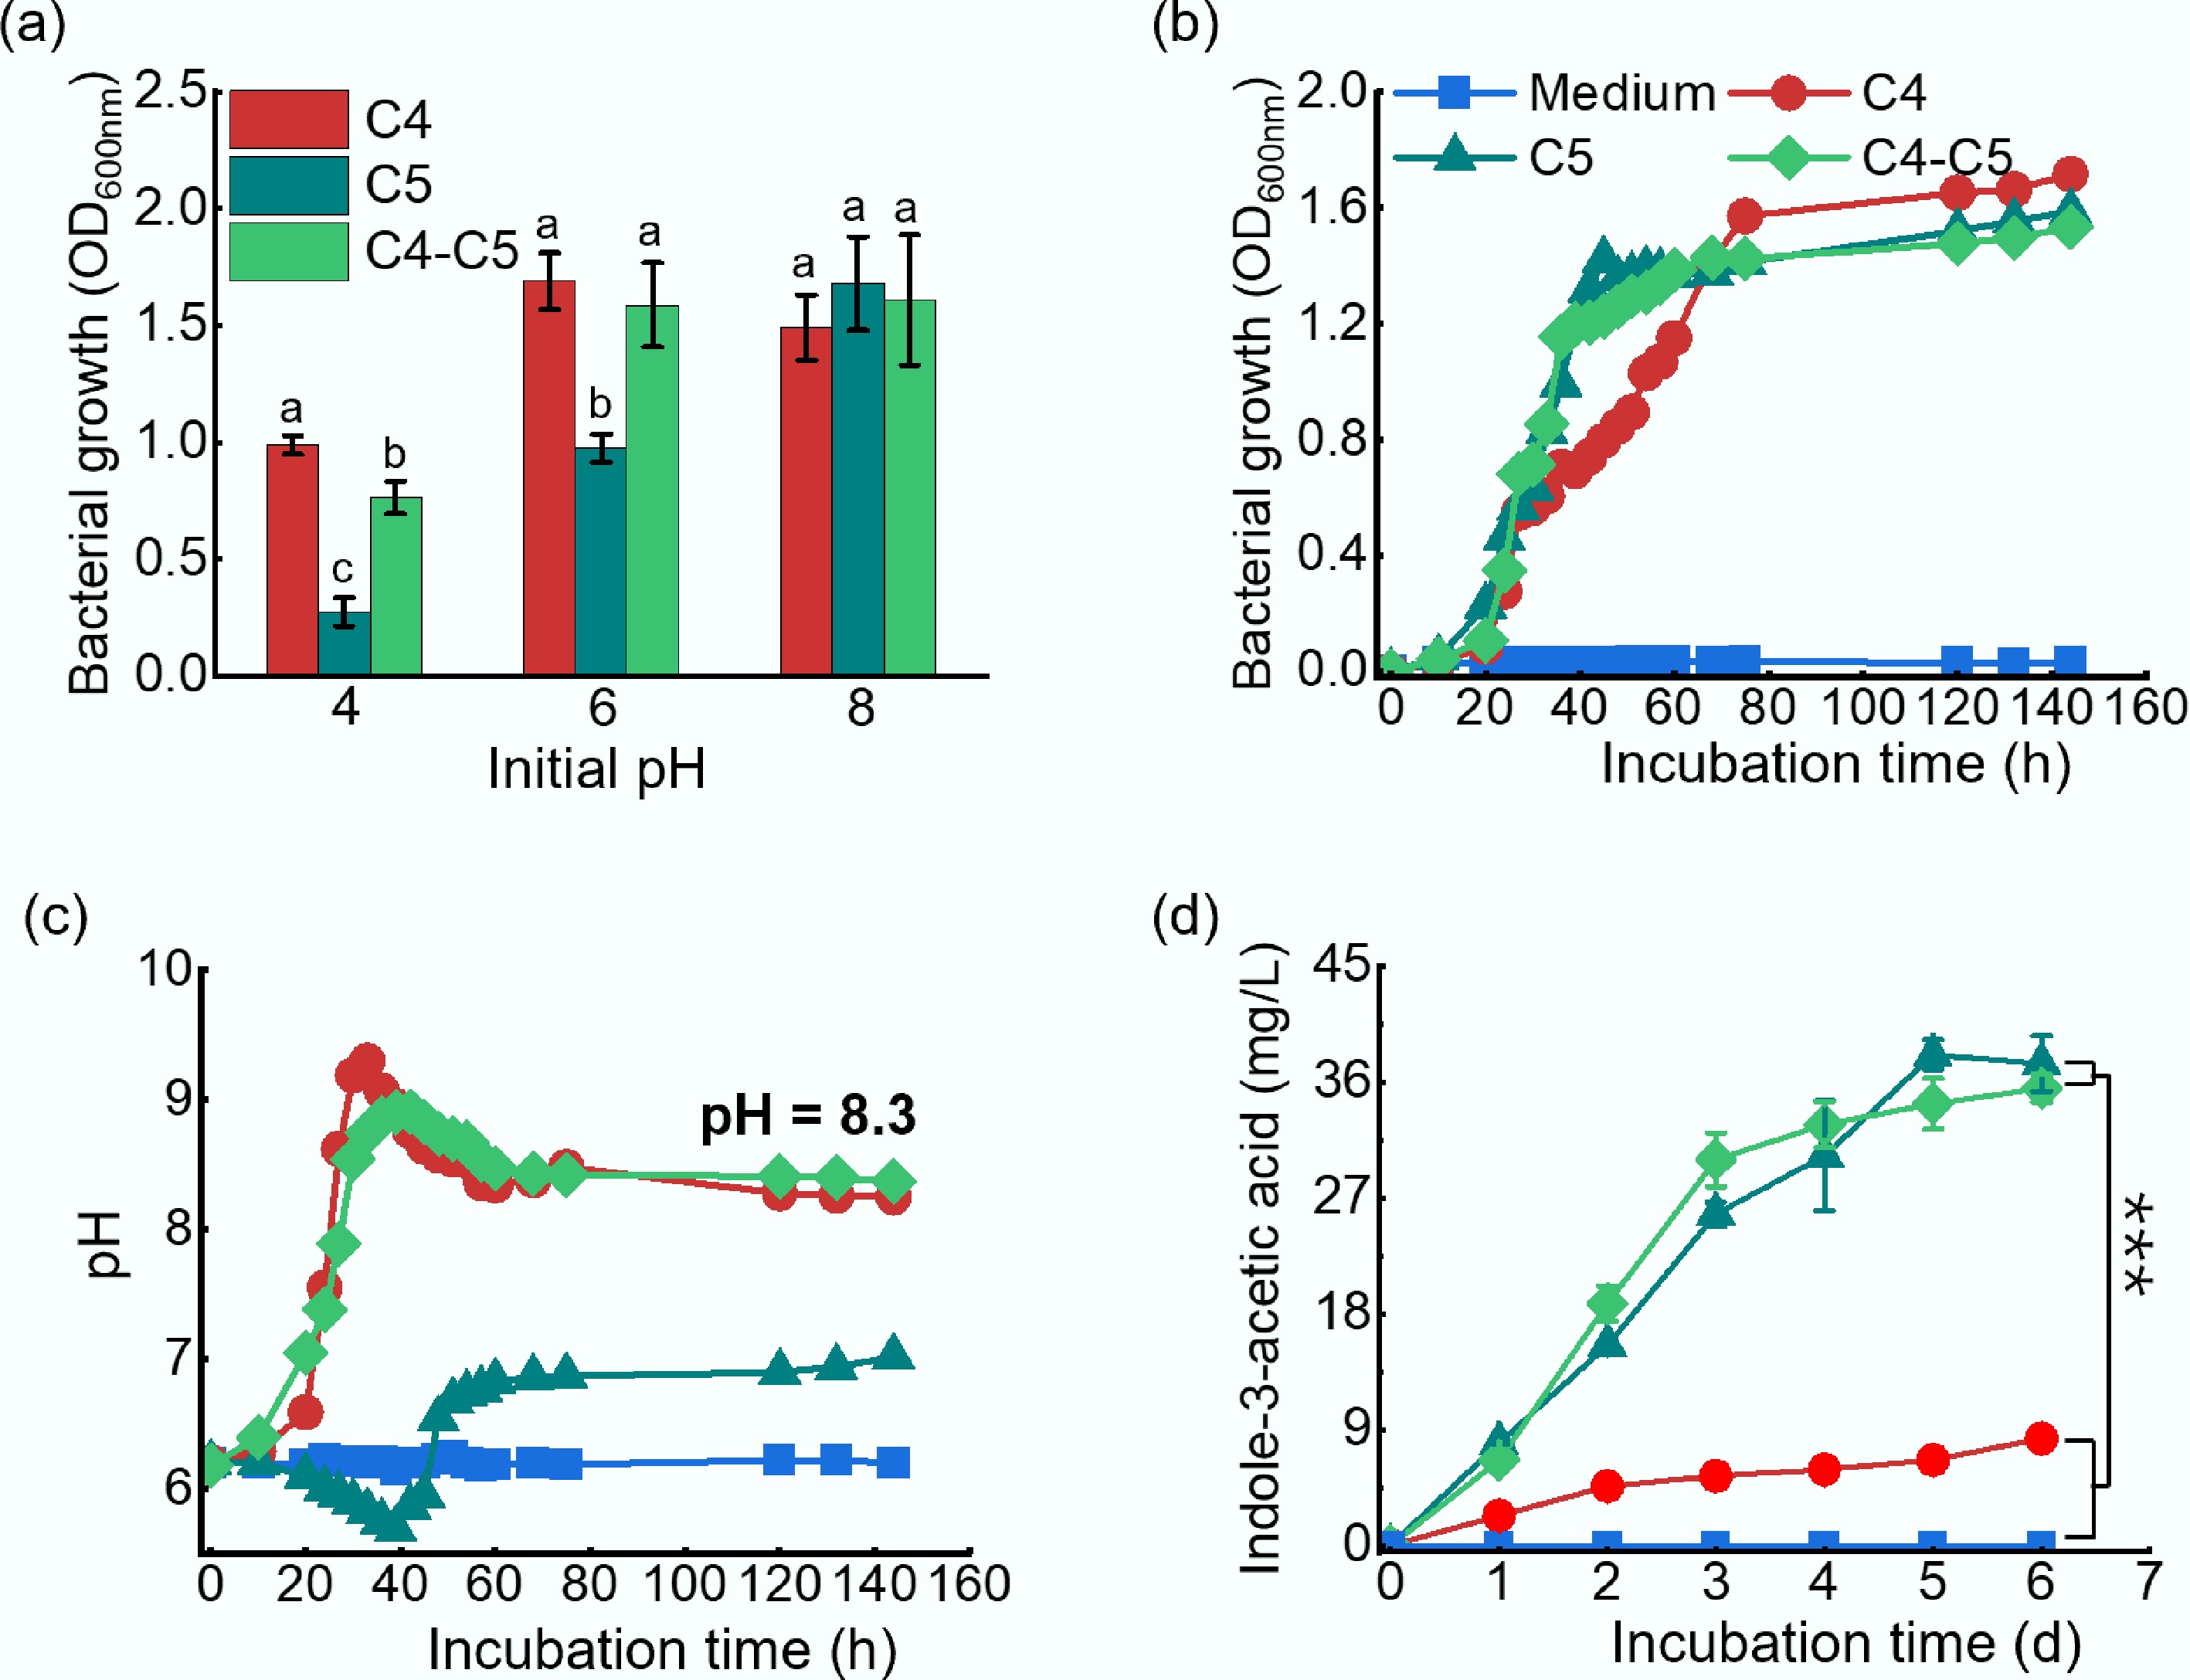
Figure 2.
Characteristics of SynComs. (a) Cell optical density (OD600) of C4, C5, and SynCom (C4-C5) cultured at different initial pH at 96 h; (b) growth curves; (c) pH; and (d) indole-3-acetic acid concentration in cultures of C4, C5, and C4-C5. Total cell number of C4-C5 was consistent with C4 or C5. Values are mean ± SD (n = 3). Lowercase letters indicate significant differences at the same pH for different treatments (p < 0.05). *** p < 0.001
-
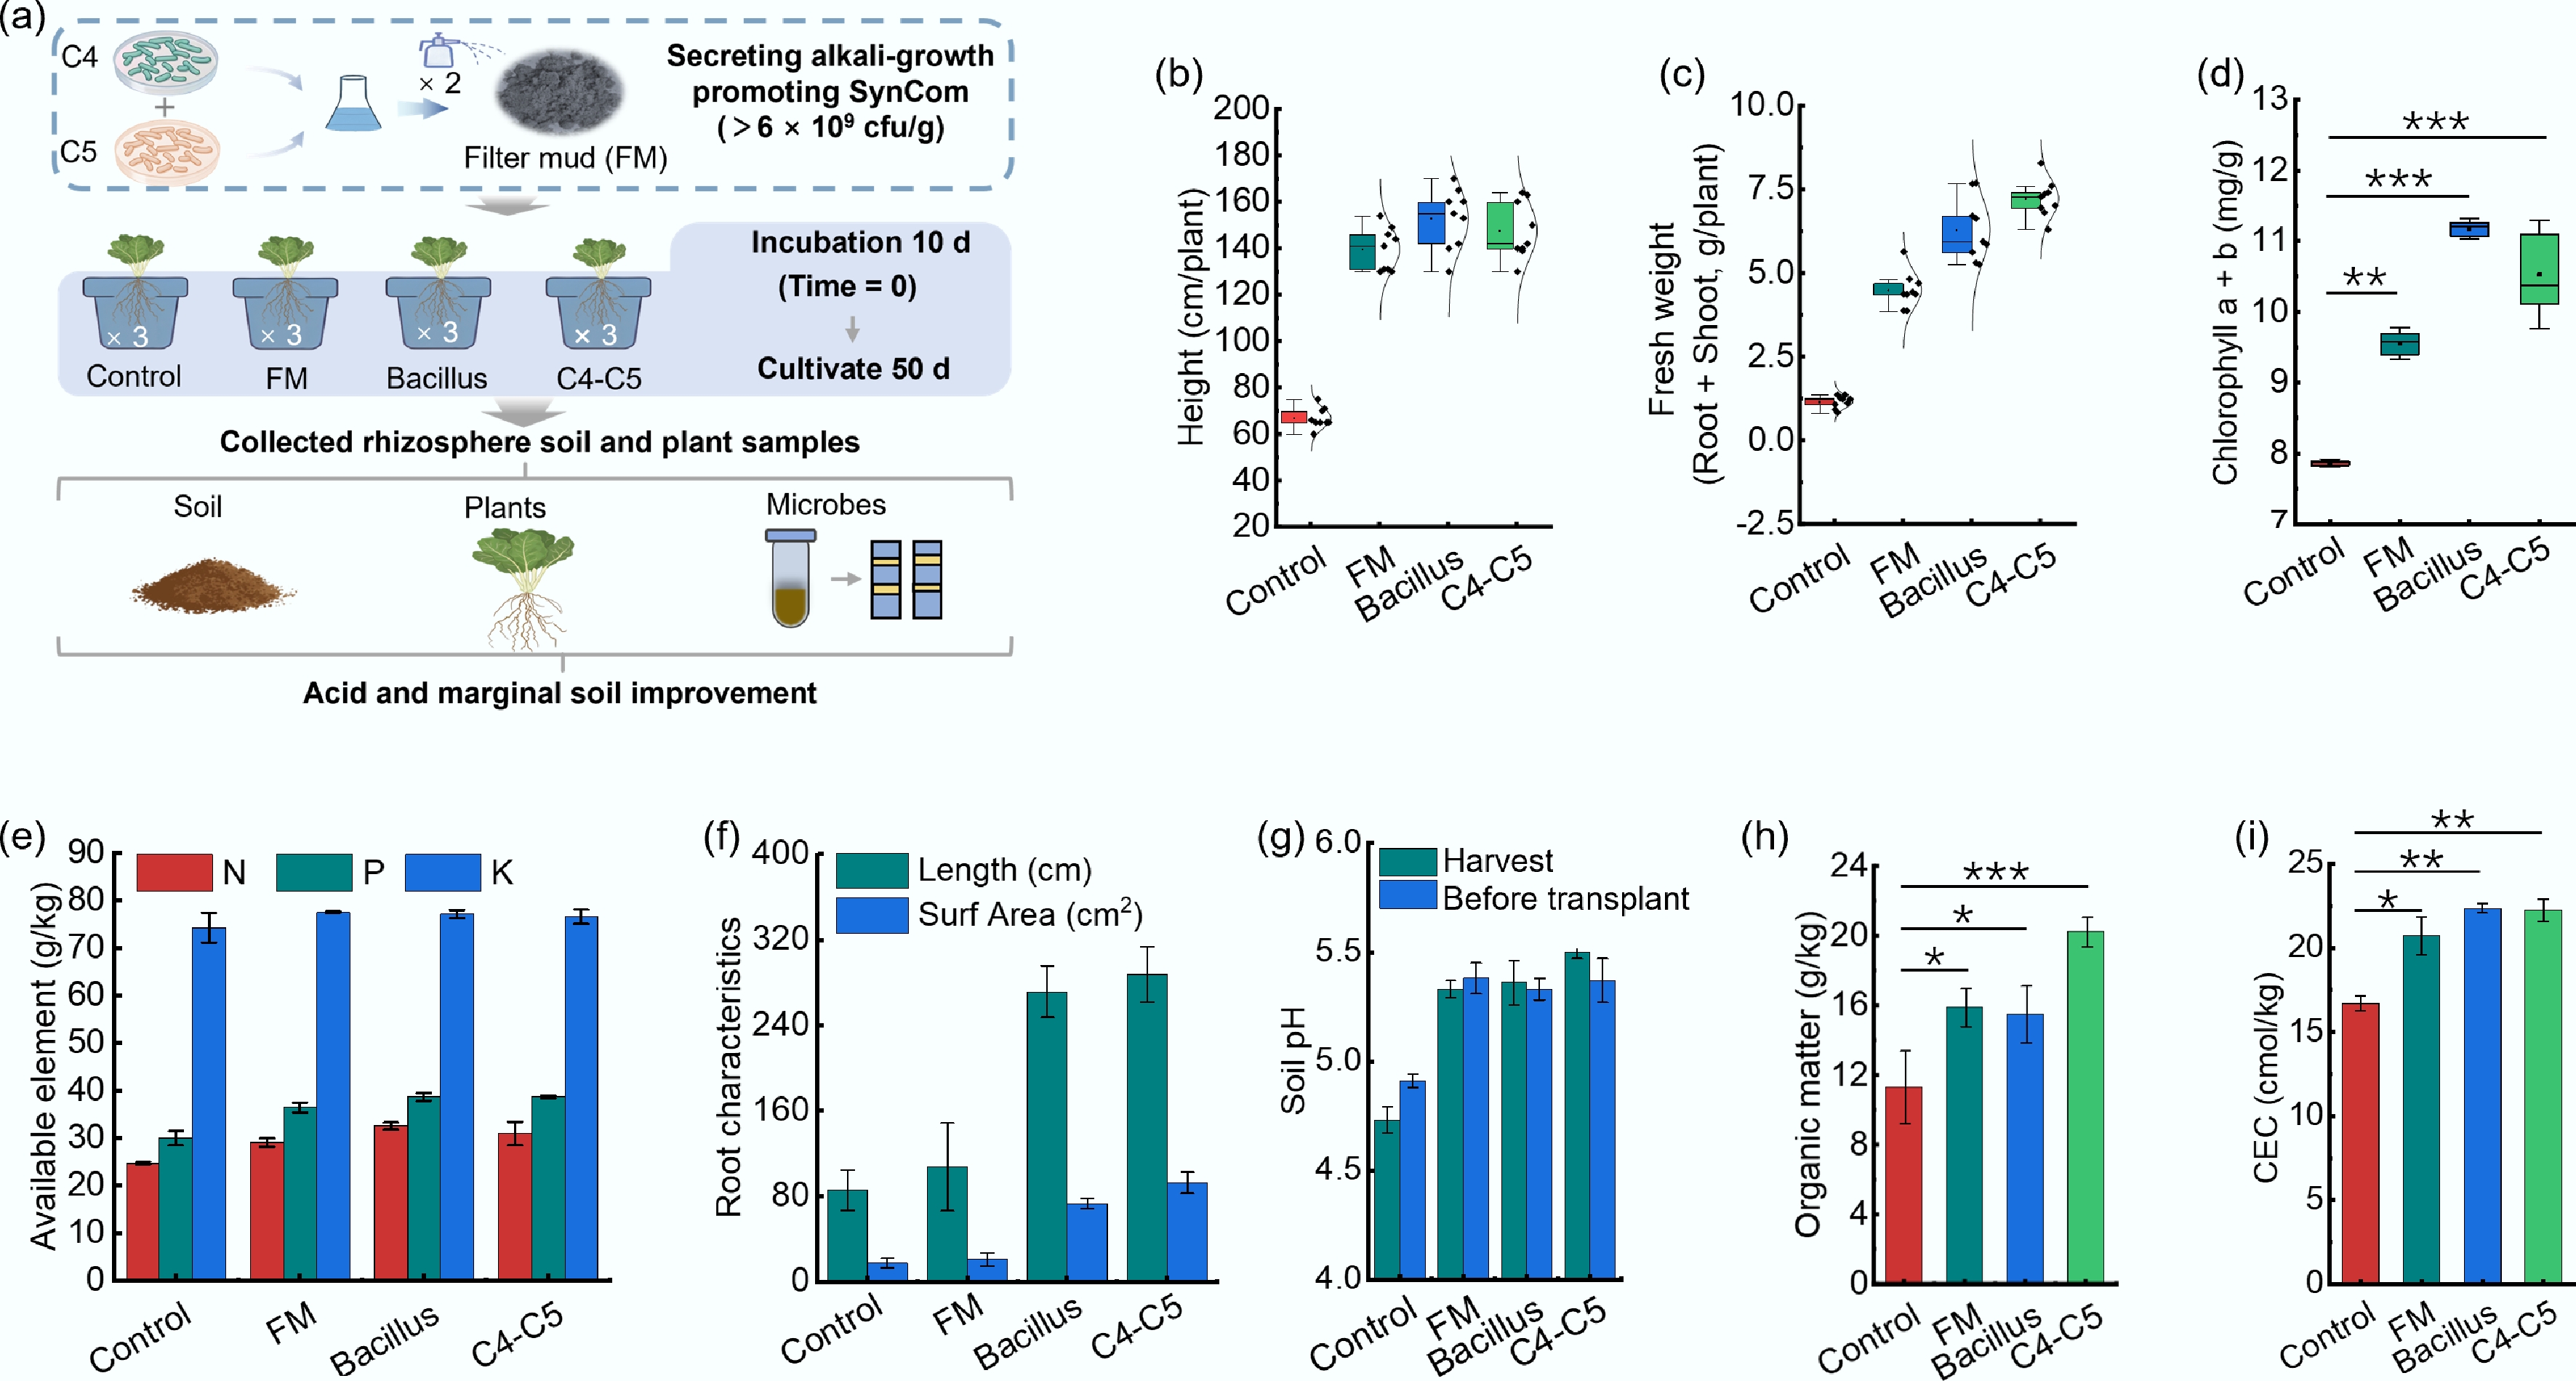
Figure 3.
Consortium improved acidic red soil and promoted plant growth. (a) Schematic of pot experimental design, methods, and objective; Lactuca Sativa L. growth characteristics of (b) height, (c) biomass, and (d) chlorophyll. (e) Rhizosphere soil available N, P, and K content; (f) root characteristics; (g) pH; (h) organic matter, and (i) CEC at harvest. Values are mean ± SD (n = 3). * p < 0.05; ** p < 0.01; *** p < 0.001.
-
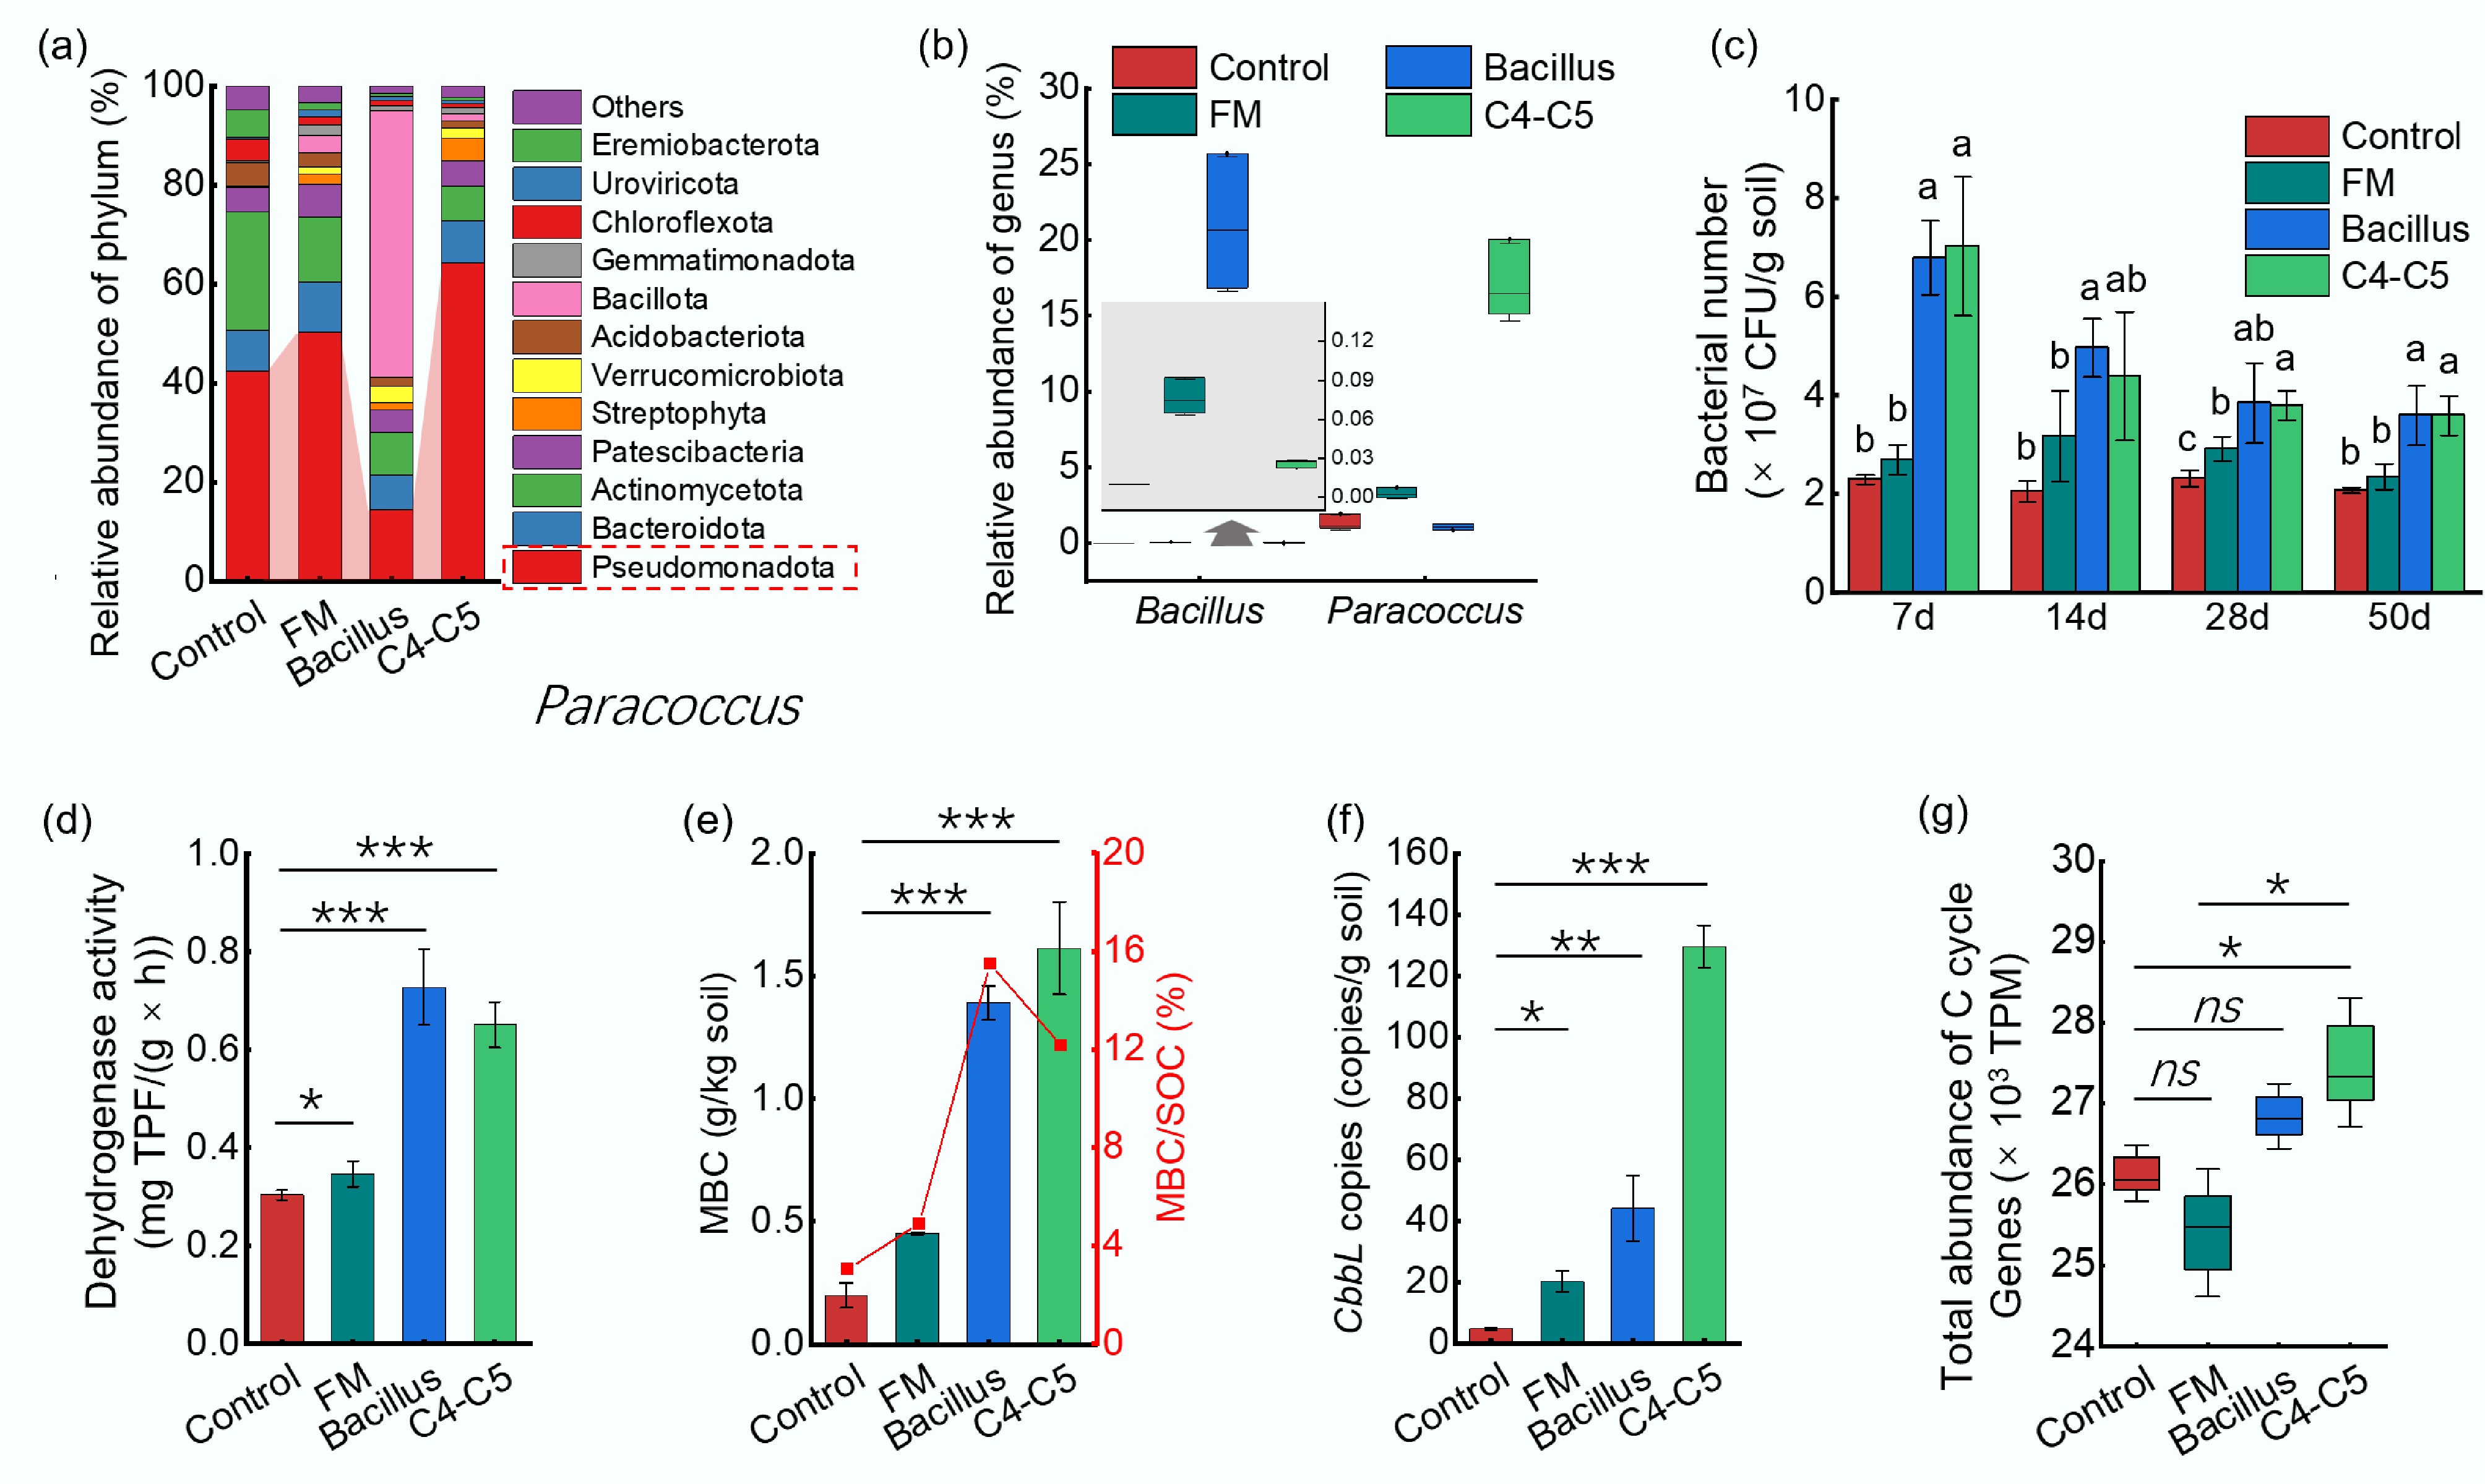
Figure 4.
(a) Diversity and abundance at the phylum level; (b) Bacillus and Paracoccus abundance; and (c) variation of bacterial numbers in rhizosphere soil. (d) Soil microbial biomass carbon (MBC); (e) dehydrogenase; (f) cbbL gene abundance; and (g) all genes involved in the C cycle. Values are mean ± SD (n = 3); lowercase letters indicate significant differences at the same time for different treatments (p < 0.05). ns, no significant difference; * p < 0.05; ** p < 0.01; *** p < 0.001.
-
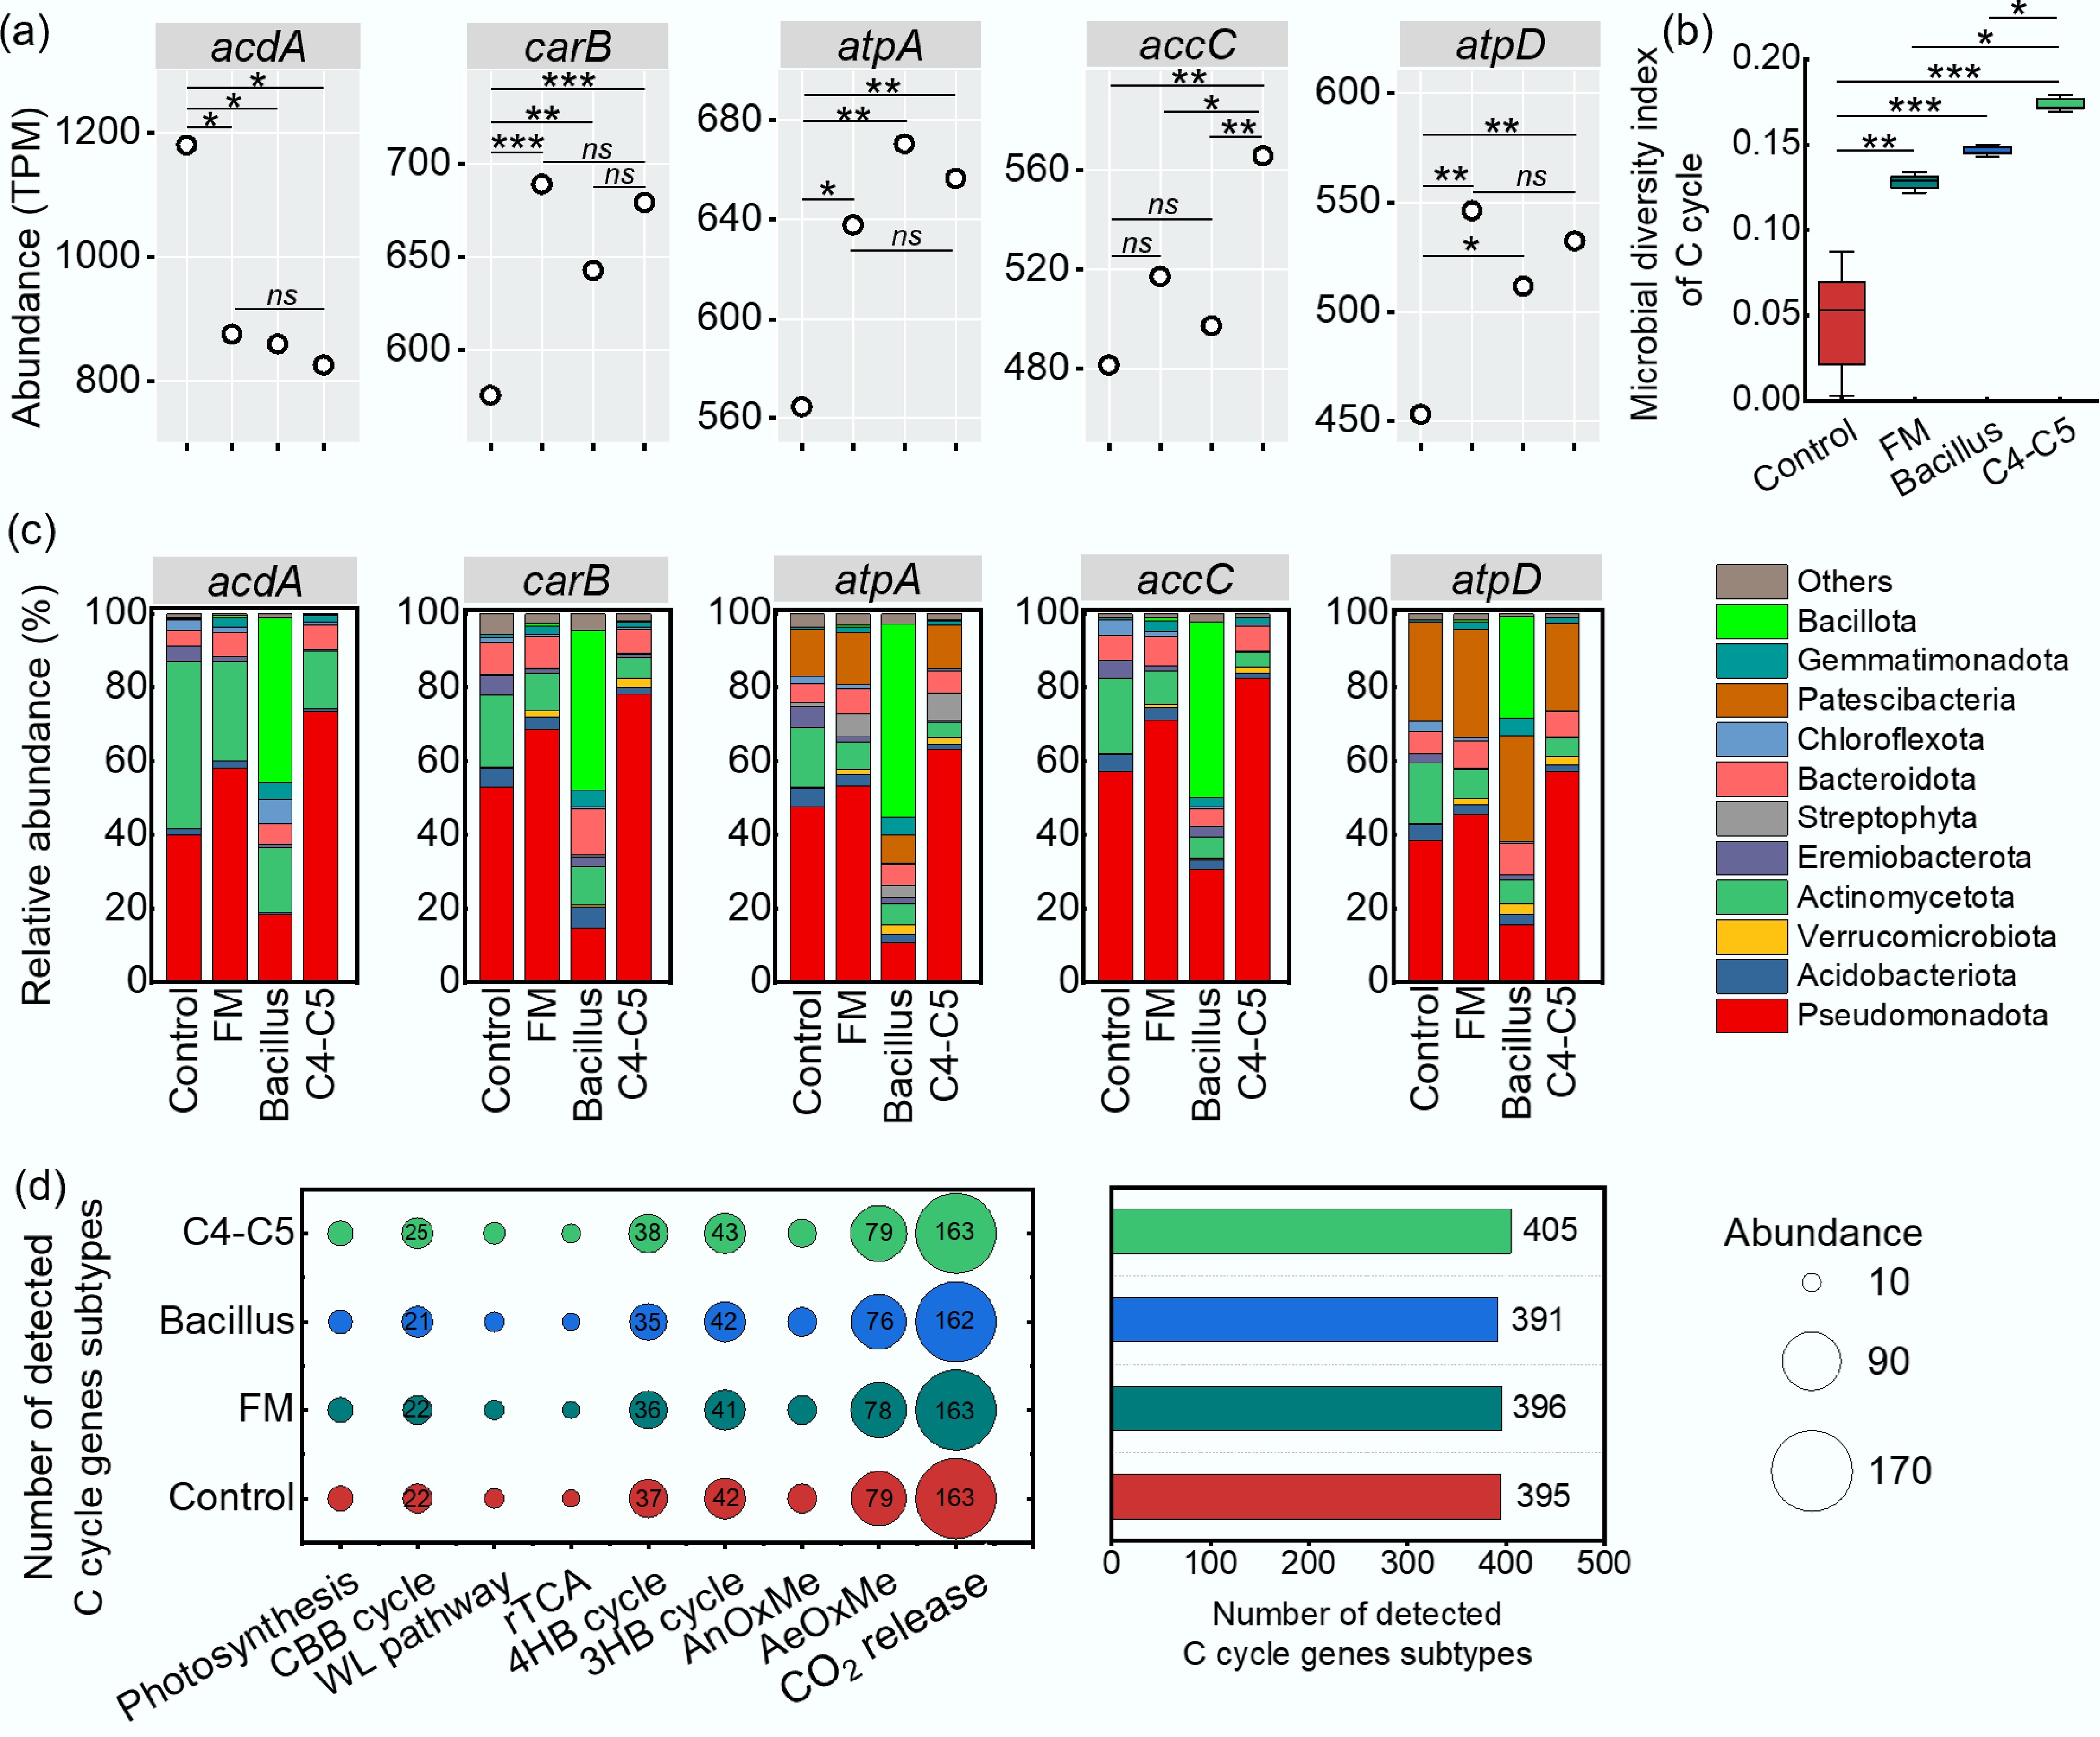
Figure 5.
Comparison of related genes, microbial species, and metabolic pathways of soil autotrophic microorganisms involved in C sequestration under different improver treatments. (a) Abundances of the top five genes involved in C cycling, and (b) their corresponding species. (c) Bubble maps depicting the number of genes involved in C cycling across various soil microorganisms. Based on the known C sequestration pathways, the modules involved in the C cycle are as follows: photosynthesis, CBB cycle, WL pathway, rTCA, 4HB cycle, 3HB cycle, AnOxMe, AeOxMe, and CO2 release. ns, no significant difference; * p < 0.05; ** p < 0.01; *** p < 0.001.
-
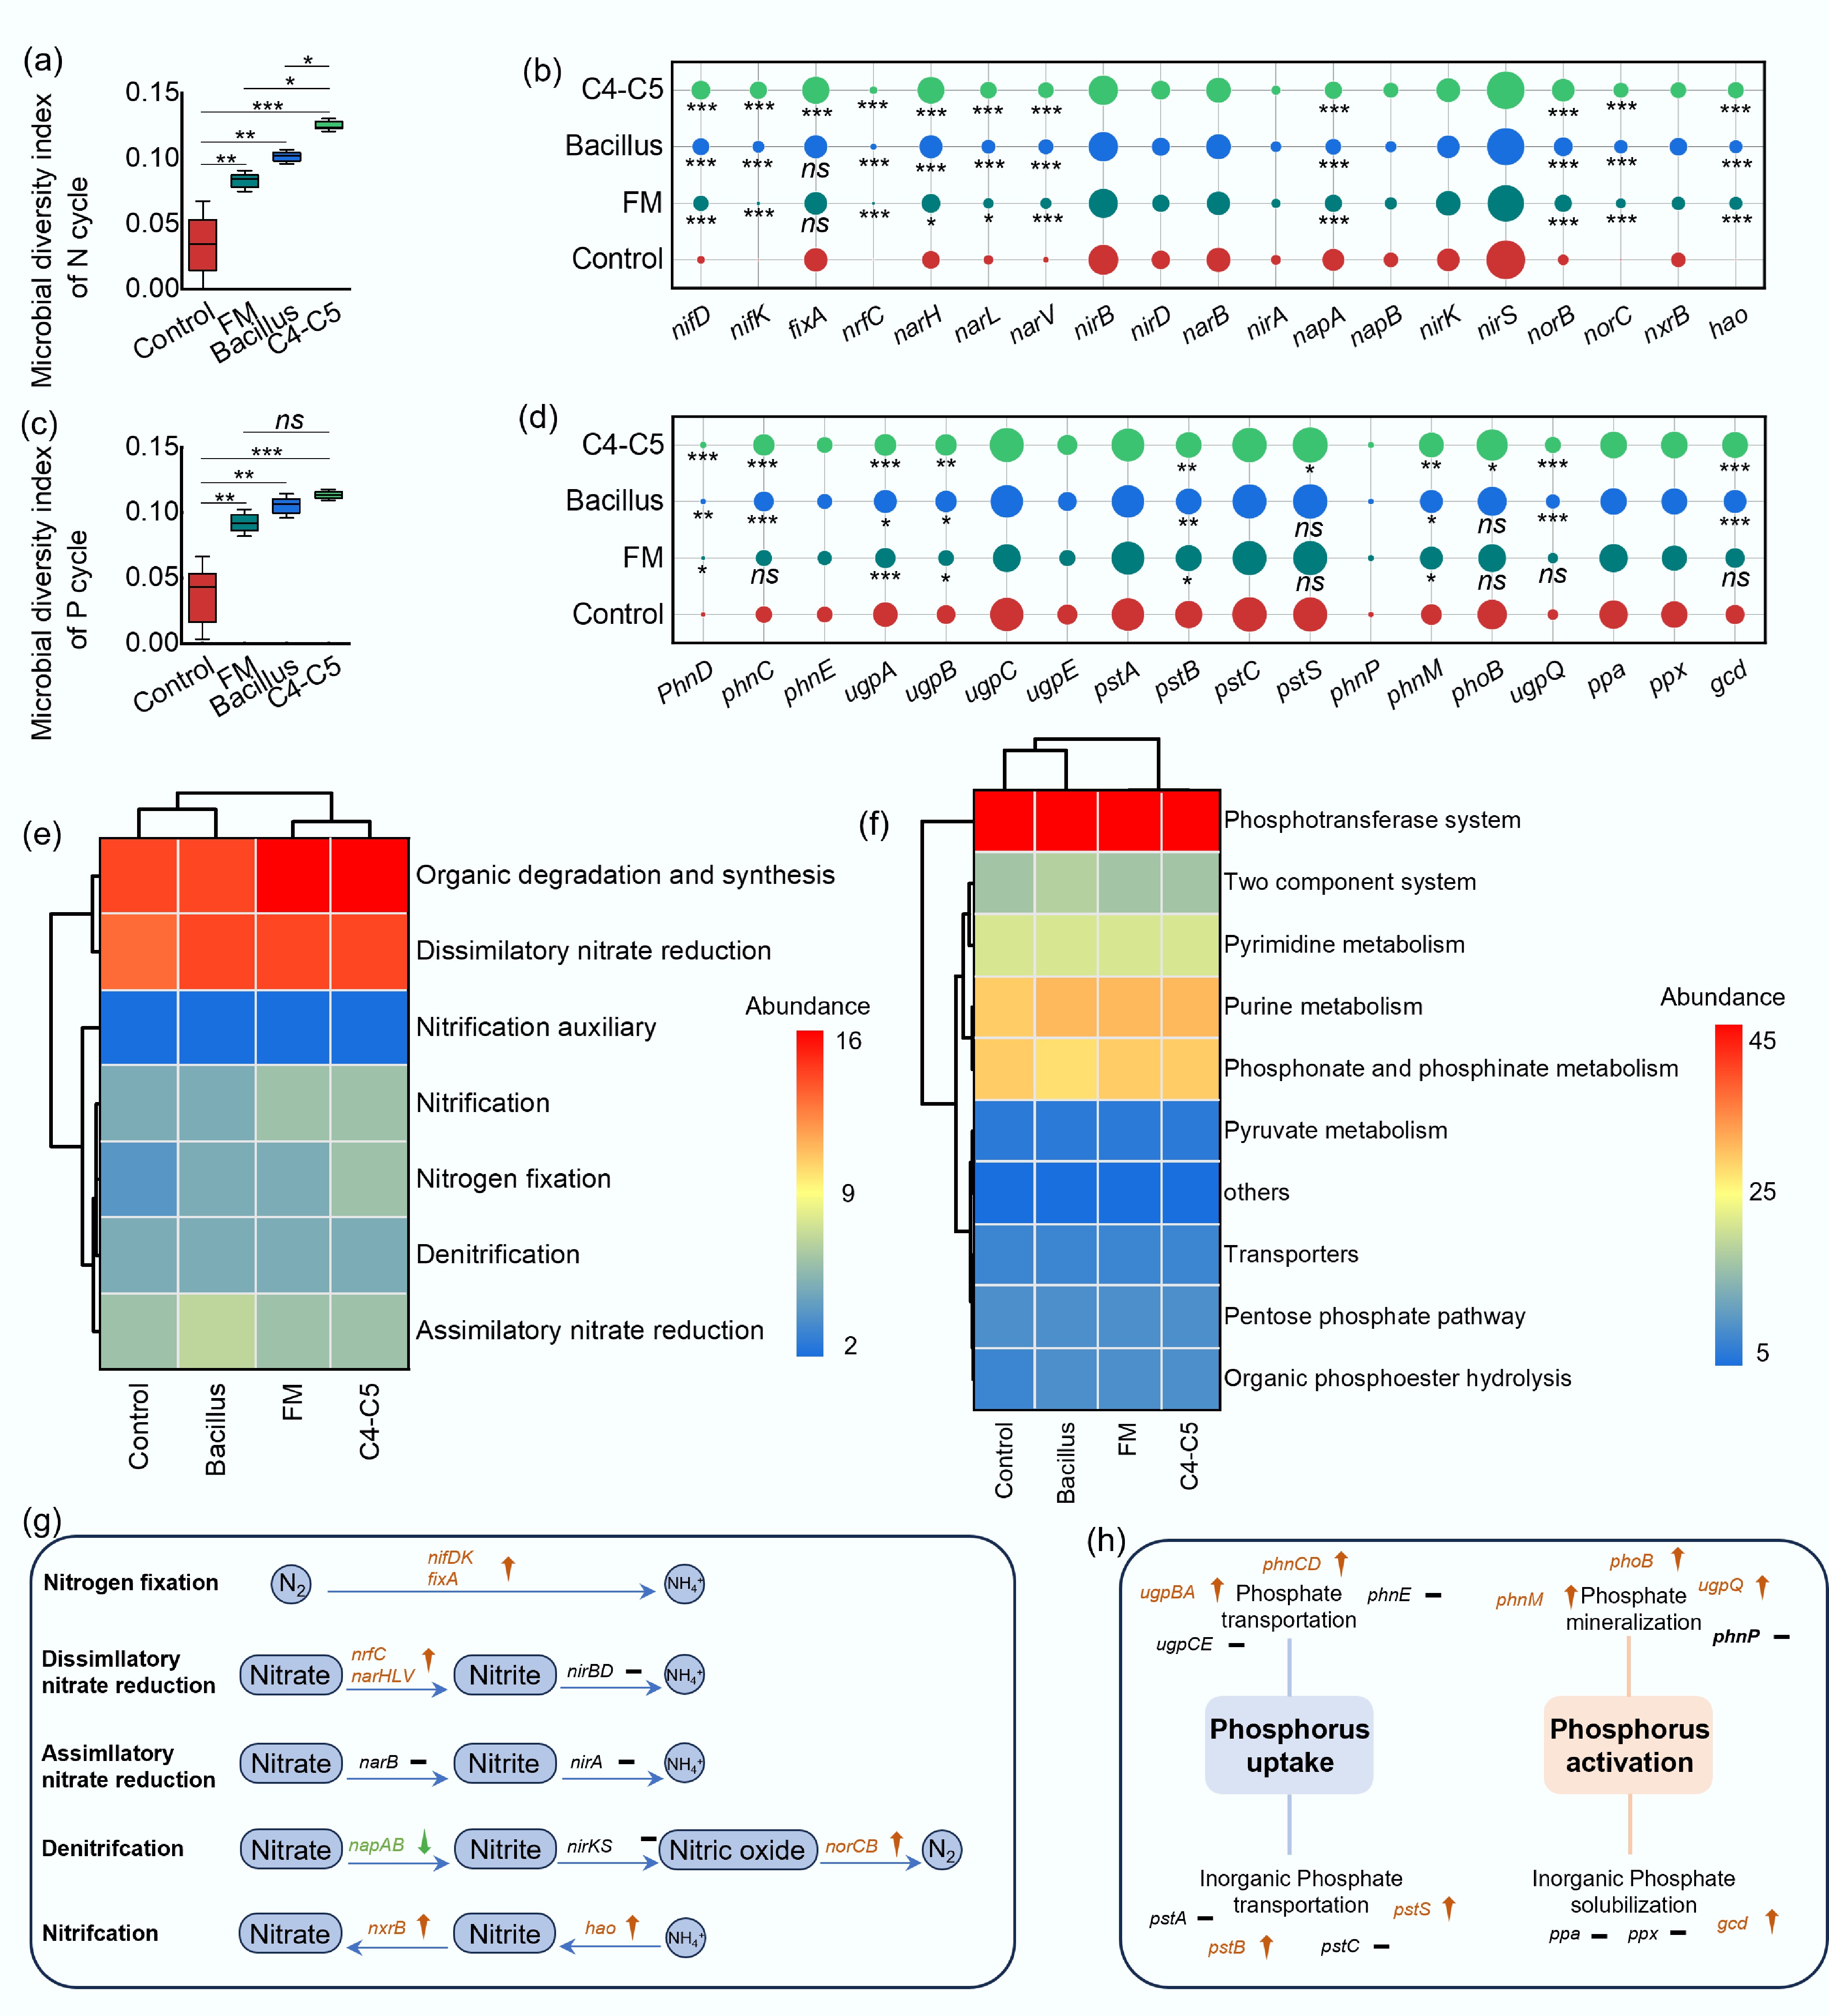
Figure 6.
Microbial agents modulate genes related to P and N cycles. Microbial diversity indices of (a) N-cycling and (c) P-cycling genes. Bubble plots of (b) N-cycling and (d) P-cycling genes in rhizospheric soil; significant differences were determined in amendment treatment compared with the control. Hot maps of (e) N-cycling and (f) P-cycling metabolic pathways. Microbial agents alter the genes and metabolic pathways of (g) N-cycling and (h) P-cycling. Values are mean ± SD (n = 3). ns, no significant difference; * p < 0.05; ** p < 0.01; *** p < 0.001.
-
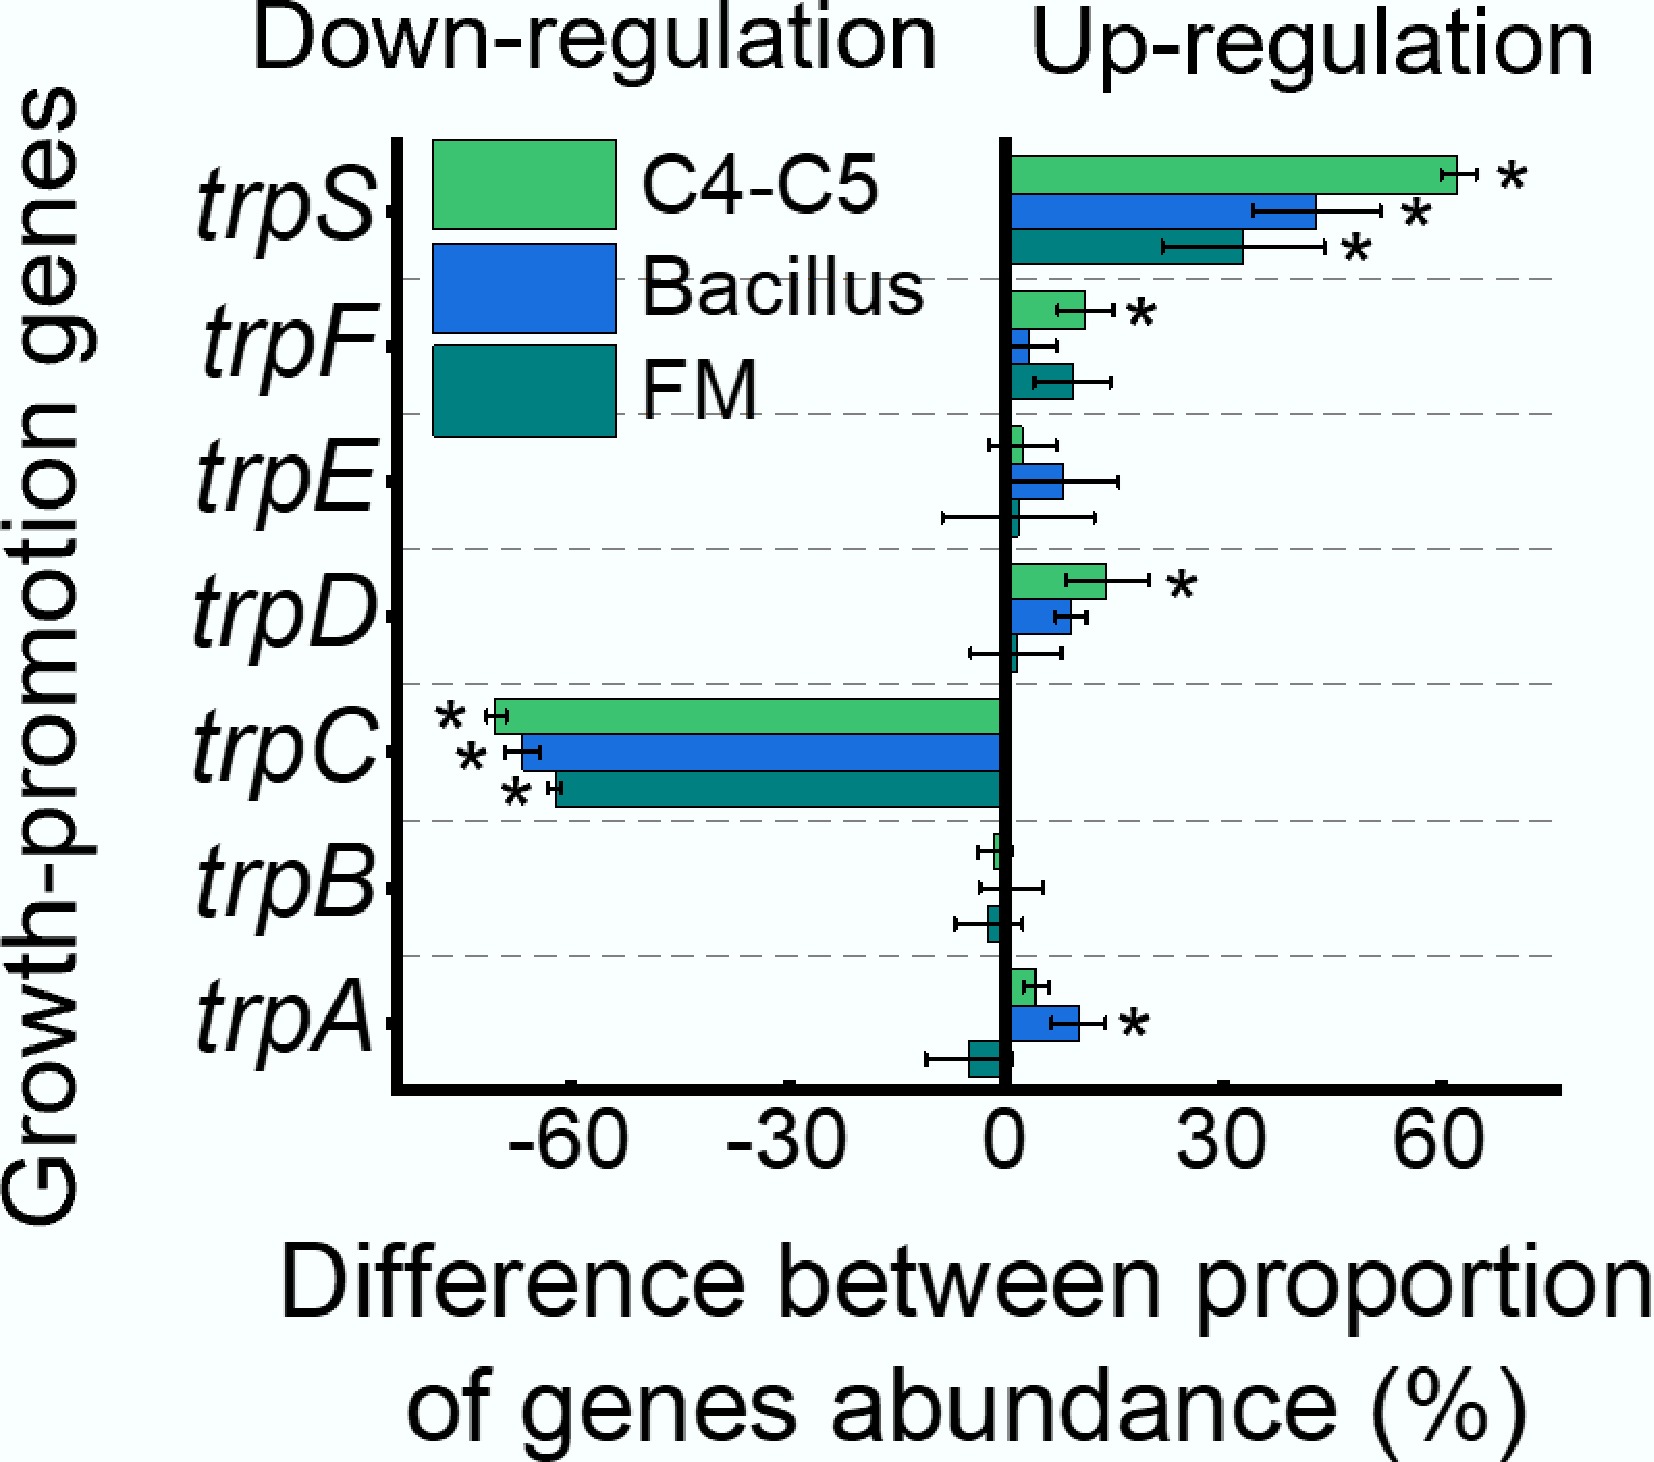
Figure 7.
Proportion of upregulated or downregulated genes associated with growth promotion in FM, Bacillus, and C4-C5 treatments compared to the control. An abundance ratio > 0 indicates gene upregulation, and < 0 indicates gene downregulation. Values are mean ± SD (n = 3). * p < 0.05; ** p < 0.01; *** p < 0.001.
-
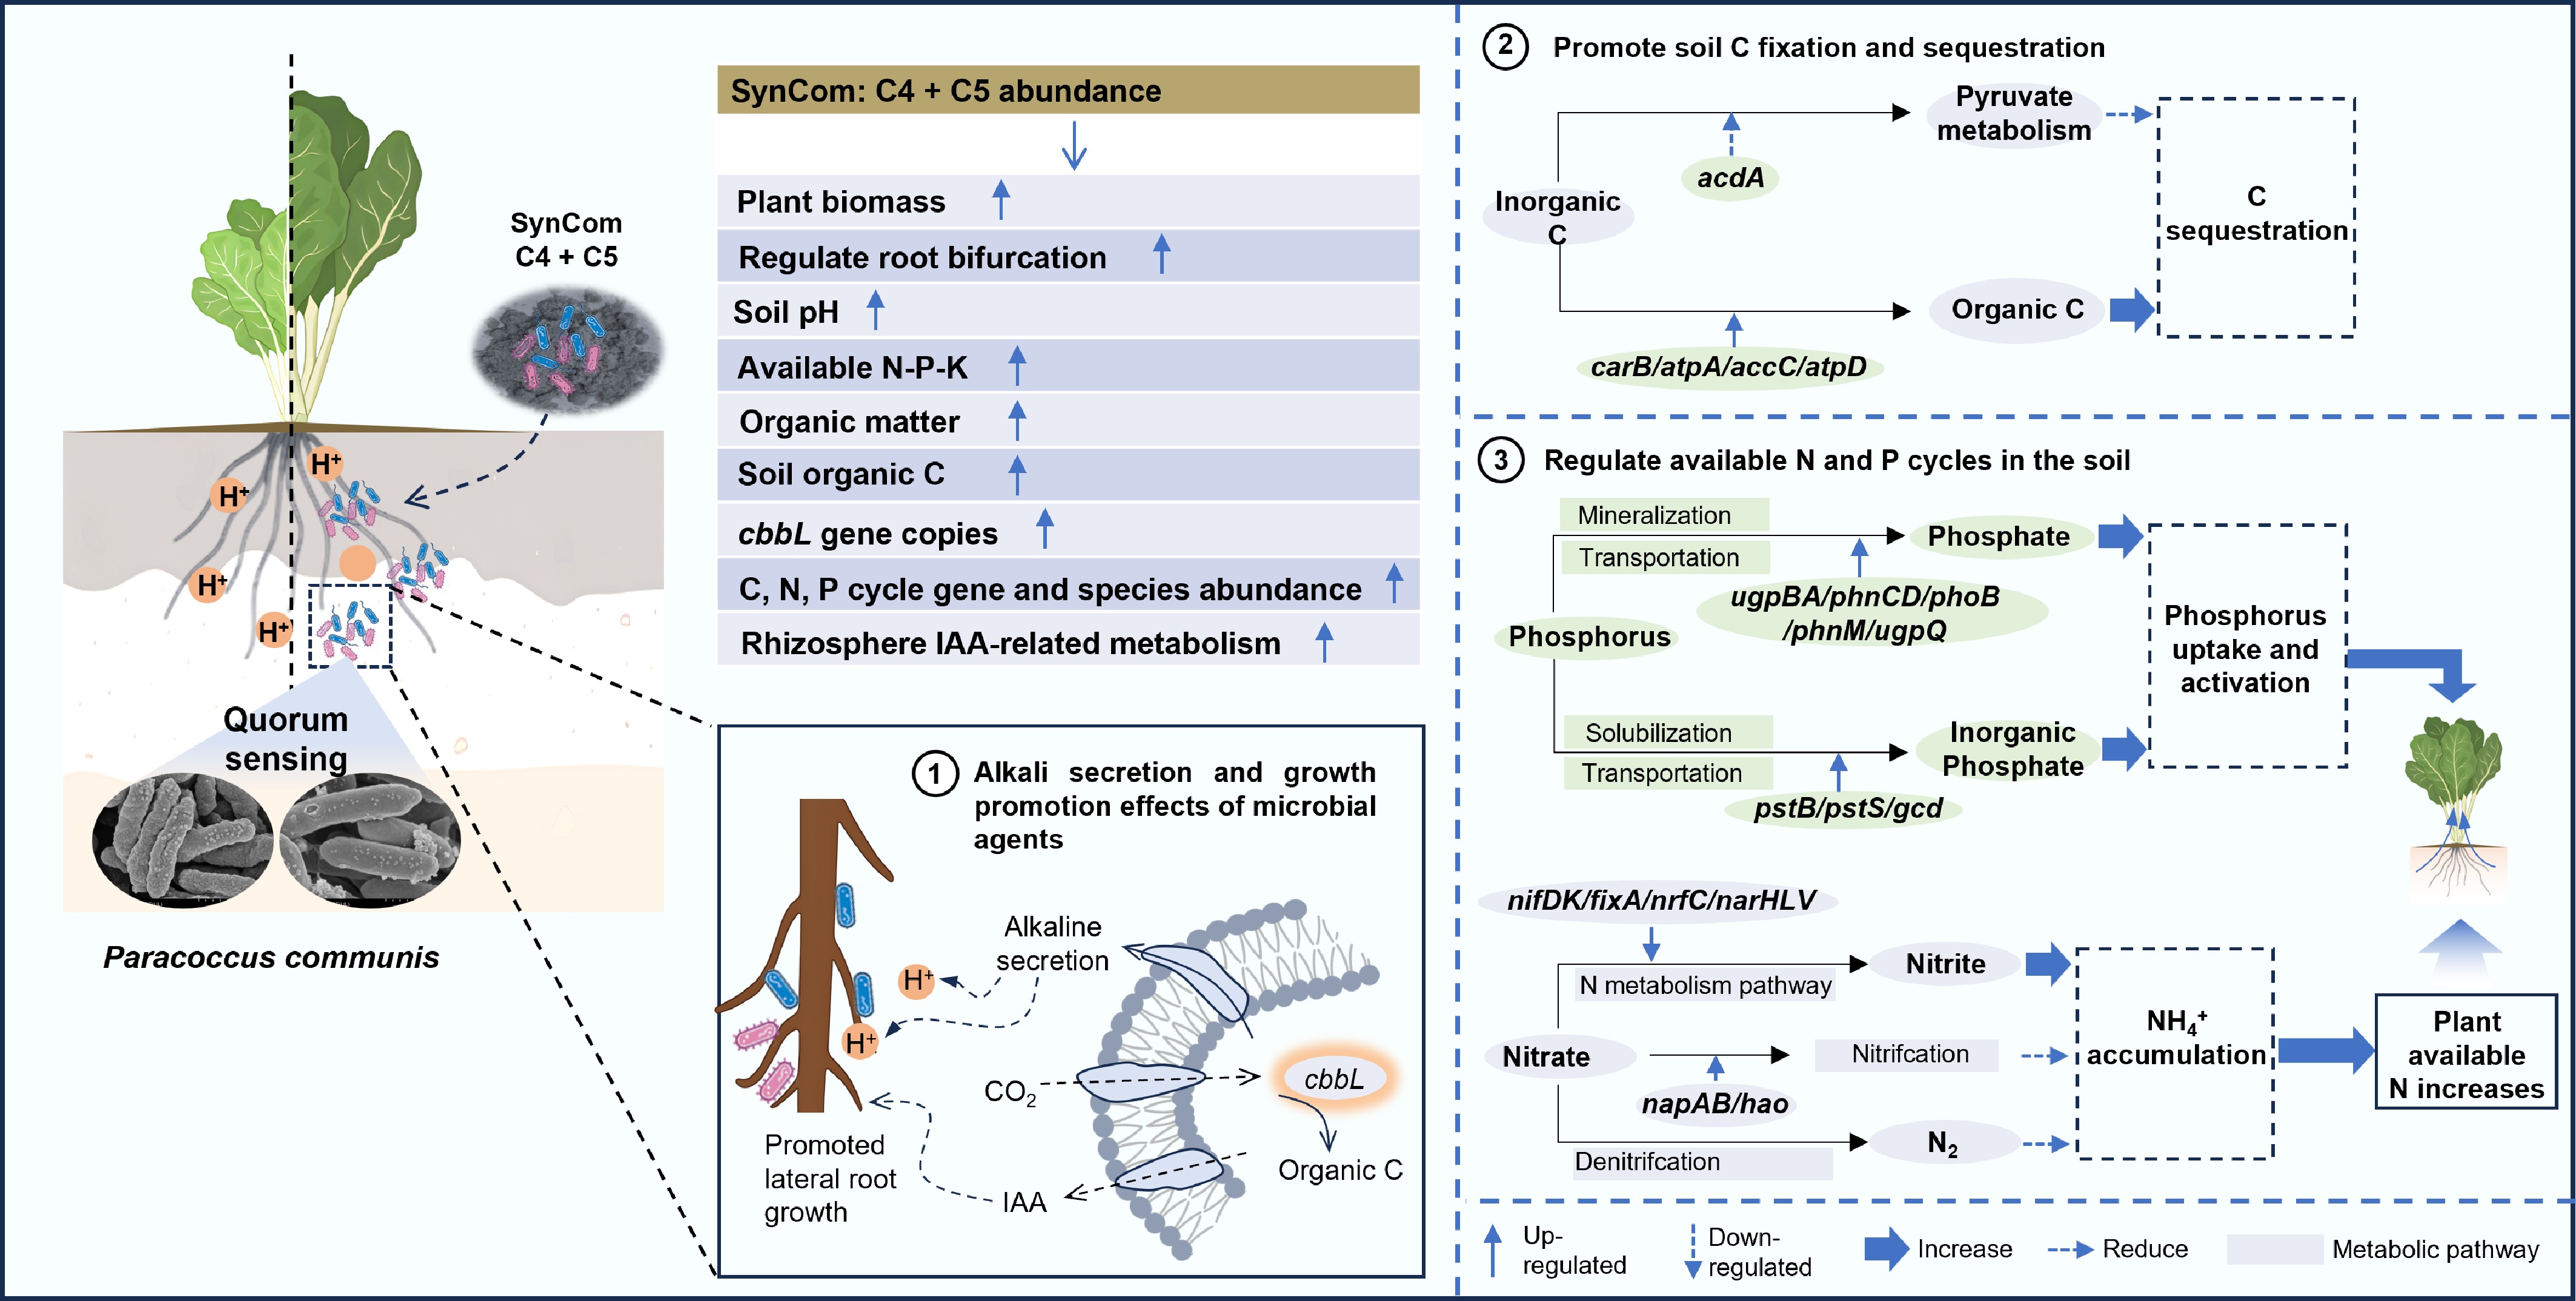
Figure 8.
Schematic diagram summarizing the mechanism of acidic soil quality improvement and elemental cycling enhancement by using microbial agents.
Figures
(8)
Tables
(0)