-
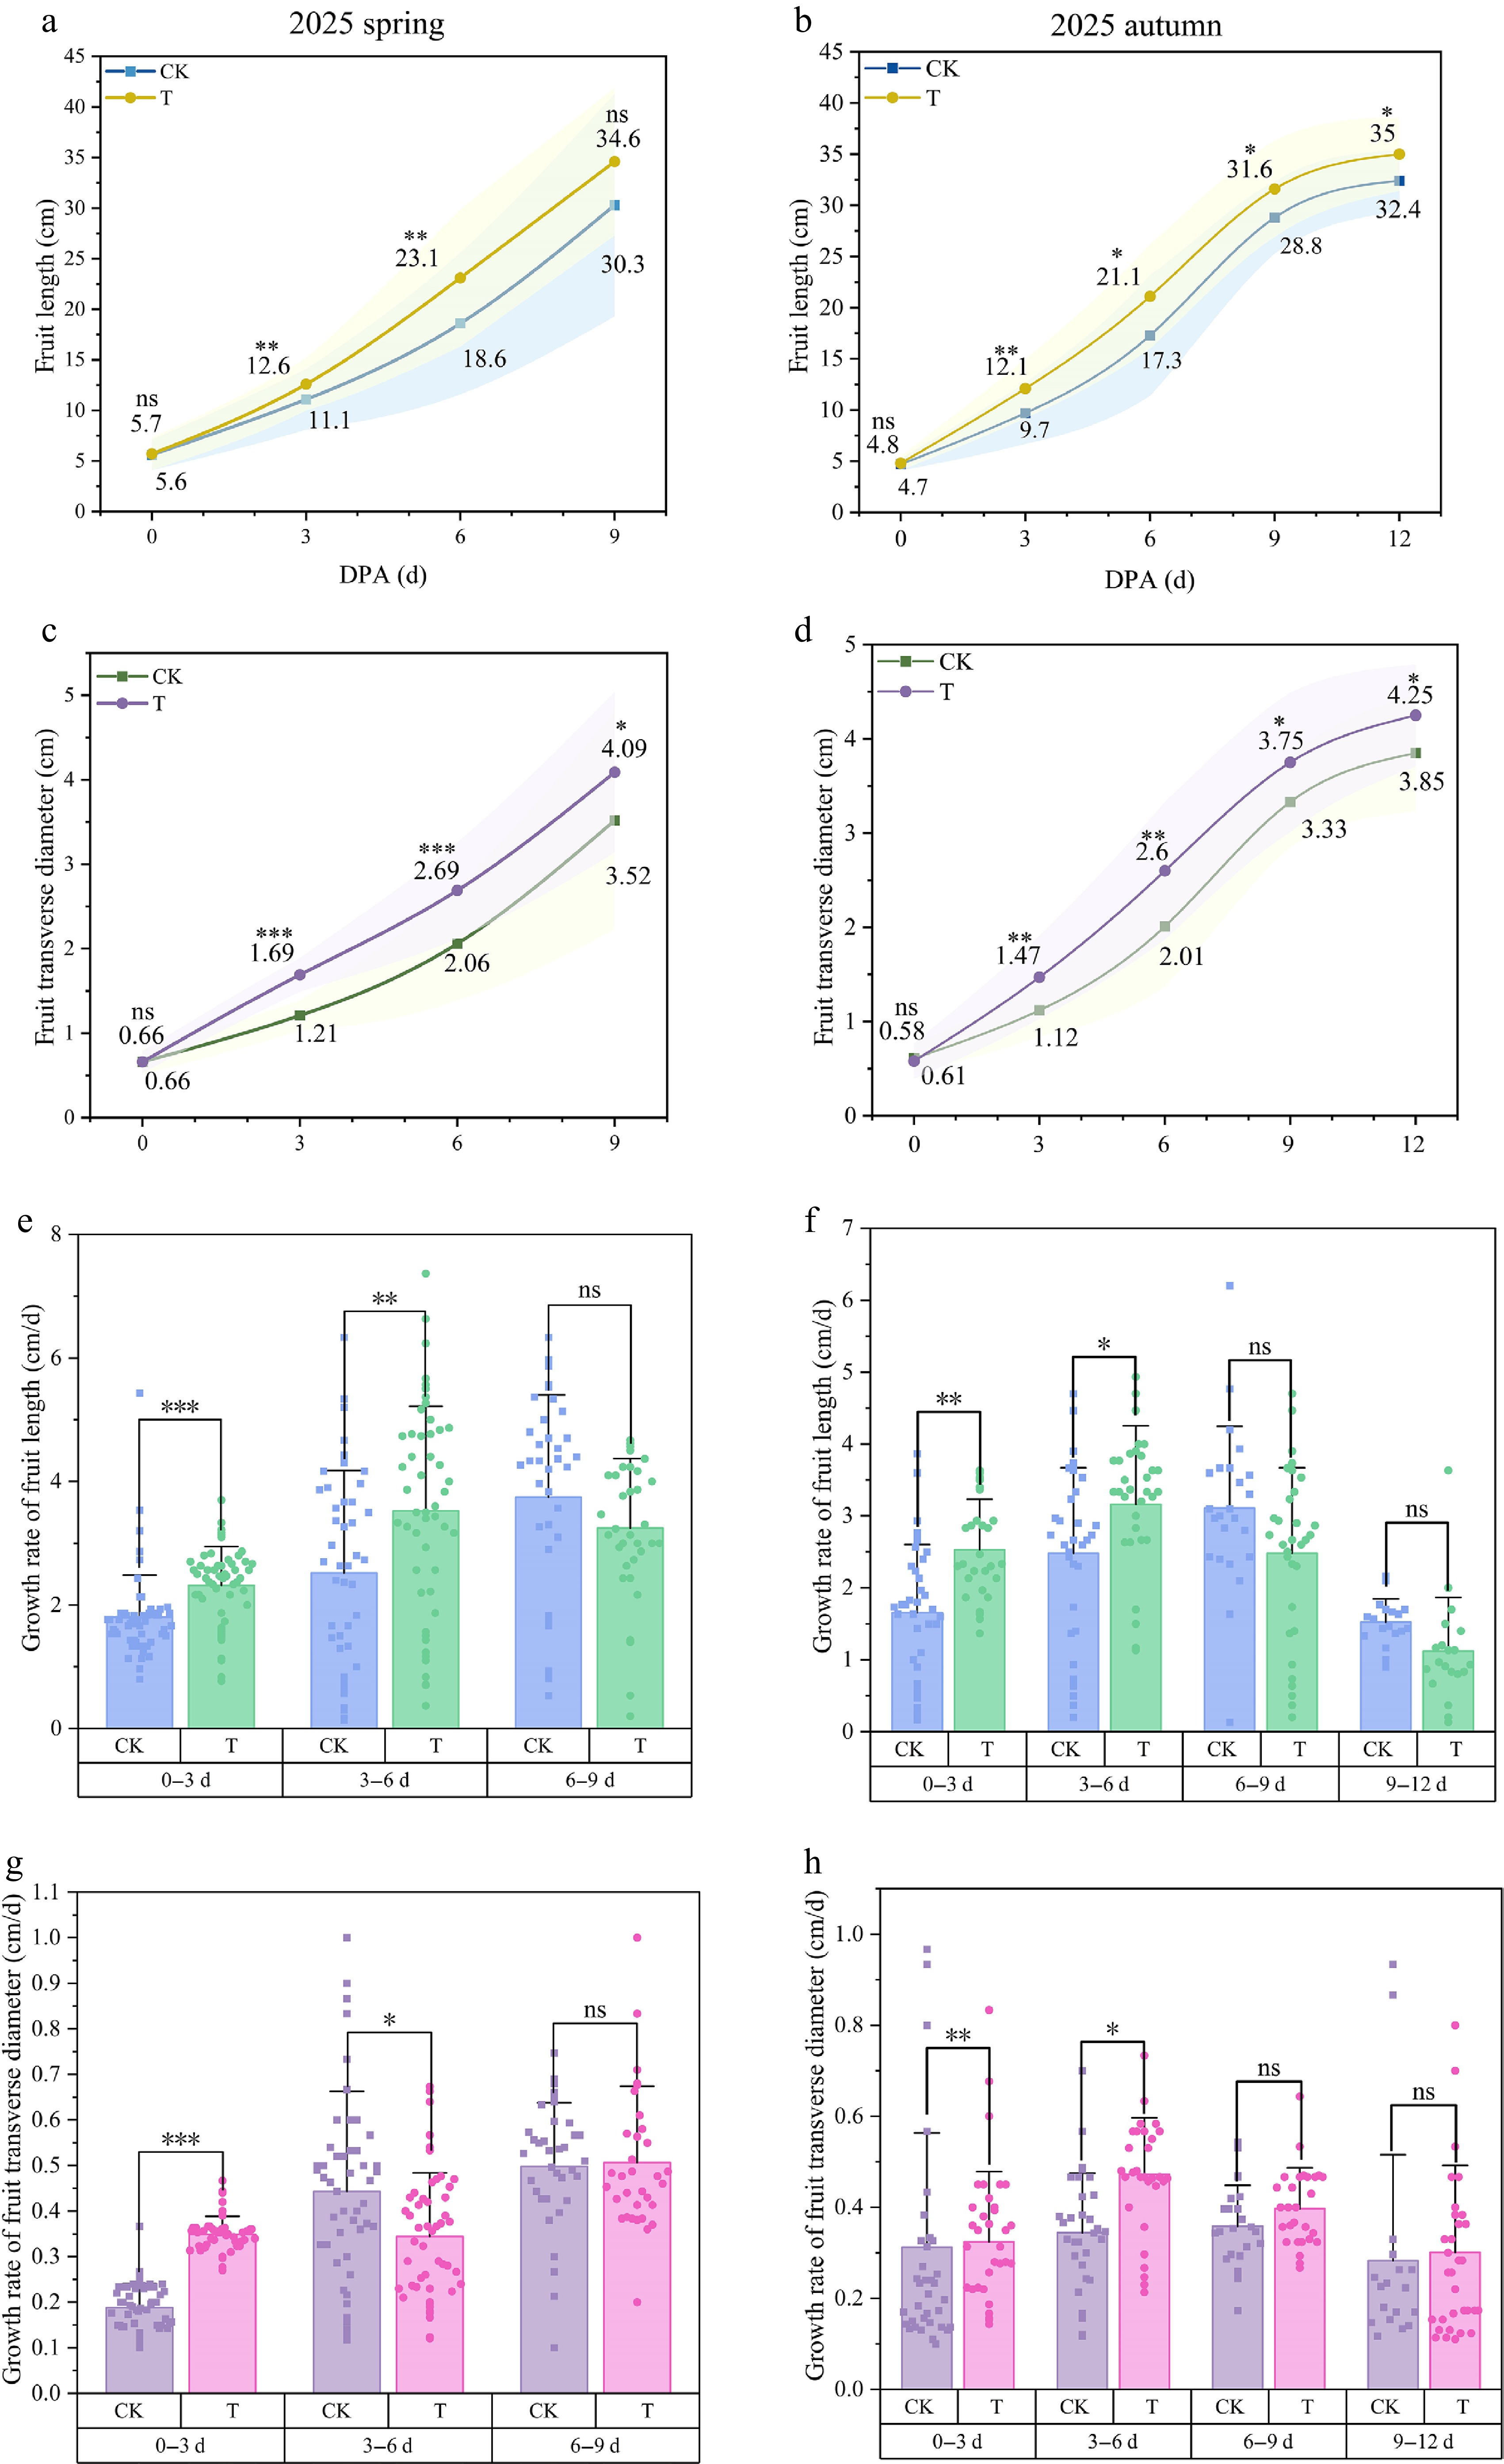
Figure 1.
Results of investigating cucumber phenotypes.
-
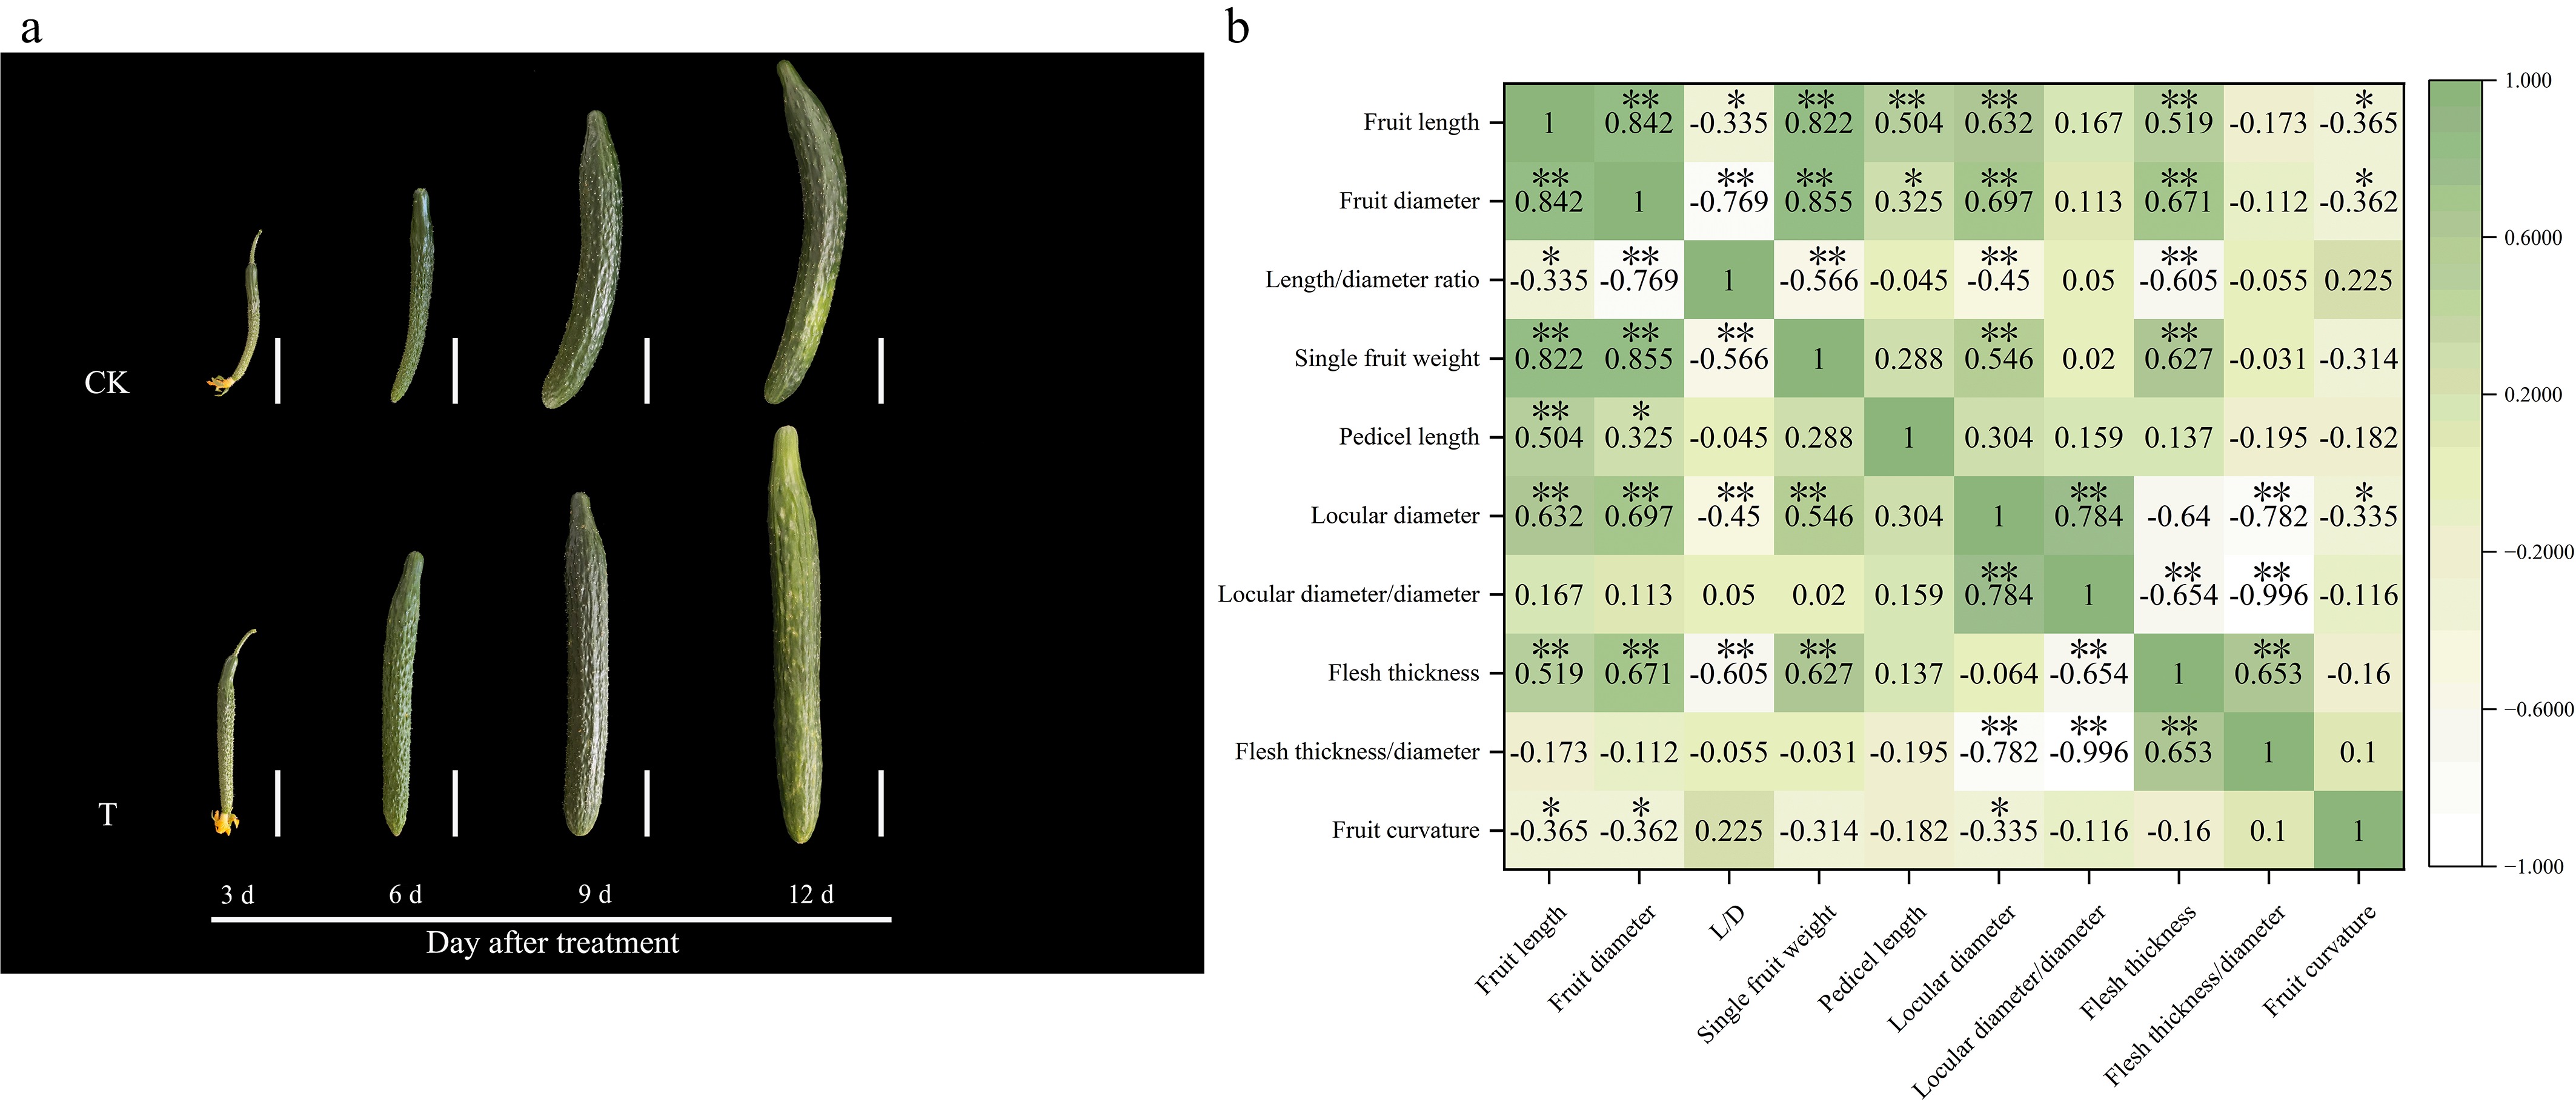
Figure 2.
Commercial quality of cucumber fruit.
-
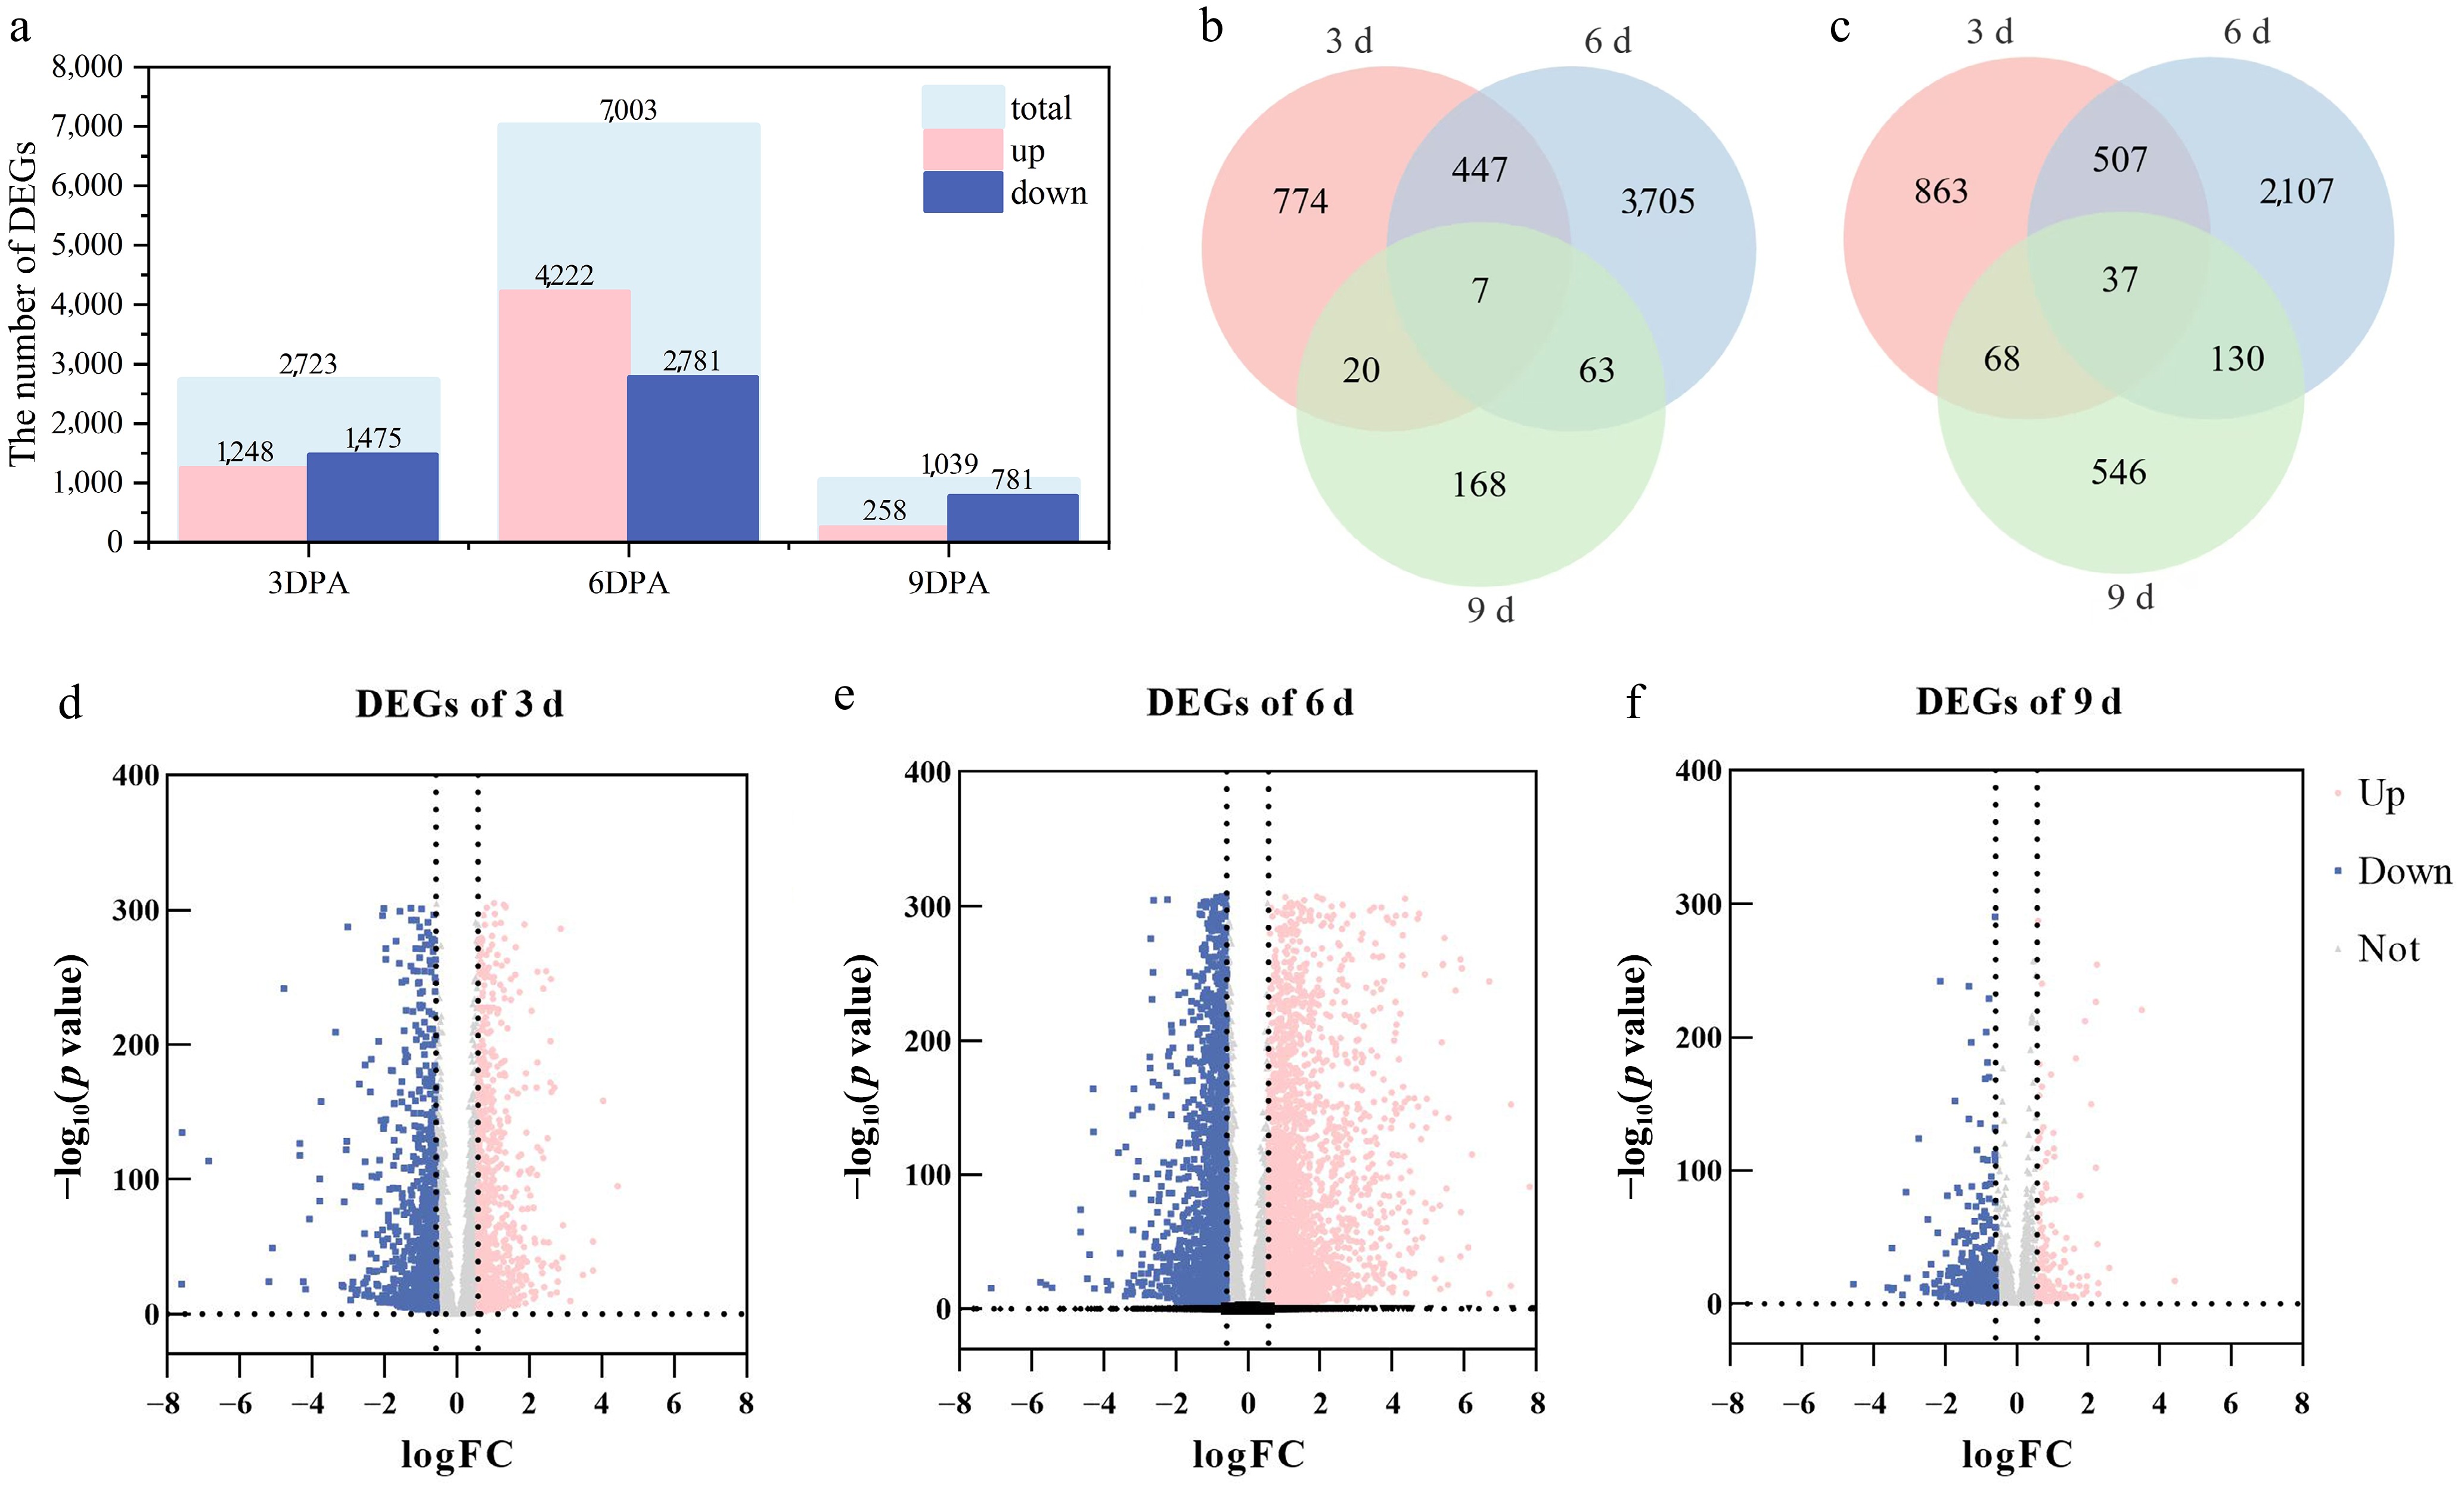
Figure 3.
Results of the differential gene expression analysis of the transcriptome data.
-
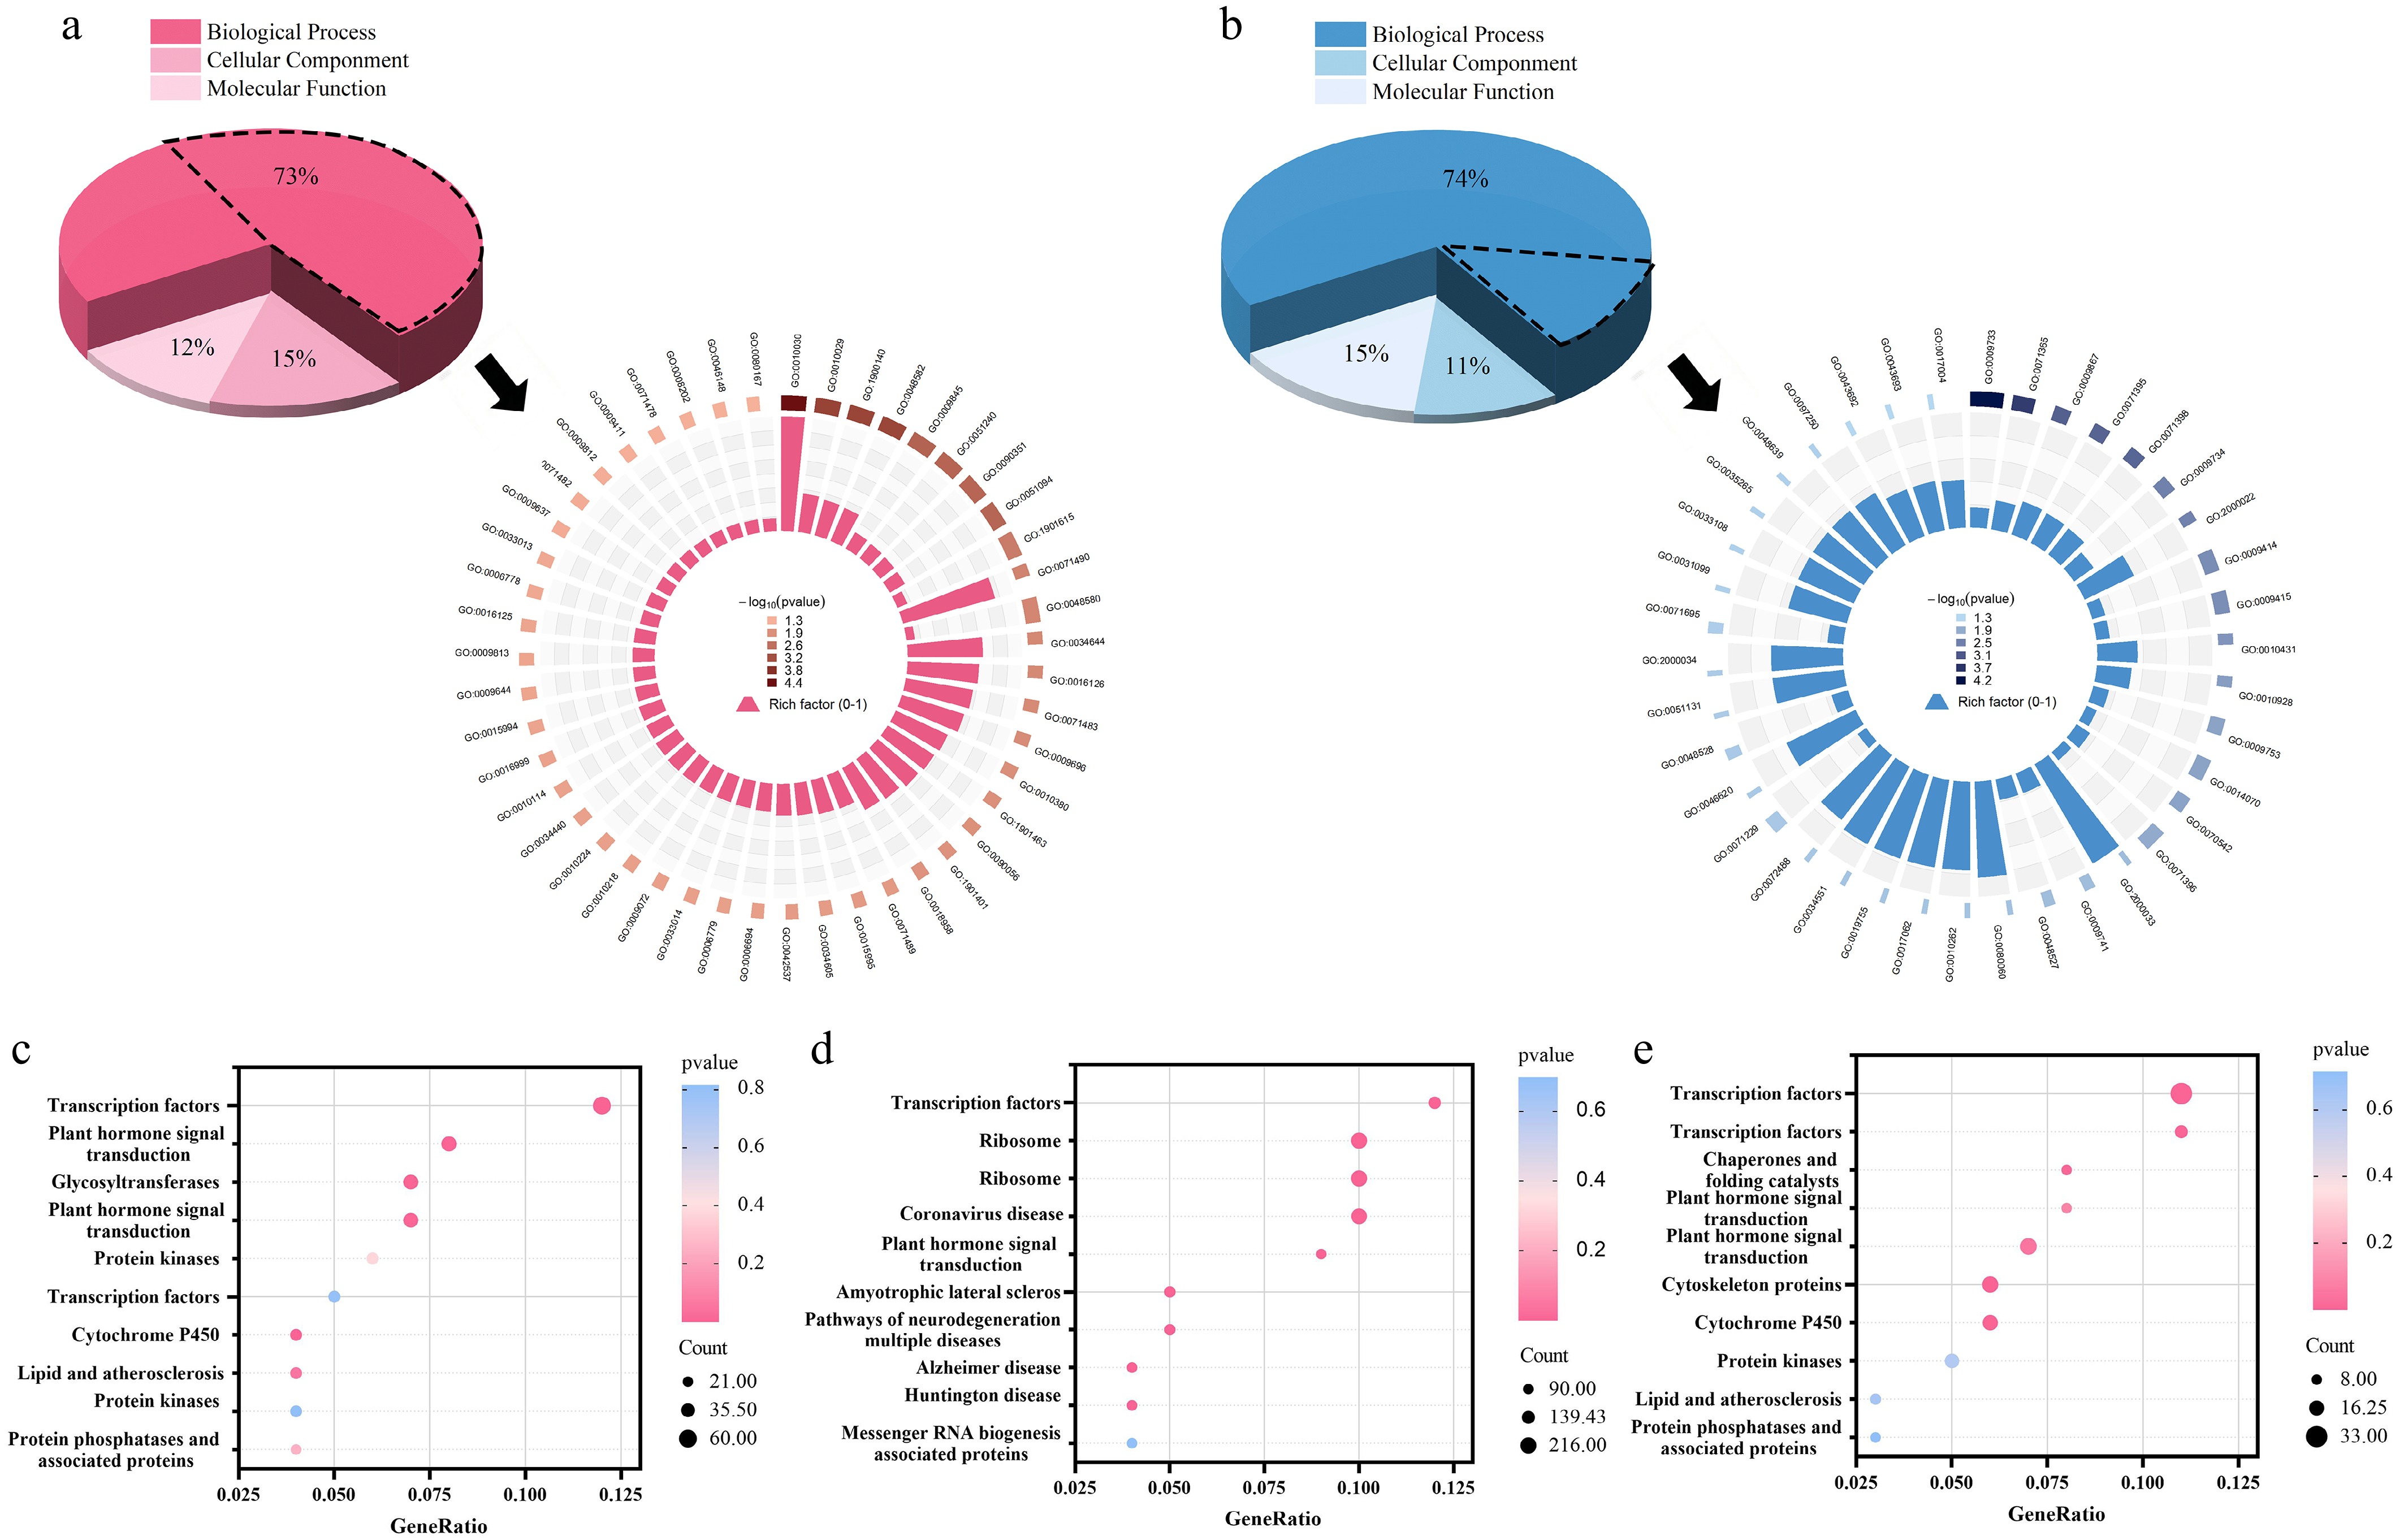
Figure 4.
Results of the functional enrichment analysis of transcriptomic data.
-
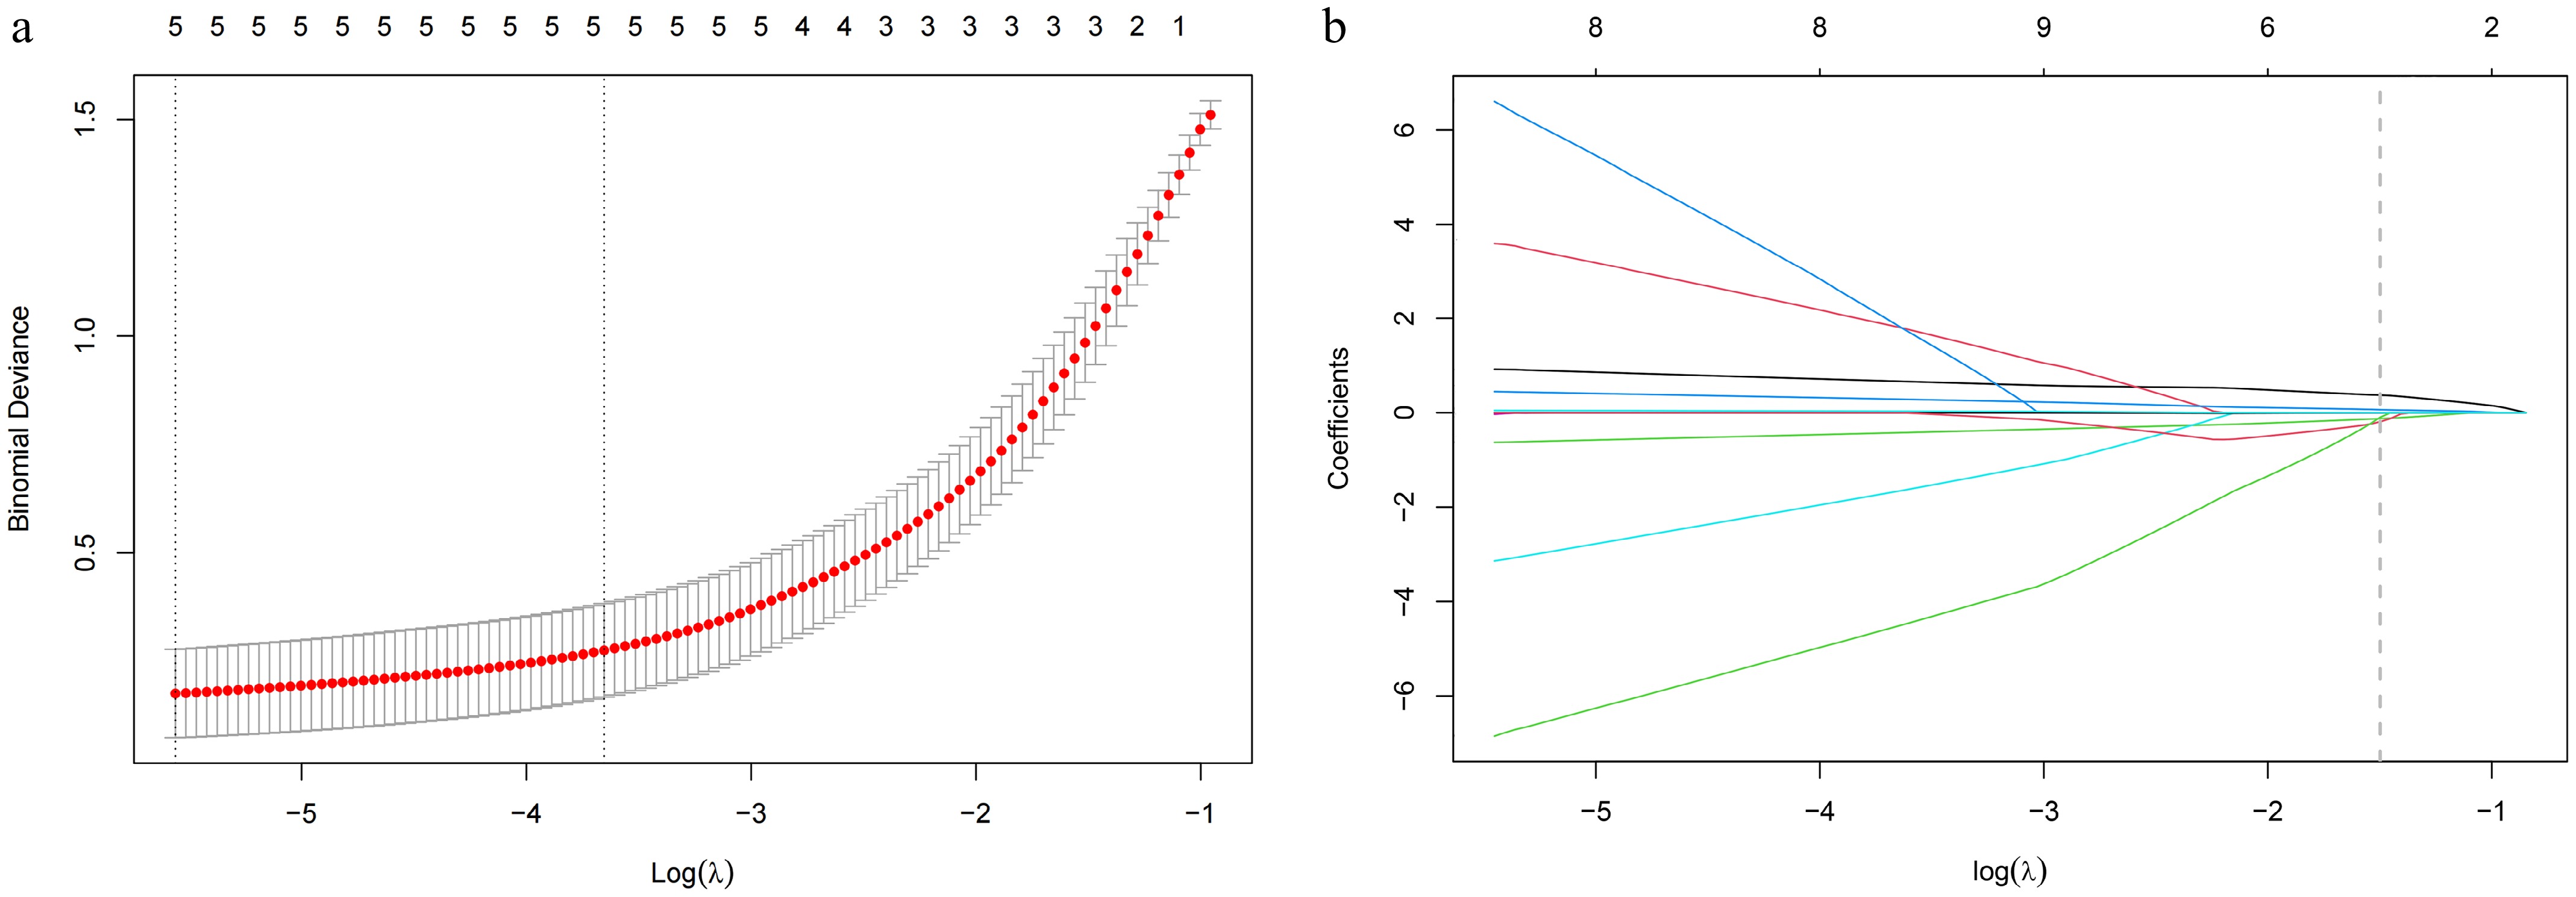
Figure 5.
Establishment of the machine learning model.
-
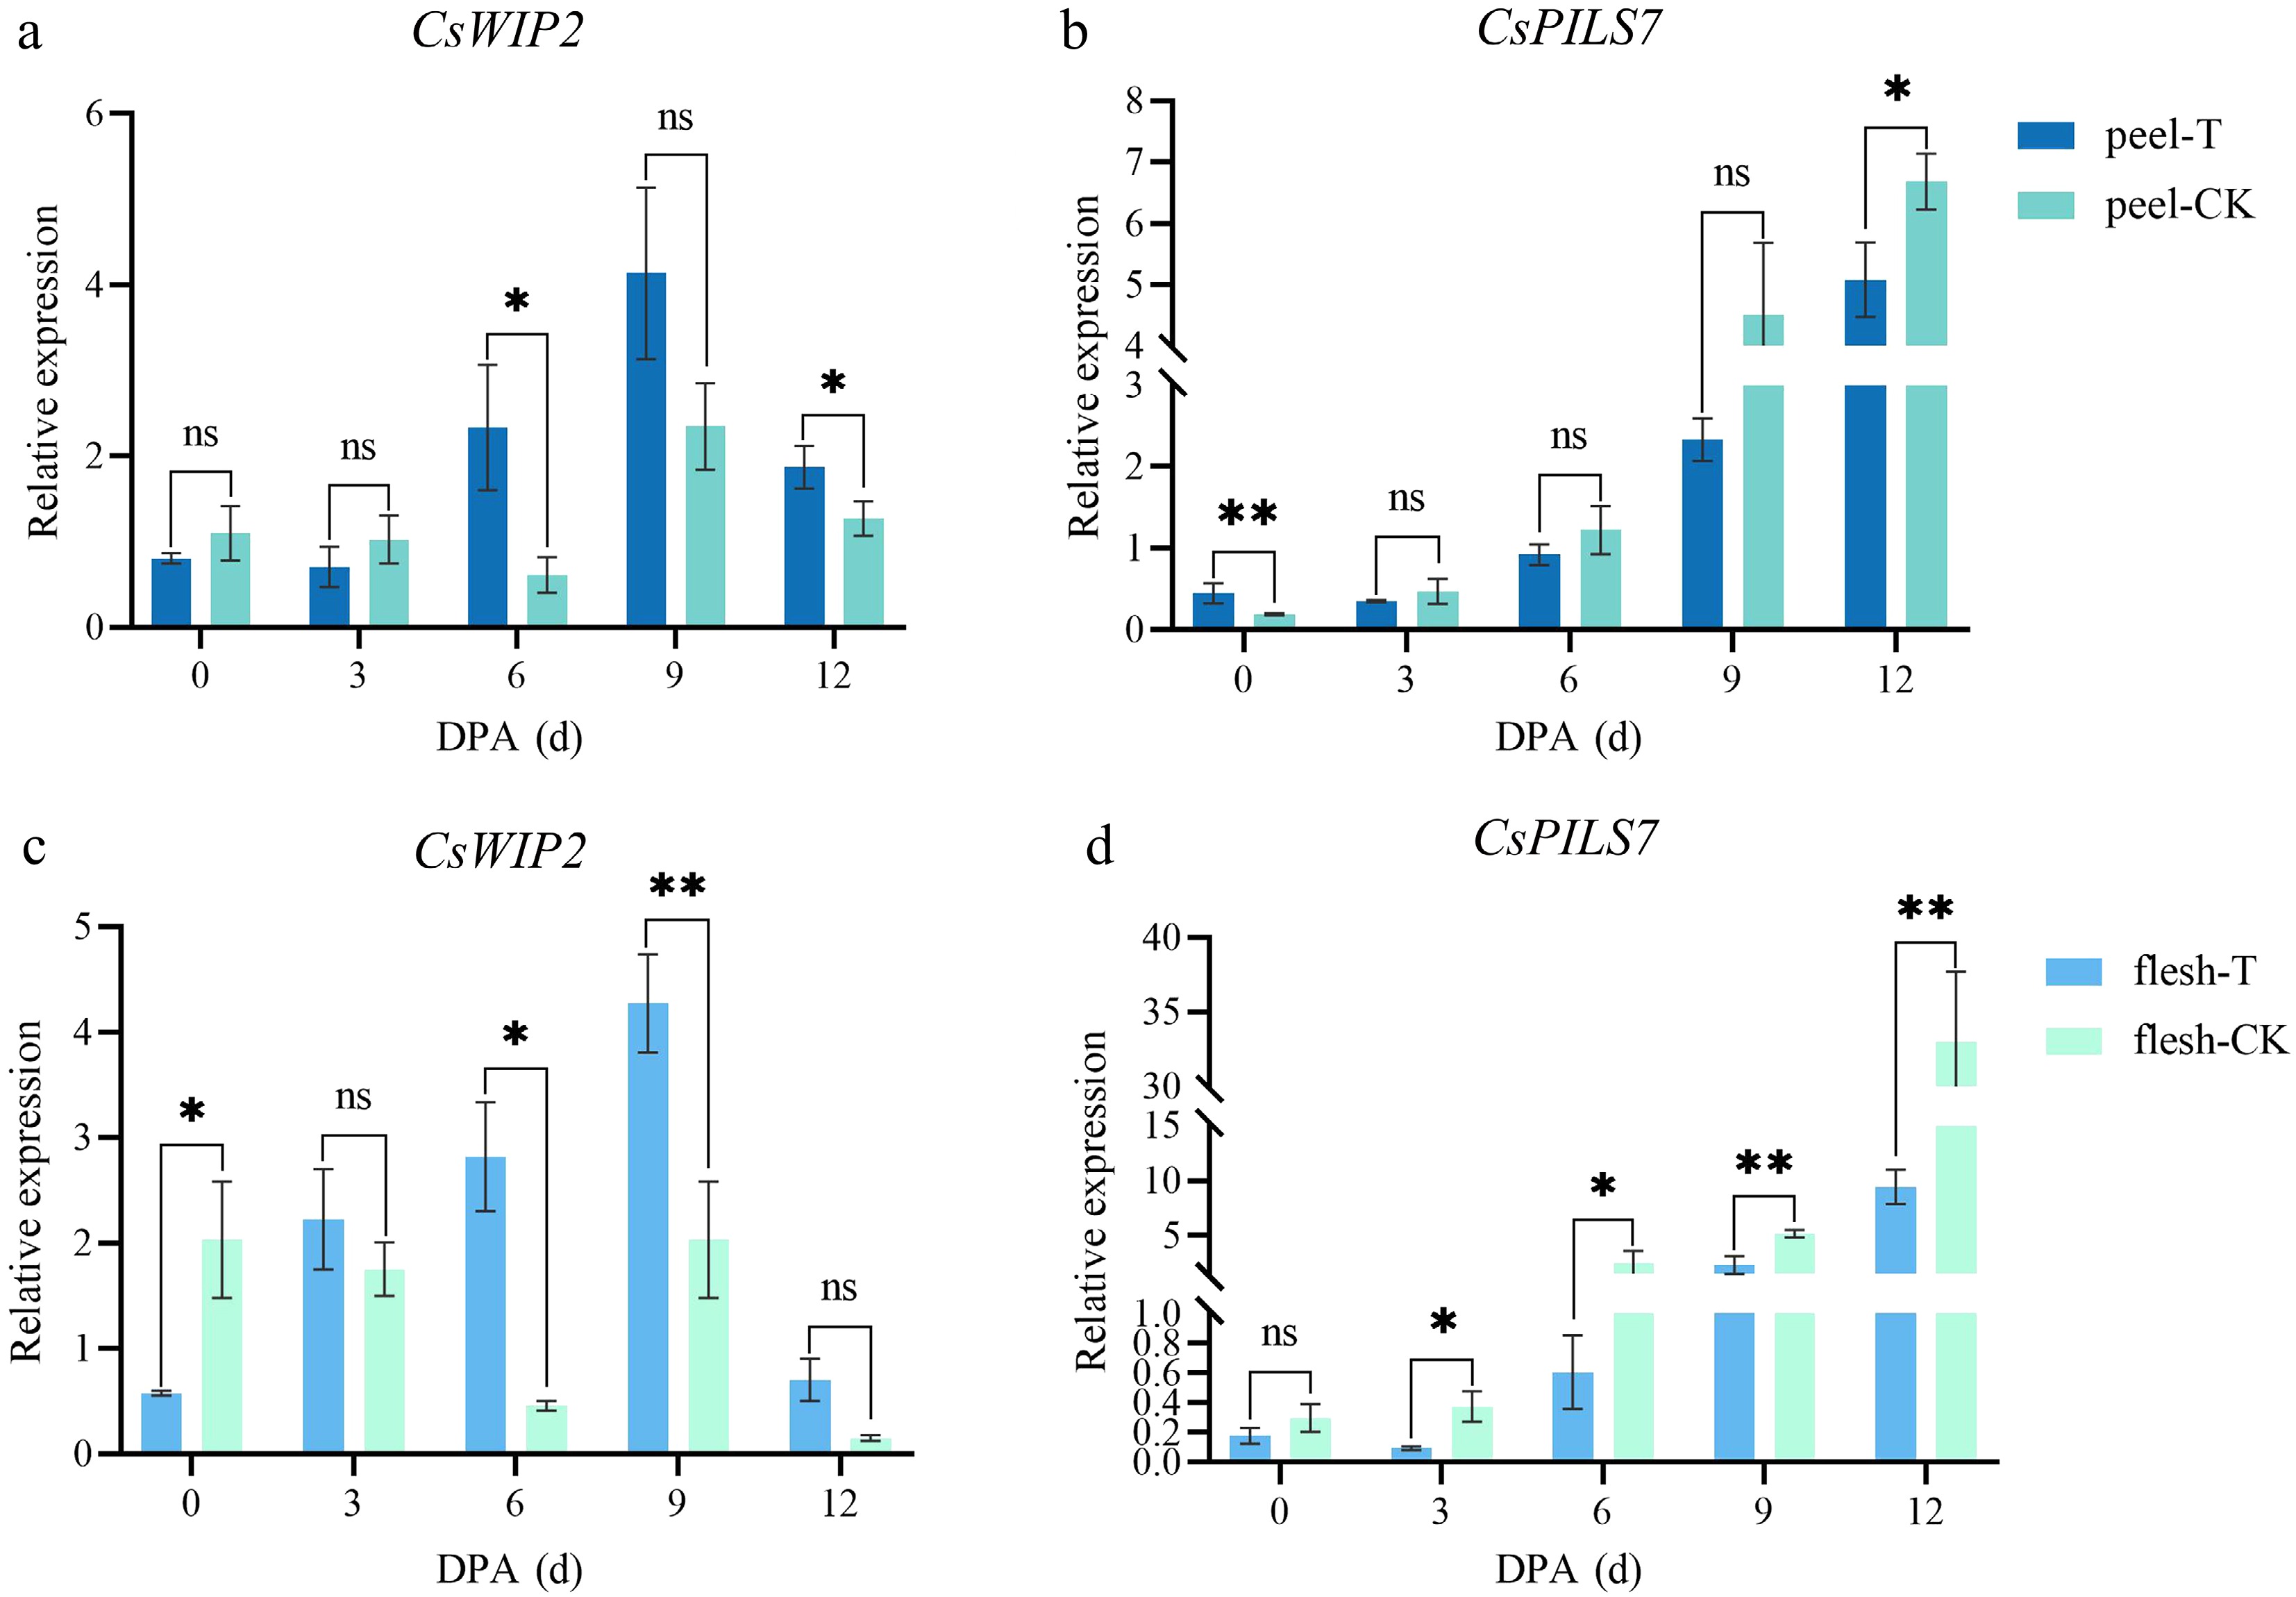
Figure 6.
Relative expression levels of CsWIP2 and CsPILS7 revealed by qPCR.
-
2025 spring 2025 autumn Control group Treatment group Control group Treatment Group Fruit length (cm) 30.3 ± 10.95 34.6 ± 7.3* 32.36 ± 3.04 34.95 ± 3.63* Fruit transverse (cm) 3.52 ± 1.29 4.09 ± 0.95* 3.85 ± 0.62 4.25 ± 0.54* Single fruit weight (g) 421.47 ± 145.133 483.70 ± 83.32* 394.72 ± 123.45 468.32 ± 81.83* Fruit setting rate (%) 83.3 93.2* 68.4 95.7* Average fruit number per plant 2.1 2.5* 2.1 2.6* Yield (kg) 11.66 17.06* 12.43 18.26* Note: * indicates p ≤ 0.05 Table 1.
Results of investigating postharvest yield-related traits of cucumber.
-
2025 spring 2025 autumn Control group Treatment group Control group Treatment group Peduncle length (cm) 3.67 ± 0.50 3.53 ± 0.79 2.74 ± 0.36 2.93 ± 0.66 Locular diameter (cm) 1.64 ± 0.33 1.94 ± 0.50* Locular diameter/fruit diameter 0.42 ± 0.07 0.45 ± 0.09 Fruit flesh thickness (cm) 1.11 ± 0.26 1.16 ± 0.18 Fruit flesh thickness/fruit diameter 0.28 ± 0.04 0.27 ± 0.04 Curvature index (°) 27.98 ± 20.31 5.32 ± 6.43*** 21.24 ± 17.17 3.76 ± 4.63*** Fruit bending rate (%) 25.6 0 16.7 0 Fruit secondary bending rate (%) 43.6 25.7 55.6 15 Fruit straightness rate (%) 30.8 74.3 27.8 85 Note: * indicates p ≤ 0.05 Table 2.
Results of investigating postharvest commercial traits of cucumber.
Figures
(6)
Tables
(2)