-
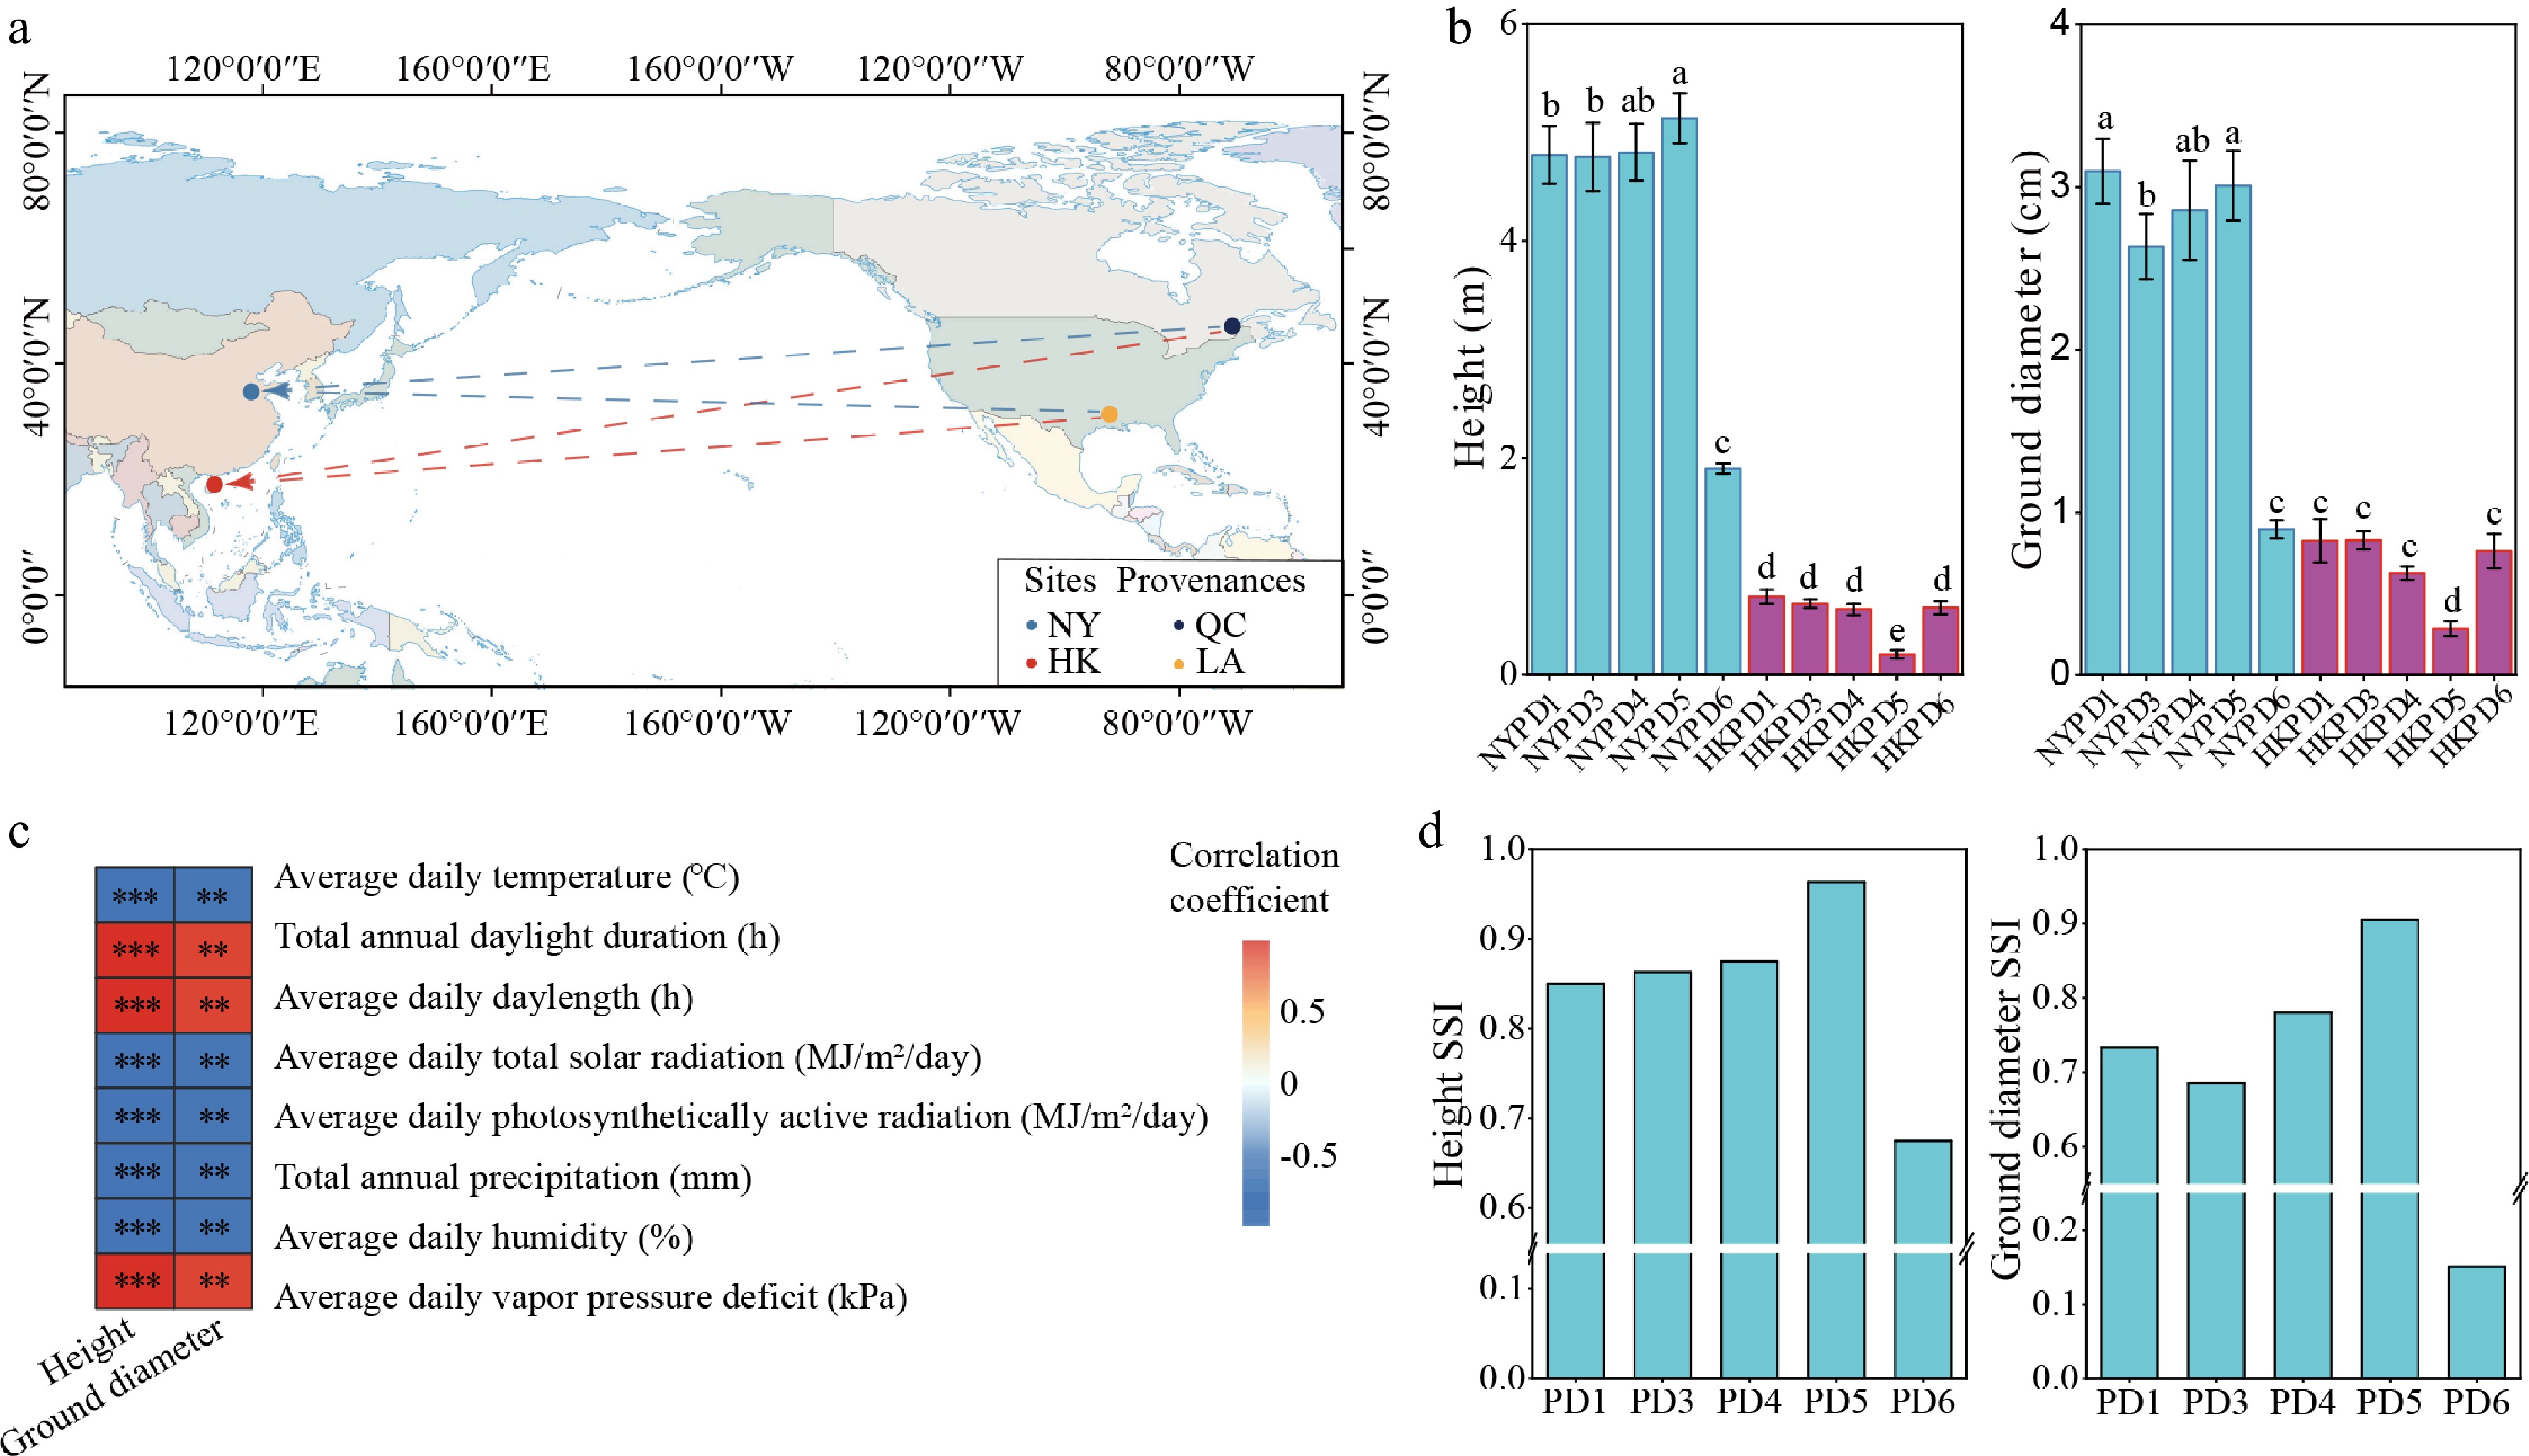
Figure 1.
Differences in growth and SSI of P. deltoides cultivated between tropical and temperate monsoon regions. (a) Distribution of provenances and planting locations for five P. deltoides genotypes. Provenances include QC for PD5 and LA for PD1/3/4/6. Planting locations include HK, in the tropical monsoon climate zone, and NY, in the warm temperate monsoon climate zone. Both QC and LA are geographically closer to NY in terms of latitude. The base map was sourced from the National Standard Map Service System (
http://bzdt.ch.mnr.gov.cn/ ), under the approval number GS (2016) 1663. (b) Net growth in tree height and ground diameter. Multiple comparisons were conducted using the Tukey test (n ≥ 6), with different lowercase letters indicating significant differences (p < 0.05). (c) Heatmap of correlations between net growth in tree height and ground diameter and climatic factors. The climate data are the average value from 2019 to 2021. Pearson's correlation, ** p < 0.01, *** p < 0.001. (d) SSI values for tree height and ground diameter. Error bars represent ± SD. QC, Quebec; LA, Louisiana; HK, Dingan, Haikou, Hainan; NY, Ningyang, Taian, Shandong; SSI, stress susceptibility index. -
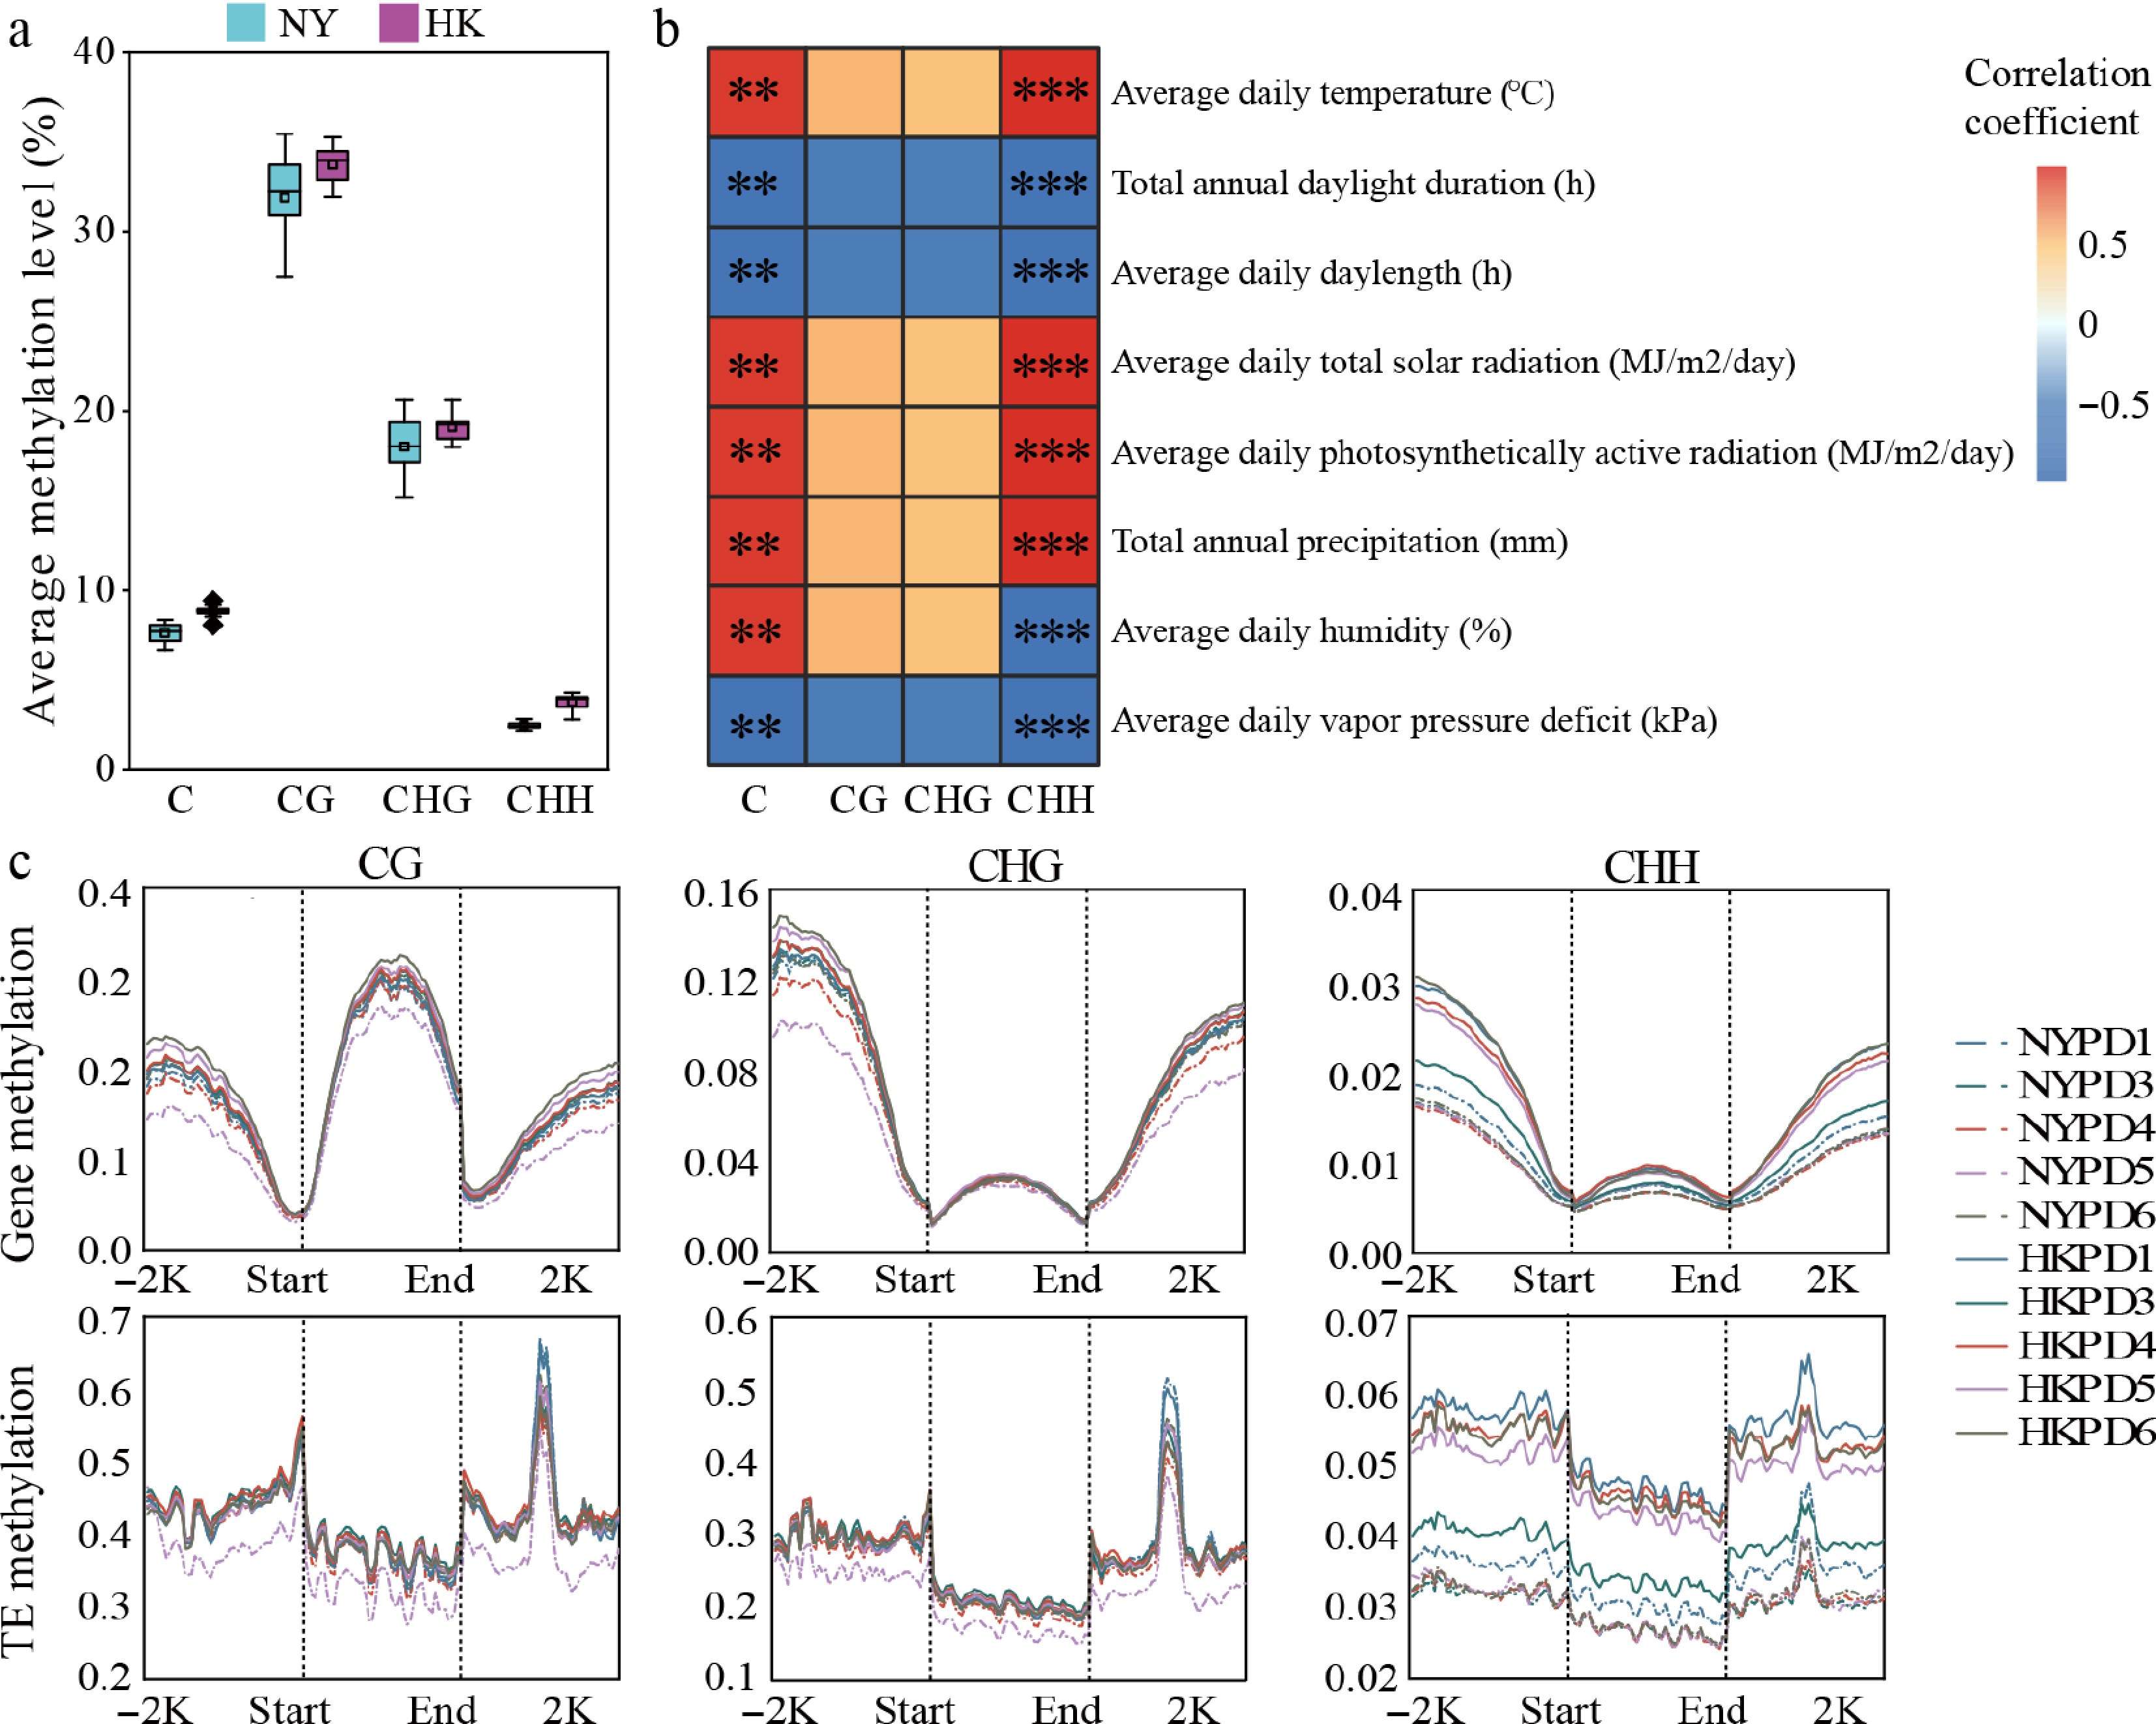
Figure 2.
Differences in DNA methylation of P. deltoides cultivated between tropical and temperate monsoon regions. (a) Average methylation levels of all C sites, and C sites in CG, CHG, and CHH sequence contexts in the leaf genomes of different P. deltoides genotypes planted in NY and HK. For each genotype at each location, values represent the mean of three replicates, with five genotypes per location serving as replicates (n = 5). (b) Heatmap of correlations between average methylation levels in each sequence context and climatic factors. Pearson's correlation, ** p < 0.01, *** p < 0.001. (c) DNA methylation profiles of gene bodies, TEs, and their respective upstream 2 kb and downstream 2 kb regions, including those of mCG, mCHG, and mCHH. Error bars represent ± SD. HK, Dingan, Haikou, Hainan; NY, Ningyang, Taian, Shandong; TE, transposable element.
-
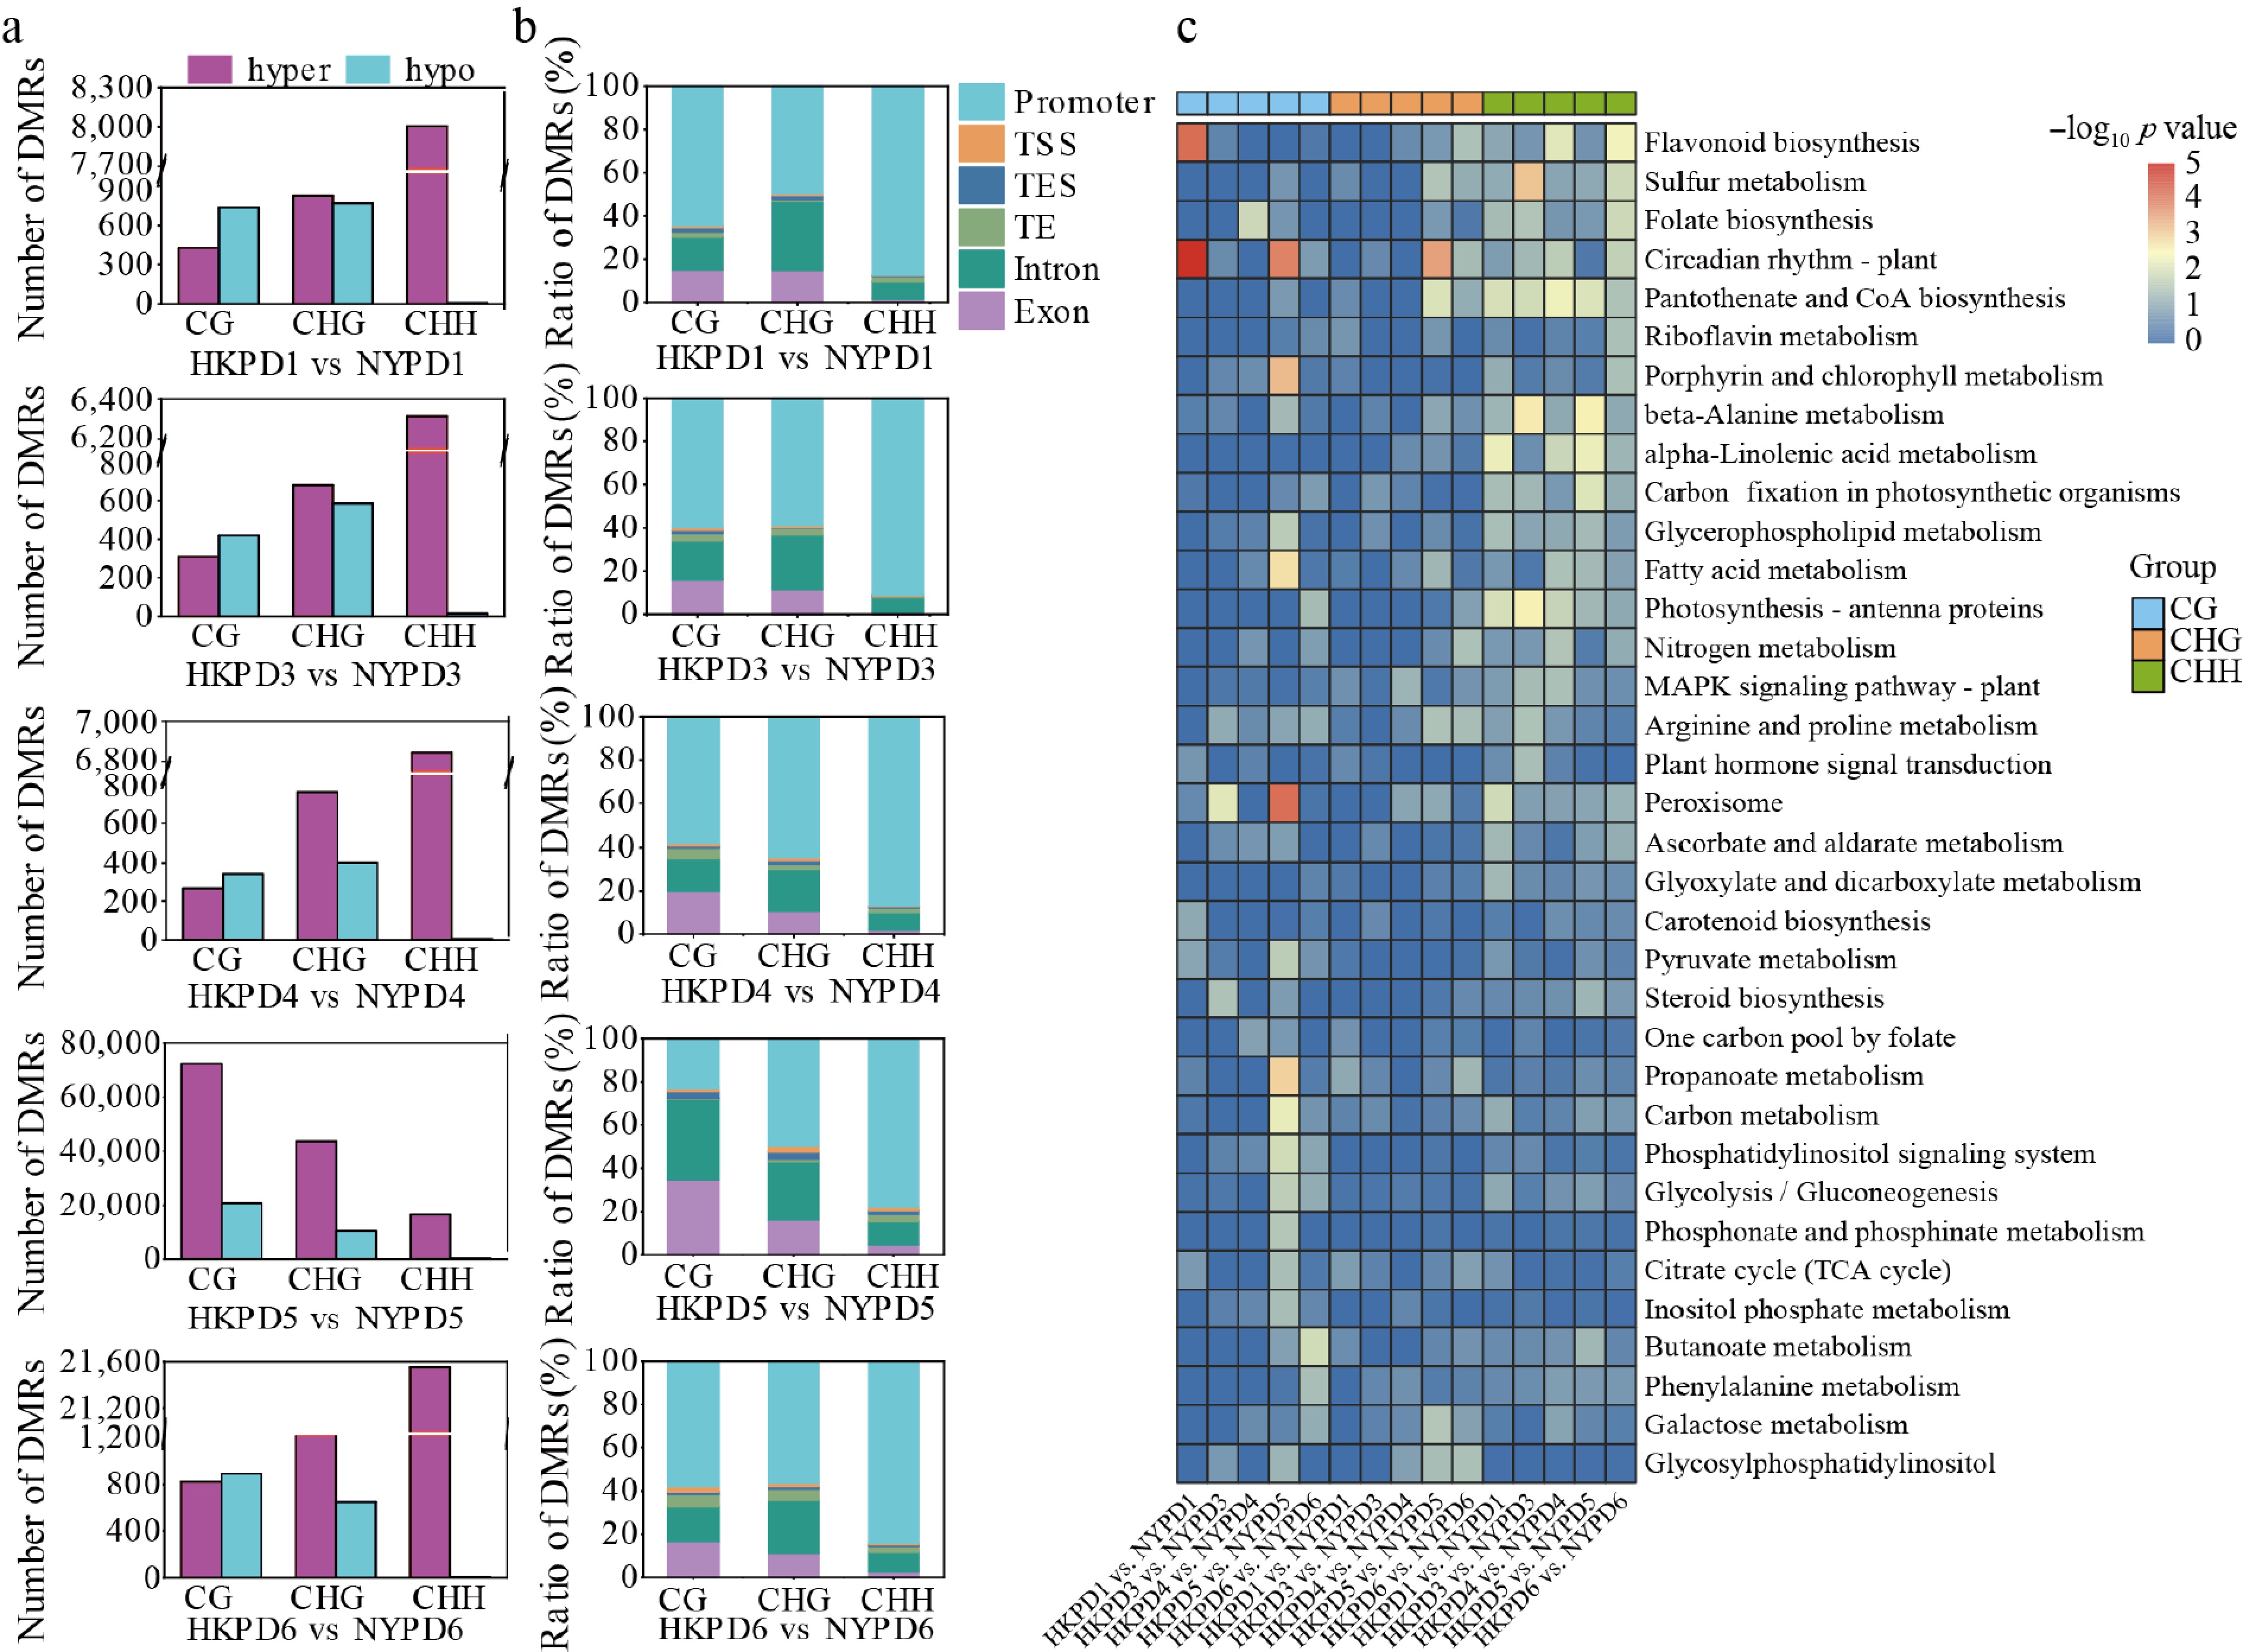
Figure 3.
Identification of DMRs and functional annotation of corresponding DMGs between locations. (a) Number of DMRs in each comparison group. (b) Distribution of DMRs across gene functional regions, including promoter, intron, exon, TSS, TES, and TE, and their relative proportions in total DMRs. (c) Heatmap of KEGG enrichment analysis of CG-, CHG-, and CHH-type DMGs in each comparison group.
-
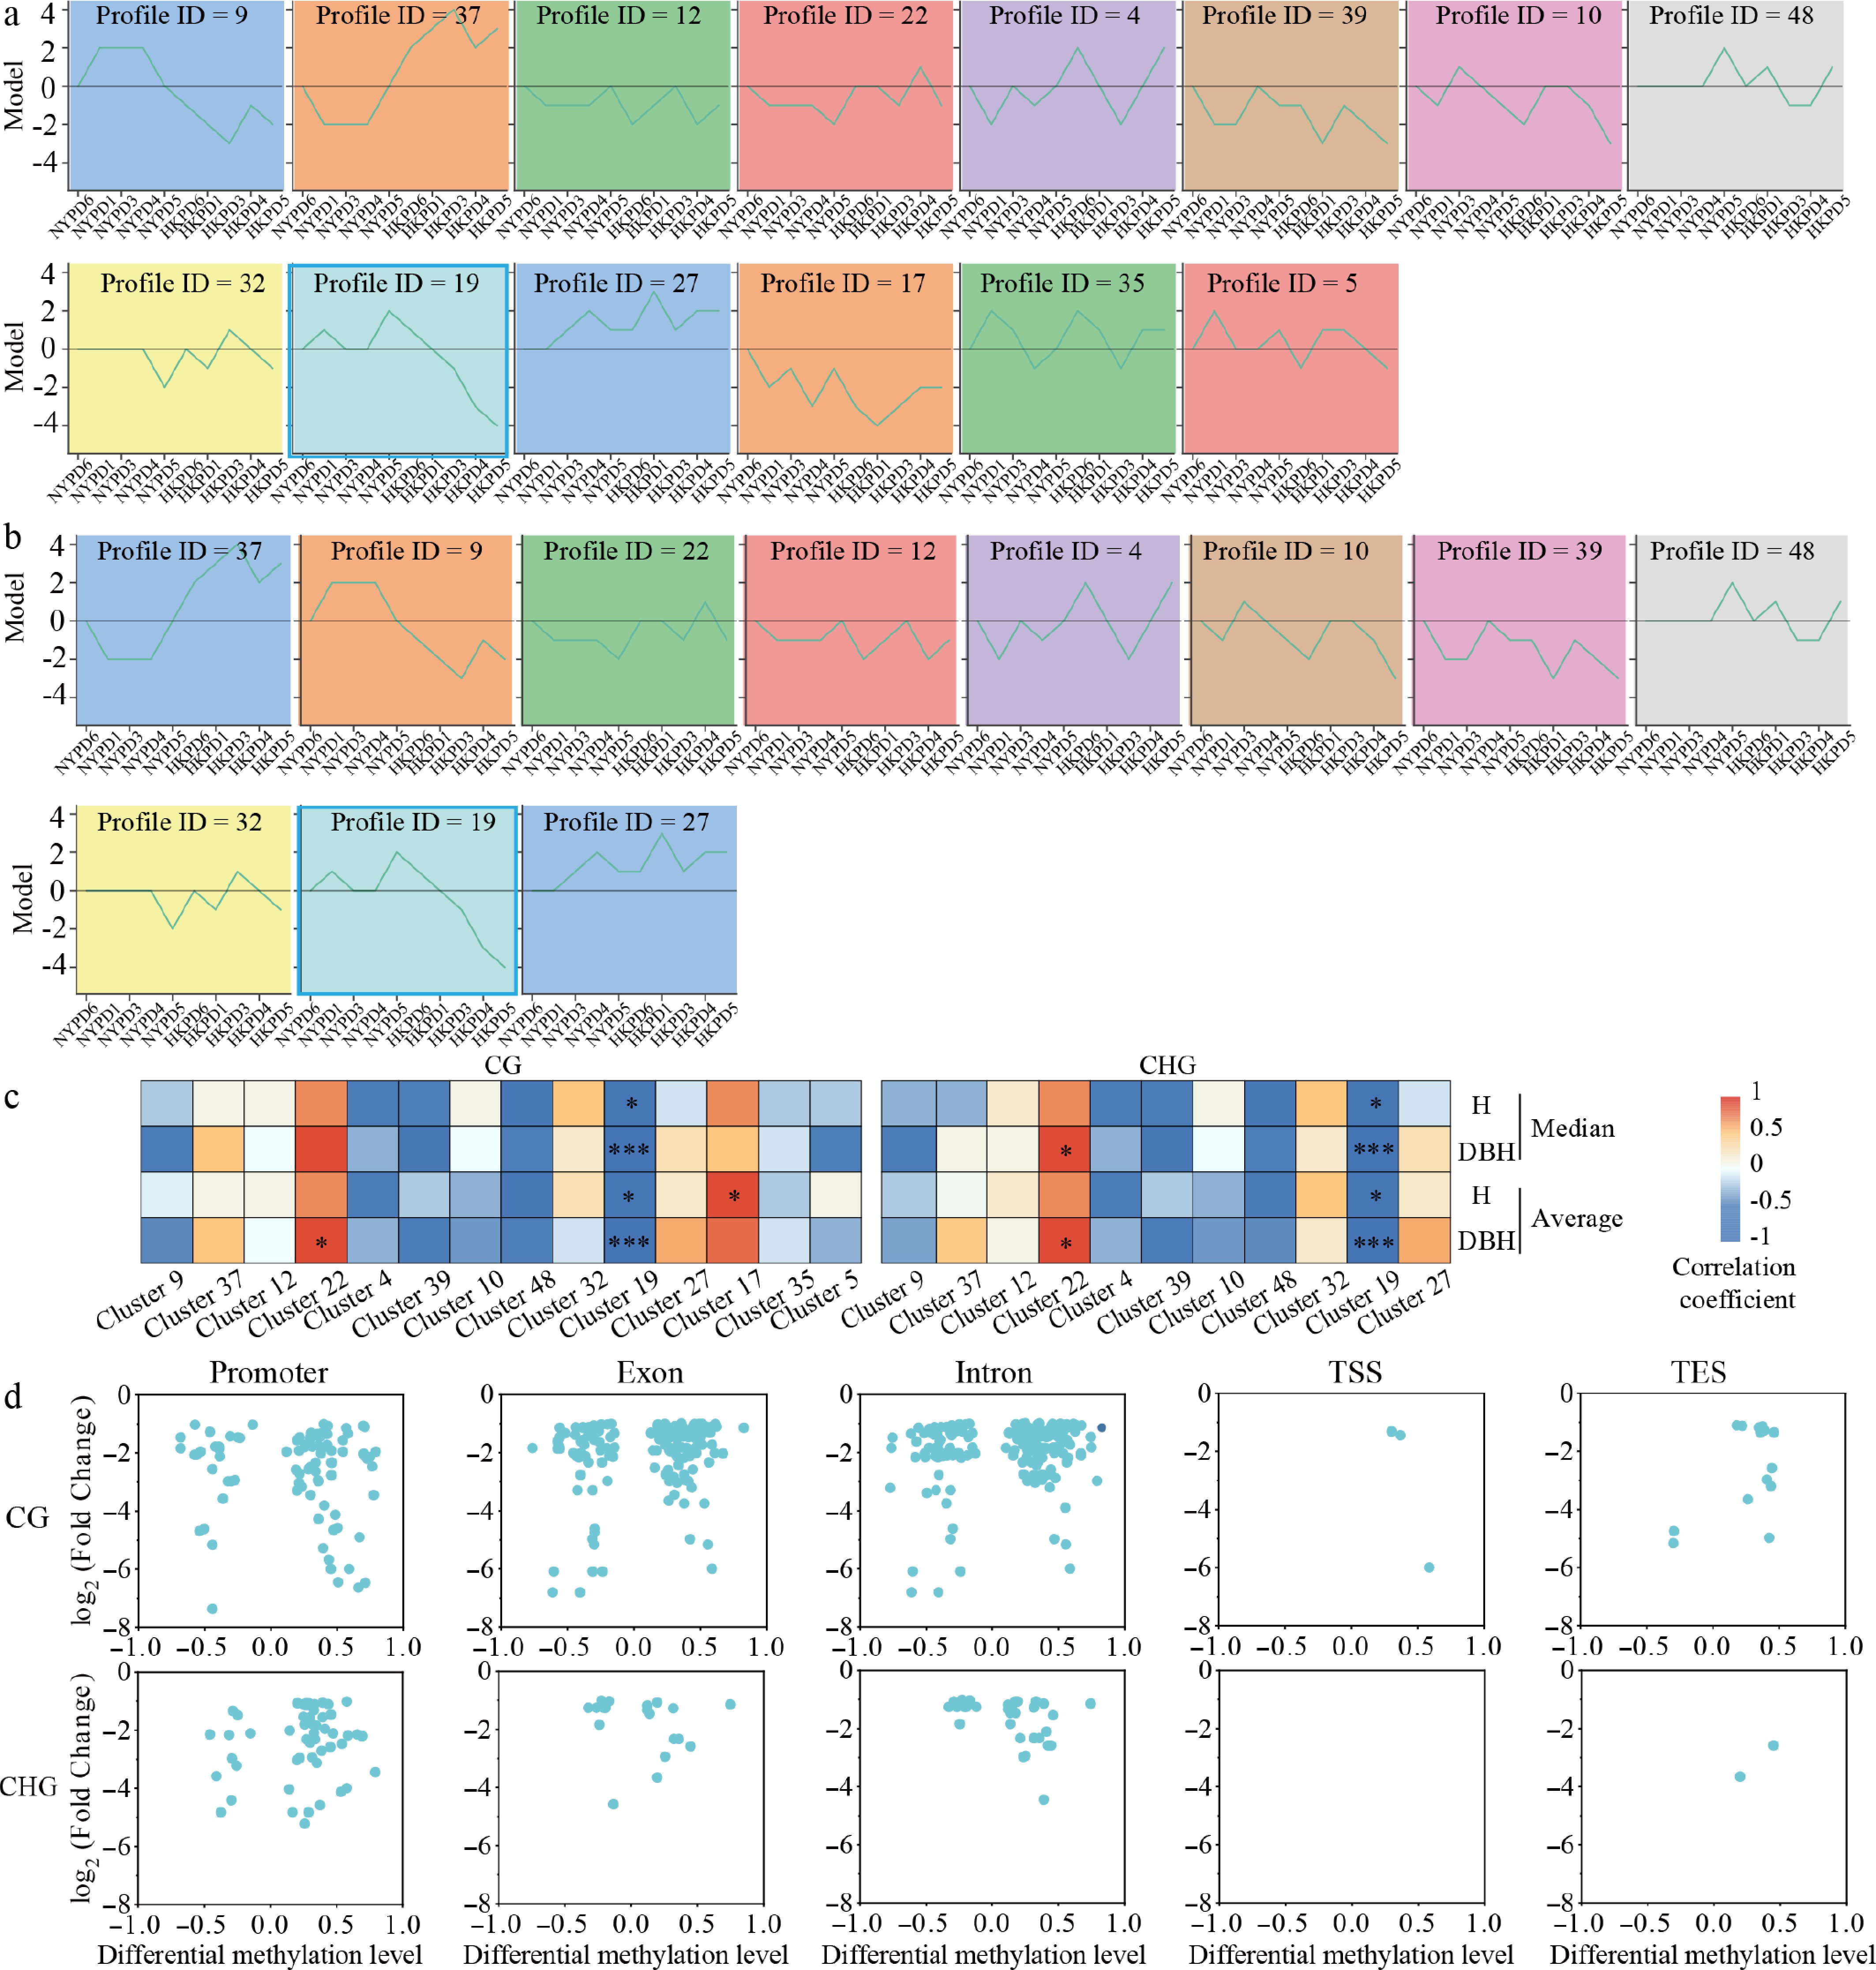
Figure 4.
Identification of CG- and CHG-type DMGs associated with environment-sensitive genes and distribution of their DMRs across genic regions. STEM trend analysis of FPKM values for (a) CG-DMGs, and (b) CHG-DMGs specifically identified in HKPD5 vs NYPD5. For CG-DMGs and CHG-DMGs, 14 and 11 significant clusters were identified, respectively (FDR < 0.05). (c) The correlation between the expression trends of each cluster and the SSI of the genotypes. The expression trend of each cluster was primarily represented by the median of the normalized log2(fold change) values of its genes. The mean was also calculated as a robustness check, and both metrics yielded consistent results. Spearman's rank correlation was used for correlation analysis, and statistical significance was defined as * p < 0.05 and *** p < 0.001. CG-blue and CHG-blue clusters are highlighted with blue boxes. (d) Distribution of DNA methylation and gene expression differences in DMR–DEG pairs across functional regions of the CG-blue and CHG-blue clusters.
-
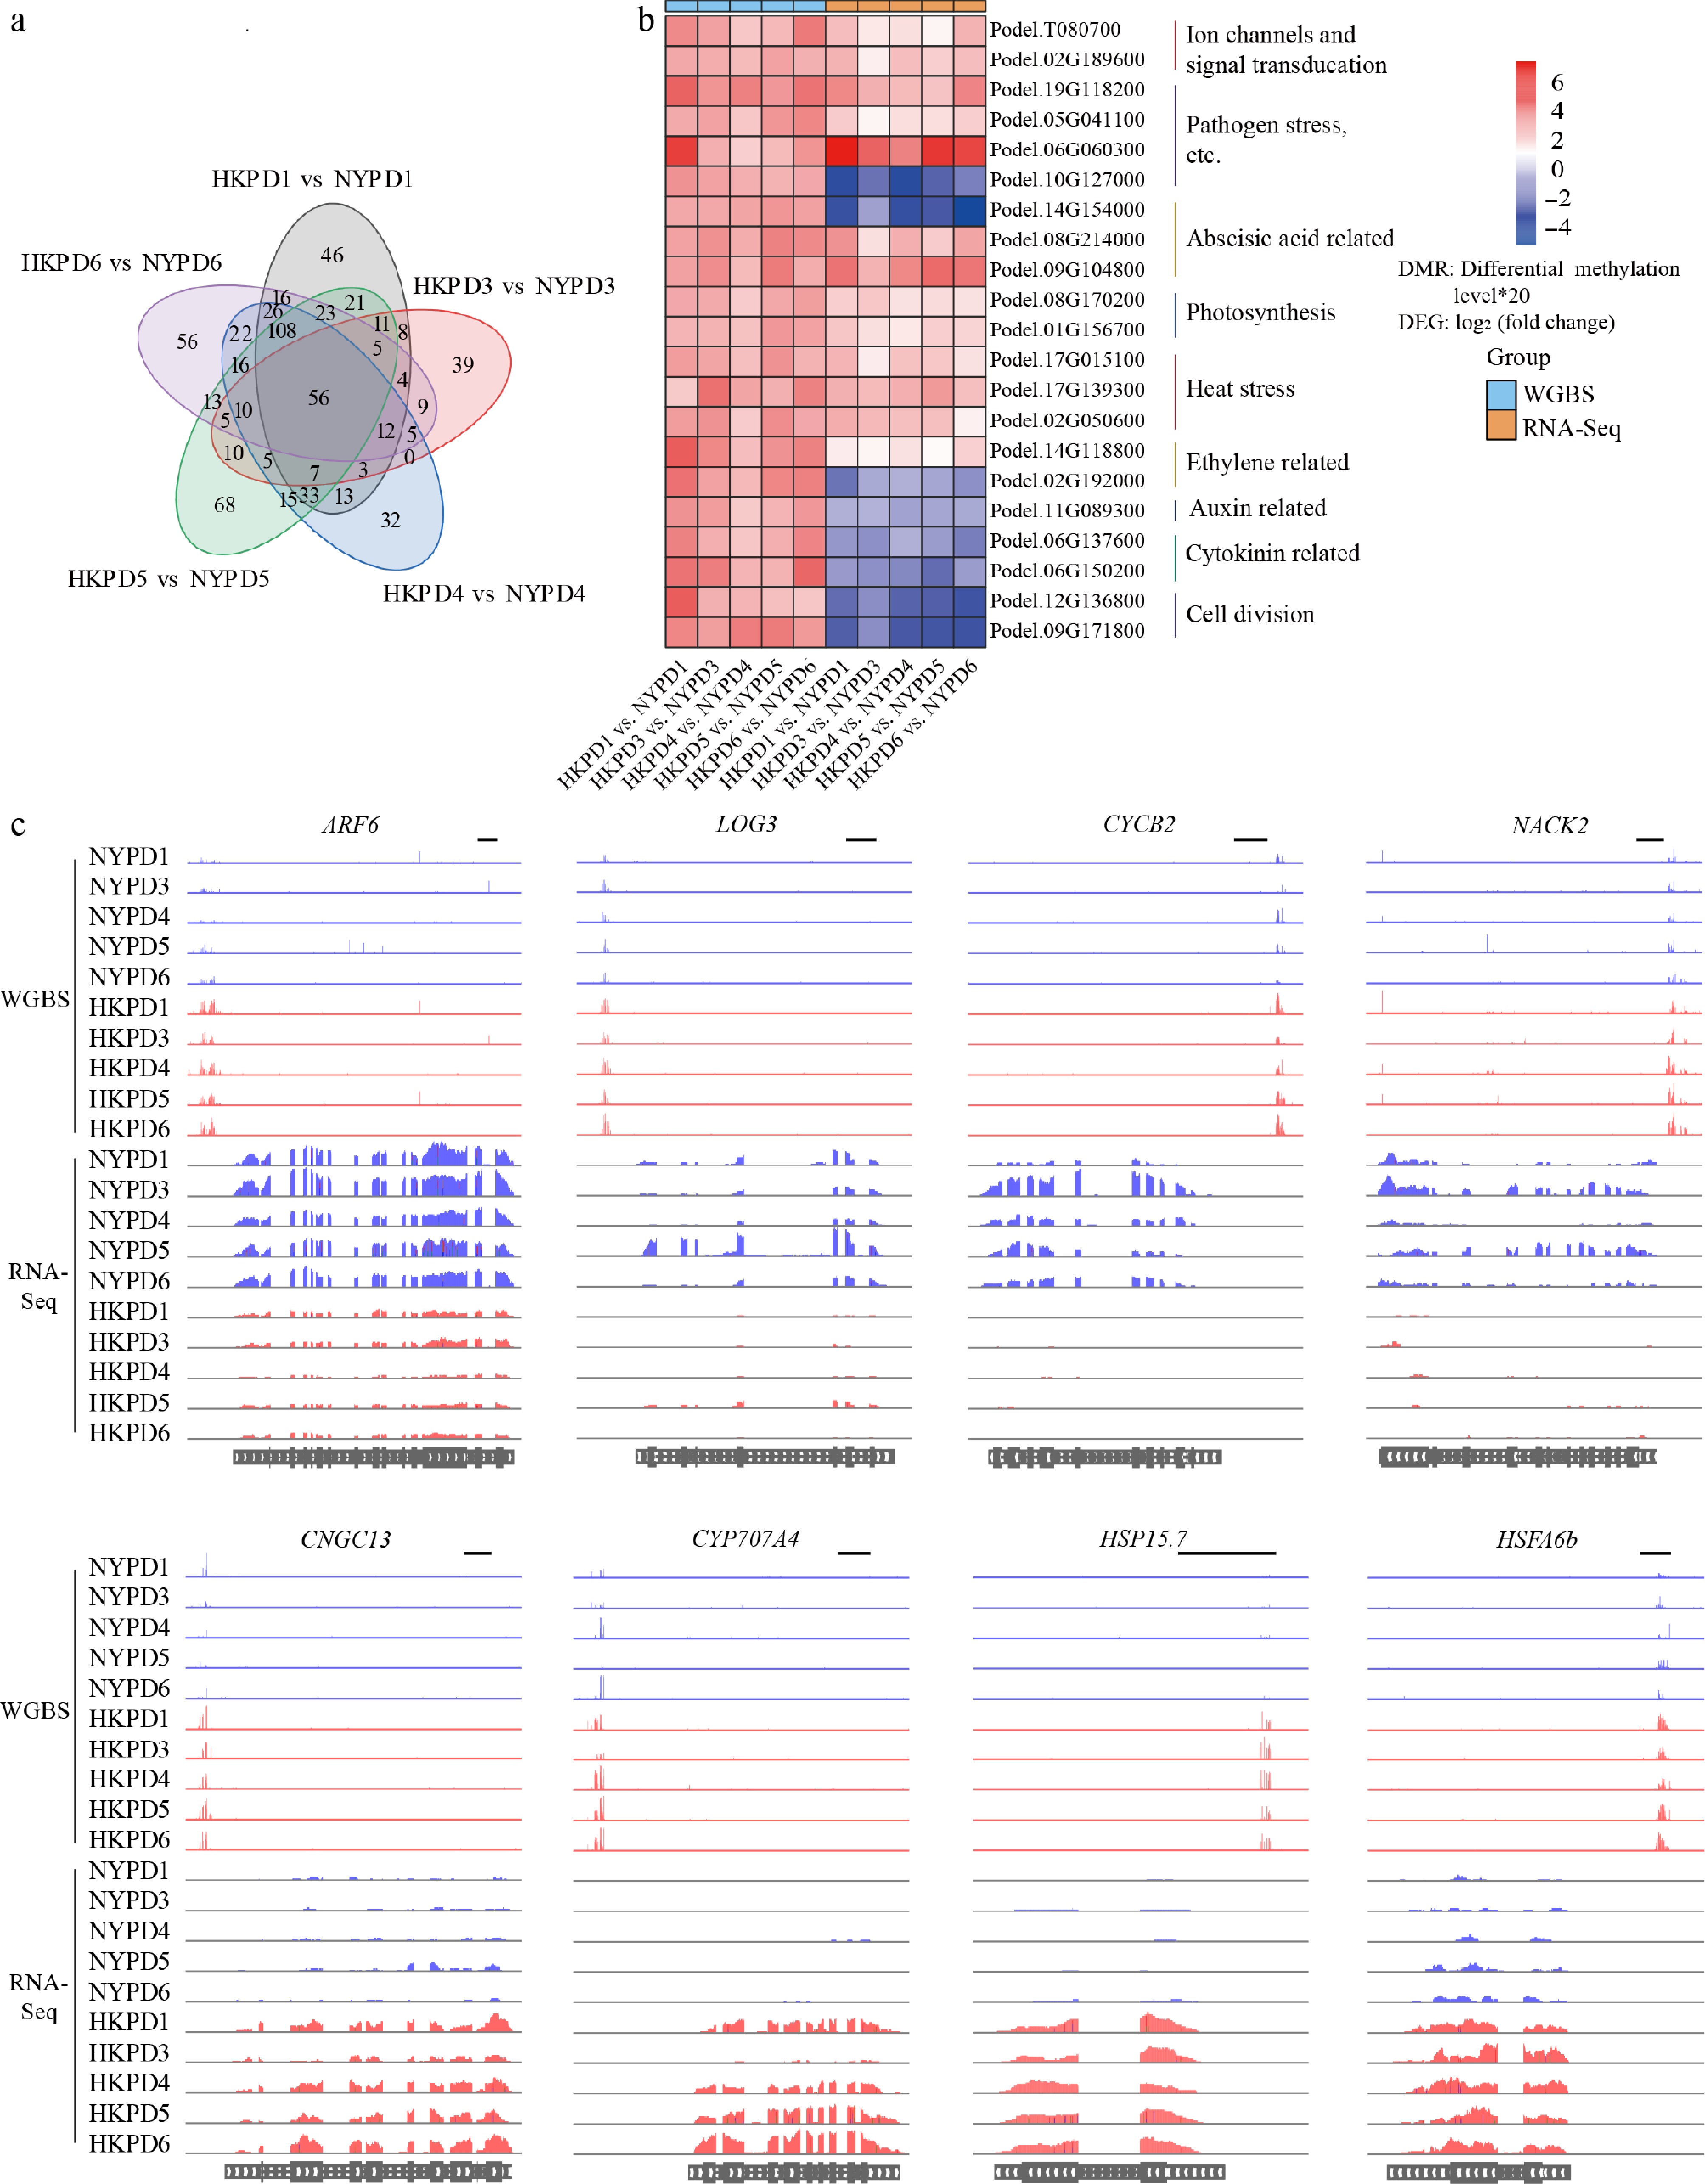
Figure 5.
Identification of key CHH-methylated genes involved in stress adaptation of P. deltoides to the HK environment. (a) Venn diagram of hyper-promoter-CHH-DMDGs from five comparison groups. (b) Heatmap of DNA methylation and gene expression differences in key CO-hyper-promoter-CHH-DMDGs. Methylation differences represent the mean across multiple DMRs per gene. (c) IGV plots of promoter-CHH DNA methylation and gene expression levels in key CO-hyper-promoter-CHH-DMDGs. Bar, 500 bp.
-
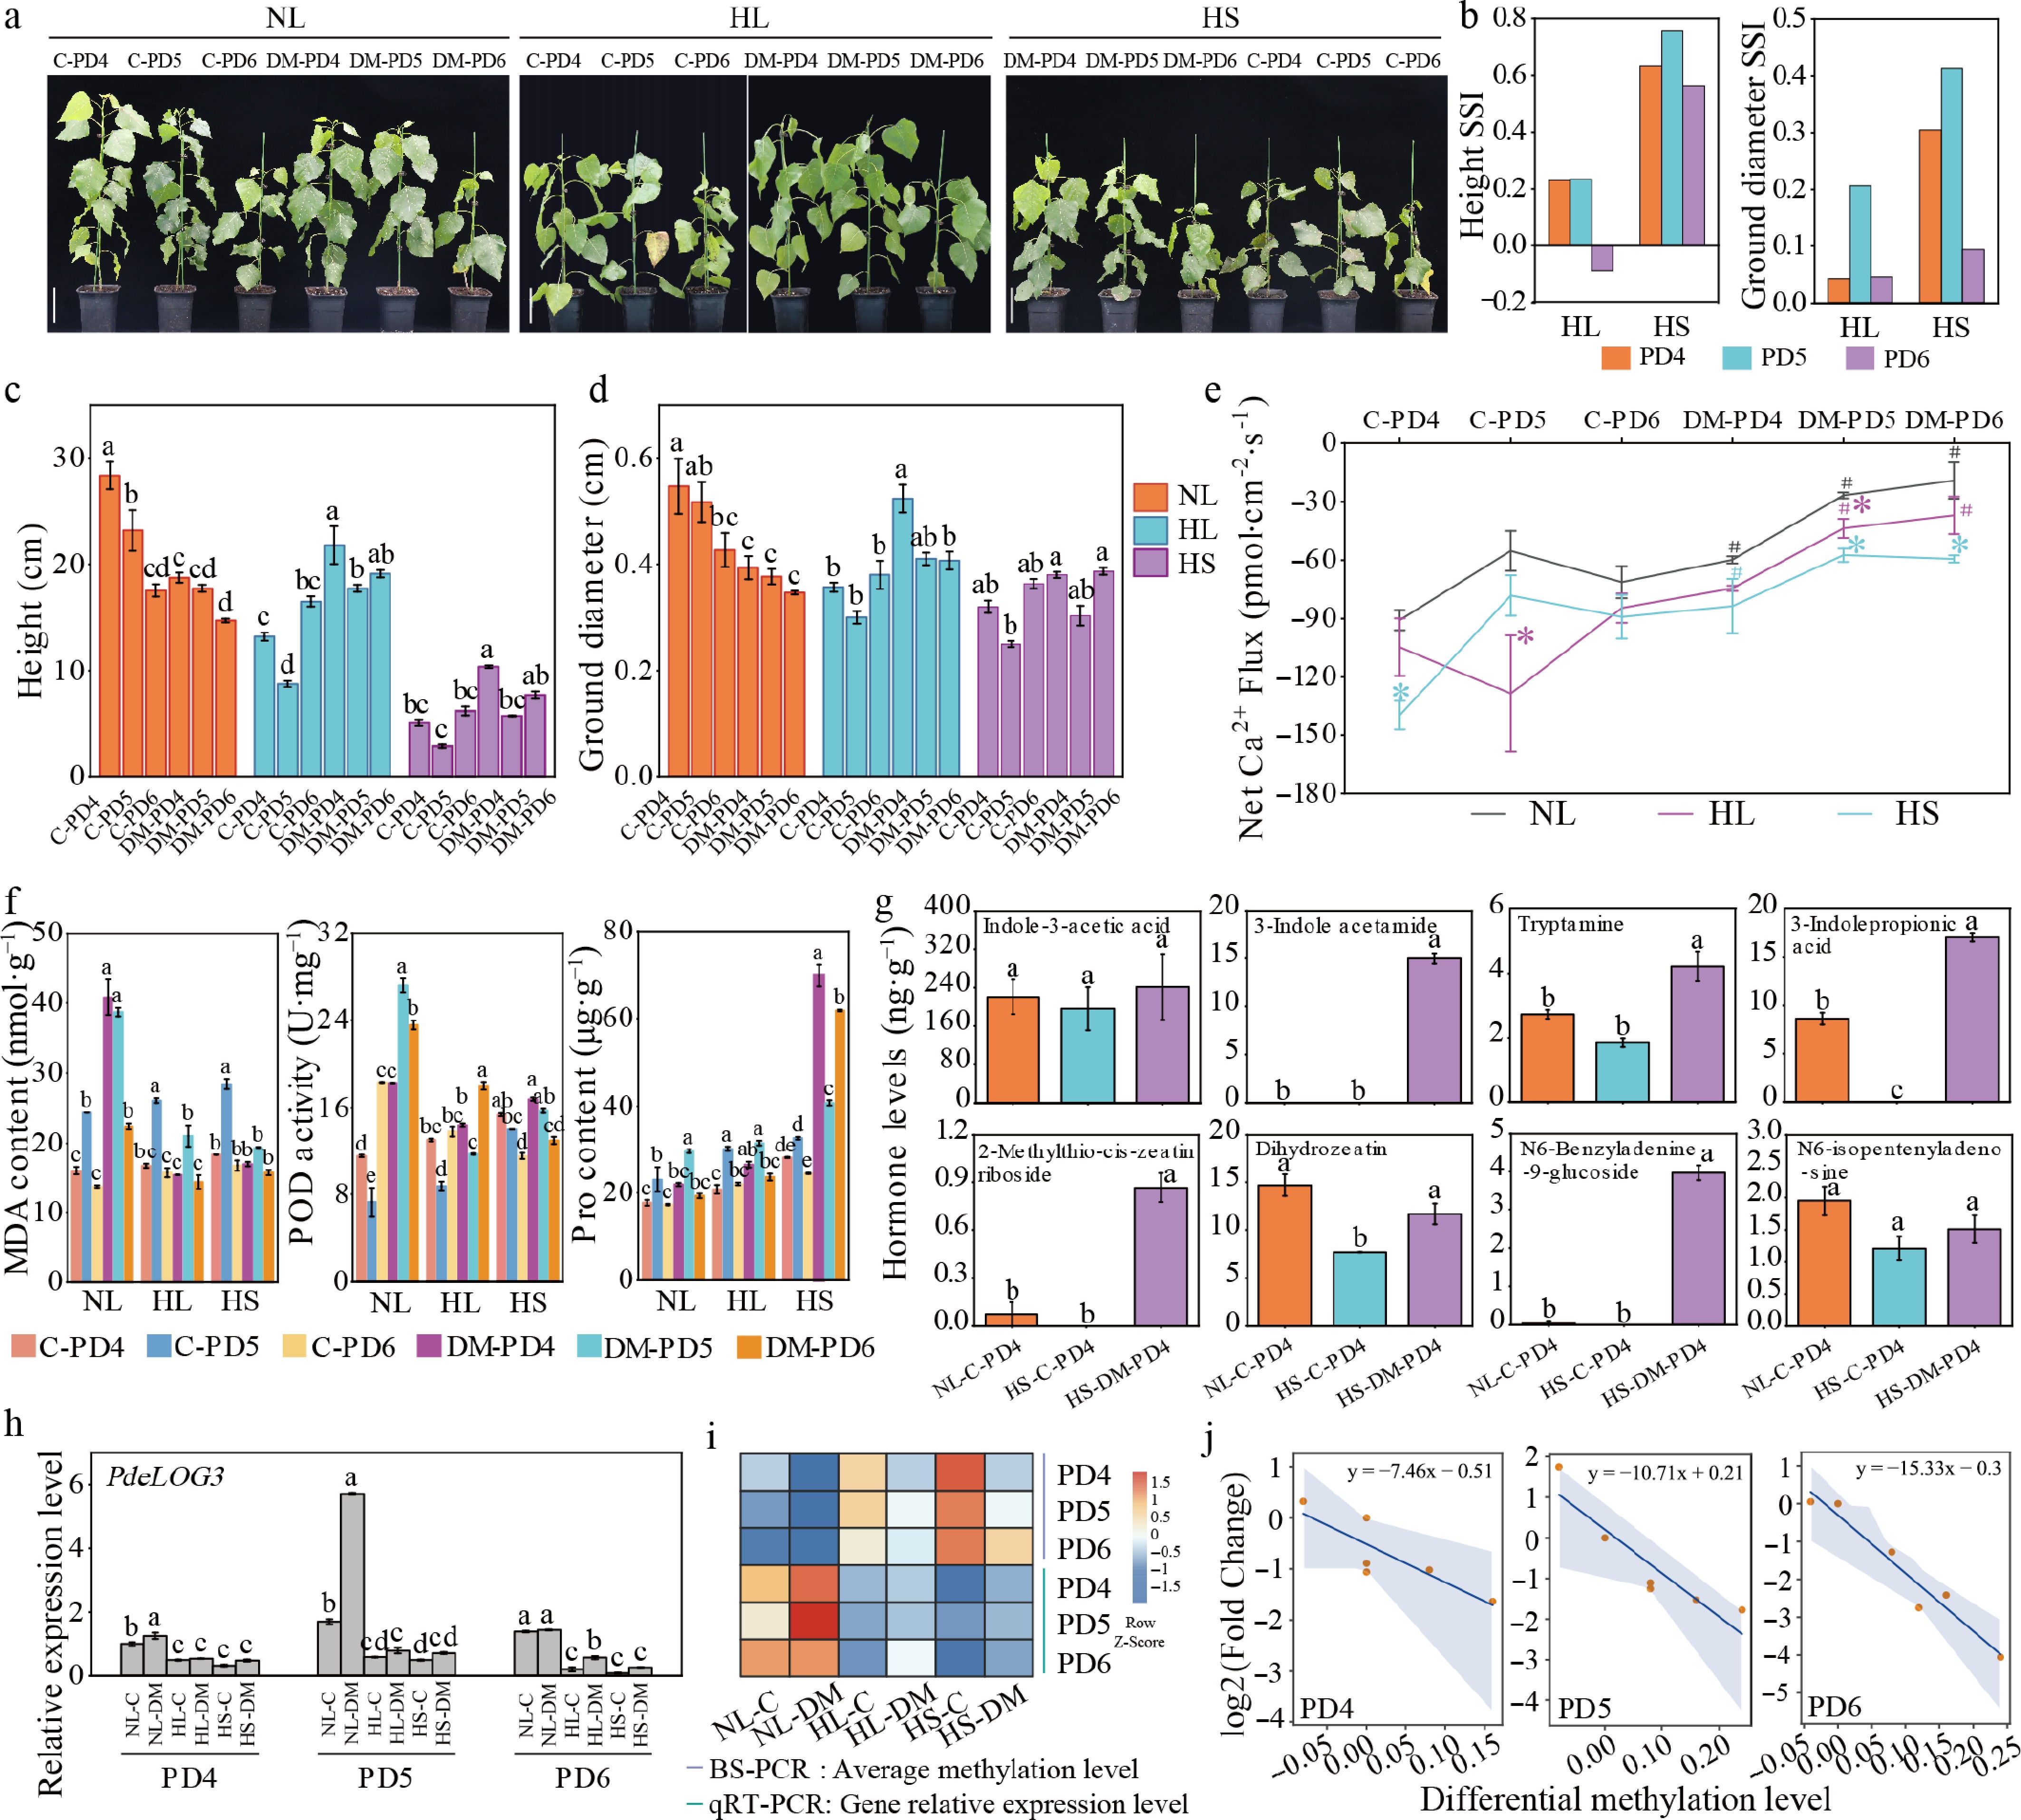
Figure 6.
Phenotypic, physiological and molecular responses of P. deltoides to stress in the presence or absence of 5-AzaC. (a) Phenotypic characteristics under stress. Bar, 10 cm. (b) SSI for tree height and ground diameter. (c), (d) Net growth in tree height and ground diameter. (e) Ca2+ flow rate. * indicates that, under otherwise identical conditions, there was a significant difference between HL or HS and NL (n = 3, p < 0.05); purple denotes significance between NL and HL, and blue between NL and HS. # indicates a significant difference (n = 3, p < 0.05) between 5-AzaC-treated and untreated plants of the same genotype under identical conditions. (f) MDA content, POD activity, and proline content. (g) Auxin and cytokinin contents. (h) Relative expression level of PdeLOG3. (i) Methylation level and expression of the target fragment of PdeLOG3, with heatmap values representing the mean of four replicates. (j) Regression analysis of differential methylation level vs differential gene expression (log2 fold change) of the PdeLOG3 target fragment, with NL-C as the control. Each point represents a treatment, shown as the mean of four replicates; confidence interval = 0.99. (a) Phenotypic traits and (c), (d) net growth data were measured after 14 d of stress, whereas (e)–(j) physiological, biochemical, and molecular data were collected after 7 d. Multiple comparisons were conducted using the Tukey test (n ≥ 3), with different letters indicating significant differences (p < 0.05). Error bars represent ± SD. NL, normal temperature with long daylight; HL, high temperature with long daylight; HS, high temperature with short photoperiod; C, without 5-AzaC; DM, with 5-AzaC; SSI, stress sensitivity index.
-
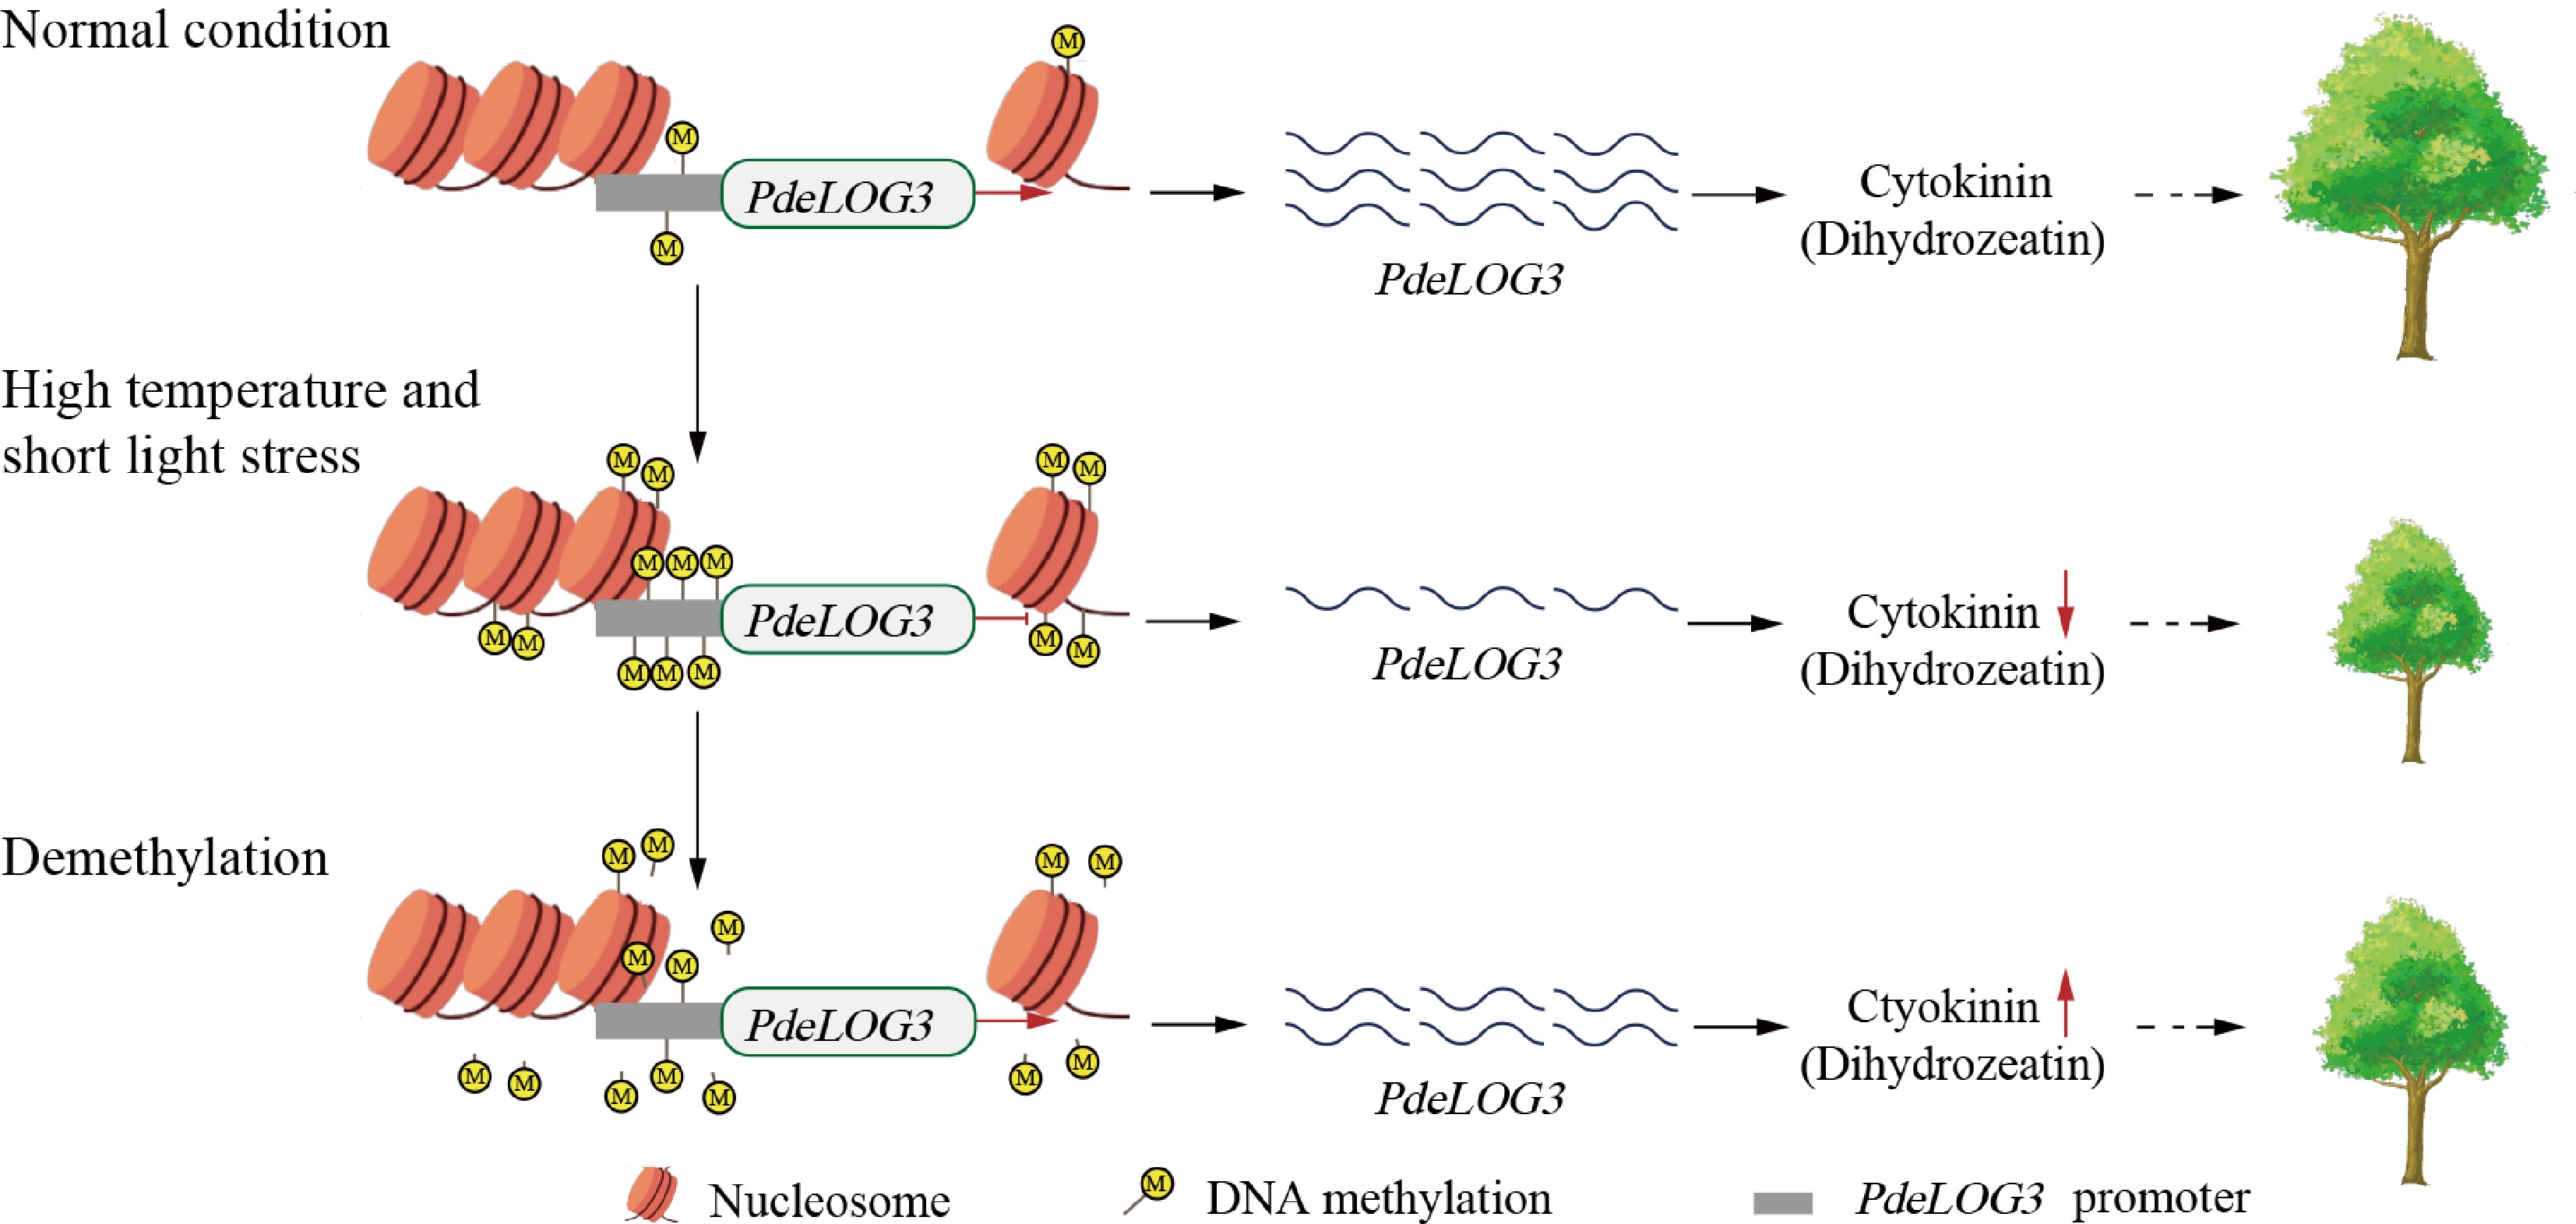
Figure 7.
CHH-type hypermethylation in the promoter of PdeLOG3 may be associated with the general response of P. deltoides to HS stress. A proposed model suggests a candidate epigenetic regulatory module: under HS conditions, CHH-type hypermethylation occurs in the promoter region of PdeLOG3, suppressing its transcription and thereby reducing cytokinin synthesis and plant growth. Treatment with 5-AzaC reverses this repression through demethylation, restoring PdeLOG3 expression and cytokinin synthesis, and thereby enhancing adaptability to HS stress.
-
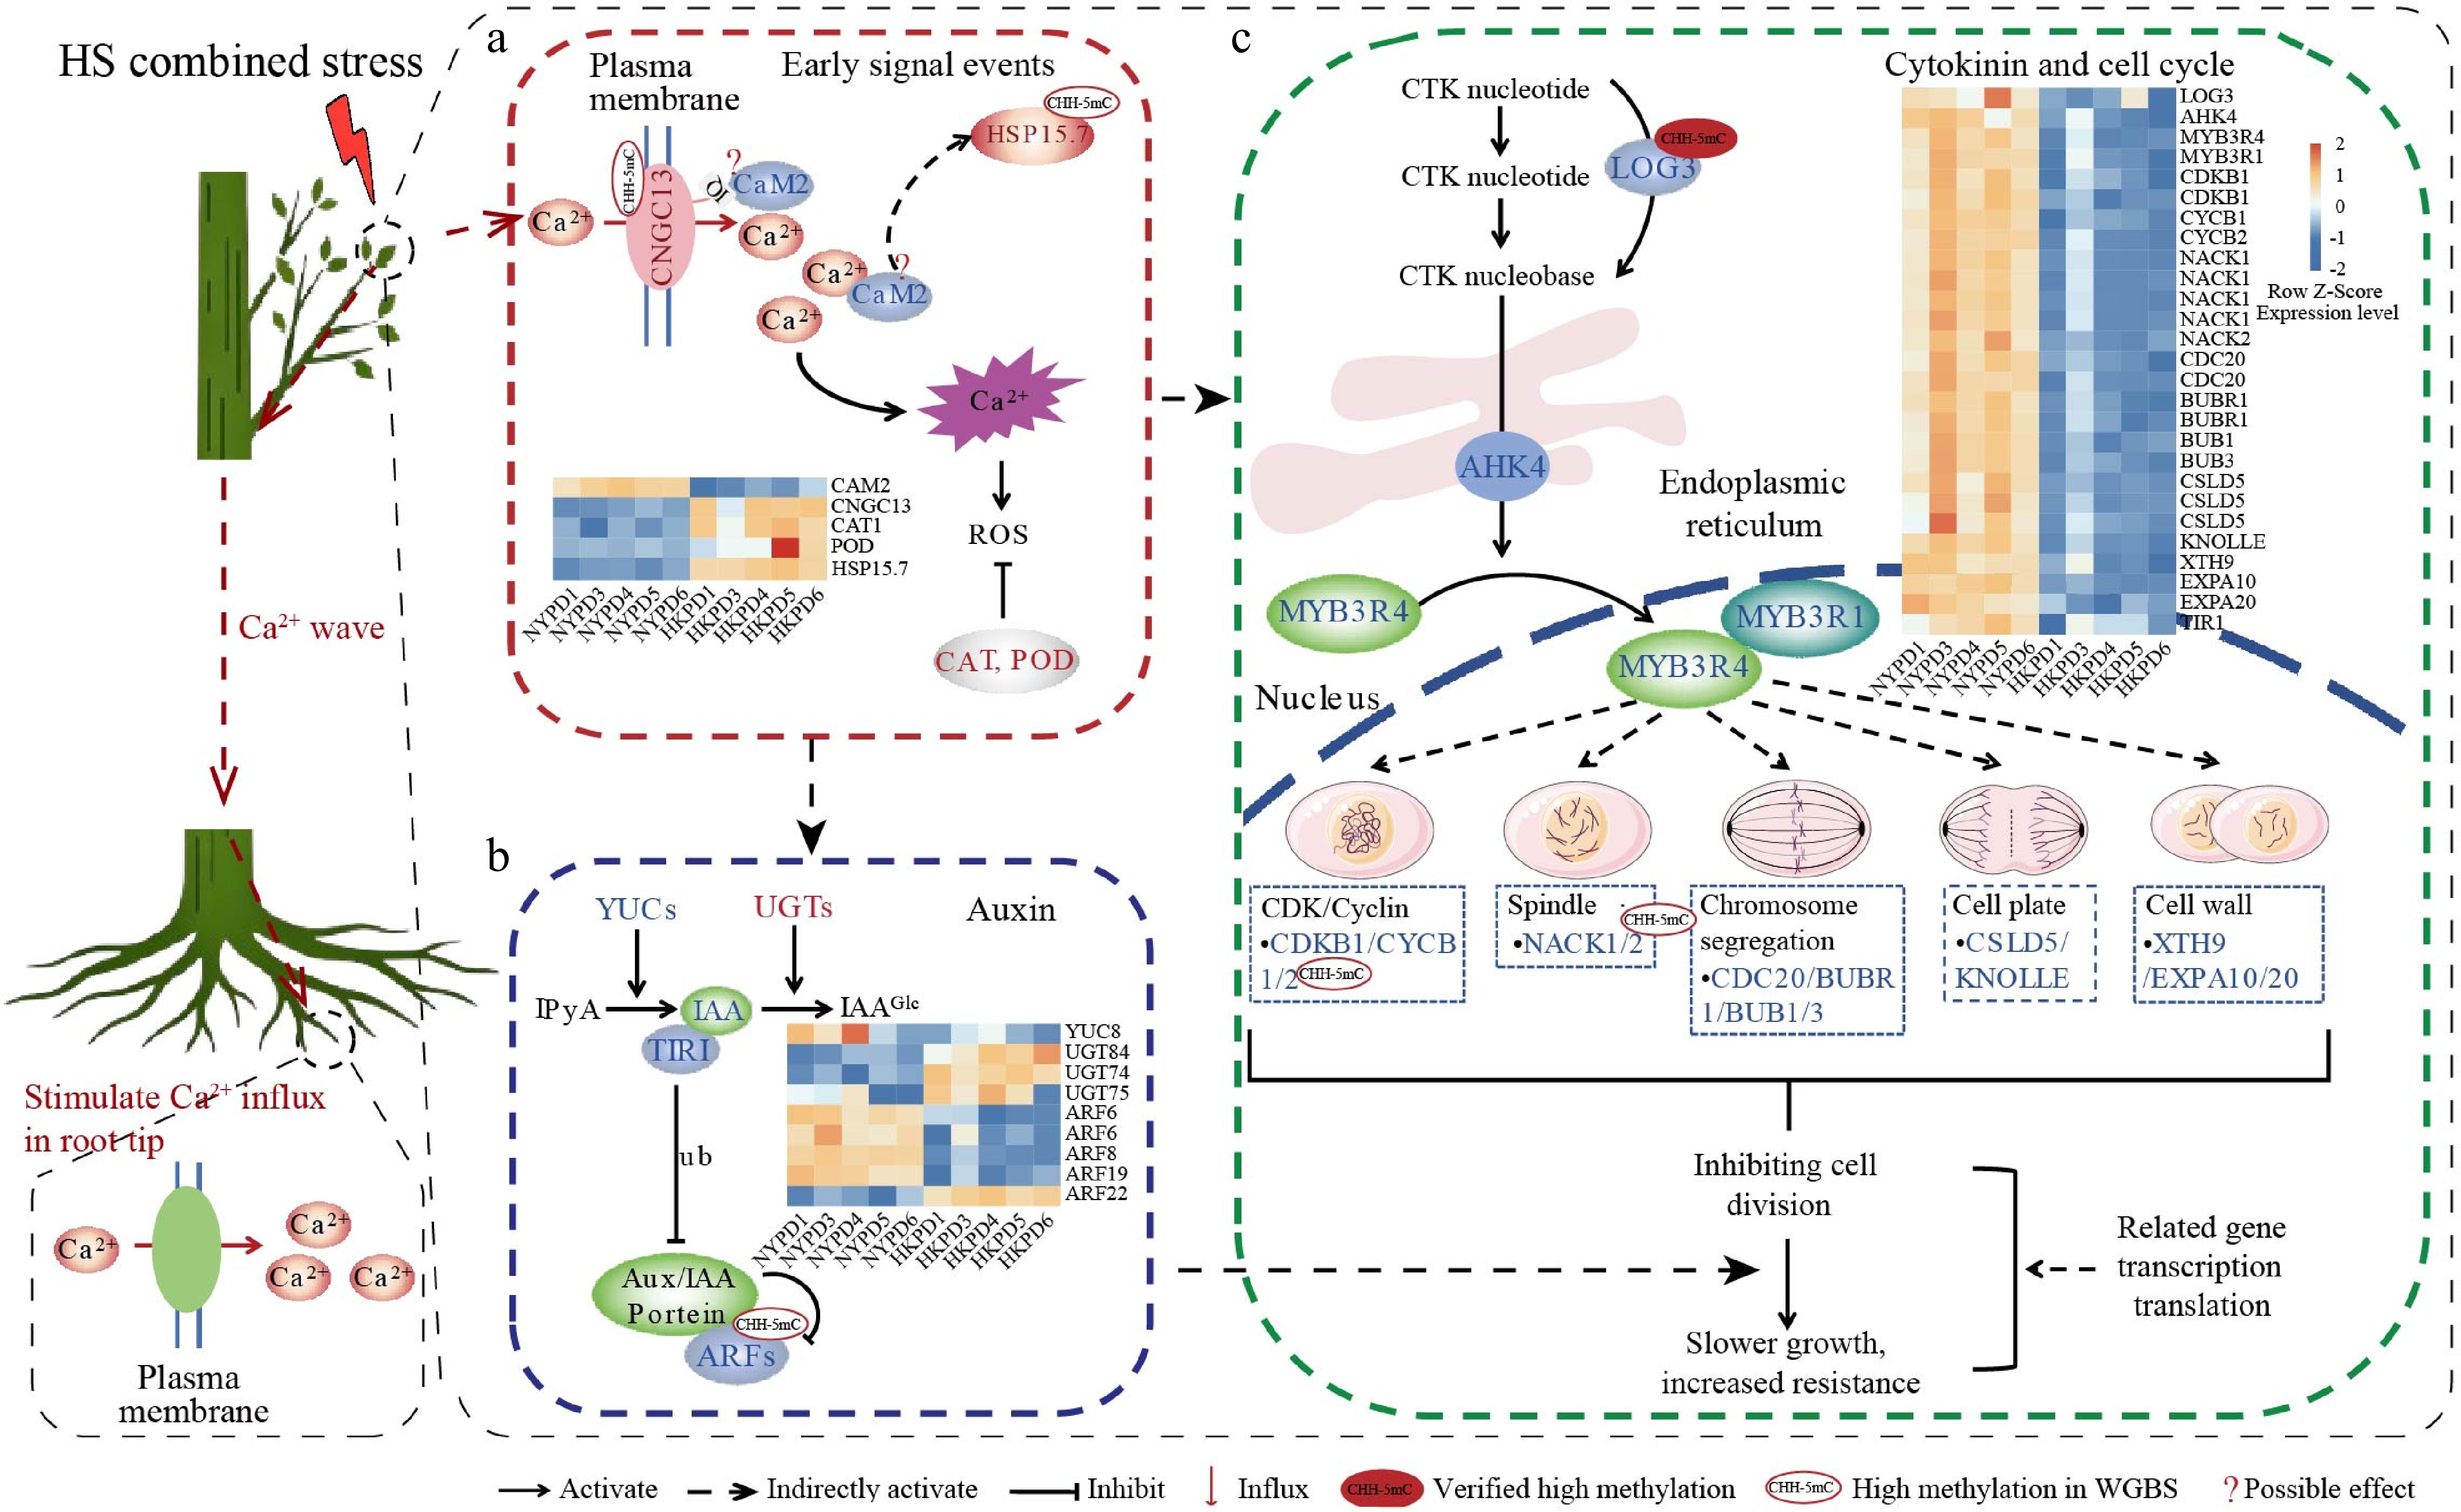
Figure 8.
A proposed molecular network of promoter CHH hypermethylation associated with the general response of P. deltoides to HK region stress environment. (a) Under HS stress, CHH hypermethylation in the promoter of PdeCNGC13 enhances its transcription, causing a sharp increase in intracellular Ca2+ levels. This triggers large-scale ROS production, which in turn activates CAT and POD to mitigate oxidative damage. Inhibited CaM2 releases its binding to the IQ motif at the C-terminus of PdeCNGC13, further activating Ca2+ influx channels. The Ca2+–CaM signaling system may also induce PdeHSP15.7 activity under HS stress. It should be noted that Ca2+ flux was measured in root tips and may reflect systemic signaling rather than direct changes in leaf tissues. (b) Early signal stimulation suppresses auxin biosynthesis. Inhibited YUCs reduce IAA synthesis from the IPyA precursor, while highly expressed UGTs glycosylate IAA into IAAGlc, collectively lowering auxin levels. Inhibited TIR1 reduces its binding to IAA and Aux/IAA proteins, resulting in increased Aux/IAA–ARF complexes that block ARF-mediated transcription. (c) Early signal stimulation and reduced auxin biosynthesis jointly suppress cell division and growth. Promoter CHH hypermethylation of PdeLOG3 represses its transcription, limiting the conversion of cytokinin nucleotides to nucleobases. Cytokinin transport is further reduced by AHK4 in the endoplasmic reticulum, decreasing active cytokinin levels. Short photoperiod stress suppresses the nuclear translocation of MYB3R4, while reduced activity of MYB3R1 and MYB3R4 diminishes downstream regulation of cell cycle genes (CDKB1, CYCB1/2), spindle formation (NACK1/2), chromosome segregation (CDC20, BUBR1, BUB1/3), cell plate formation (CSLD5, KNOLLE), and cell wall formation (XTH9, EXPA10/20), thereby inhibiting cell division and growth. Abbreviations: CNGC13, Cyclic nucleotide-gated ion channel 13; CaM2, Calmodulin-2; HSP15.7, Heat Shock Protein 15.7; YUCs, YUCCA; UGTs, UDP-glucosyltransferase; TIR1, Transport Inhibitor Response 1; IPyA, Indole-3-pyruvic acid; IAA, Indole-3-acetic acid; IAAGlc, Indole-3-acetic acid-β-D-glucoside; LOG3, Lonely Guy 3; AHK4, Arabidopsis histidine kinase 4; MYB3R1, MYB domain protein 3R1; MYB3R4, MYB domain protein 3R4; CDKB1, Cyclin-dependent kinase B1; CYCB1/2, Cyclin B1/B2; NACK1/2, Kinesin-like protein NACK1/2; CDC20, Cell division cycle 20; BUBR1, Mitotic spindle checkpoint protein BUBR1; BUB1/3, Mitotic checkpoint serine/threonine kinases BUB1/3; CSLD5, Cellulose synthase-like D5; XTH9, Xyloglucan endotransglucosylase/hydrolase 9; EXPA10/20, Expansin A10/A20; ub, ubiquitination.
Figures
(8)
Tables
(0)