-
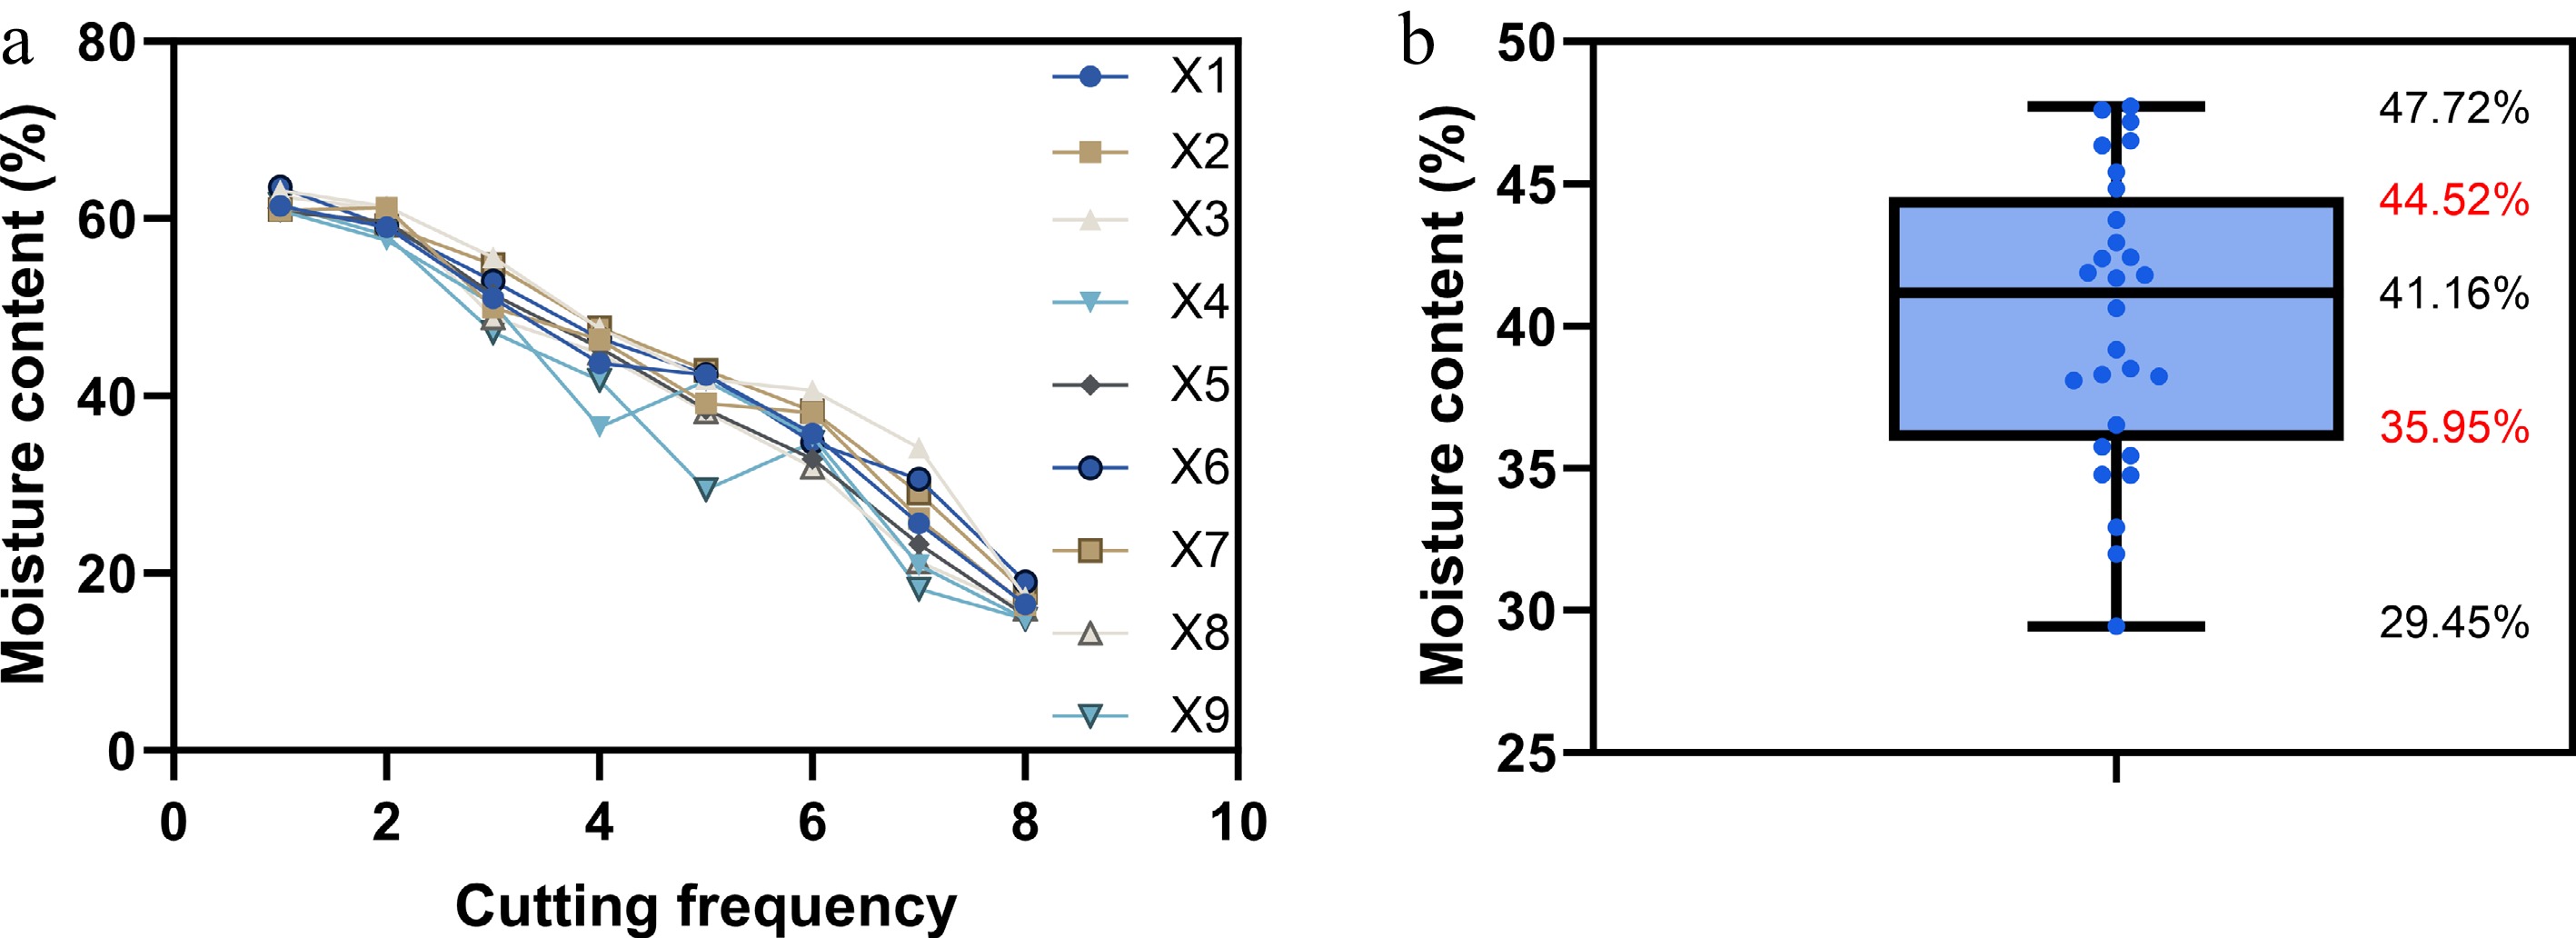
Figure 1.
(a) Trend of moisture content change, and (b) the moisture content range of CR-F.
-
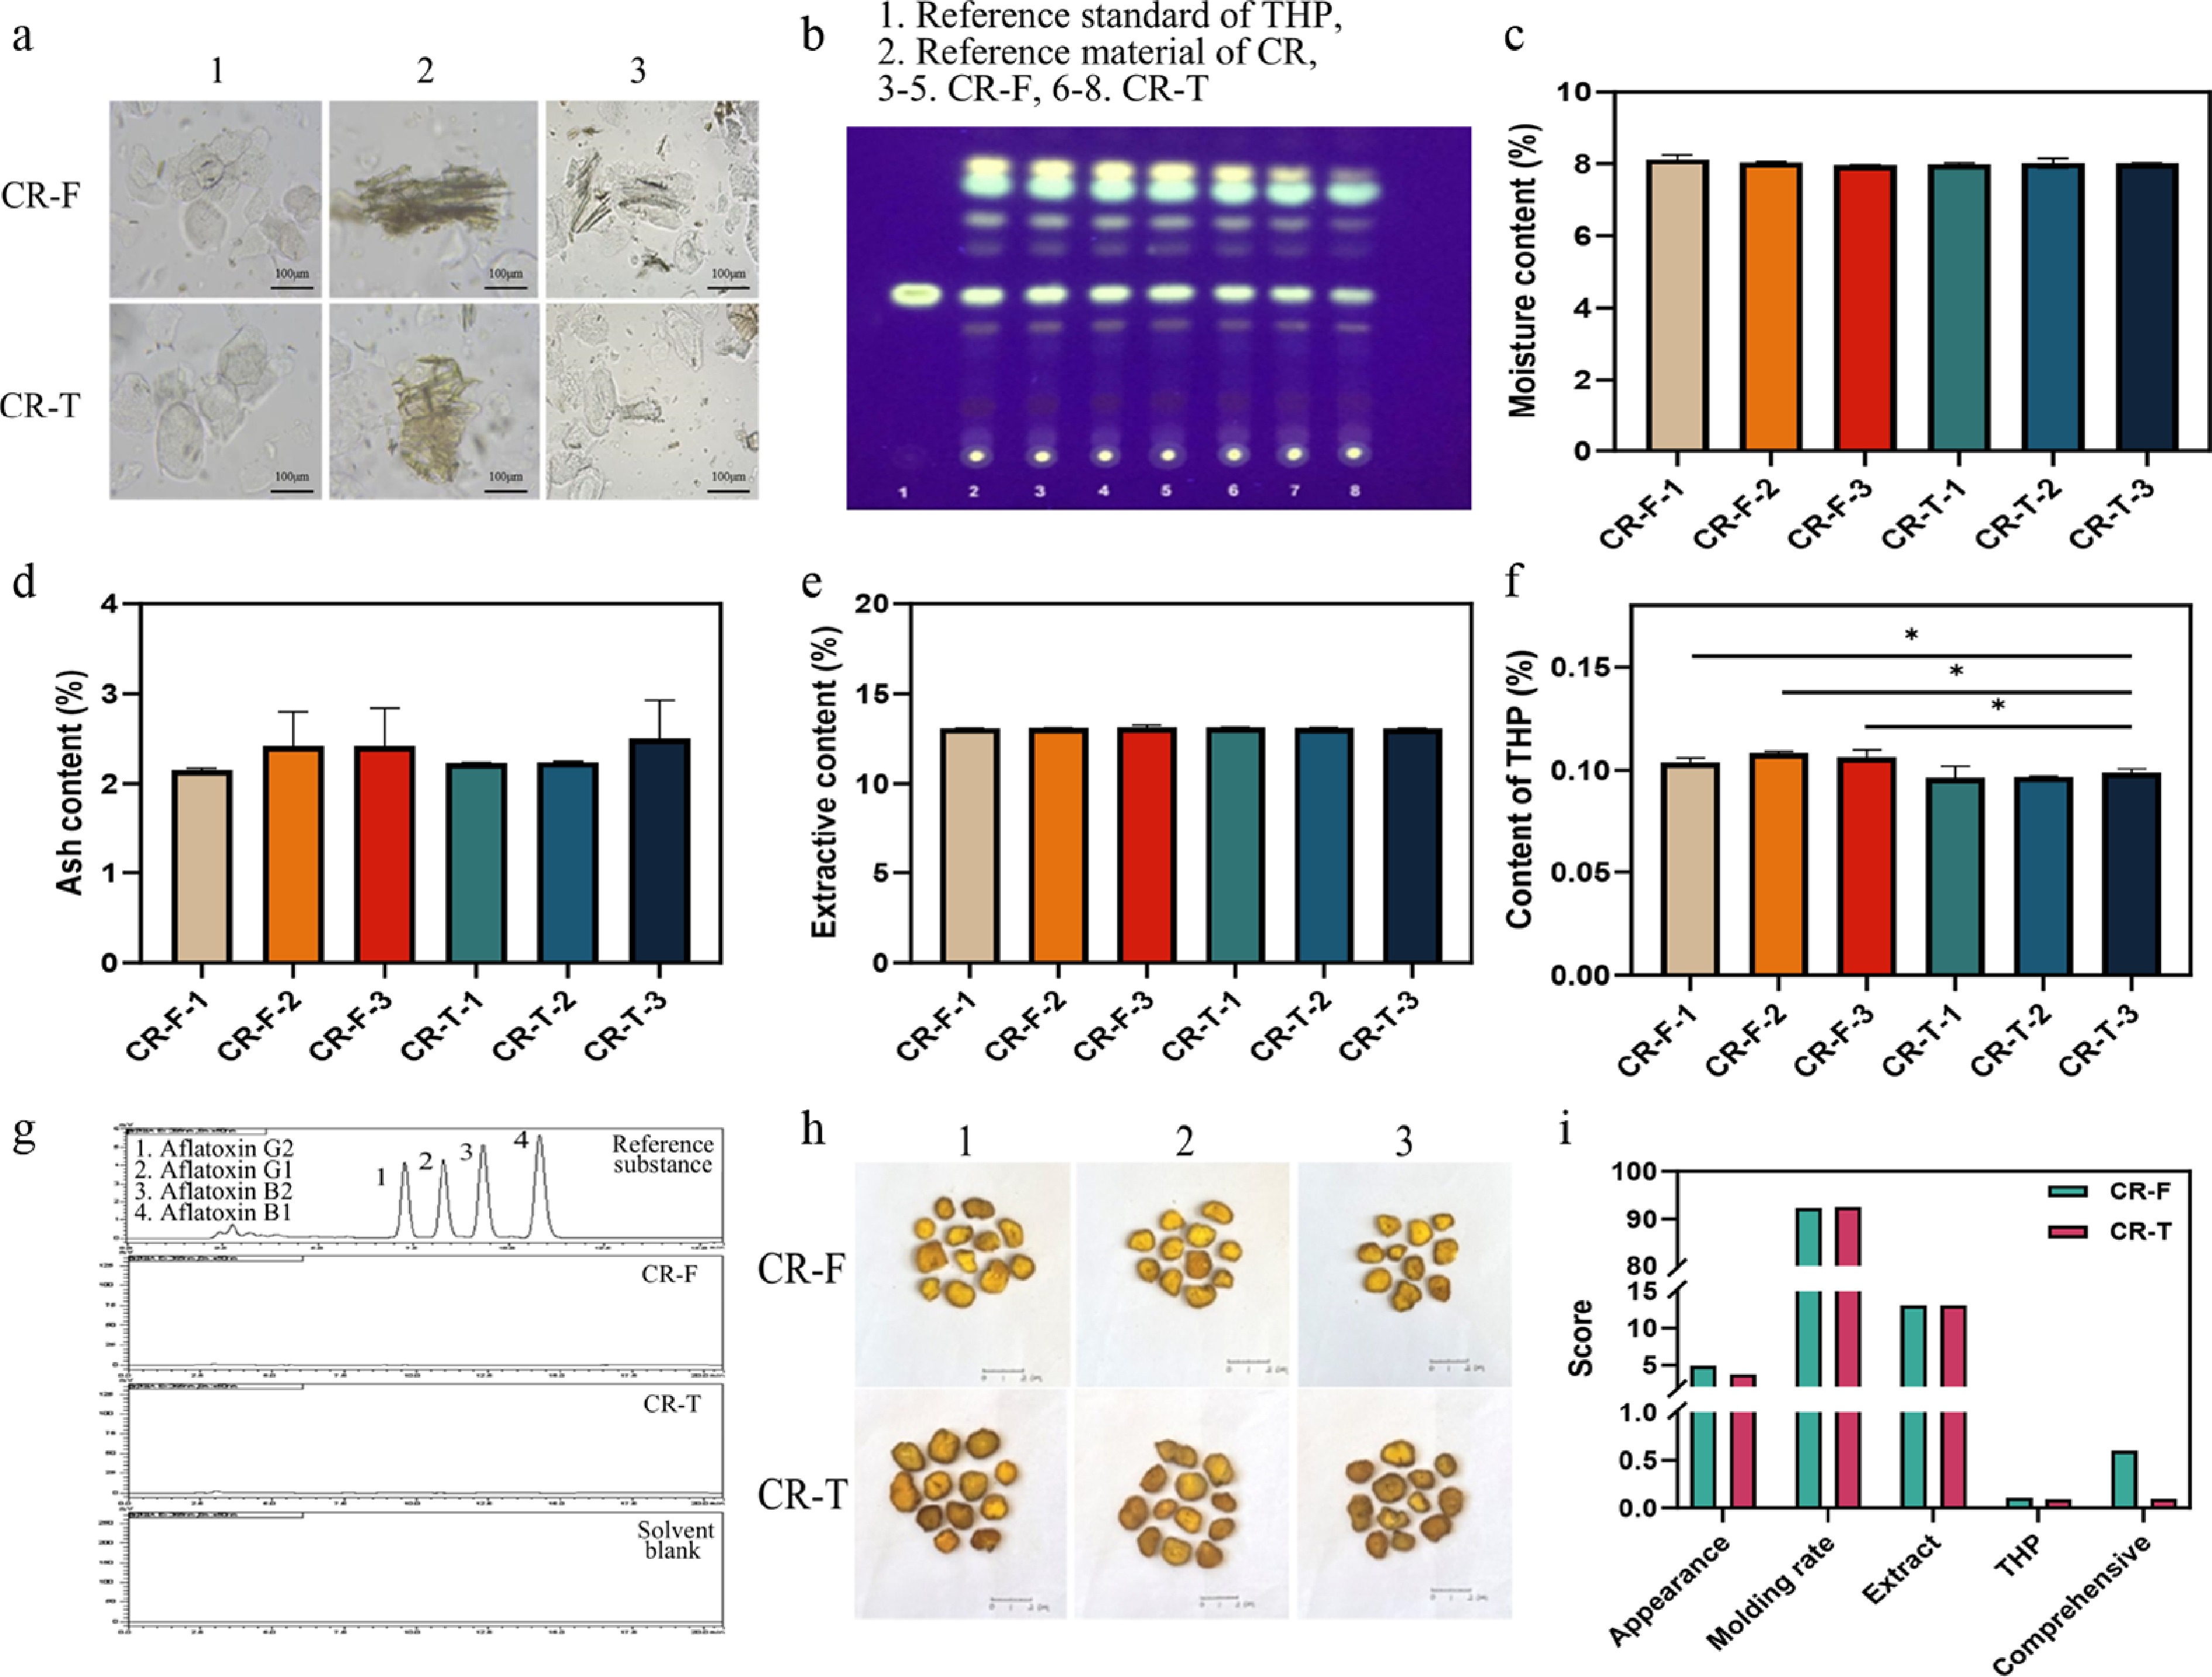
Figure 2.
The effect of fresh cutting and traditional processing on the quality of CR. (a) Microscopic identification characteristics of powder. (b) Thin layer chromatogram. (c) Moisture content. (d) Ash content. (e) Extractive content. (f) THP content. (g) HPLC chromatogram of aflatoxin. (h) Appearance characteristics. (i) Comprehensive score. Data are expressed as the mean ± SD (n = 3).
-
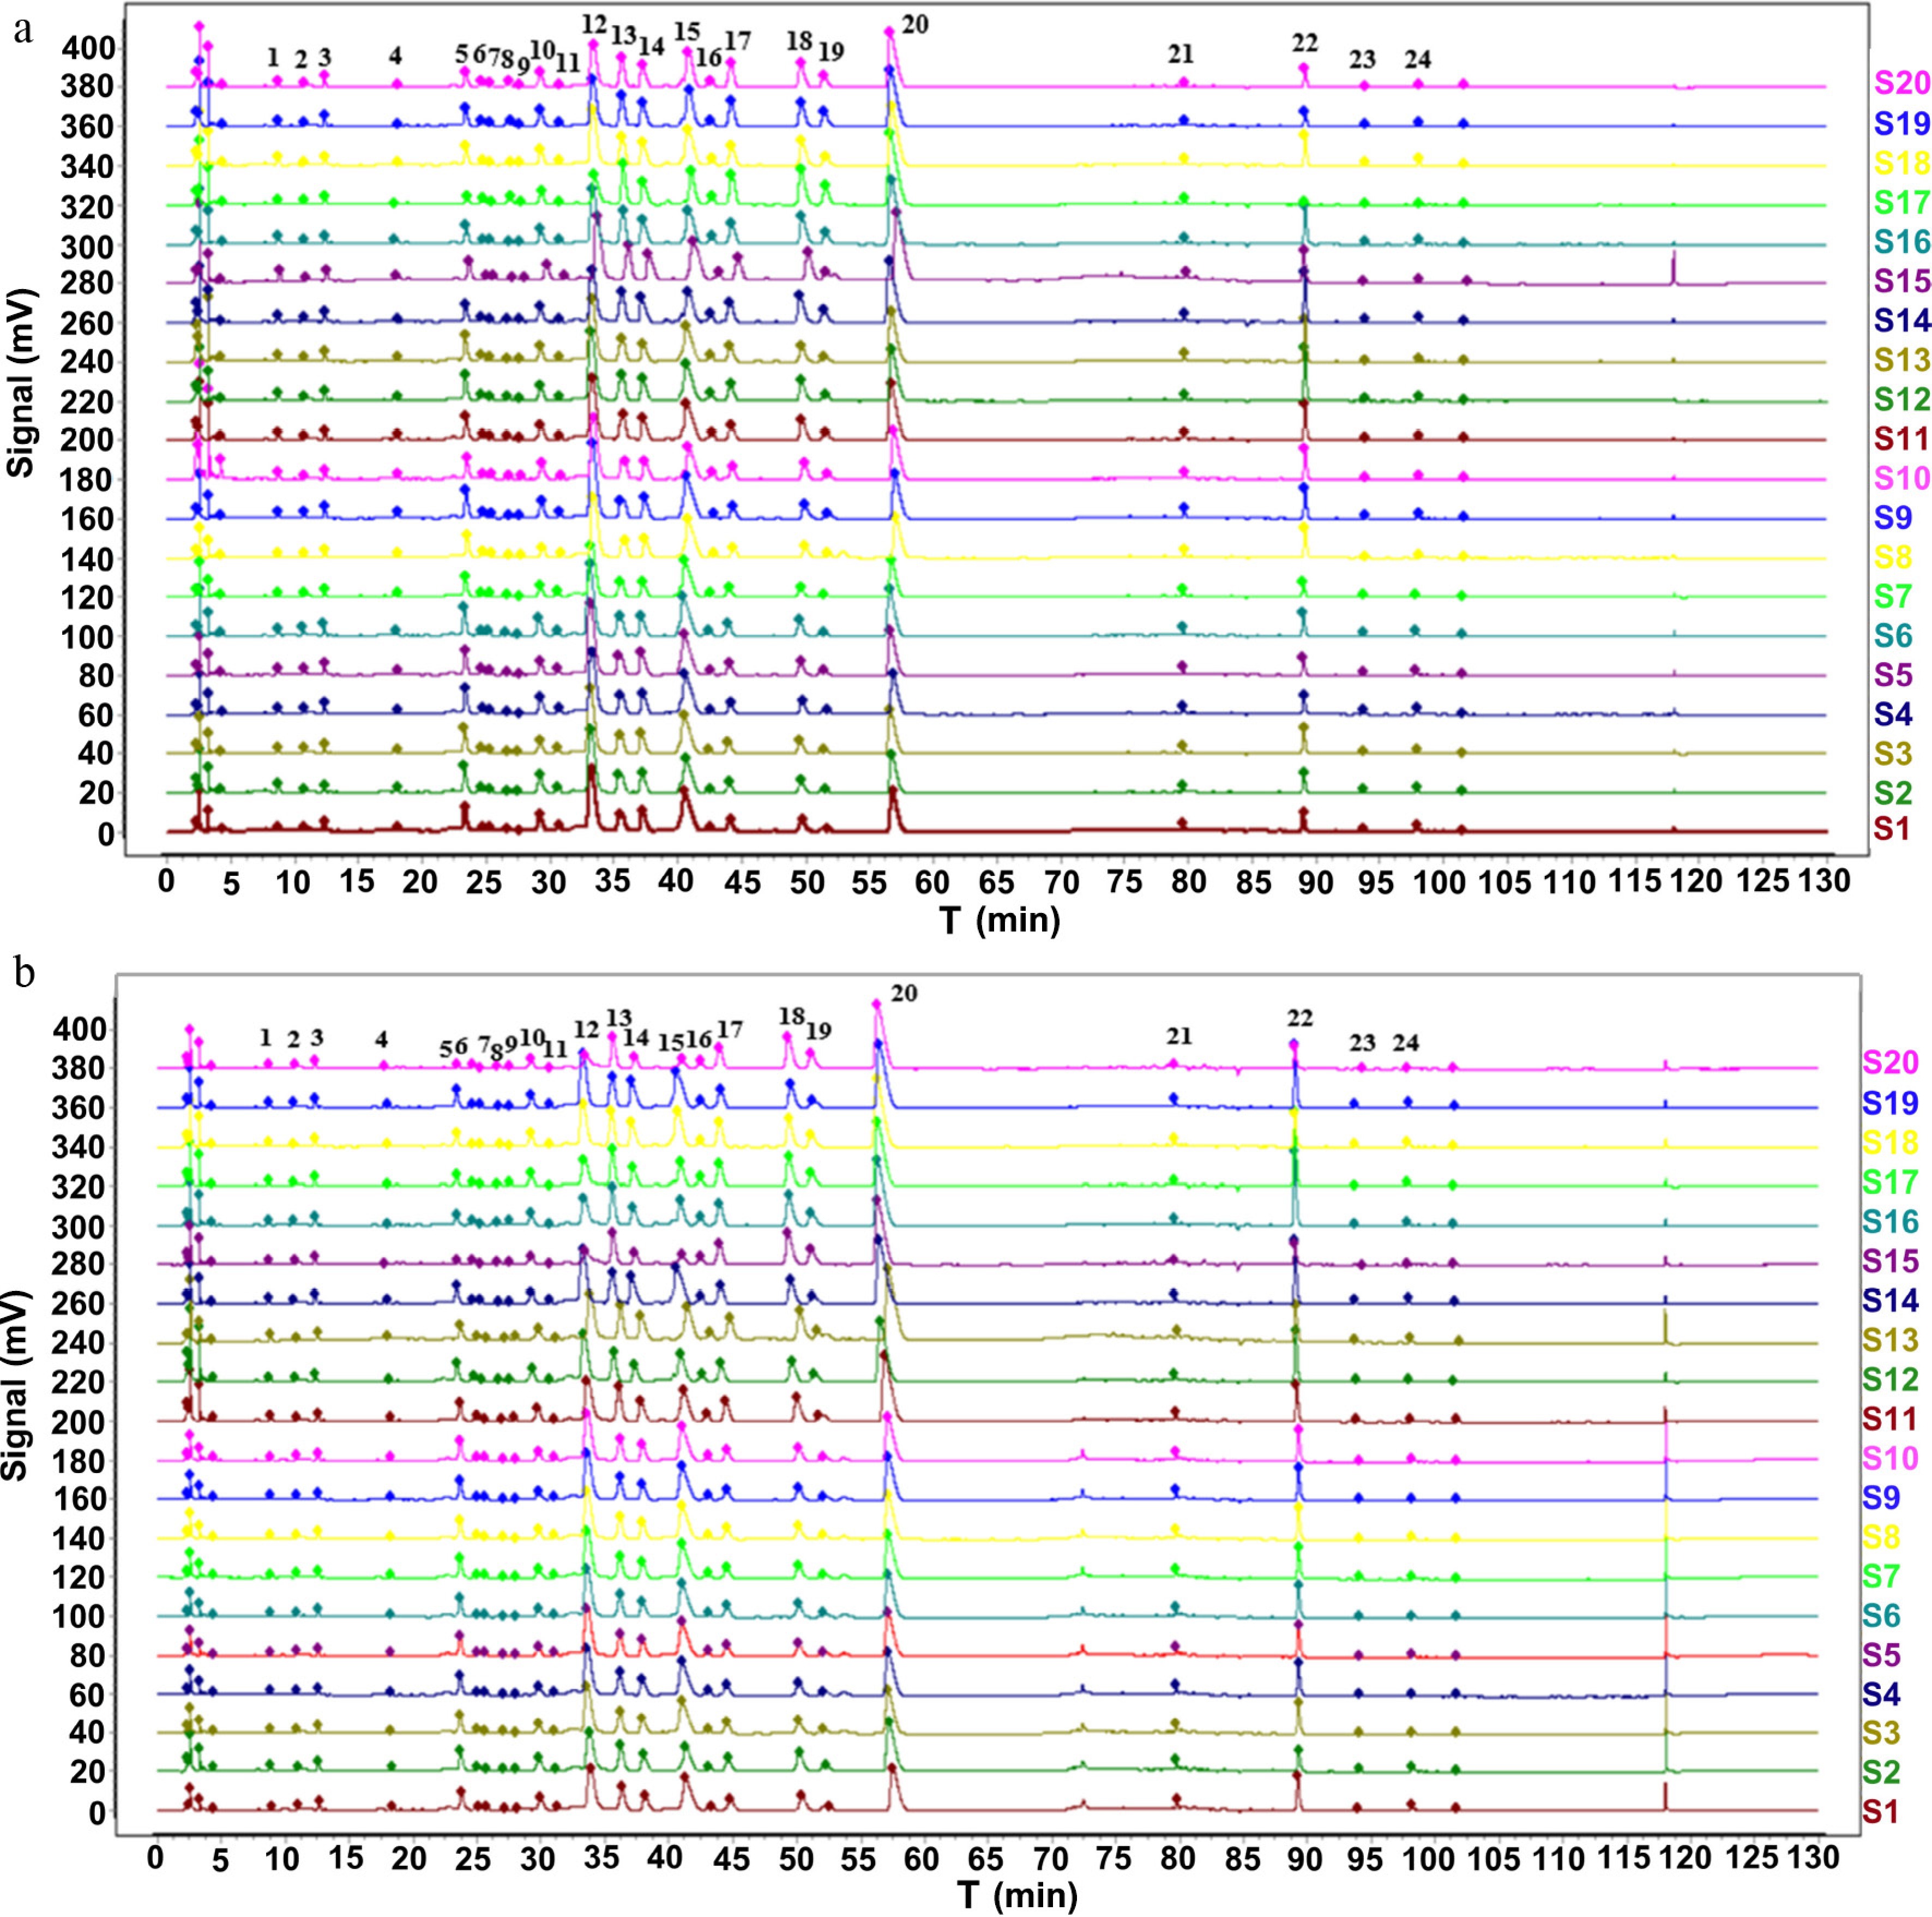
Figure 3.
Fingerprint spectrum of 20 batches of (a) CR-F and (b) CR-T pieces.
-
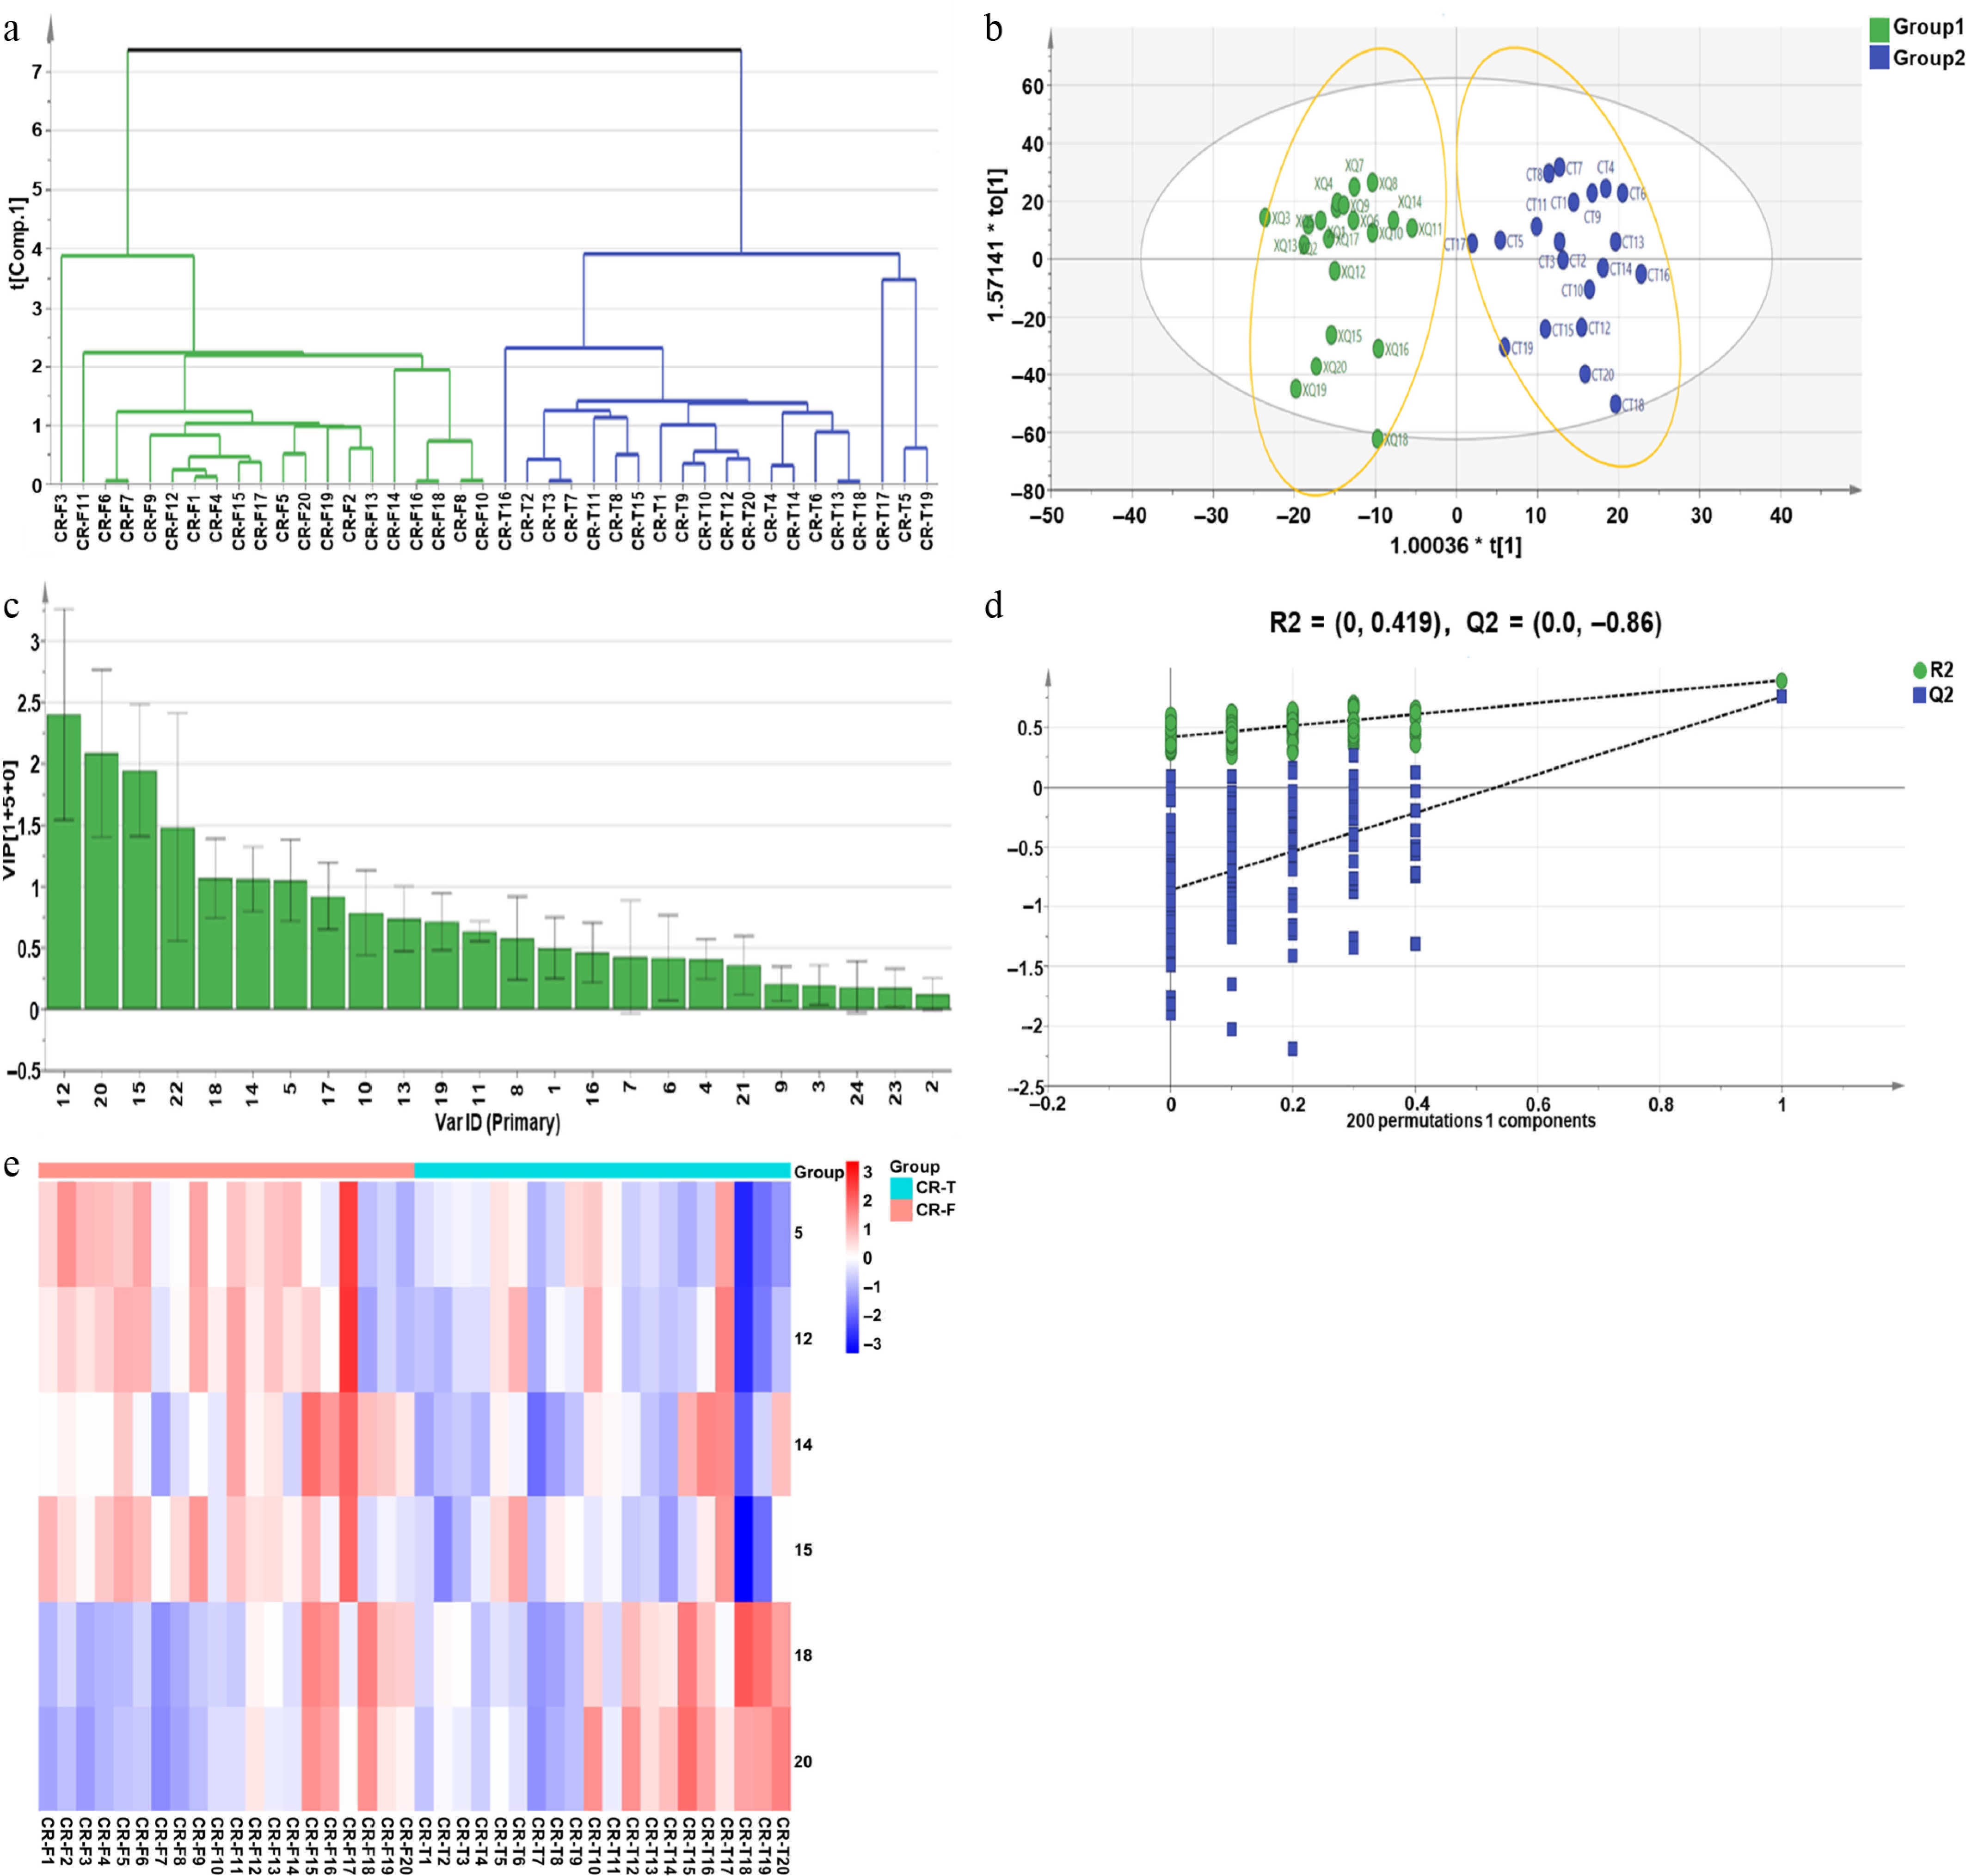
Figure 4.
Differential component analysis of CR-F and CR-T. (a) HCA. (b) OPLS-DA score chart. (c) VIP distribution map of the OPLS-DA model. (d) Permutation detection of the OPLS-DA model. (e) Heatmap analysis.
-
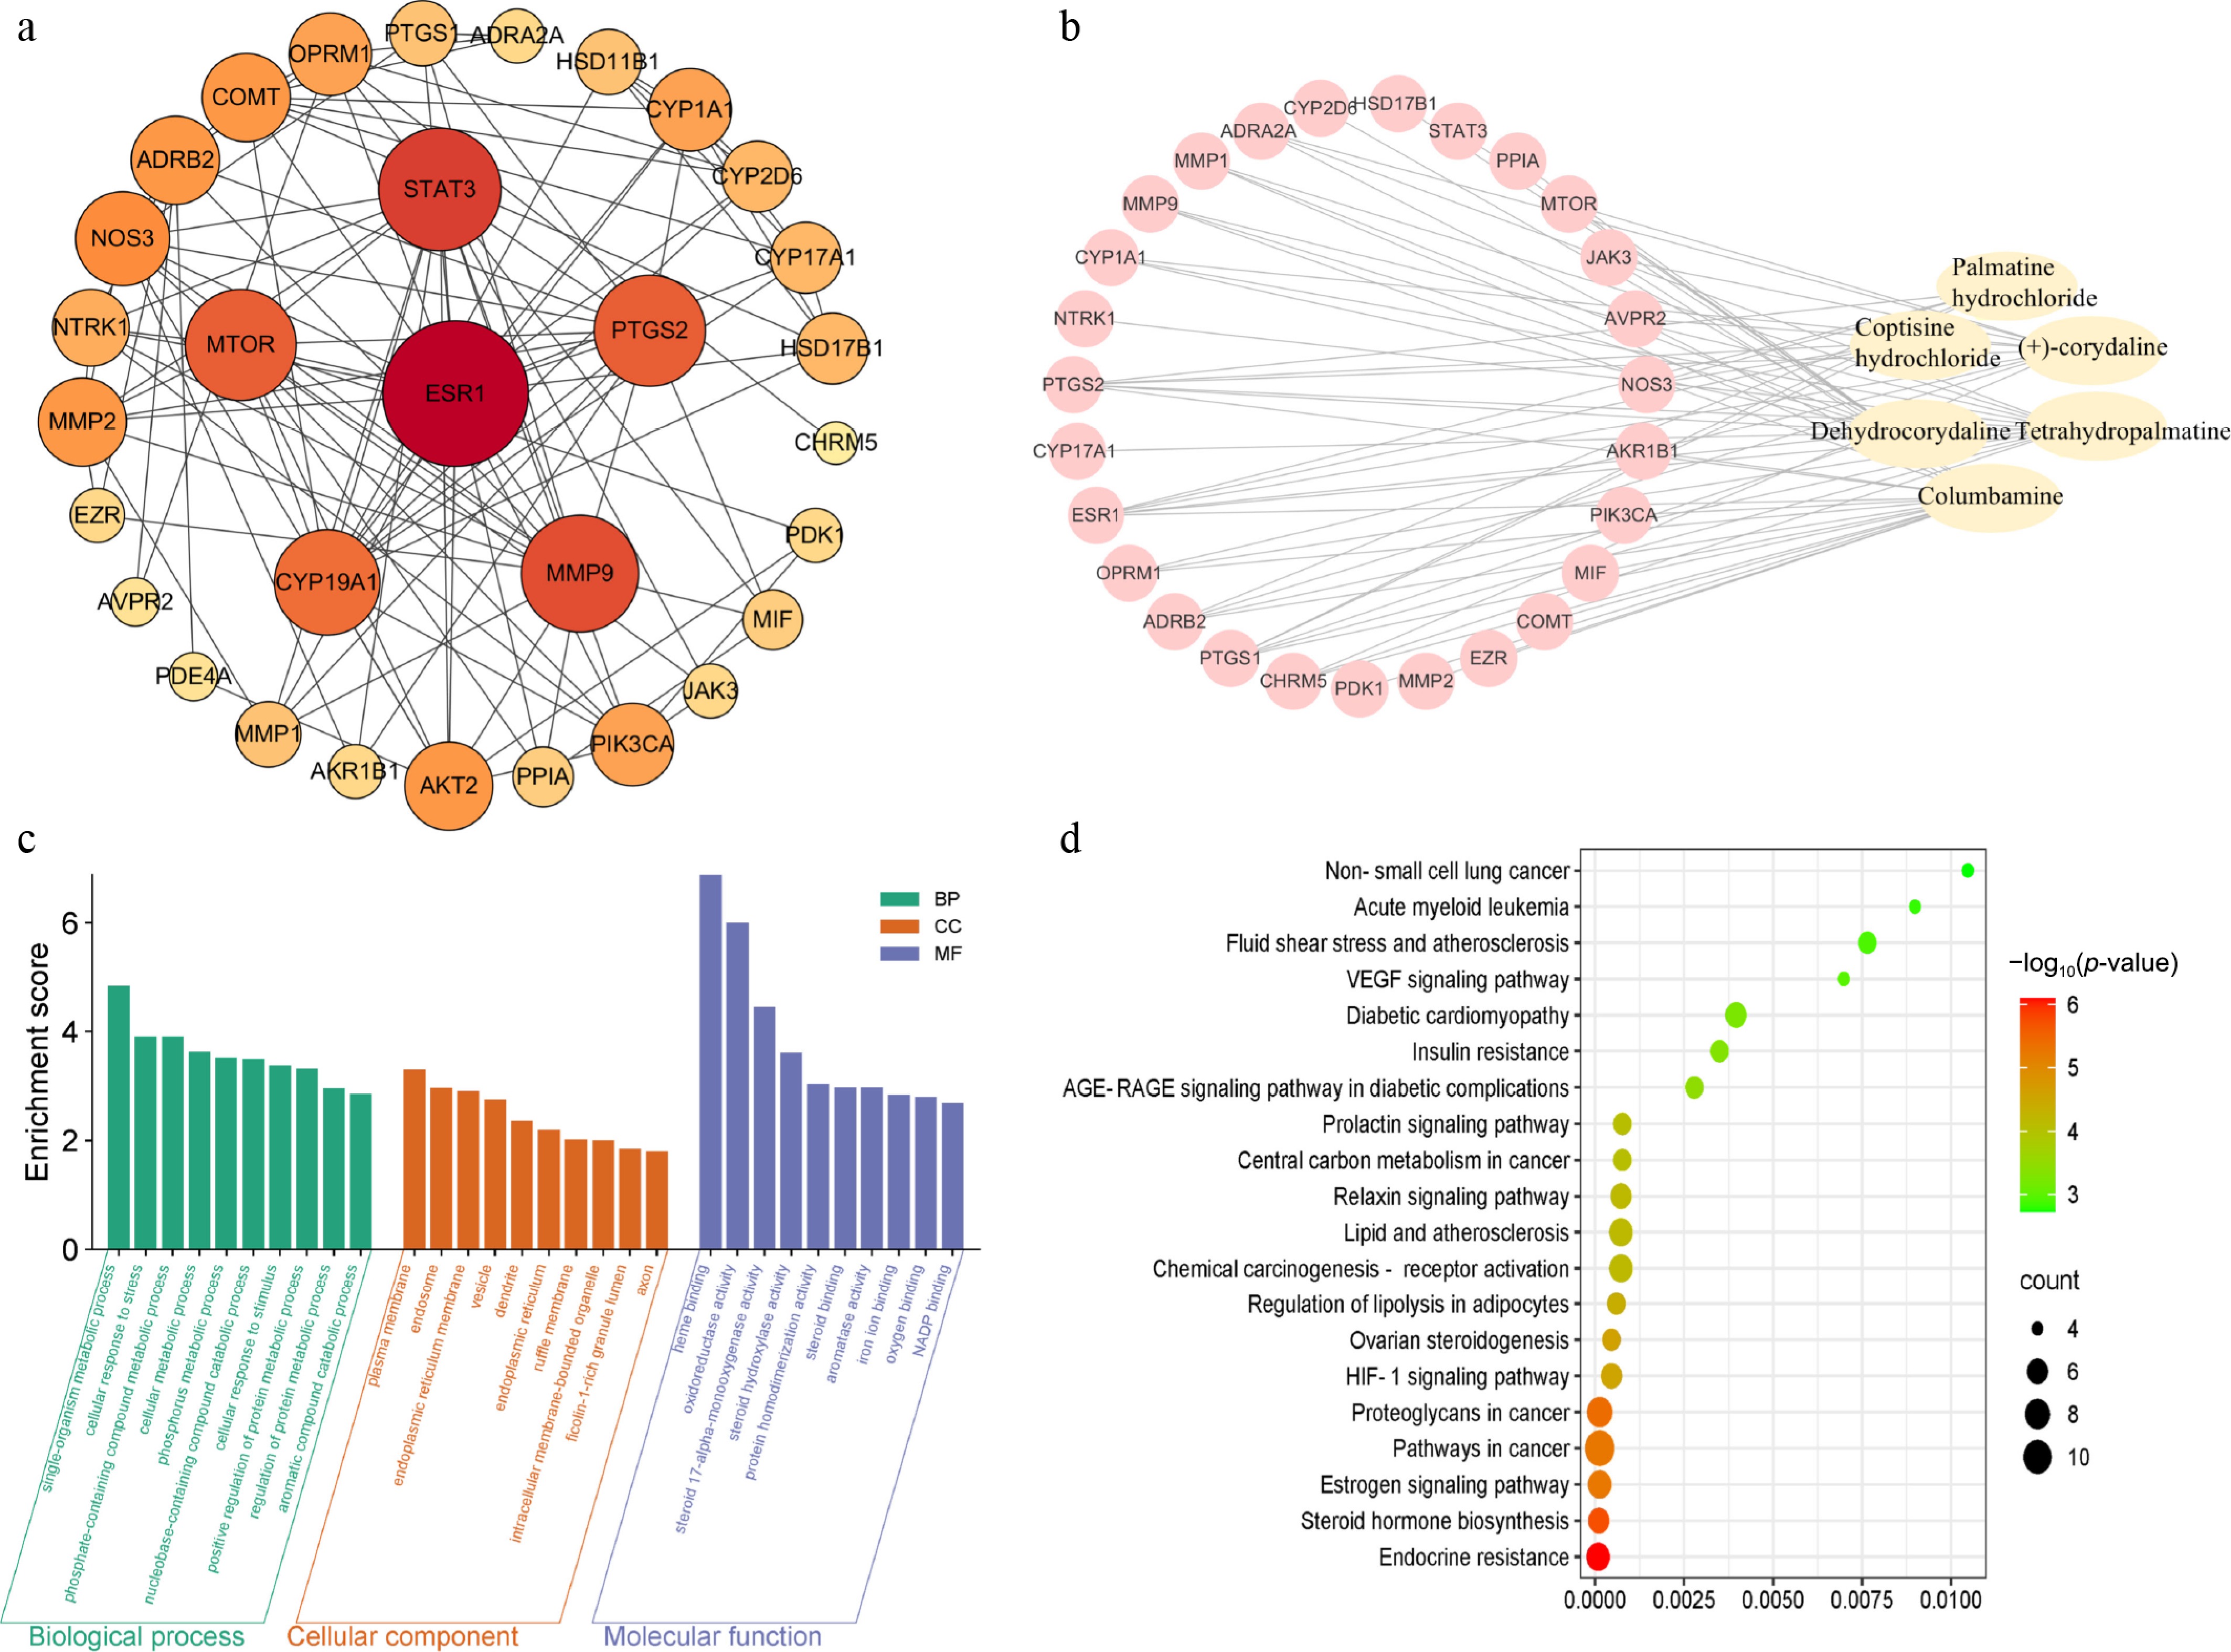
Figure 5.
Network pharmacology analysis of differential components between CR-F and CR-T. (a) PPI network of differential components targets. (b) Network diagram of 'differential components-core targets'. (c) GO analysis of core targets. (d) KEGG pathway enrichment analysis of core targets.
-
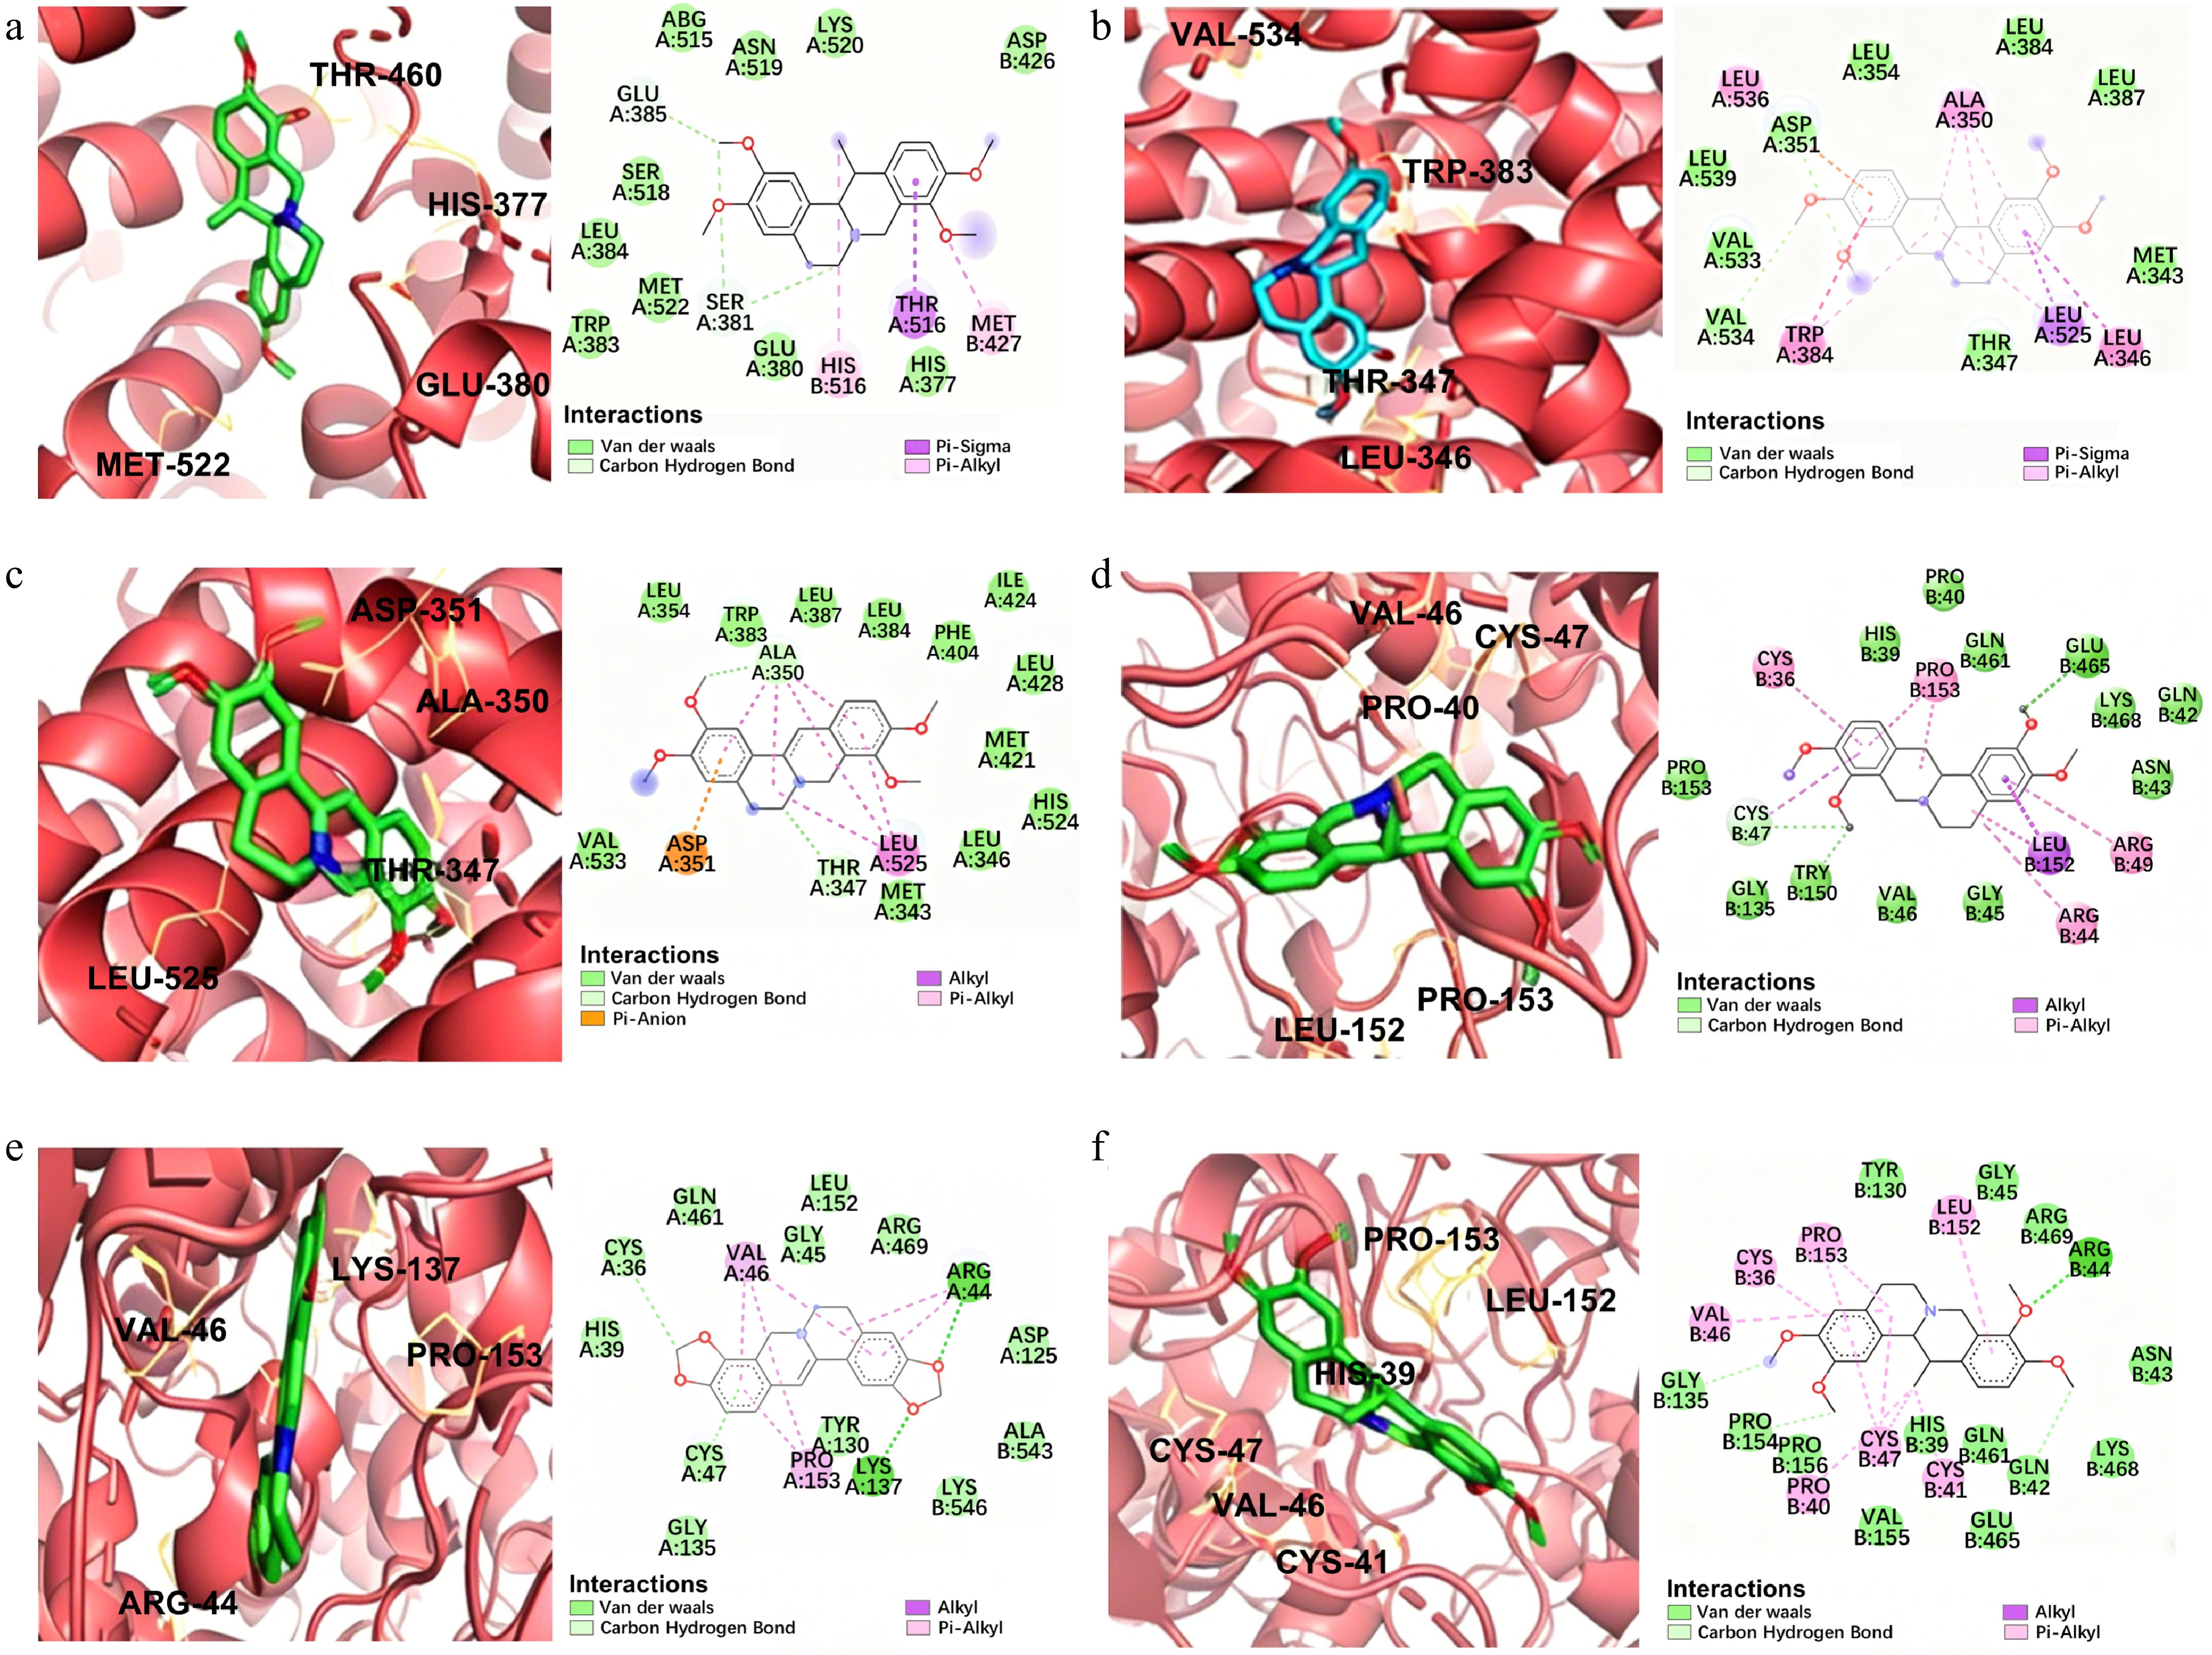
Figure 6.
Molecular docking of active ingredients with key target molecules. (a) 3D and 2D conformation of dehydrocorydaline and ESR1. (b) 3D and 2D conformation of tetrahydropalmatine and ERS1. (c) 3D and 2D conformation of palmatine hydrochloride and ERS1. (d) 3D and 2D conformation of columbamine and PTGS2. (e) 3D and 2D conformation of coptisine hydrochloride and PTGS2. (f) 3D and 2D conformation of (+)-corydaline and PTGS2.
-
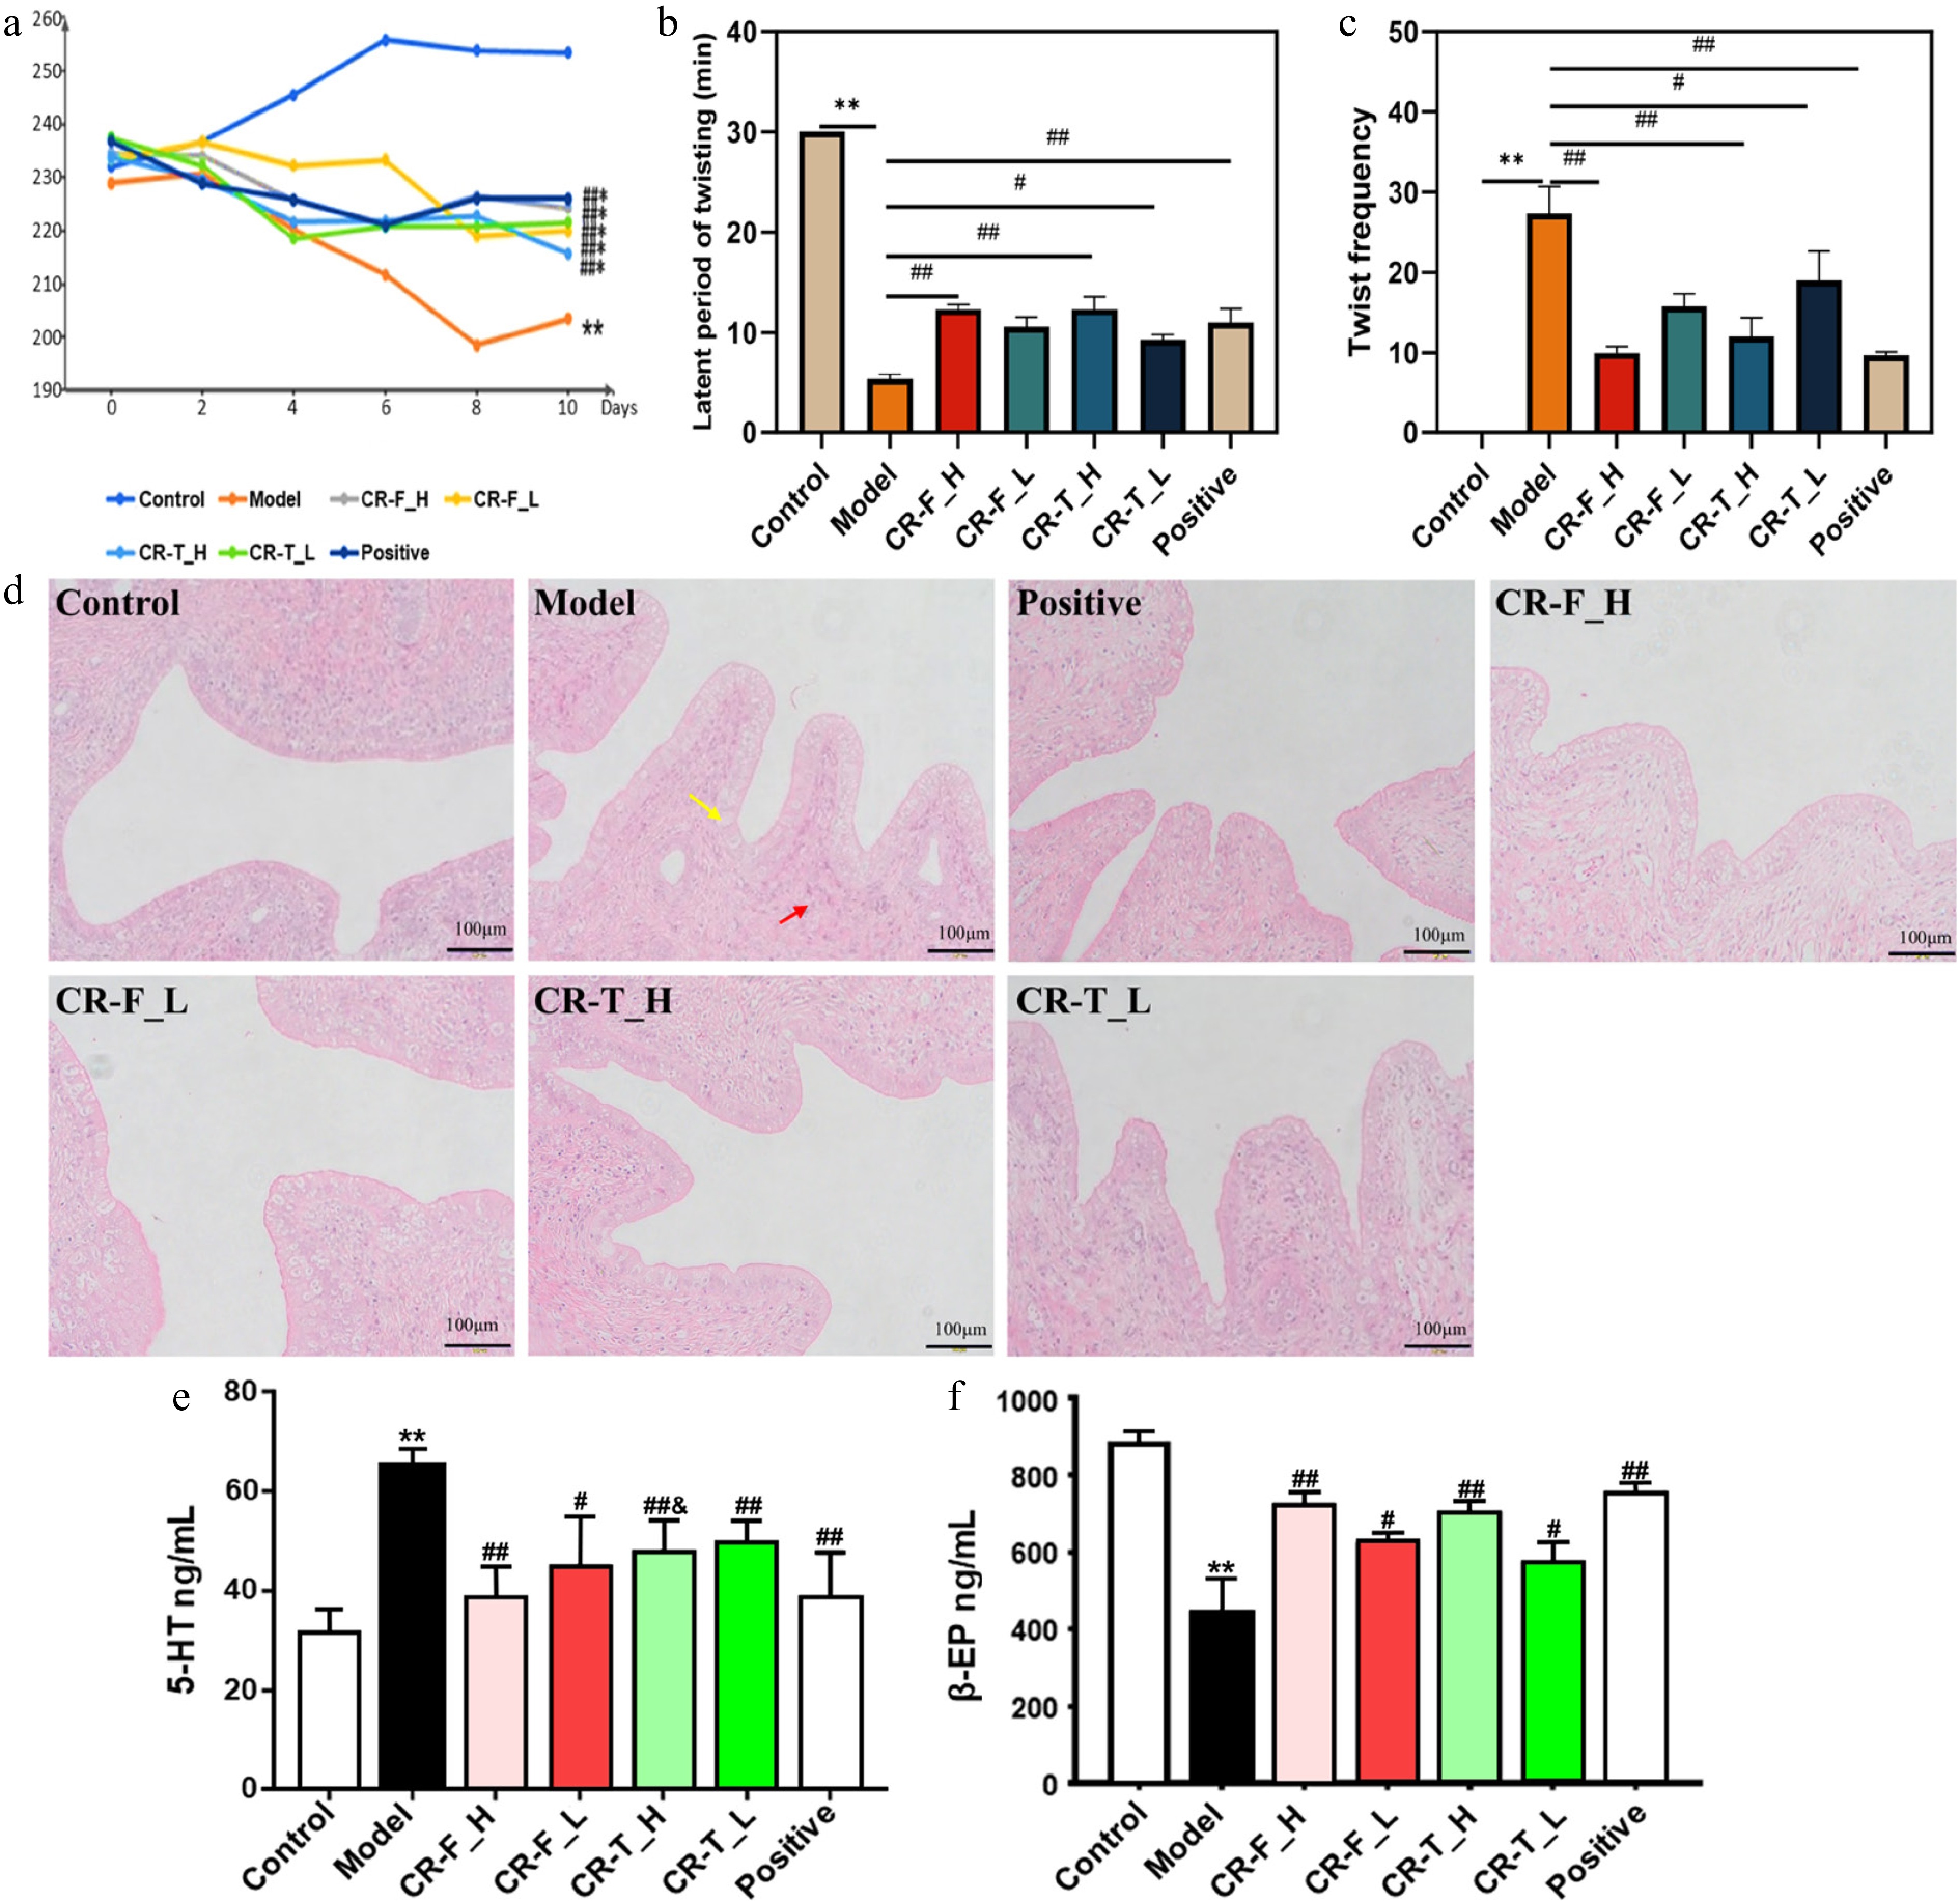
Figure 7.
The effects of CR-F and CR-T on (a) body weight, (b) latent period of twisting, (c) twist frequency, (d) pathological sections of the uterus, (e) 5-HT, and (f) β-EP in the serum of dysmenorrhea rats. Data are expressed as the mean ± SD (n = 8). *, p < 0.05 and **, p < 0.01 significantly different from control; #, p < 0.05 and ##, p < 0.01 significantly different from model; &, p < 0.05 significantly different from CR-F_H. Yellow arrows represent vacuolar degeneration or necrotic shedding, red arrows represent inflammatory cell infiltration.
-
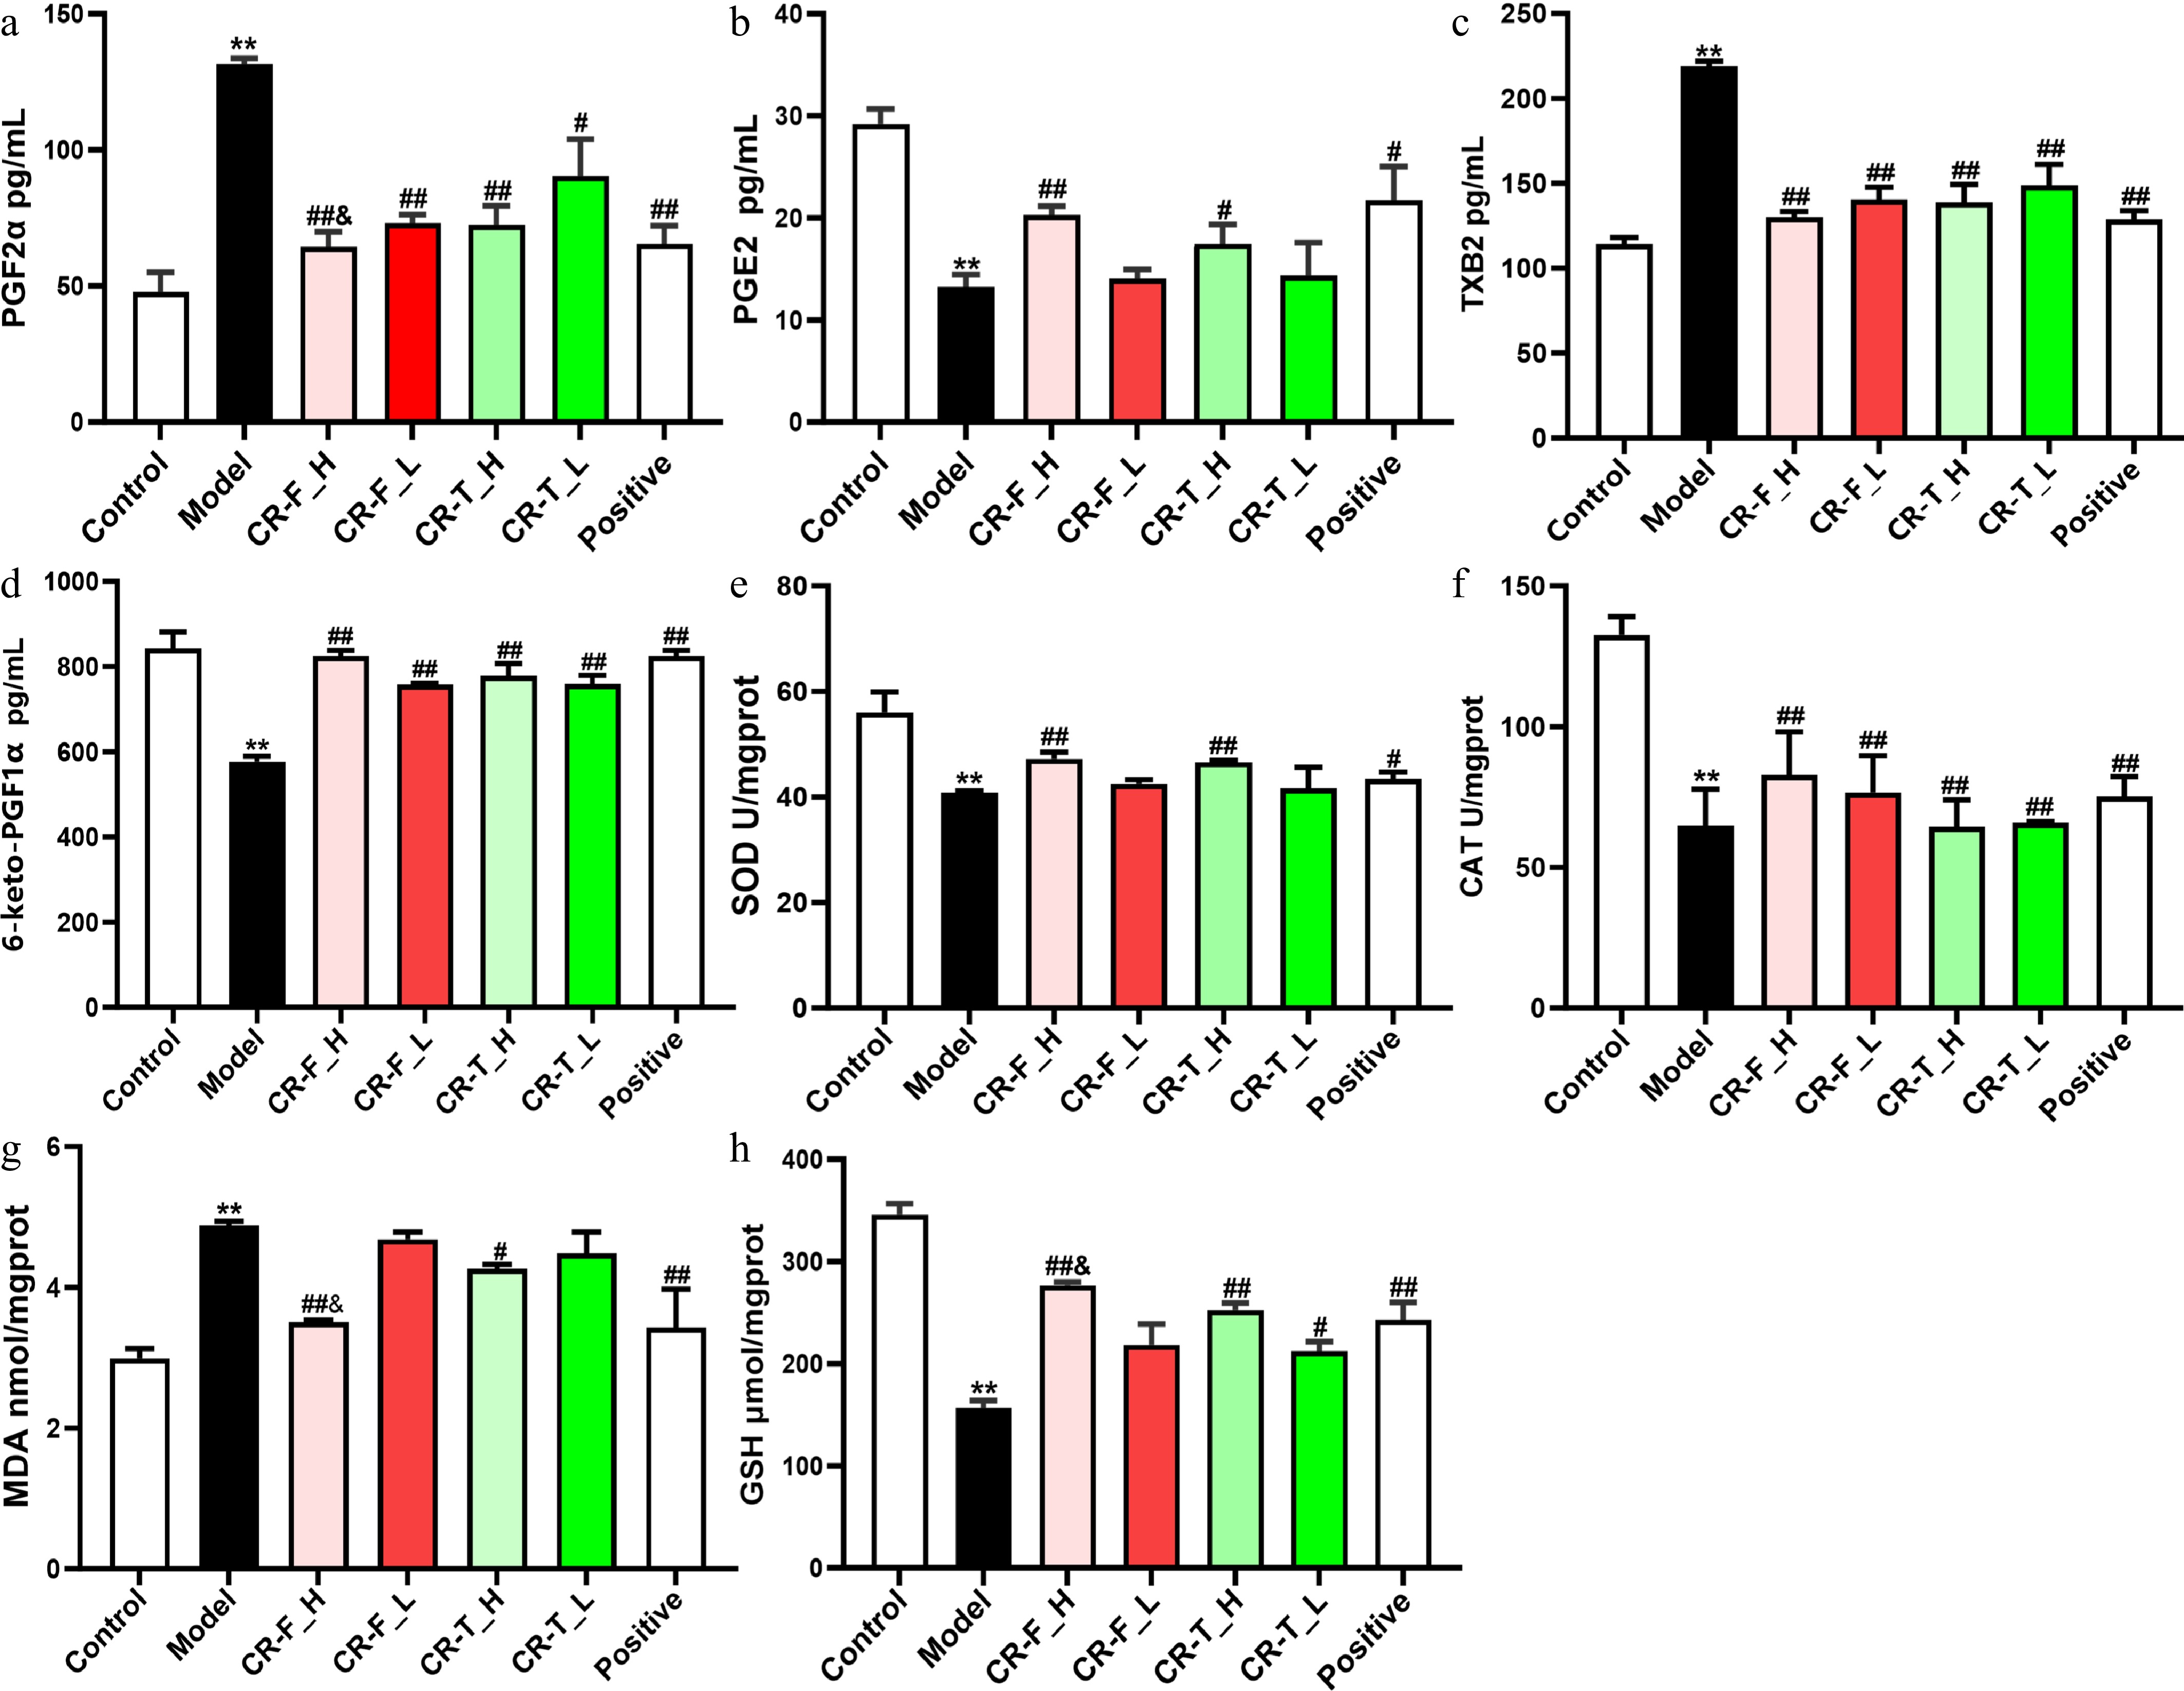
Figure 8.
The effects of CR-F and CR-T on biochemical indicators in the uterus of dysmenorrhea rats. (a) PGF2α, (b) PGE2, (c) TXB2, (d) 6-Keto-PGF1α, (e) SOD, (f) CAT, (g) MDA, (h) GSH. Data are expressed as the mean ± SD (n = 8). *, p < 0.05 and **, p < 0.01, significantly different from control; #, p < 0.05 and ##, p < 0.01, significantly different from model. &, p < 0.05 and &&, p < 0.01, significantly different from CR-T_H.
Figures
(8)
Tables
(0)