-
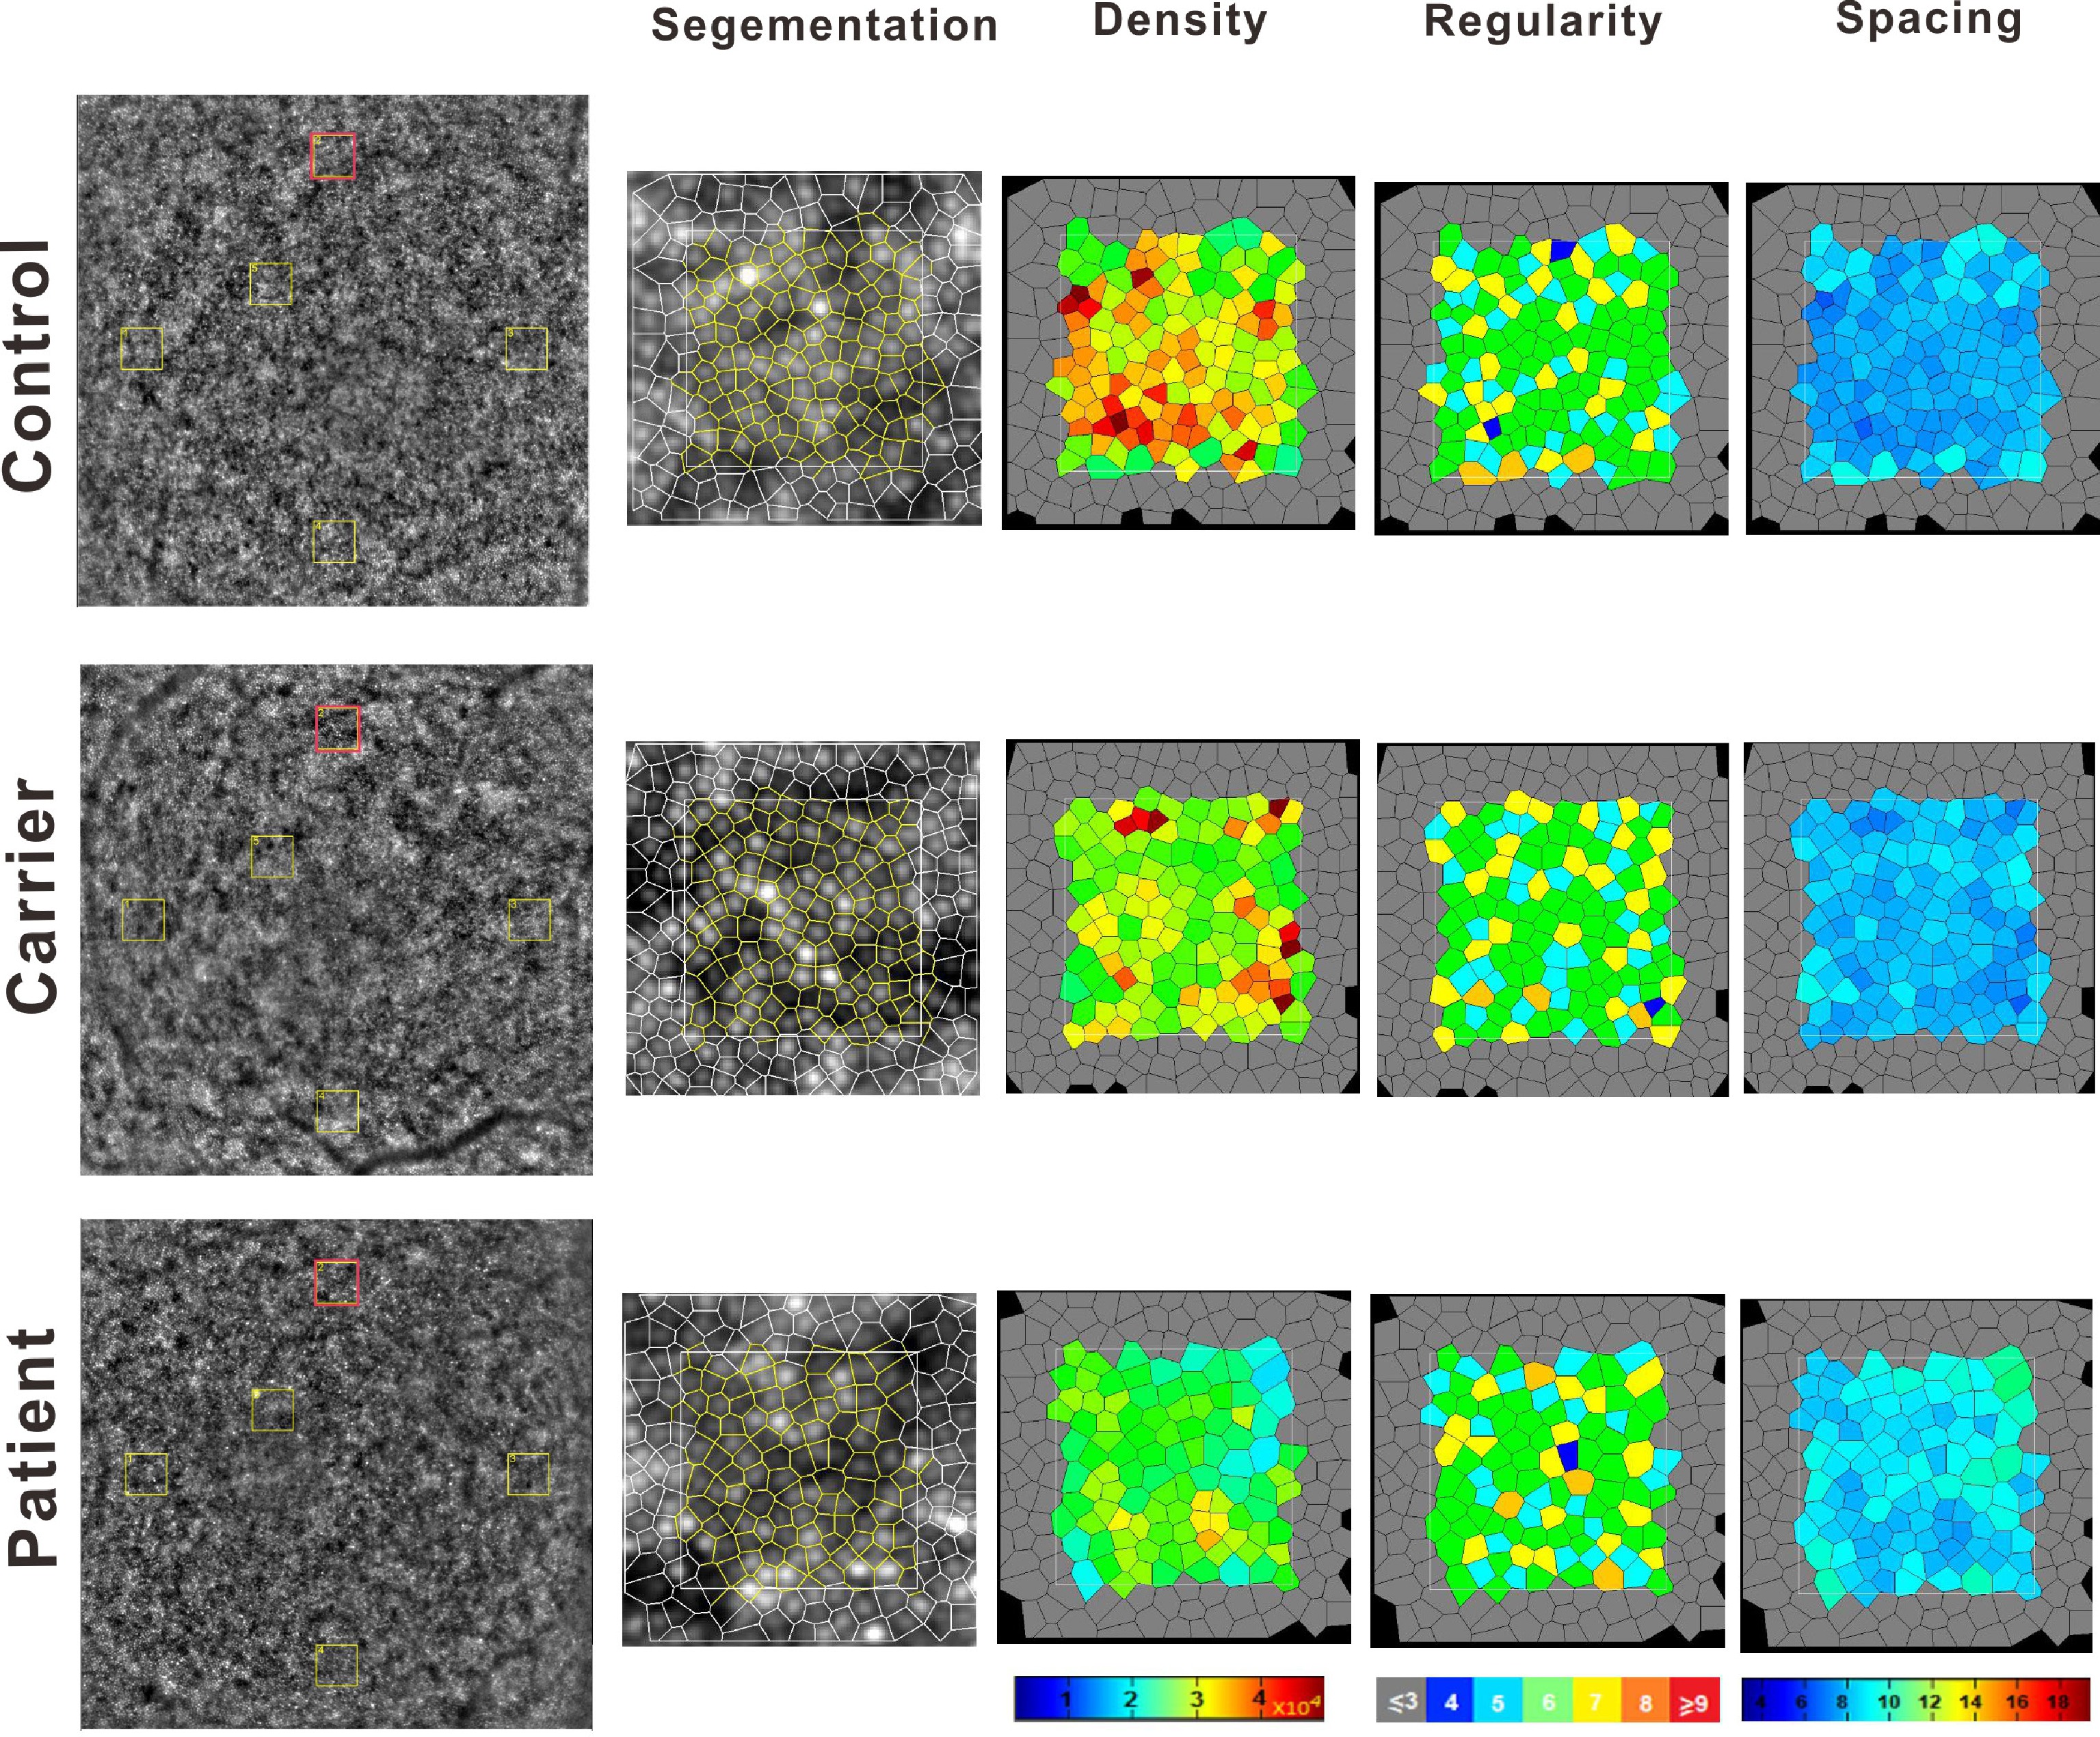
Figure 1.
Foveal adaptive optics (AO) imaging: quantitative comparison of cone photoreceptors. Adaptive optics (AO) imaging of the foveal center (right eye, 4° × 4° field of view). Yellow boxes denote five regions of interest (ROIs): temporal, nasal, superior, inferior (1.5° from foveal center), and superotemporal (0.5°). Red boxes highlight the superior ROI 2. Quantitative results (cone density, spacing, regularity, and distribution) are displayed for three groups (top to bottom): retinitis pigmentosa (RP) patients, RP carriers, and controls.
-
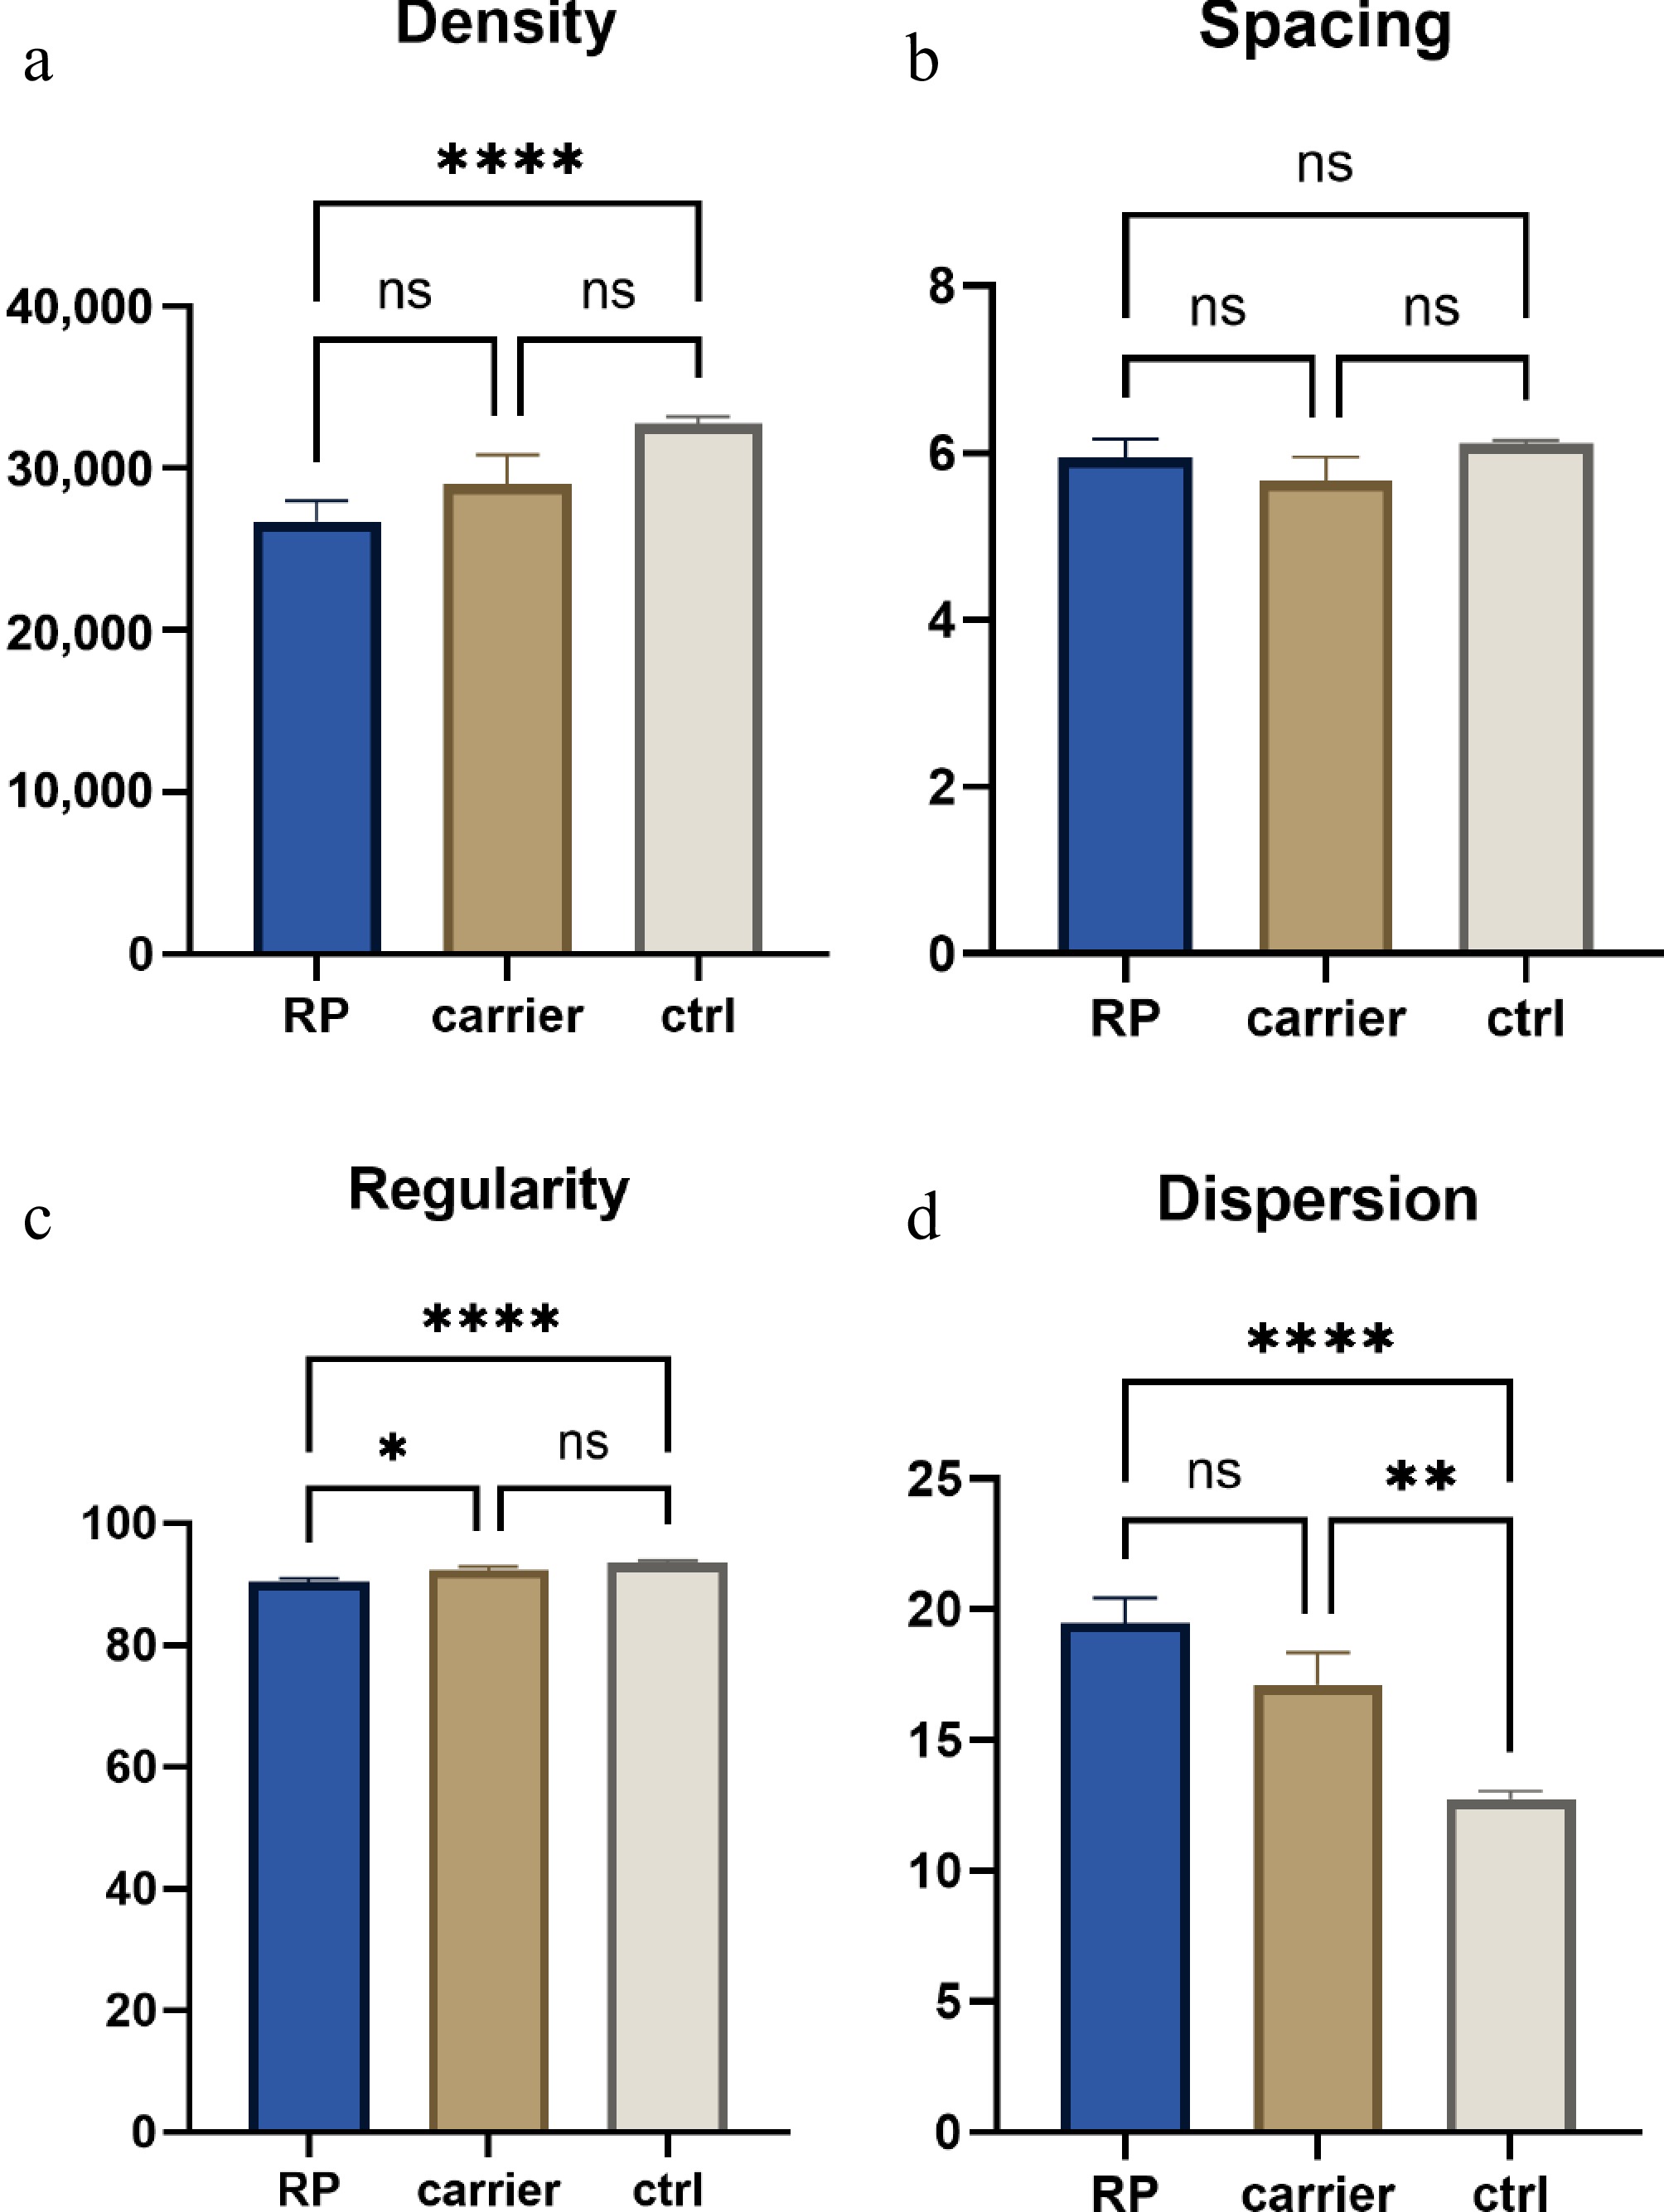
Figure 2.
Quantitative analysis of cone cell metrics in retinitis pigmentosa (RP) patients, carriers, and controls. (a) Cone density (cells/mm2) comparison. (b) Cone spacing (µm). (c) Regularity index (%). (d) Dispersion. Groups: RP (retinitis pigmentosa patients), carriers (RP carriers), ctrl (controls). Sample sizes: 49 control eyes, 19 carrier eyes, and 39 RP eyes. Statistical comparisons were performed using the Kruskal–Wallis test with Dunn's post-hoc test for pairwise comparisons. p < 0.05, * p < 0.01, *** p < 0.0001; ns, not significant.
-
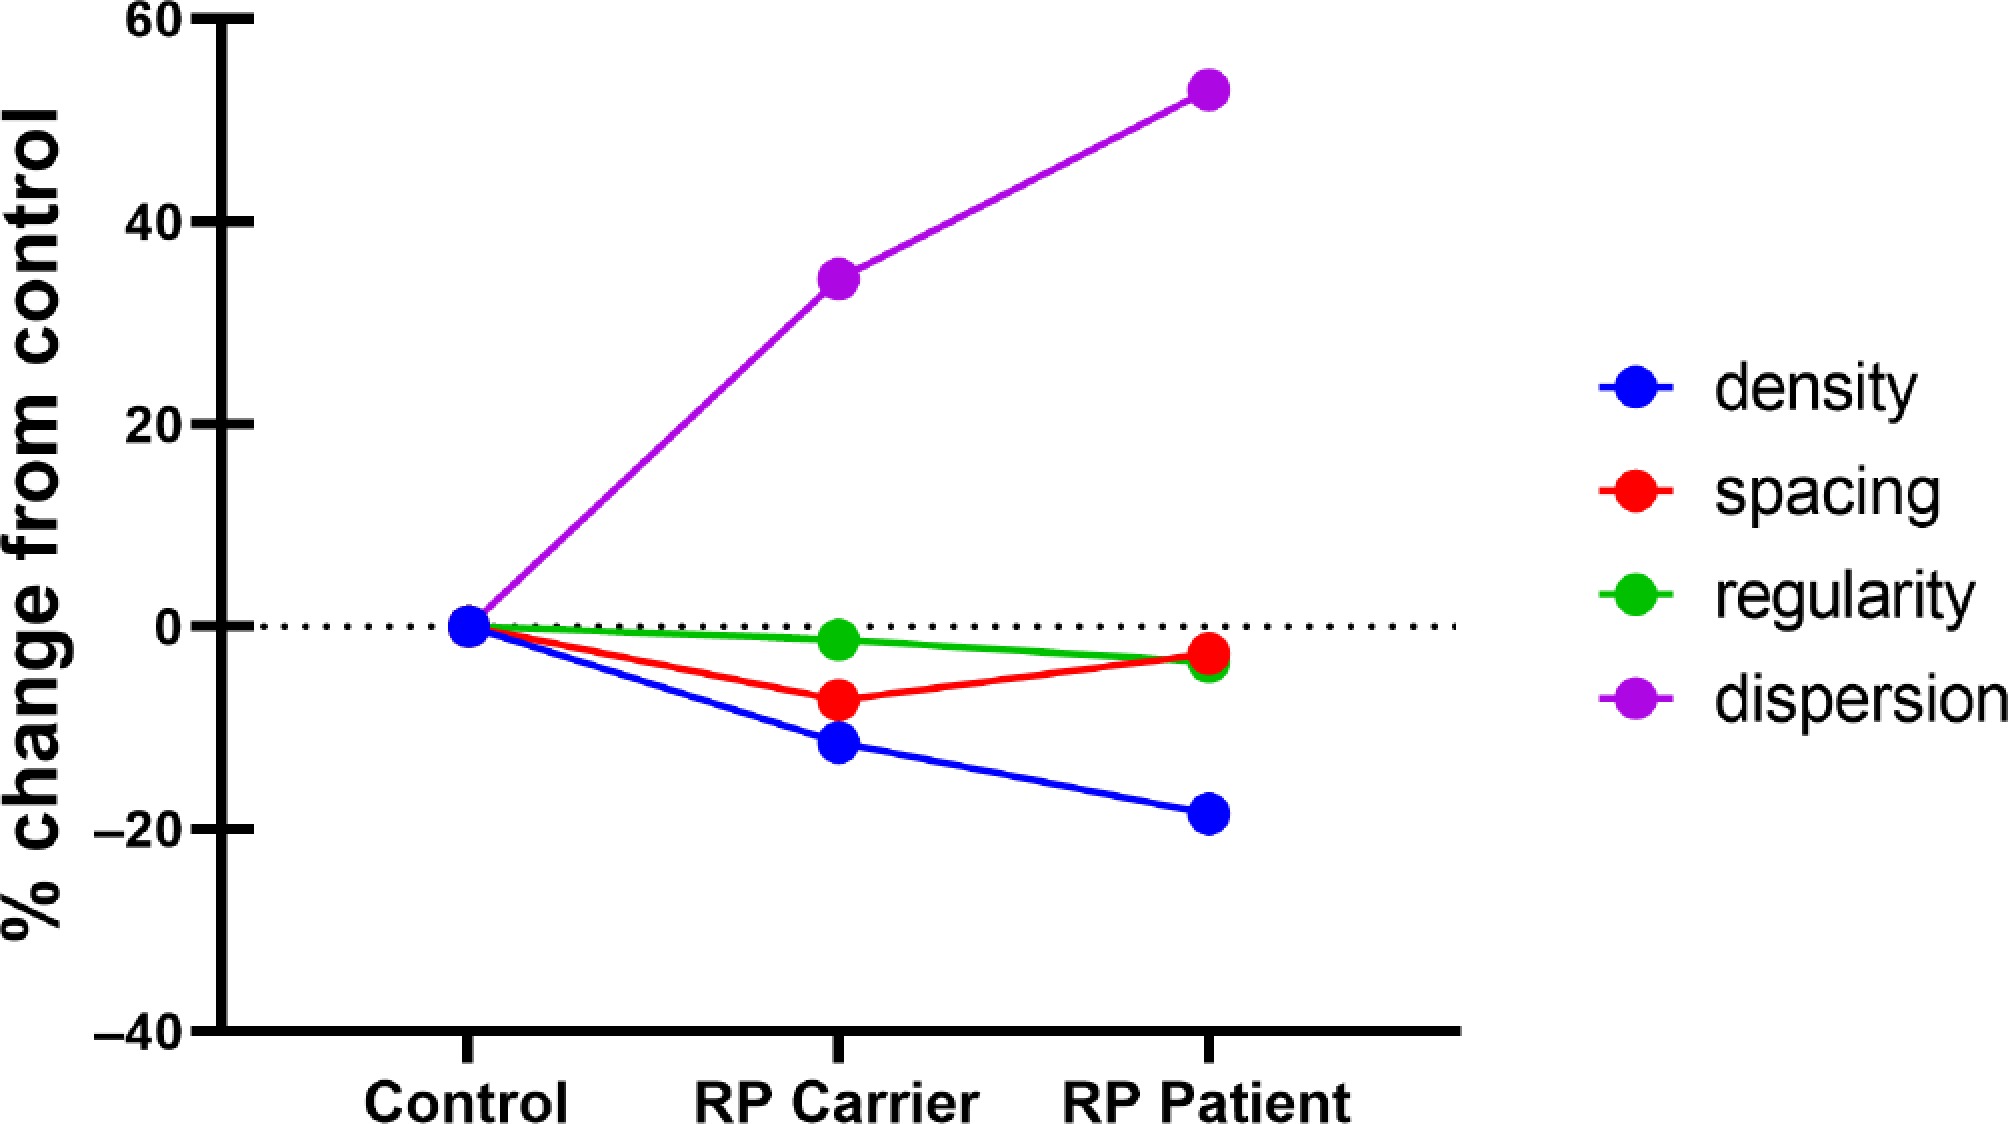
Figure 3.
Percentage change in cone cell metrics relative to controls. Comparison of percentage changes in cone density, spacing, regularity, and dispersion between retinitis pigmentosa (RP) patients, RP carriers, and healthy controls (4° × 4° region). Data are expressed as mean % change from control values (baseline set at 0%).
-
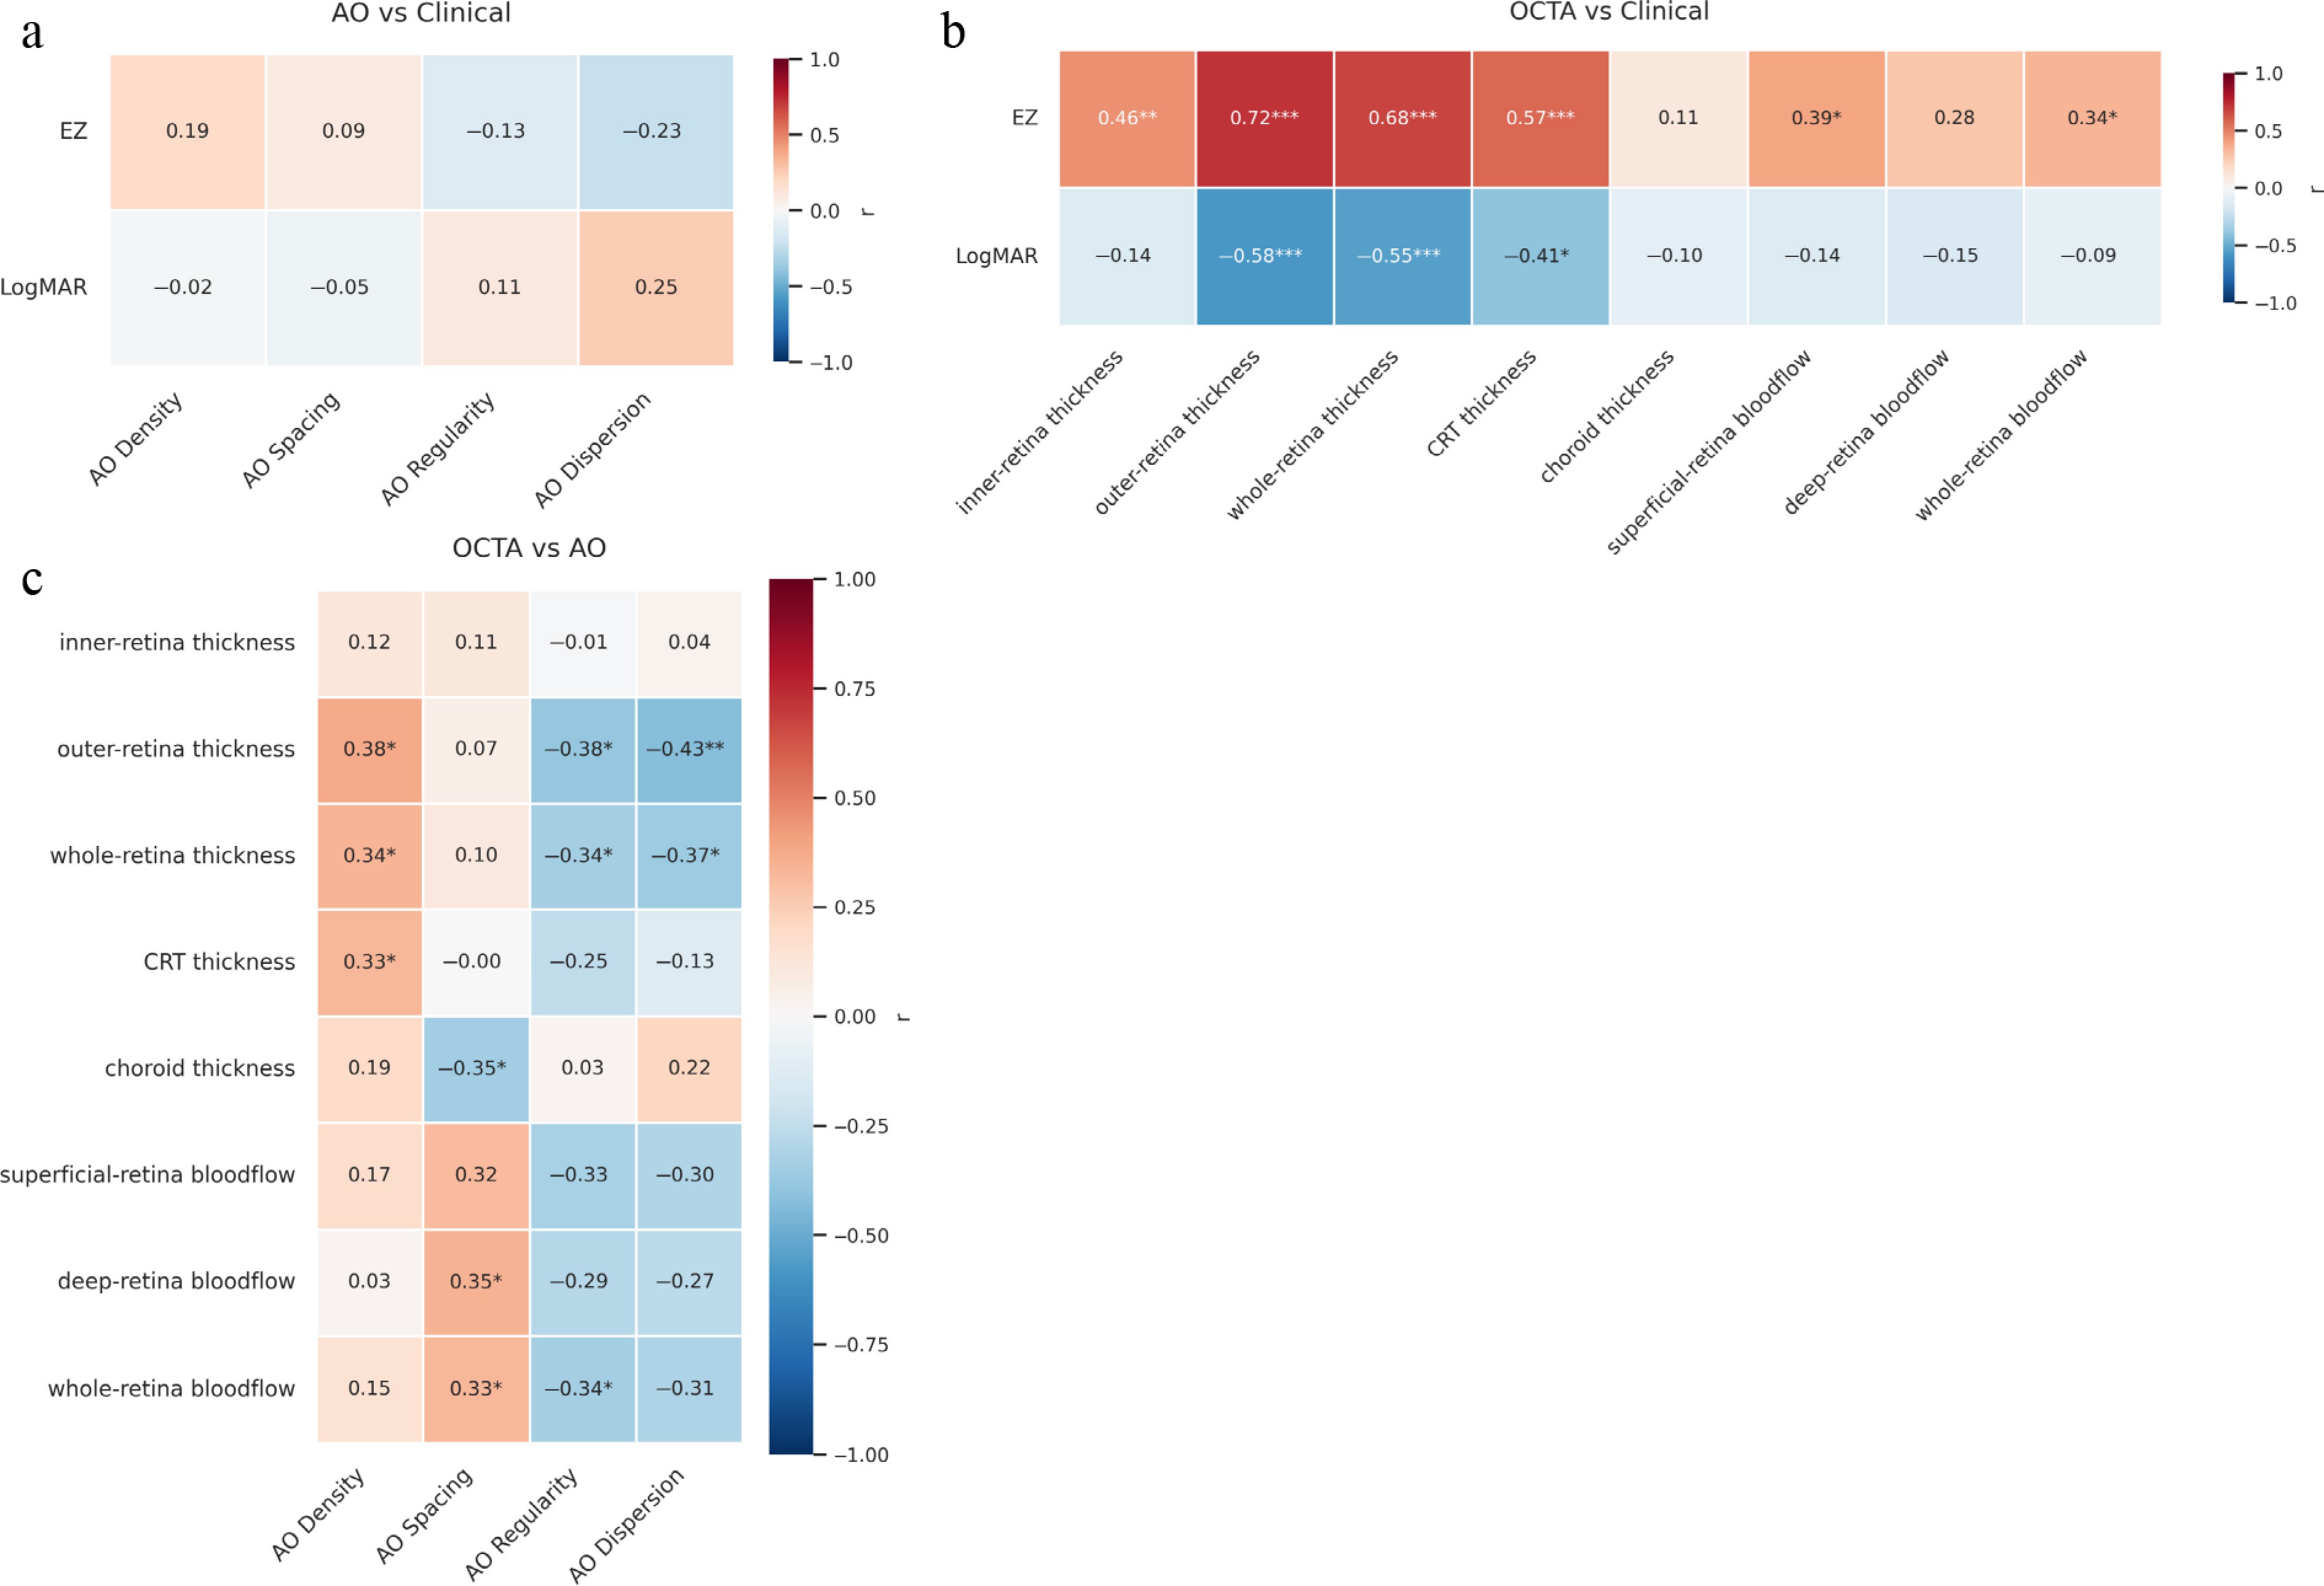
Figure 4.
Multimodal partial correlations in retinitis pigmentosa (RP): AO, OCTA, and clinical metrics, adjusted for age, gender, and axial length. (a) AO-derived photoreceptor metrics (density, spacing, regularity, dispersion) vs clinical parameters (EZ length, LogMAR visual acuity). (b) OCTA-derived structural and vascular parameters vs clinical measures (EZ length, LogMAR visual acuity). (c) Cross-correlations between AO metrics and OCTA parameters. The color intensity indicates the strength of the correlation, with asterisks denoting statistical significance. Sample size: 39 RP eyes. Correlations were calculated using Spearman partial correlation analysis with adjustment for age, gender, and axial length. * represents p < 0.05, ** represents p < 0.01, *** represents p < 0.001. EZ, ellipsoid zone.
-
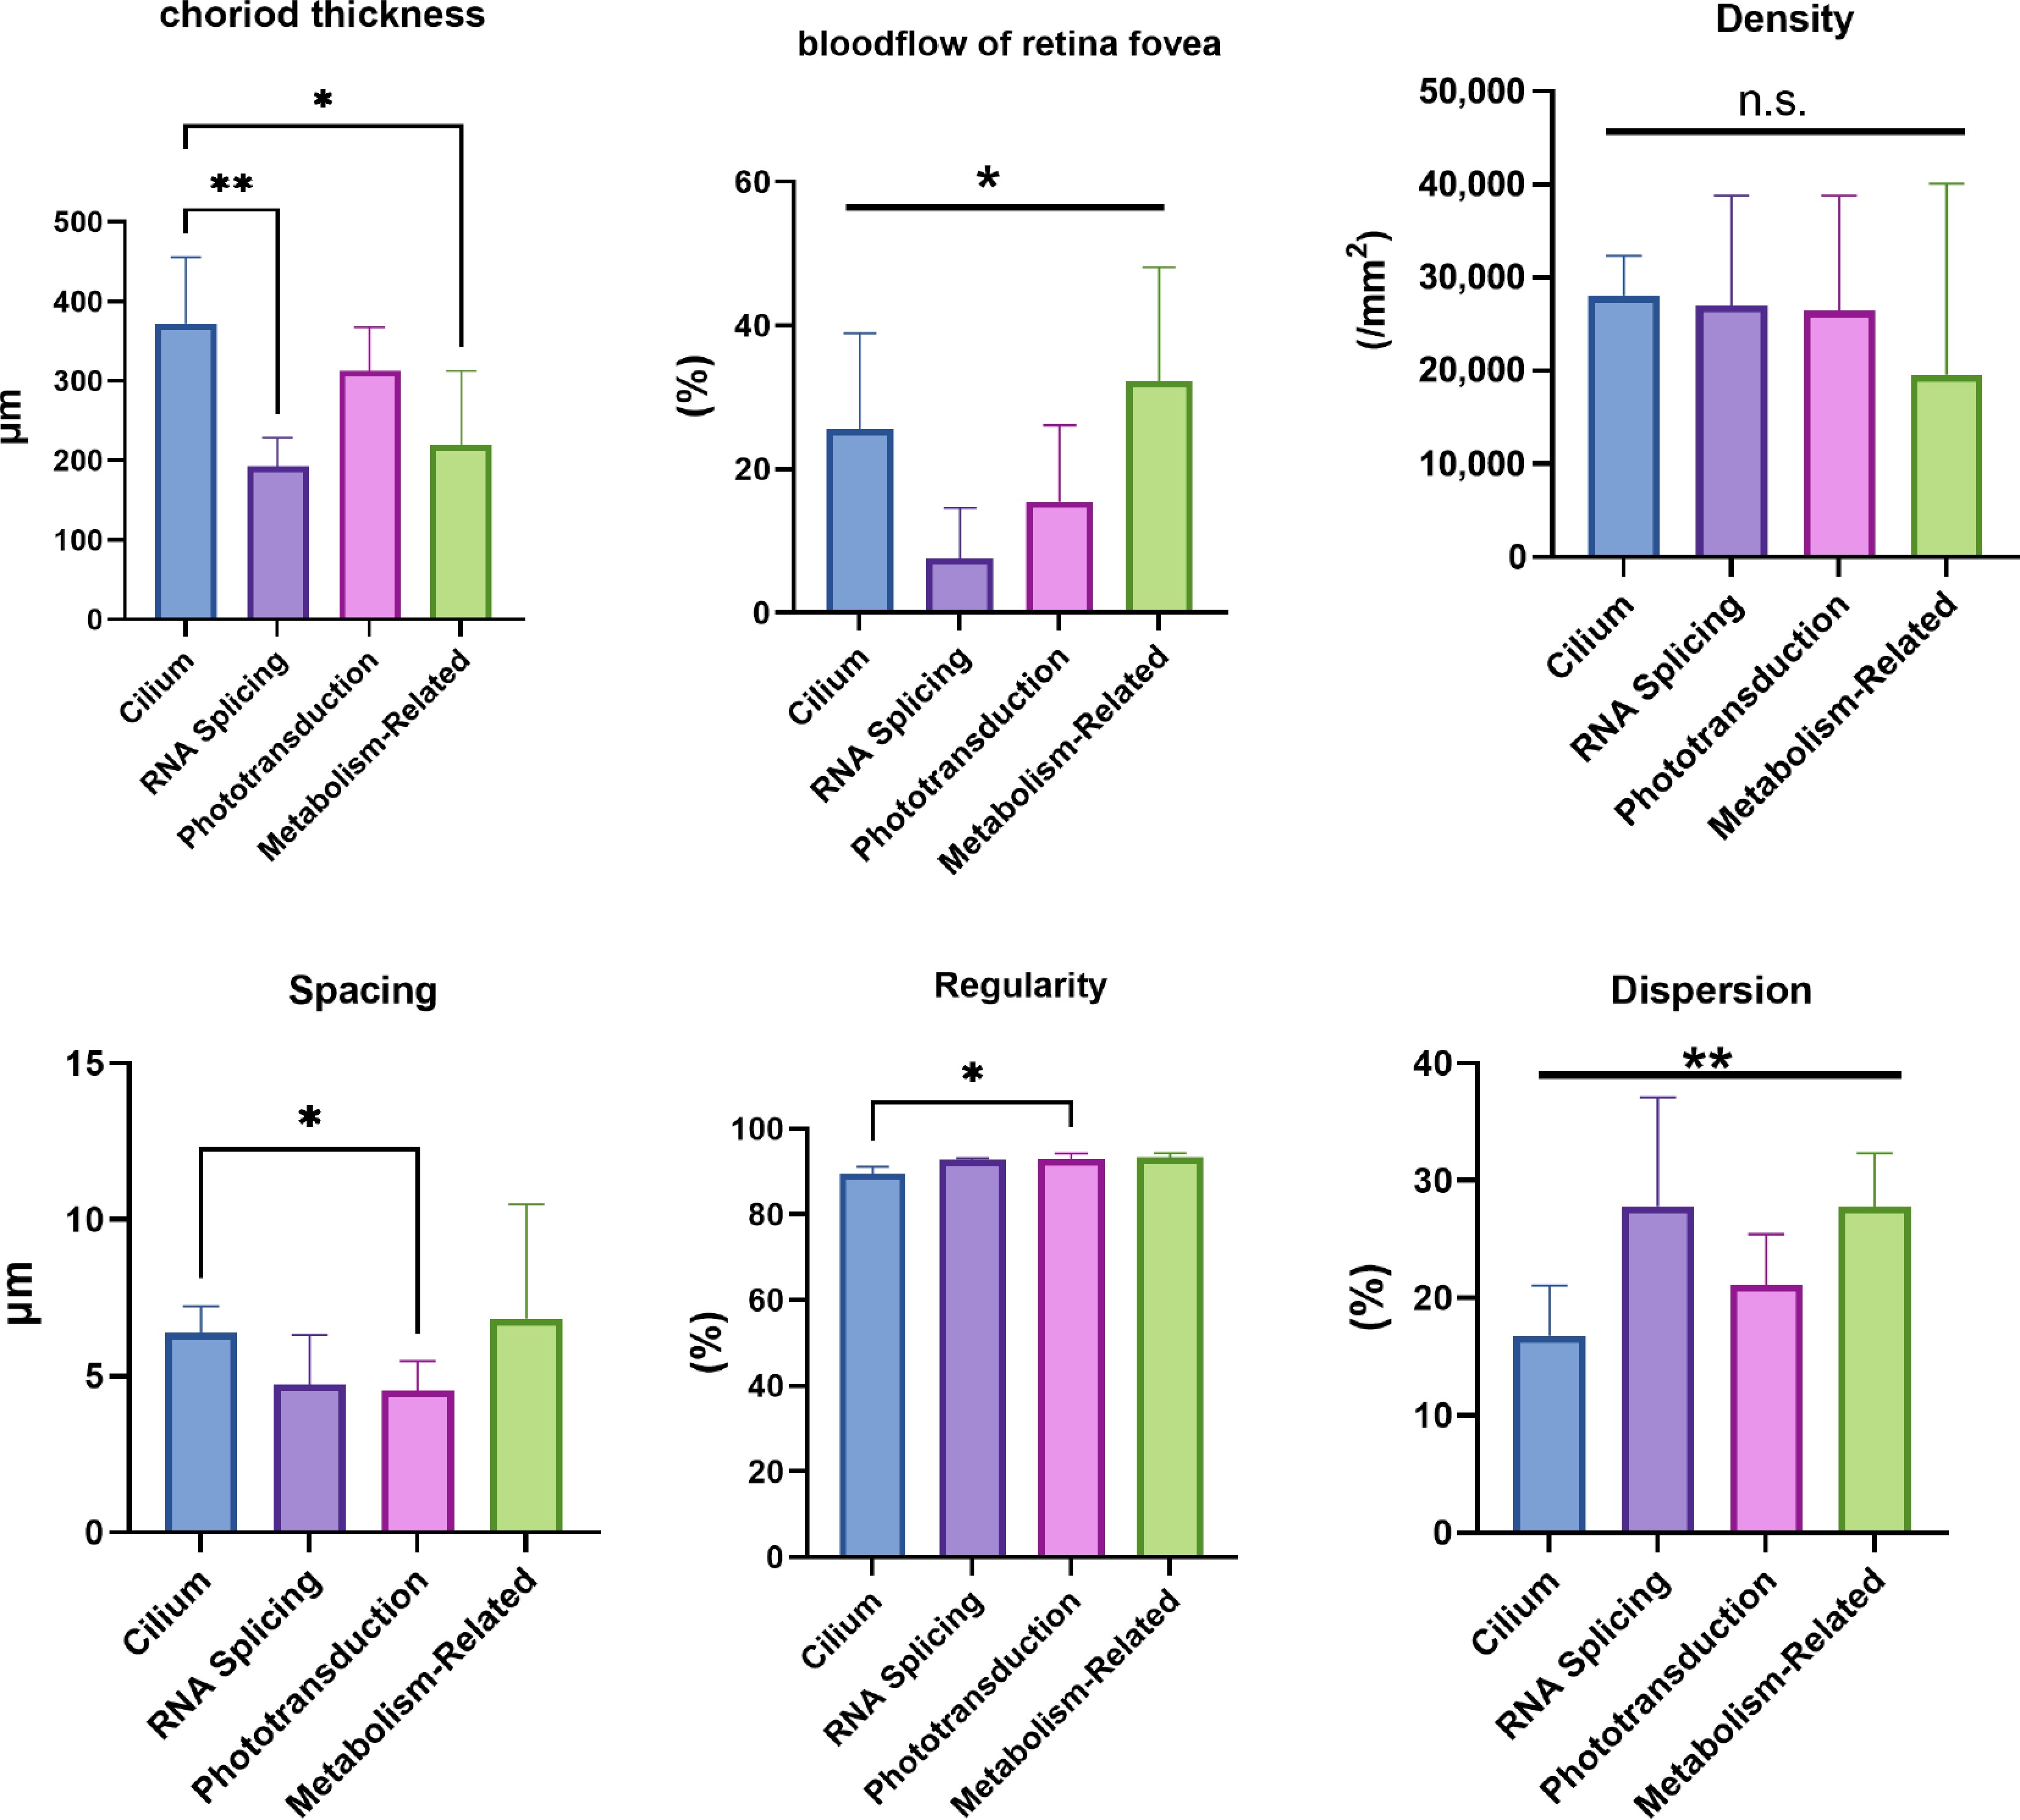
Figure 5.
Genotype–phenotype correlations in retinitis pigmentosa (RP) patients by AO/OCTA. Patients were stratified into four functional mutation groups: cilium, RNA-splicing, phototransduction, and metabolism-related. Inter-group comparisons were performed for choroidal thickness, total retinal blood-flow profile, photoreceptor density, dispersion, regularity, and spacing. Sample sizes: 16 genetically confirmed RP patients stratified into four functional mutation groups. The Kruskal–Wallis test was applied to non-normally distributed parameters; whenever the overall test was significant, Dunn's test was used for post-hoc pairwise comparisons. ** p < 0.01, * p < 0.05; ns, not significant.
-
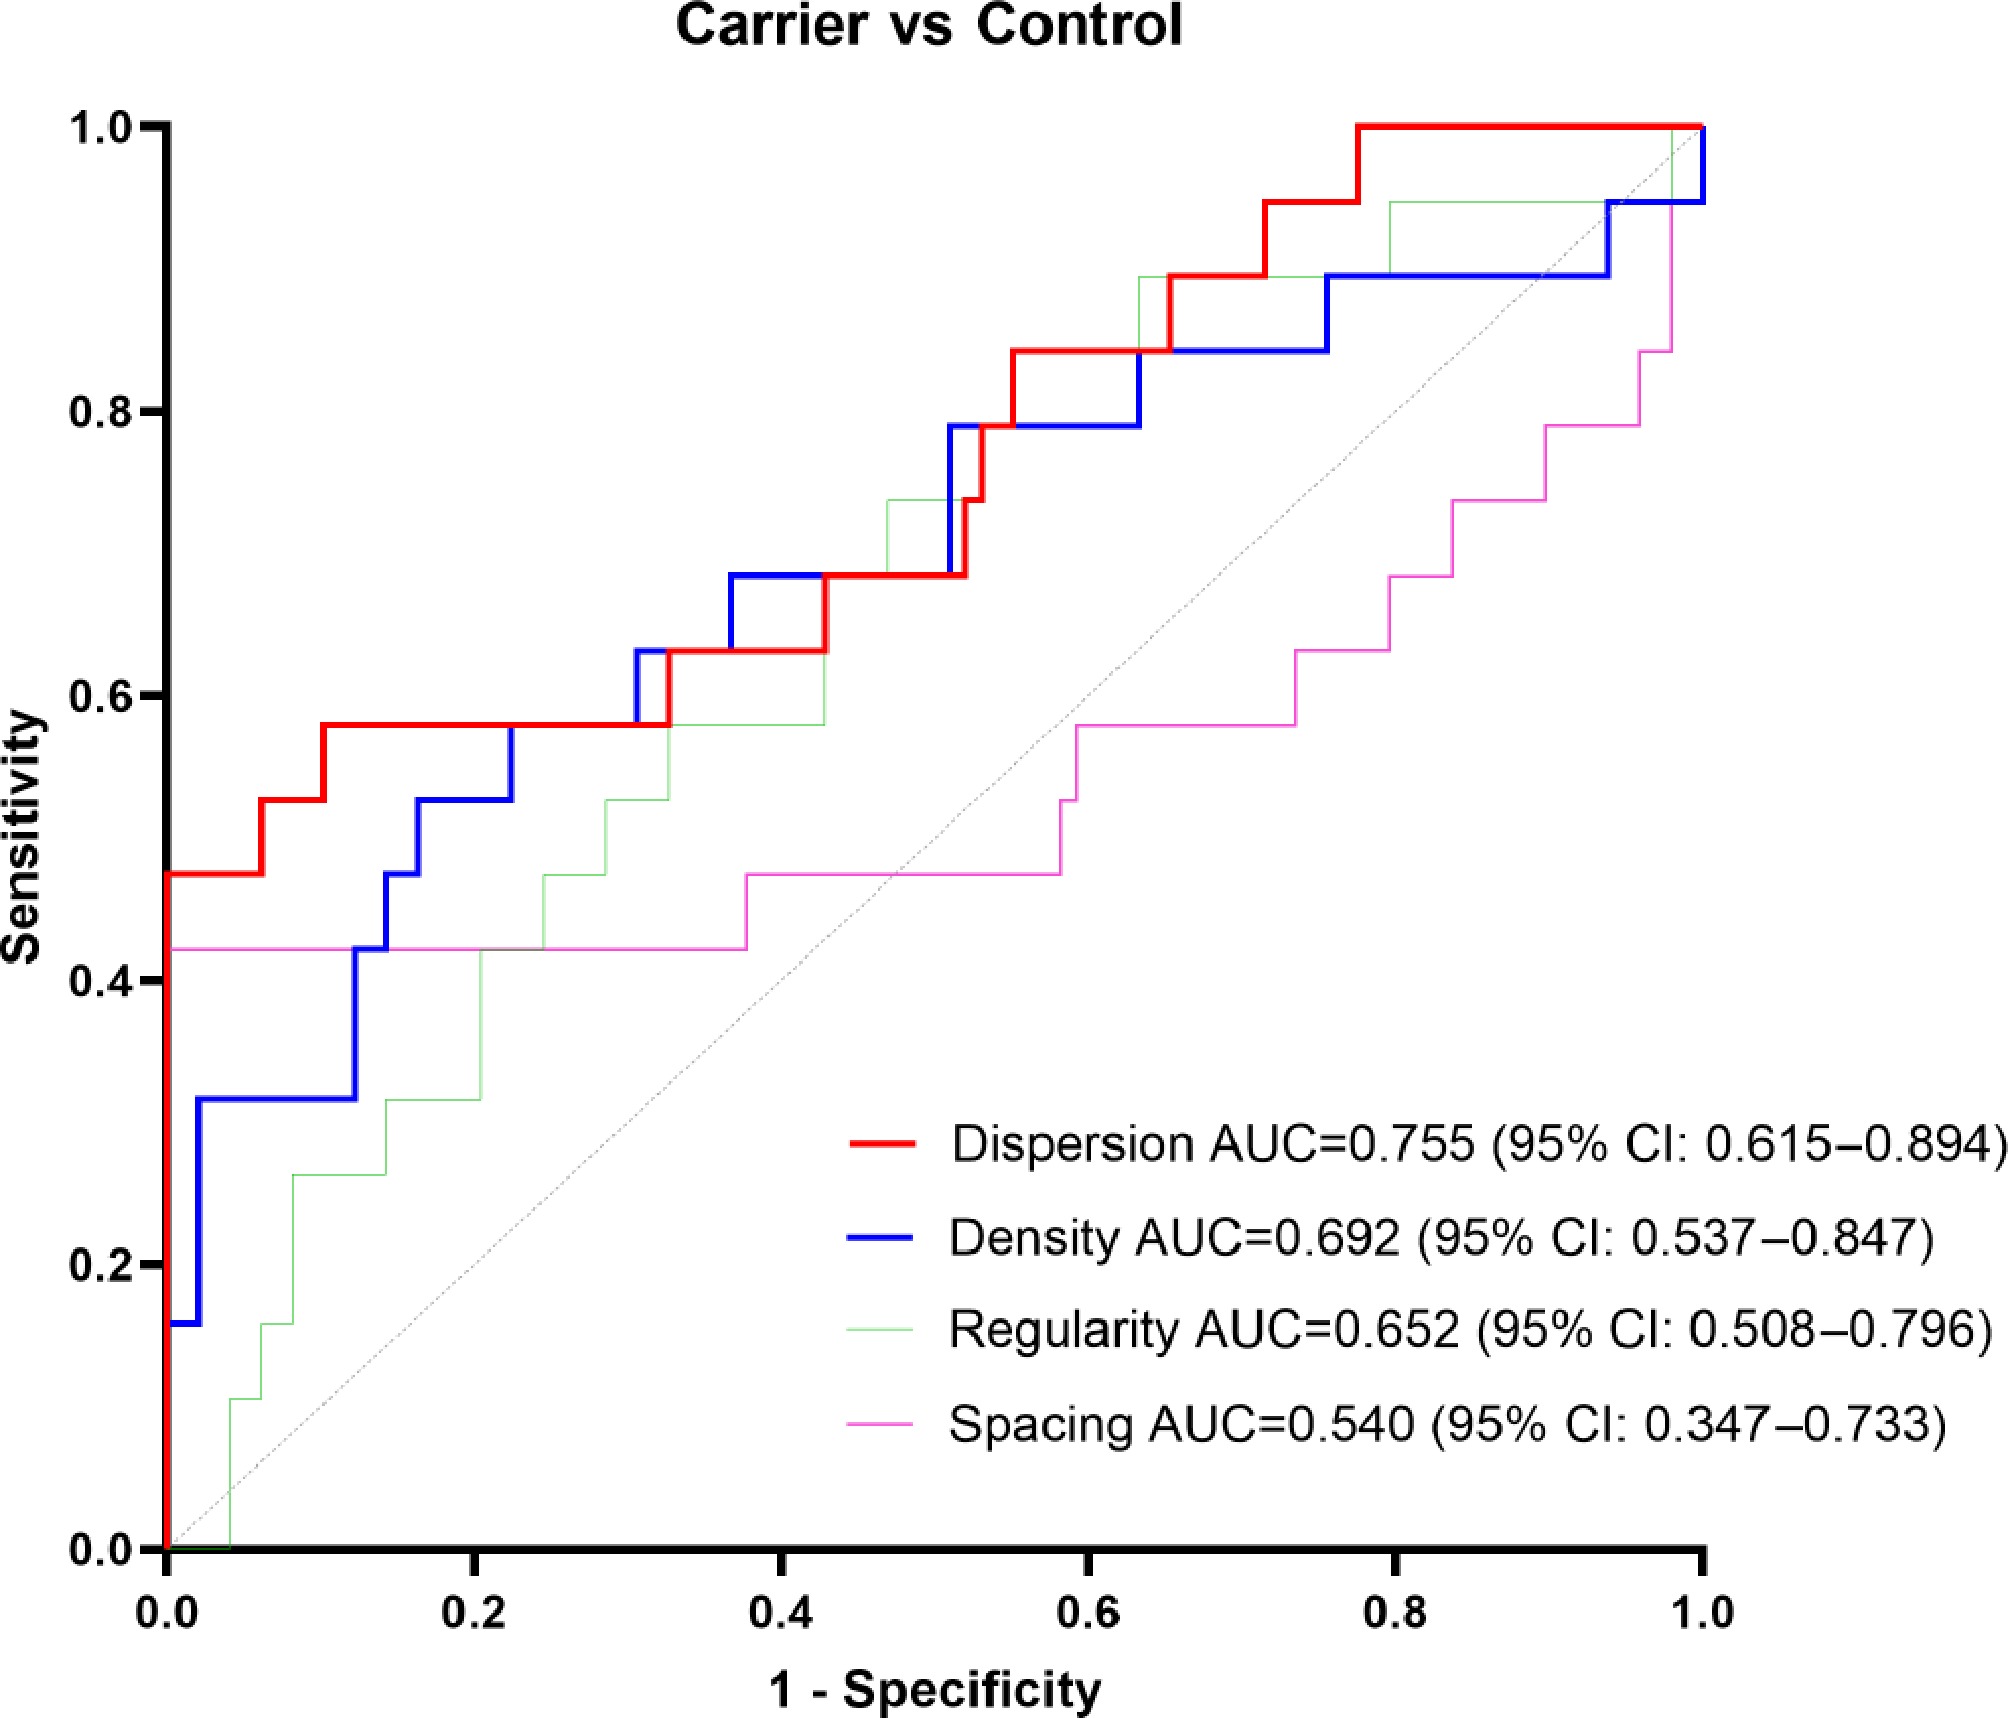
Figure 6.
ROC analysis to distinguish asymptomatic retinitis pigmentosa (RP) carriers from controls. ROC curves show photoreceptor dispersion has the highest discriminative value among four AO-quantified metrics (dispersion, density, regularity, and spacing).
-
Patient no. Family no. Gender Age Gene Inheritance Gene-related mechanisms Genotype Mutations P1 F1 Male 19 USH2A AR Cilium Compound heterozygote NM_206933.2:c.99_100insT
NM_206933.2:EX37-EX38 DupP2 F2 Female 62 USH2A AR Cilium Compound heterozygote NM_206933.2:c.11156G>A
NM_206933.2:c.13414G>AP3 F3 Male 42 USH2A AR Cilium Compound heterozygote NM_206933.2:c.11156G>A
NM_206933.2:EX4-EX15 DelP4 F4 Male 43 USH2A AR Cilium Compound heterozygote NM_206933.2:c.11549-1G>A
NM_206933.2:c.9958G>CP5 F5 Female 67 EYS AR Cilium Compound heterozygote NM_001142800.1:c.6416G>A
NM_001142800.1:c.6385G>AP6 F6 Male 39 EYS AR Cilium Homozygous NM_001142800.1:c.1798_1800delTTGinsC P7 F7 Female 49 SNRNP200 AD RNA splicing Heterozygote NM_014014.4:c.3260C>T P8 F7 Female 25 SNRNP200 AD RNA splicing Heterozygote NM_014014.4:c.3260C>T P9 F8 Male 30 RHO AD Phototransduction Heterozygote NM_000539.3:c.655_663delATCTTTTTC P10 F9 Female 49 IMPDH1 AD Metabolism Heterozygote NM_000883.3:c.174_183delGACGACACCC P11 F10 Female 42 RP1L1 AR Cilium Compound heterozygote NM_178857.5:c.4700G>A
NM_178857.5:c.149G>A
NM_178857.5:c.32C>TP12 F11 Male 30 RDH12 AR Metabolism Compound heterozygote NM_152443.2:c.437T>A
NM_152443.2:c.193C>TP13 F12 Male 28 CNGB1 AR Phototransduction Compound heterozygote NM_001297.4:c.2284C>A
NM_001297.4:c.2284C>TP14 F13 Male 35 CNGA1 AR Phototransduction Homozygous NM_000087.3:c.1537G>A P15 F14 Male 52 CEP290 AR Cilium Compound heterozygote NM_025114.3: c.1666_1667insA NM_025114.3:c.503G>A P16 F15 Male 37 ALMS1 AR Cilium Compound heterozygote NM_001378454: c.812C>T
NM_001378454: c.12163C>GP17 F16 Female 30 N/A N/A N/A N/A N/A P18 F17 Male 46 N/A N/A N/A N/A N/A P19 F18 Male 46 N/A N/A N/A N/A N/A P20 F19 Female 29 N/A N/A N/A N/A N/A P21 F20 Male 40 N/A N/A N/A N/A N/A P22 F21 Female 9 N/A N/A N/A N/A N/A AR: autosomal recessive, AD: autosomal dominant. Table 1.
Genotype and mutations' profiles in RP patients.
-
OCTA Mean ± SD Inner retina thickness (µm) 66.34 ± 32.27 Outer retina thickness (µm) 199.54 ± 66.28 Central retina thickness (µm) 273.13 ± 73.82 Choroidal thickness (µm) 255.43 ± 116.90 Retinal blood flow superficial: ILM-IPL_fovea (%) 21.12 ± 12.75 Retinal blood flow deep: IPL-OPL_fovea (%) 11.99 ± 12.68 Retinal blood flow retina_fovea (%) 20.33 ± 13.40 FAZ superficial: ILM-IPL no flow area (mm2) 0.9764 ± 1.7373 FAZ deep: IPL-OPL no flow area (mm2) 1.3357 ± 1.5496 FAZ retina: ILM-OPL no flow area (mm2) 1.1528 ± 1.8098 Choroidal flow: (CVI, %) 49.6429 ± 11.9667 ILM, internal limiting membrane; IPL, inner plexiform layer; OPL, outer plexiform layer; FAZ, foveal avascular zone; CVI, choroidal vascularity index. Table 2.
OCTA parameters of RP patients.
Figures
(6)
Tables
(2)