-
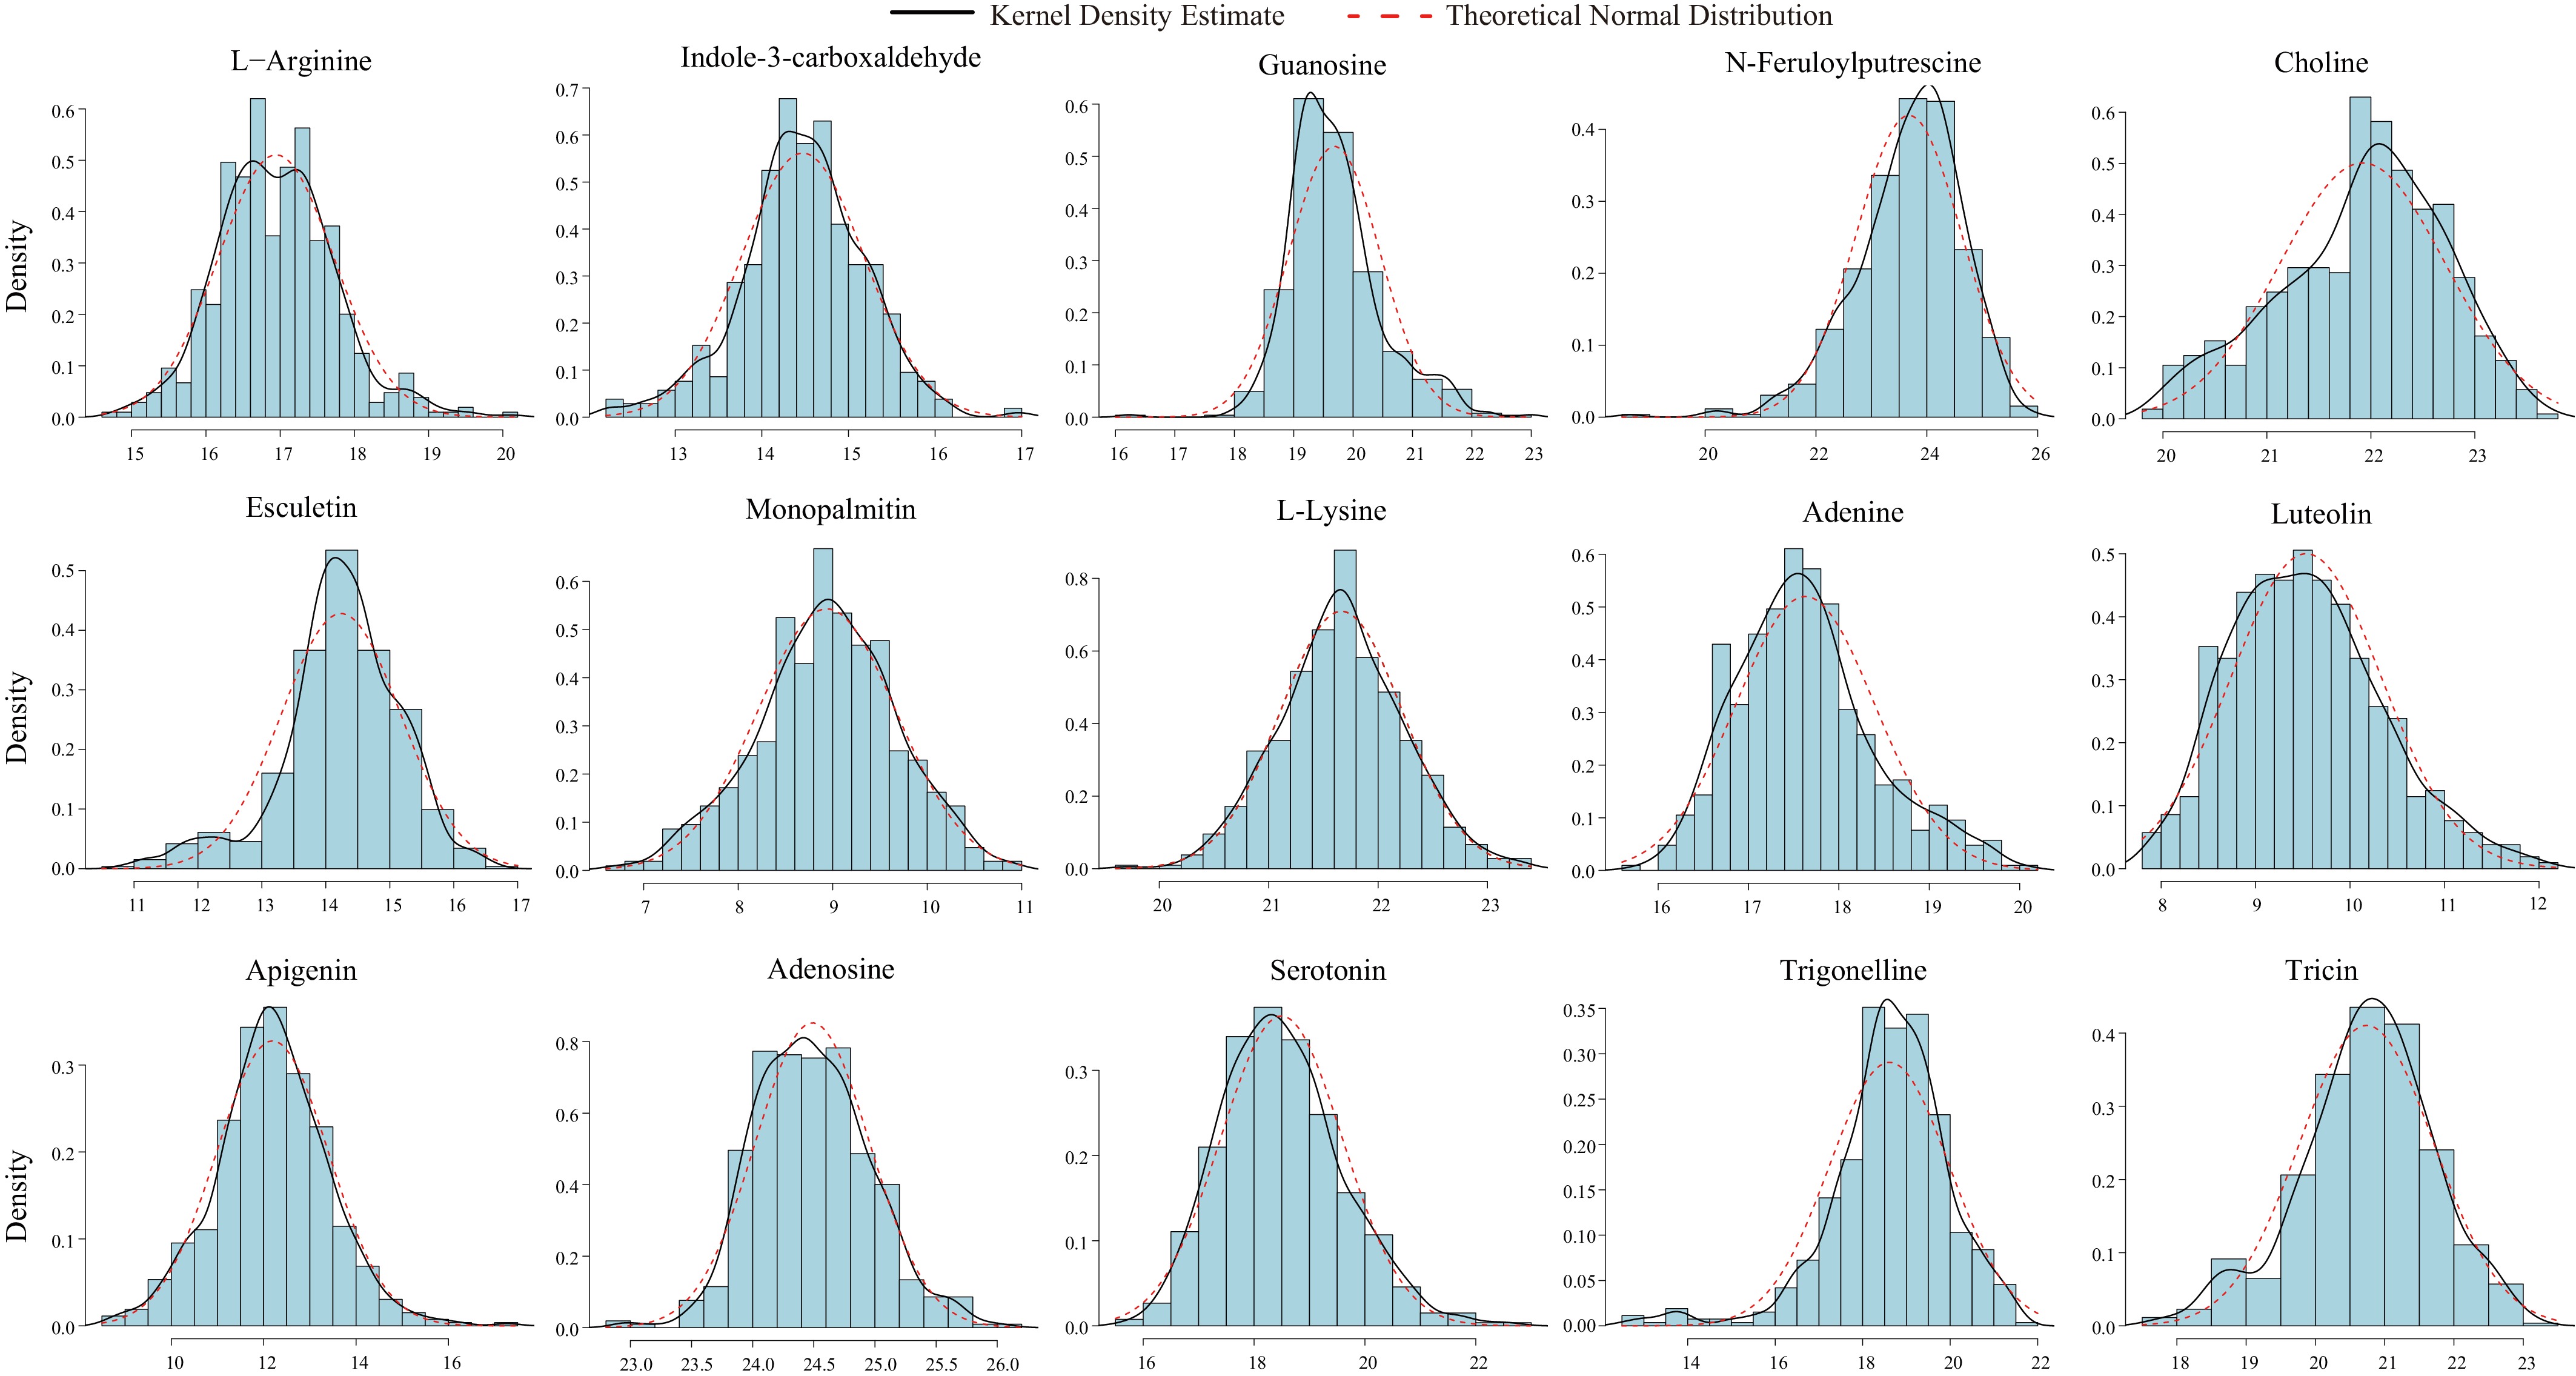
Figure 1.
Distribution characteristics of metabolite content.
-
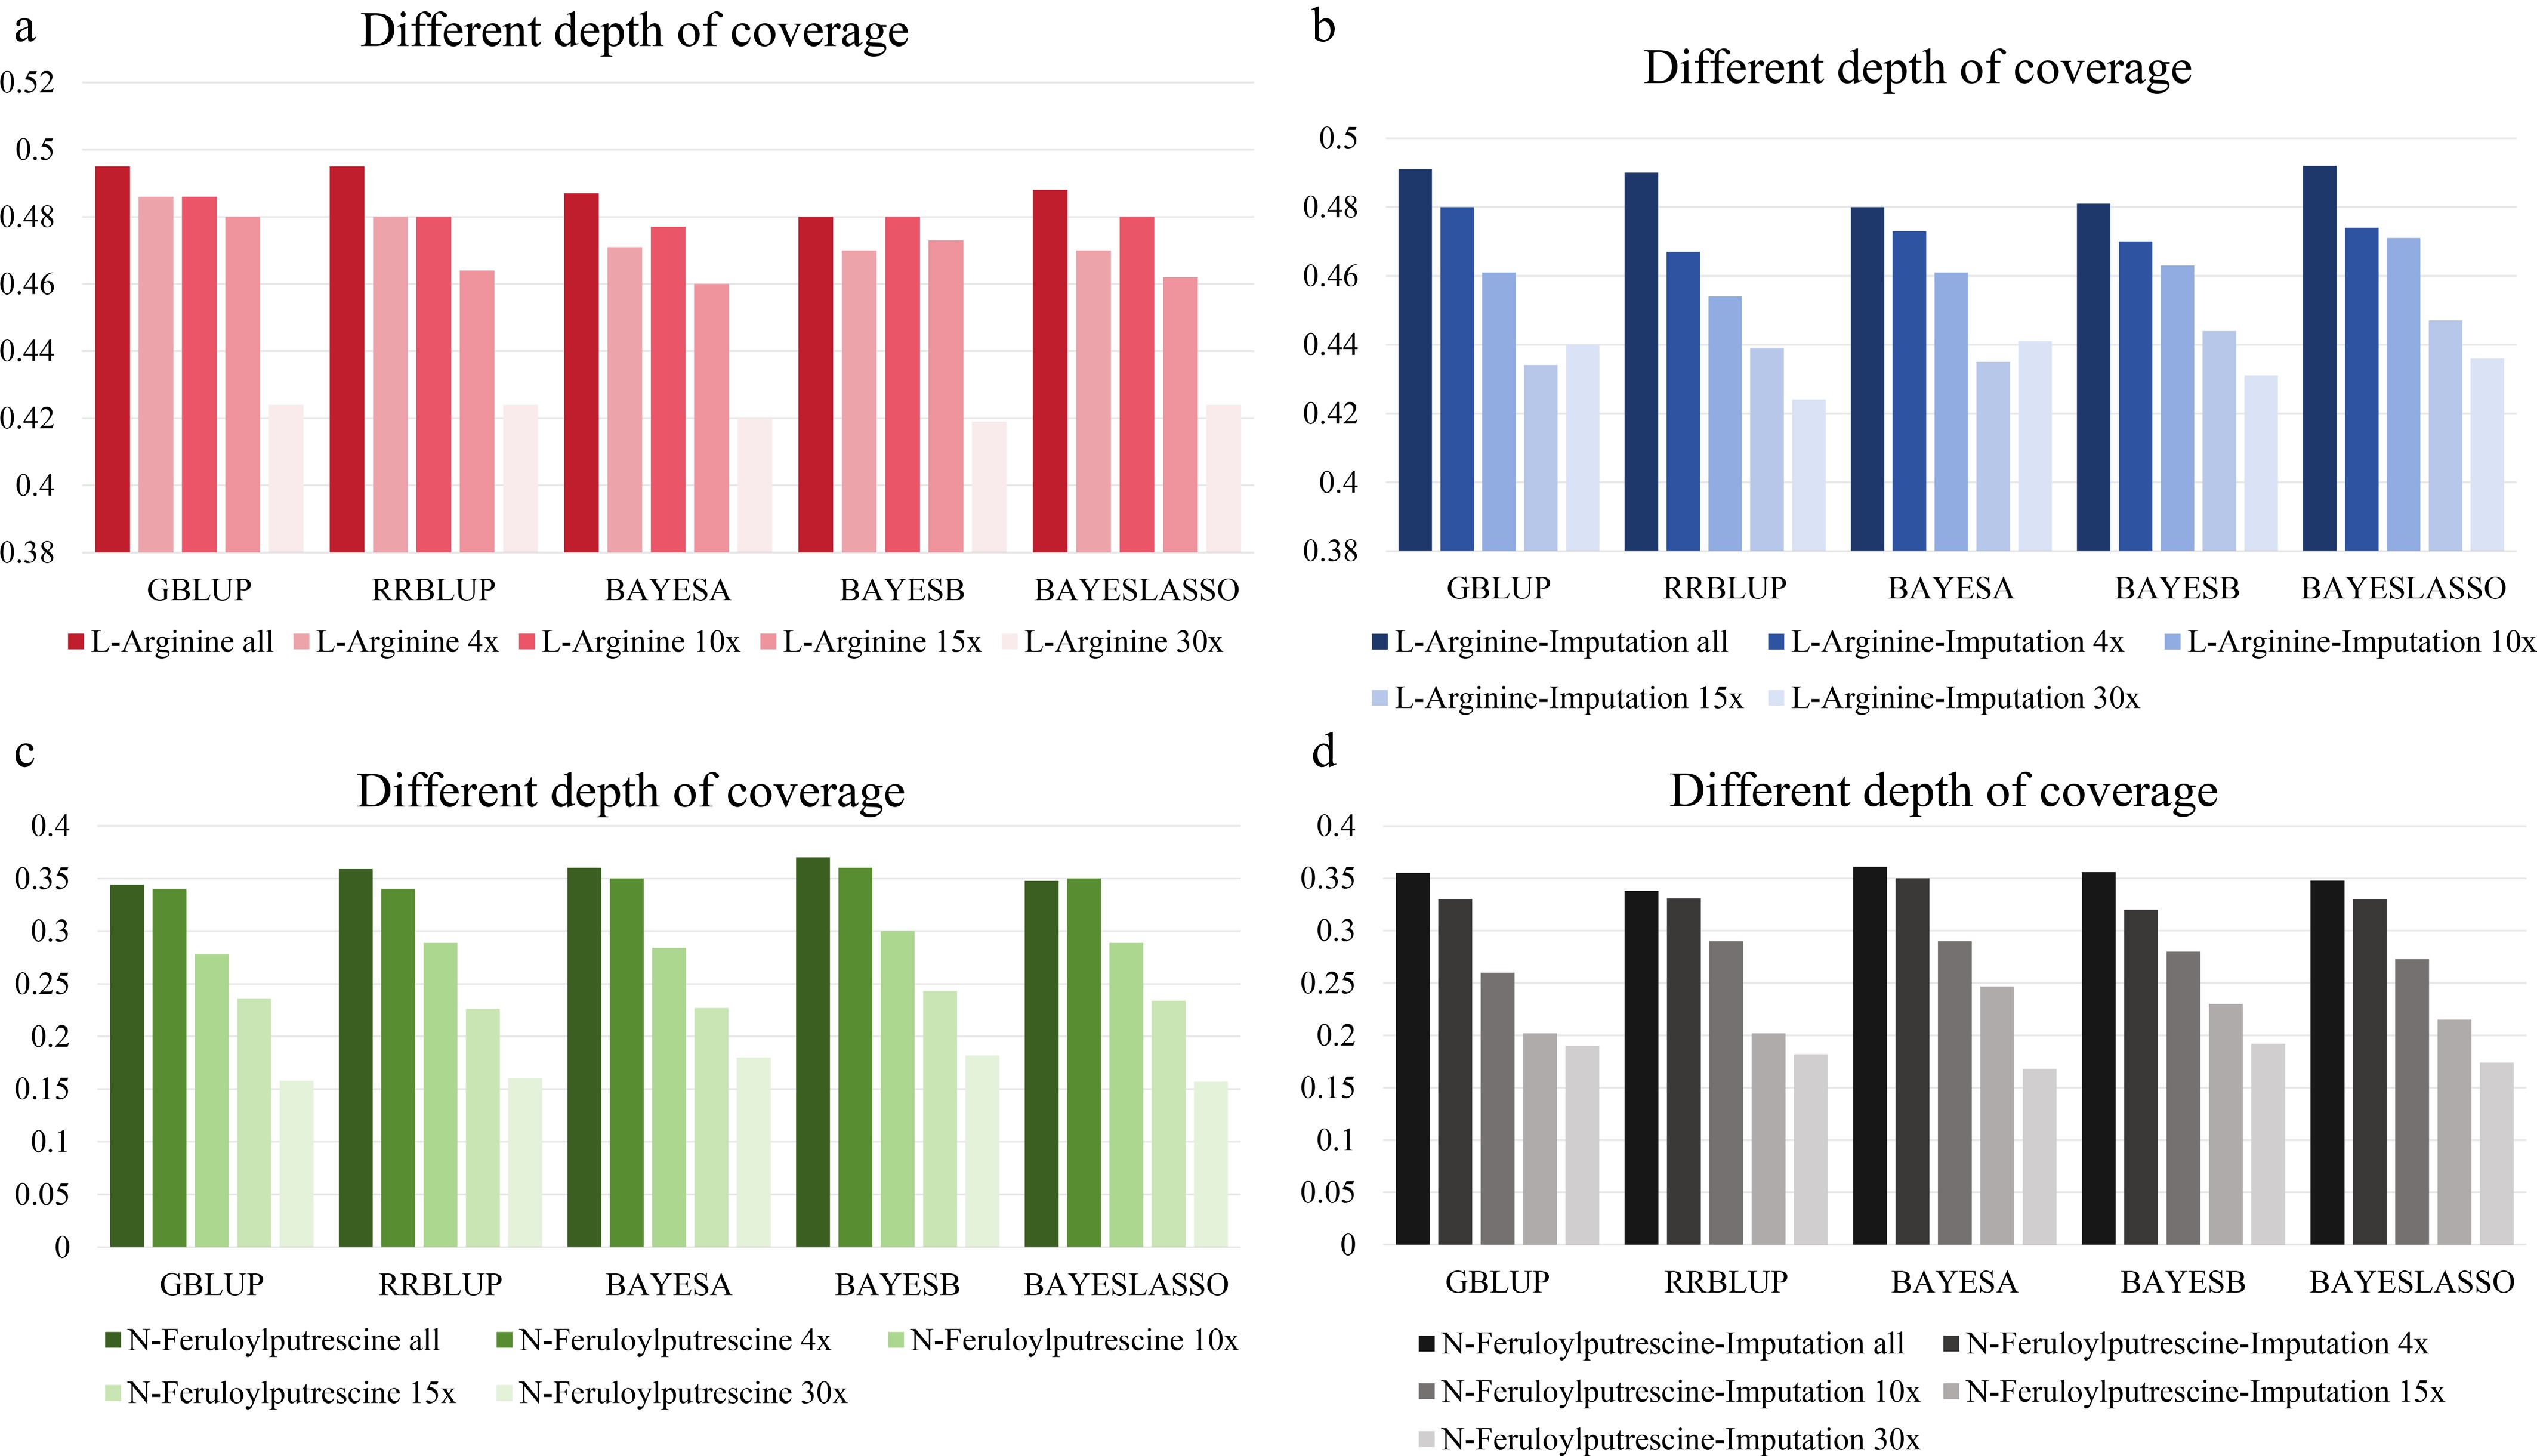
Figure 2.
The prediction accuracy results of the independent validation set under different models. (a) The prediction accuracy of L-Arginine in the model trained on the genotype data before interpolation. (b) The prediction accuracy of L-Arginine in the model trained on the genotype data for interpolation. (c) The prediction accuracy of N-Feruloylputrescine in the model trained on the genotype data before interpolation. (d) The prediction accuracy of N-Feruloylputrescine in the model trained on the genotype data for interpolation.
-
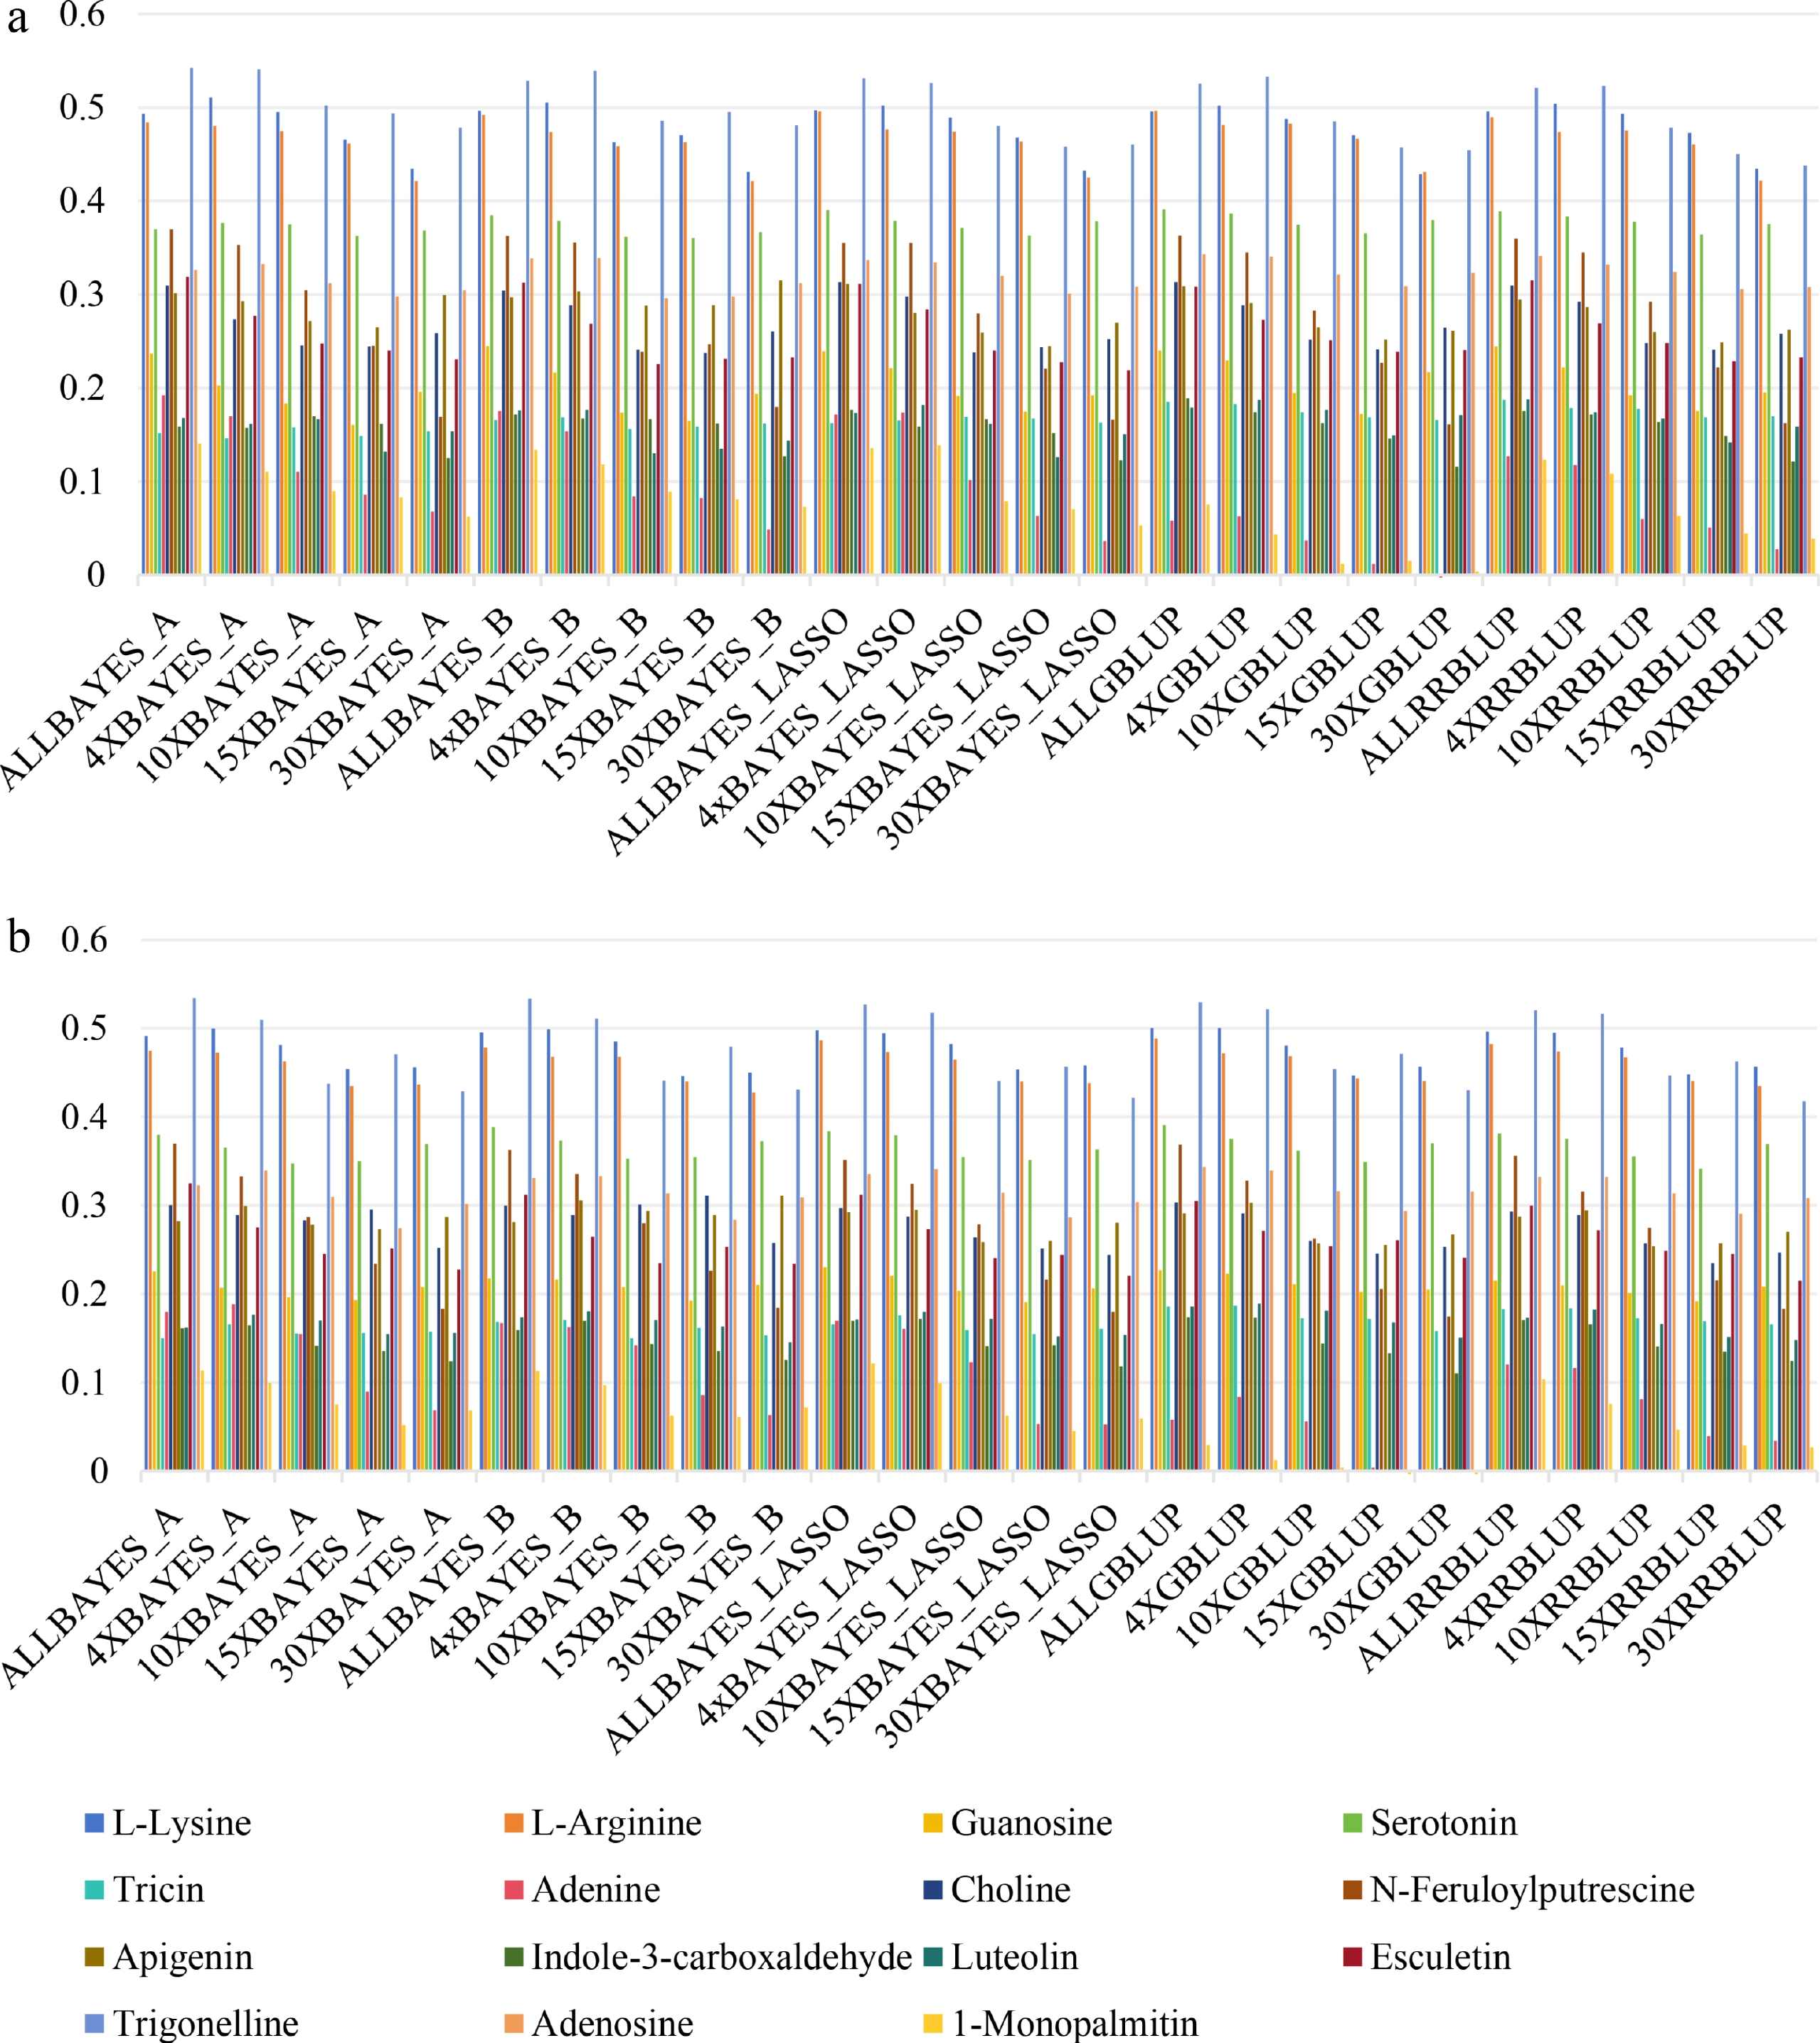
Figure 3.
The prediction accuracy of each metabolism in 524 rice samples in different models. (a) The prediction accuracy of each metabolite was not interpolated for genotypes. (b) The prediction accuracy of each metabolite after interpolation of genotypes.
-
MSE ISE CV (%) Apigenin 0.00019 0.0016 9.98 1-Monopalmitin 0.00033 0.0014 8.22 Serotonin 0.00039 0.0027 5.93 L-Lysine 0.00050 0.0018 2.60 L-Arginine 0.00053 0.0029 4.61 Tricin 0.00070 0.0040 4.69 Trigonelline 0.00089 0.0081 7.38 Indole-3-carboxaldehyde 0.00089 0.0043 4.91 N-Feruloylputrescine 0.00114 0.0083 4.02 Luteolin 0.00120 0.0050 8.37 Adenosine 0.00192 0.0059 1.91 Adenine 0.00216 0.0094 4.35 Esculetin 0.00223 0.0130 6.55 Choline 0.00278 0.0109 3.63 Guanosine 0.00374 0.0252 3.90 MSE, mean squared error; ISE, integral square error; CV, coefficient of variation. Table 1.
Descriptive statistical analysis of each metabolite.
Figures
(3)
Tables
(1)