-
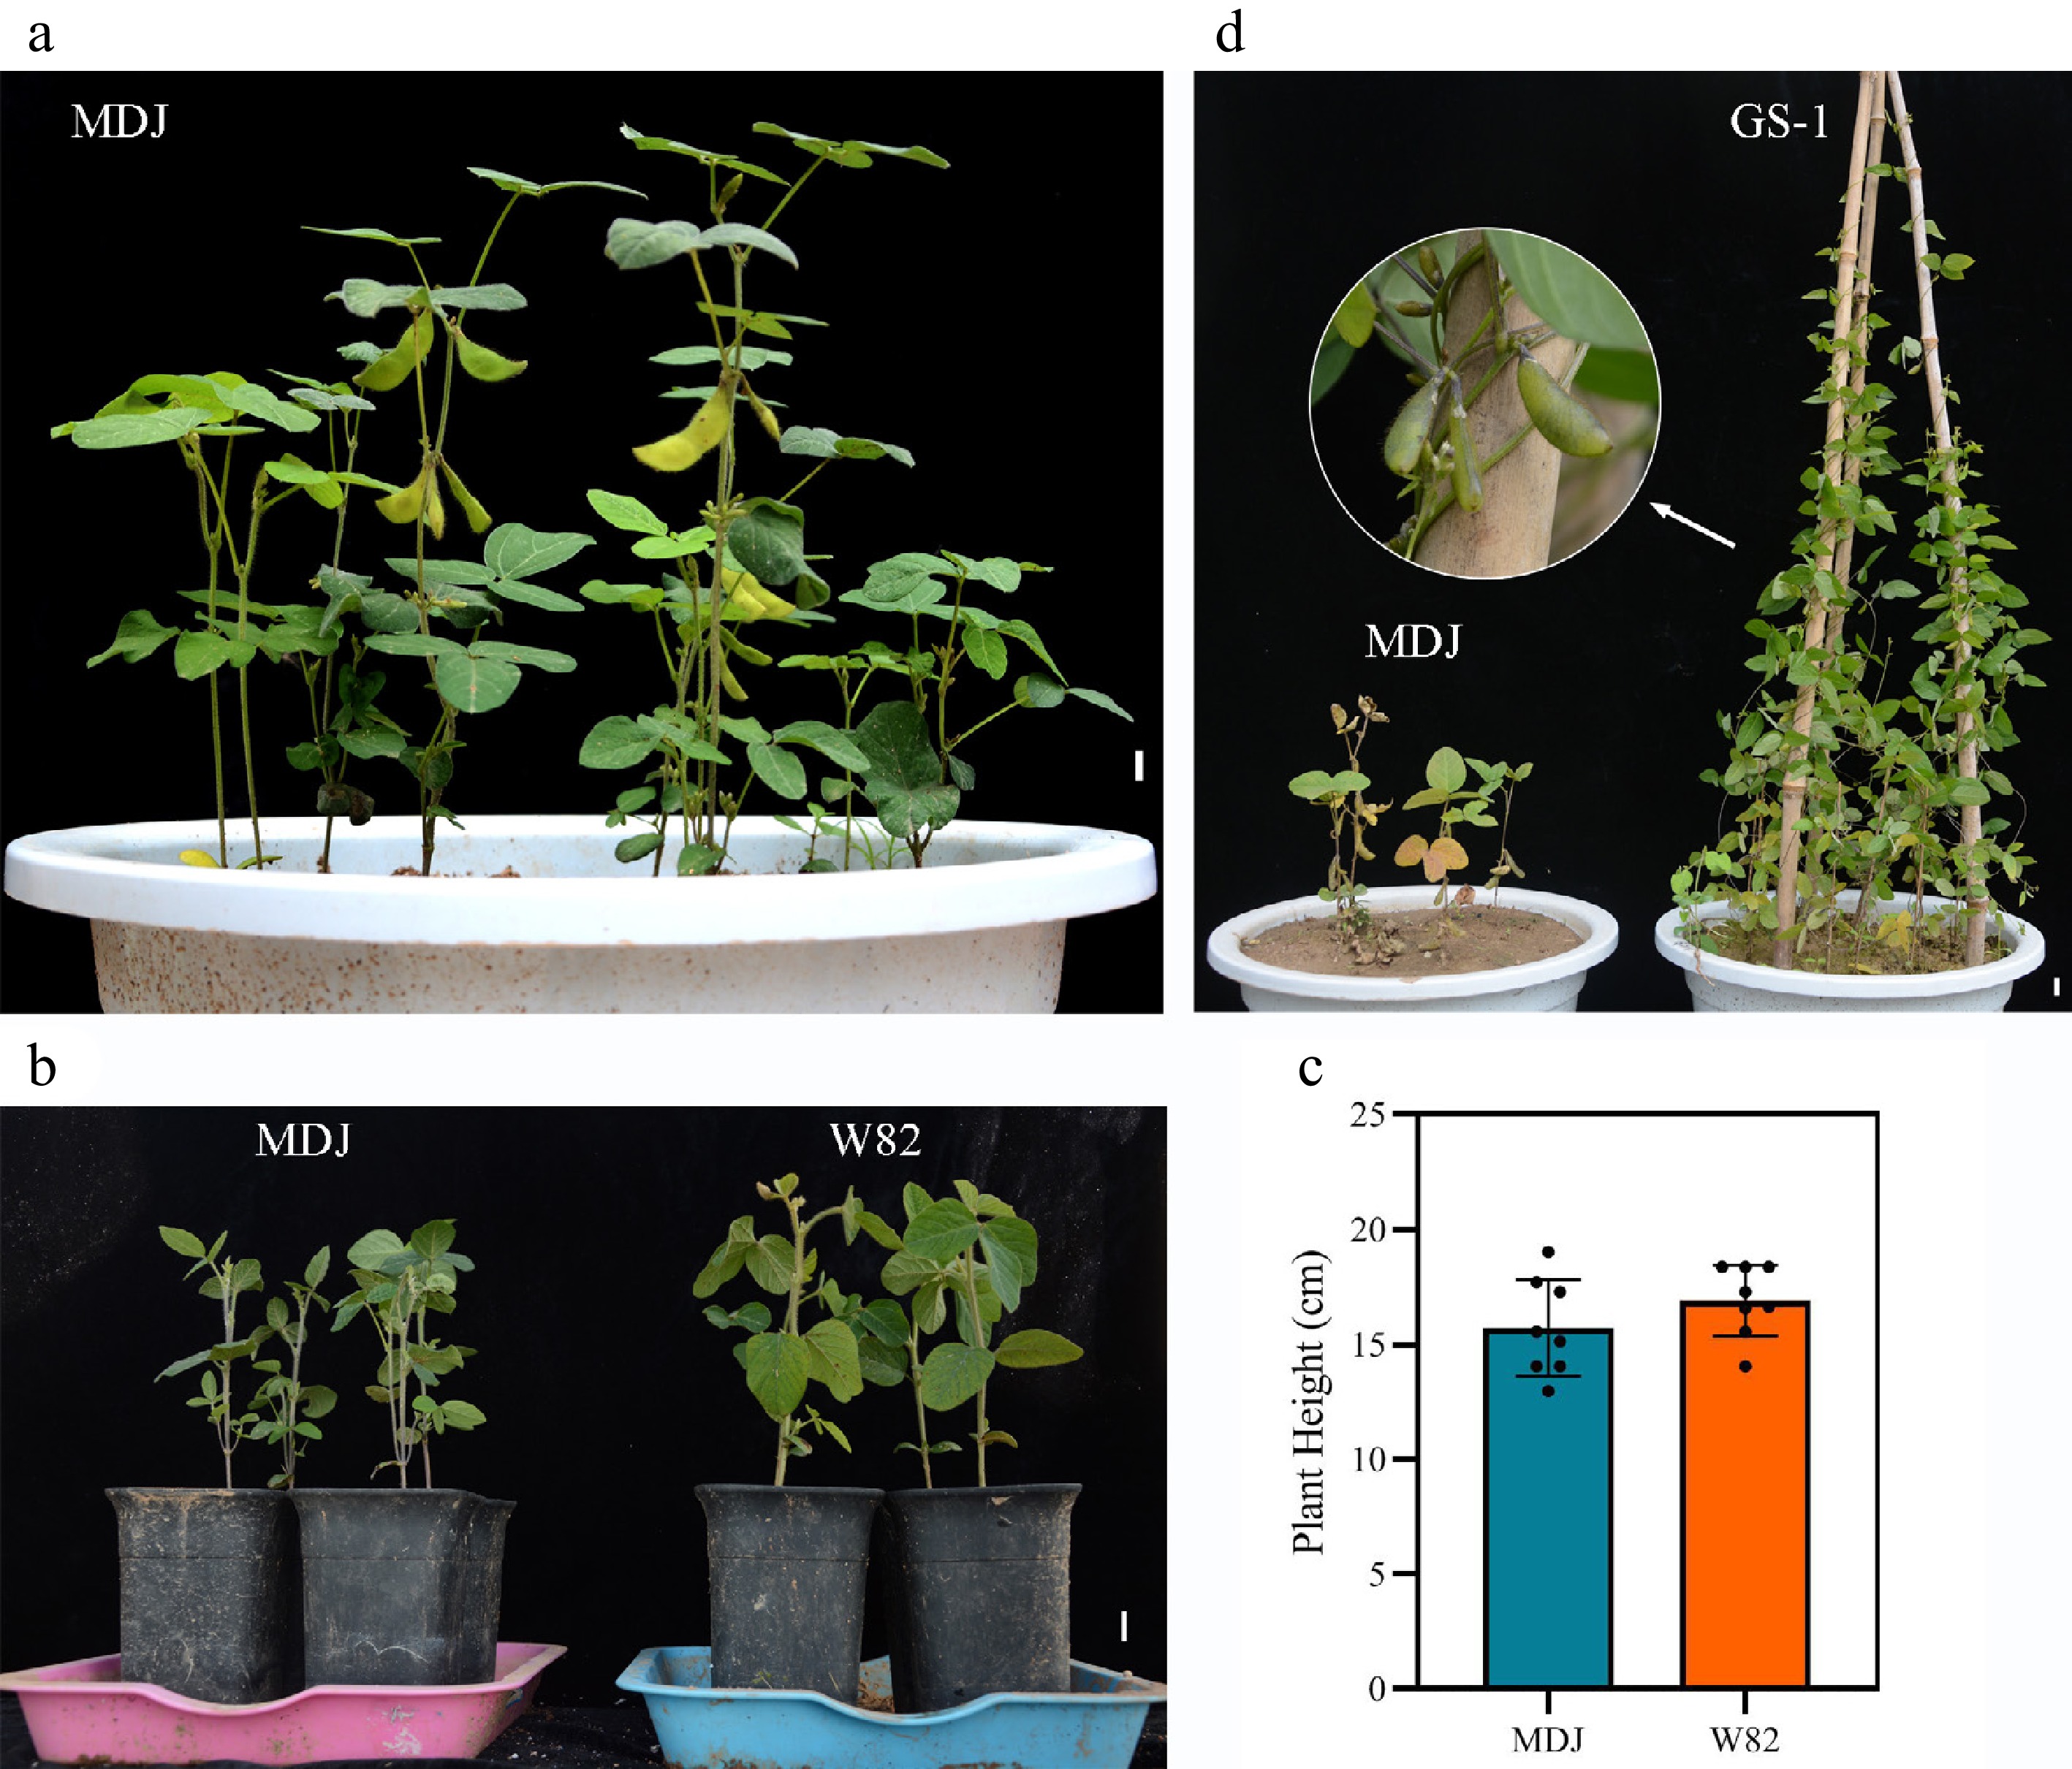
Figure 1.
Fodder soybean MDJ exhibits dwarfing like cultivated soybean when grown at lower latitudes, but wild soybean does not. (a) Growth phenotypes of MDJ at the pod-filling stage. (b) Phenotypes and (c) plant height of MDJ and W82 at the seedling stage. (d) Growth phenotypes of the fodder soybean MDJ and the wild soybean GS-1 at the pod-filling stage. All plants were grown under natural conditions. Scale bar = 2 cm. Data are presented as the mean ± standard deviation (SD). n = 8.
-
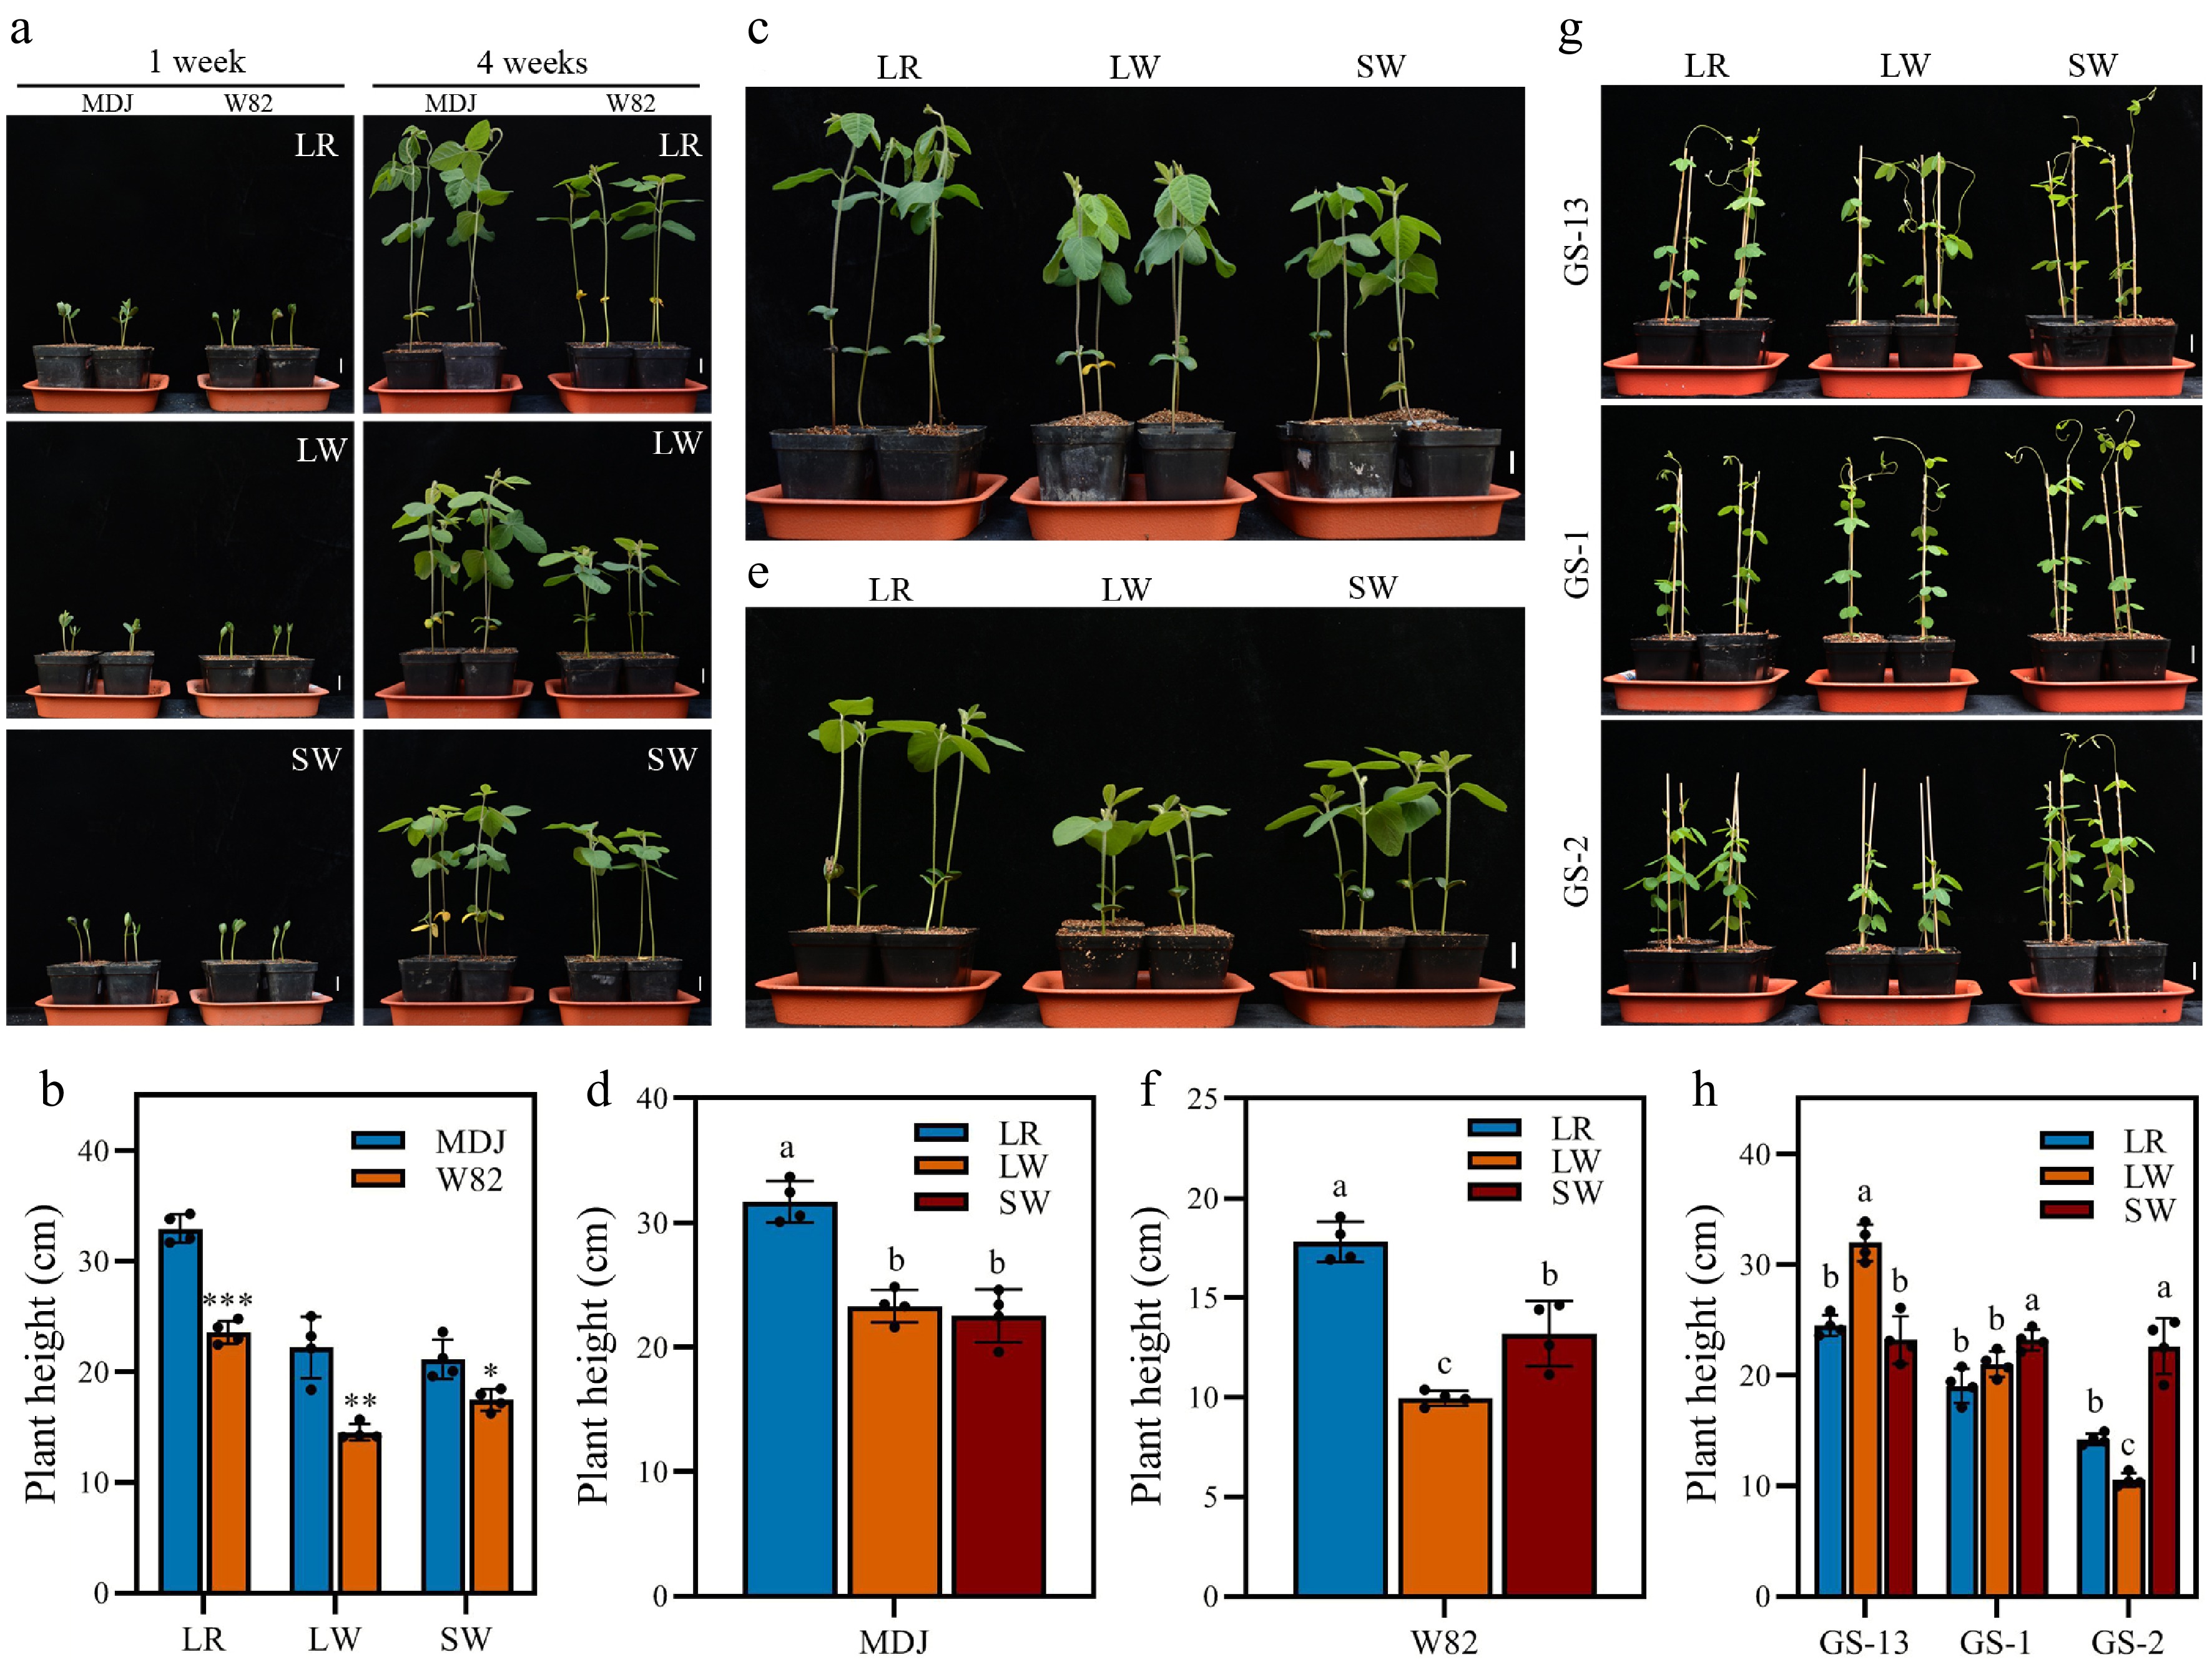
Figure 2.
Effects of light quality and photoperiod during growth on plant height of different soybean accessions at the seedling stage. (a) Phenotypes and (b) plant height of the fodder soybean MDJ and the cultivated soybean W82 under different light conditions. Seedlings of MDJ and W82 with uniform growth phenotypes at 2–3 d after germination were selected and further cultured under long-day white–red = 6:1 (LR), long-day white (LW), and short-day white (SW) for 1 week or 4 weeks, then photographs were taken and plant height was measured. (c) Growth phenotypes and (d) plant height of MDJ under LR, LW, and SW. (e) Growth phenotypes and (f) plant height of W82 under LR, LW, and SW. The culture conditions for (c) and (f) were the same as for (a) and (b), with photographs taken and height measured after 2 weeks of continued culture. (g) Growth phenotypes and (h) plant height of three different wild soybean accessions under LR, LW, and SW. Seedlings with uniform growth phenotypes at 5 d after germination were selected and further cultured under LR, LW, or SW for 2 weeks, when photographs were taken and plant height was measured. Scale bar = 2 cm. Data are expressed as the mean ± SD. n = 4. Different letters above the bars represent significant differences at p < 0.05 (Duncan's test). Asterisks denote statistically different values according to independent sample t-tests (* p < 0.05, ** p < 0.01, *** p < 0.001).
-
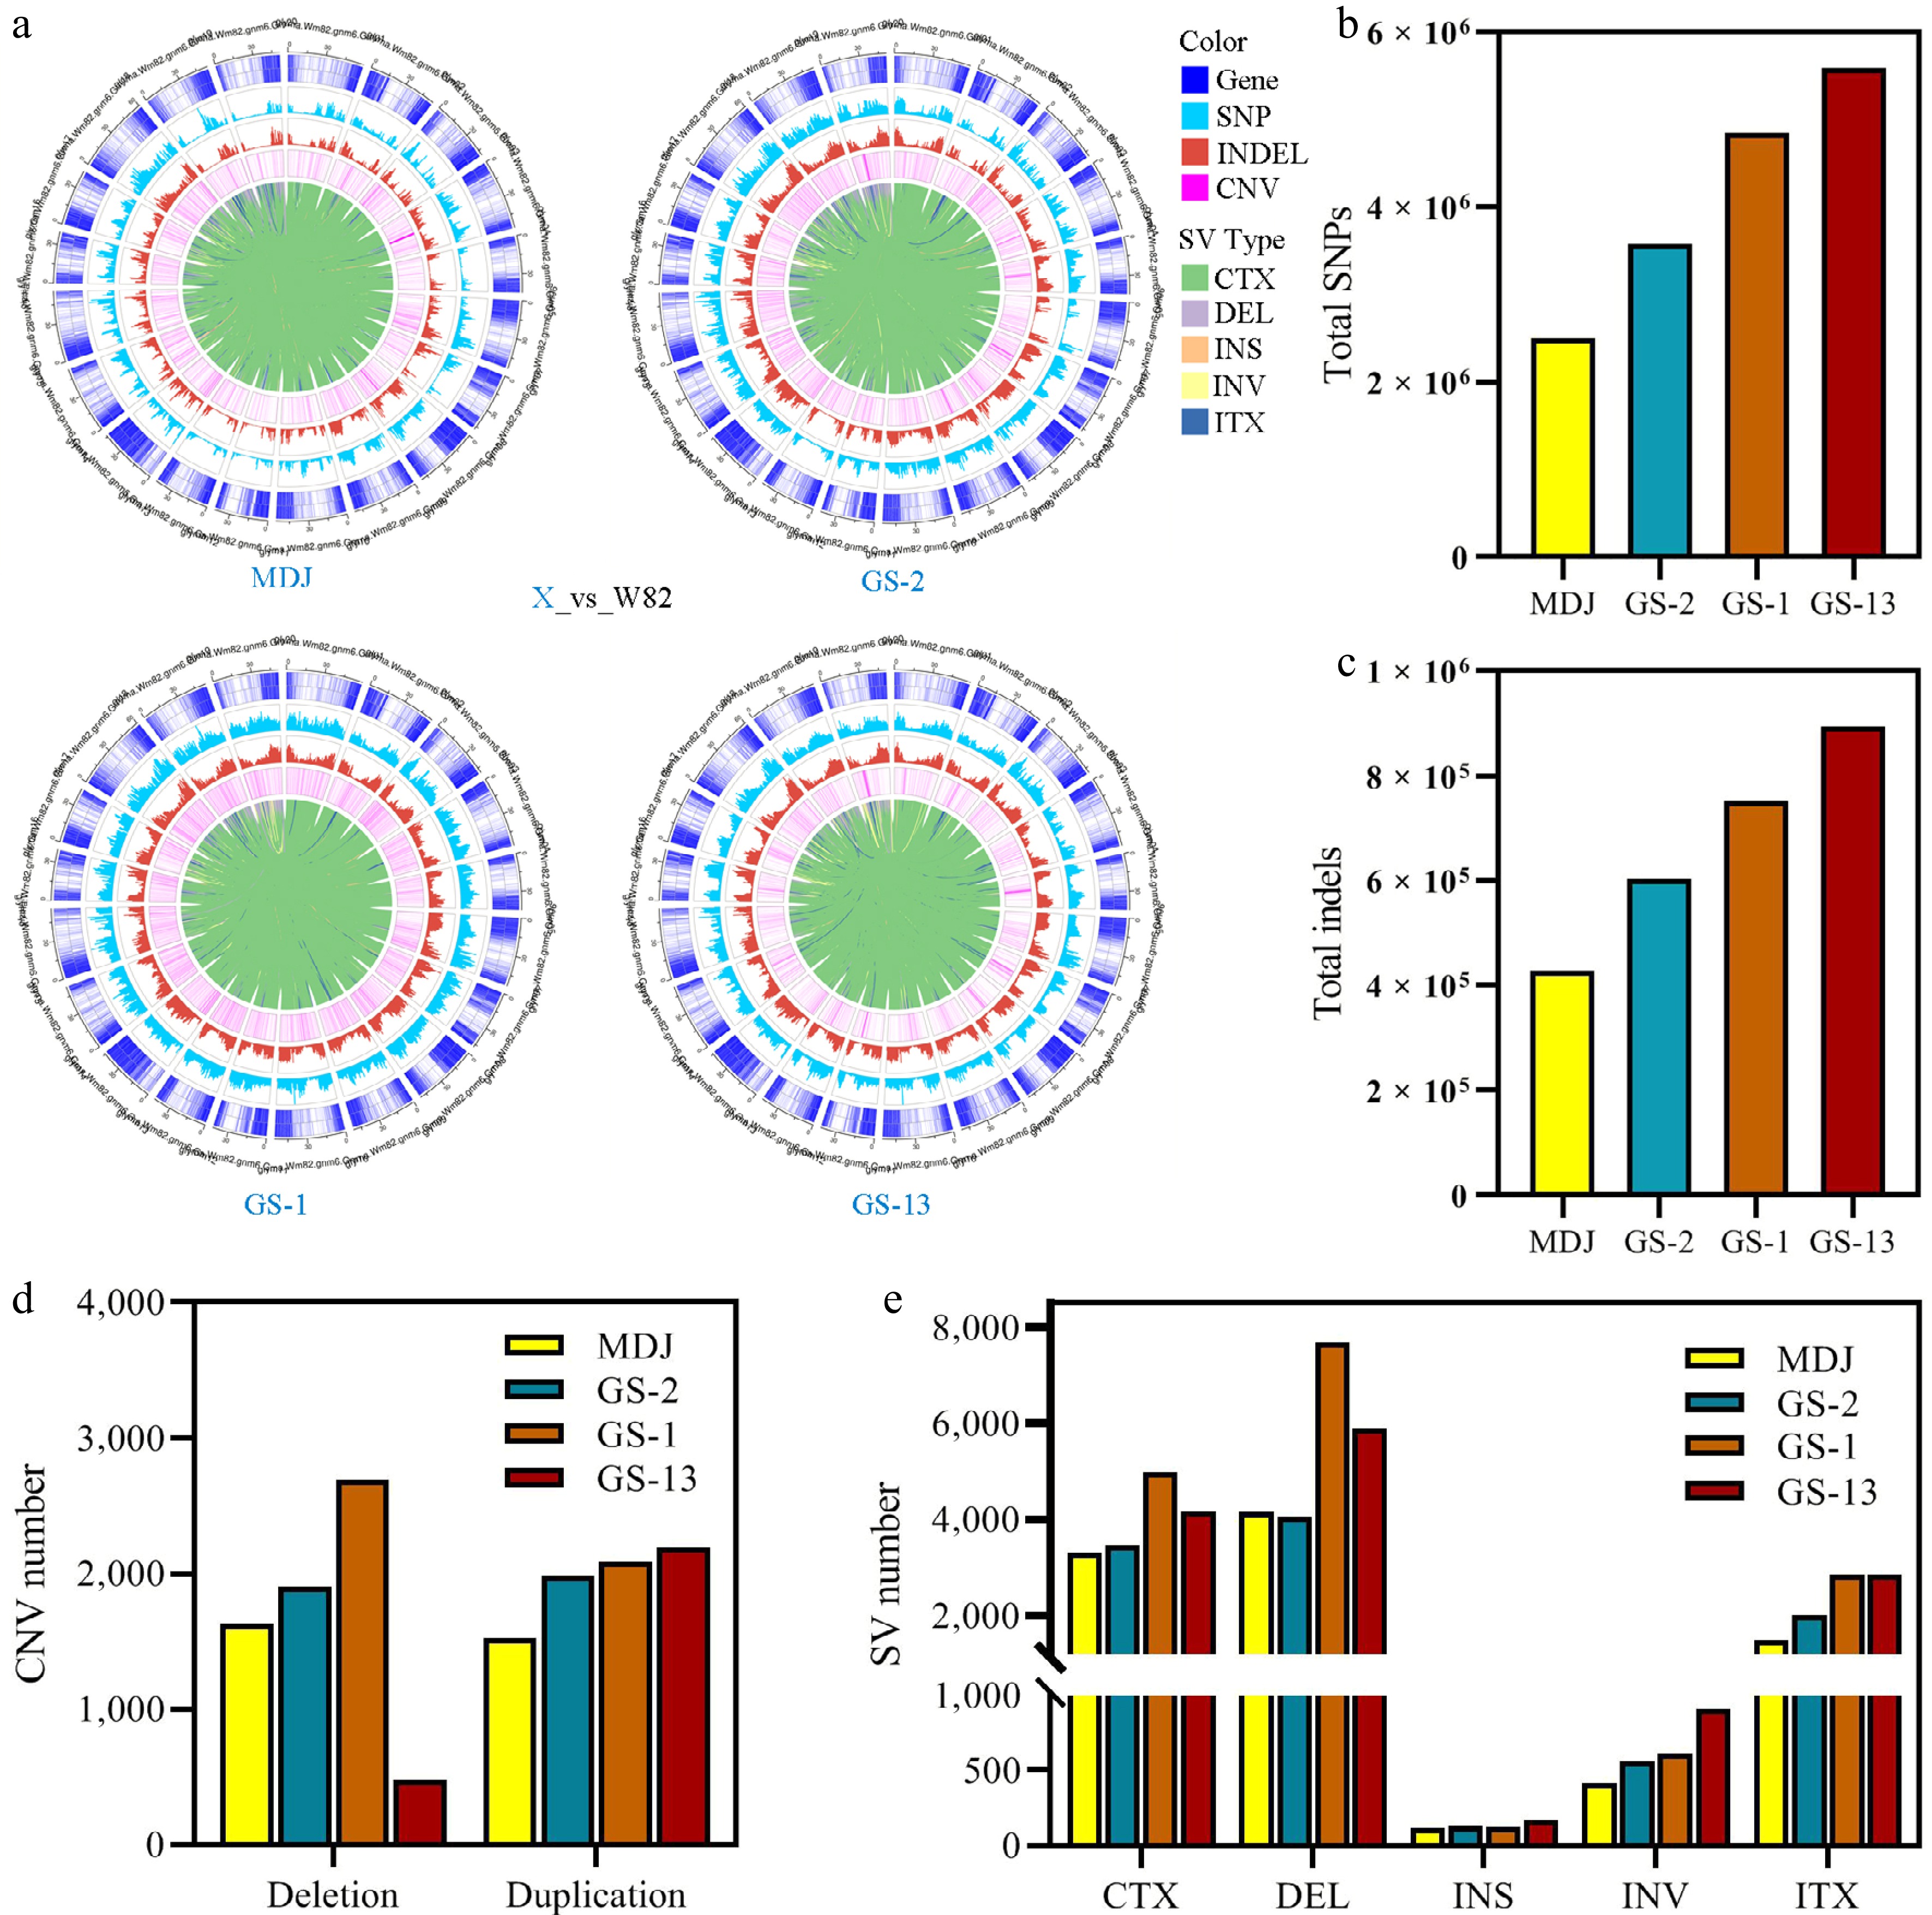
Figure 3.
Genome resequencing analysis of different soybean accessions using W82 as the reference genome. (a) Circular map of genomic variations; (b) single-nucleotide polymorphisms (SNPs); (c) insertions and deletions (indels); (d) copy number variations (CNVs); (e) structural variations (SVs). Data were obtained from genome resequencing. The color coding indicates different variant types.
-
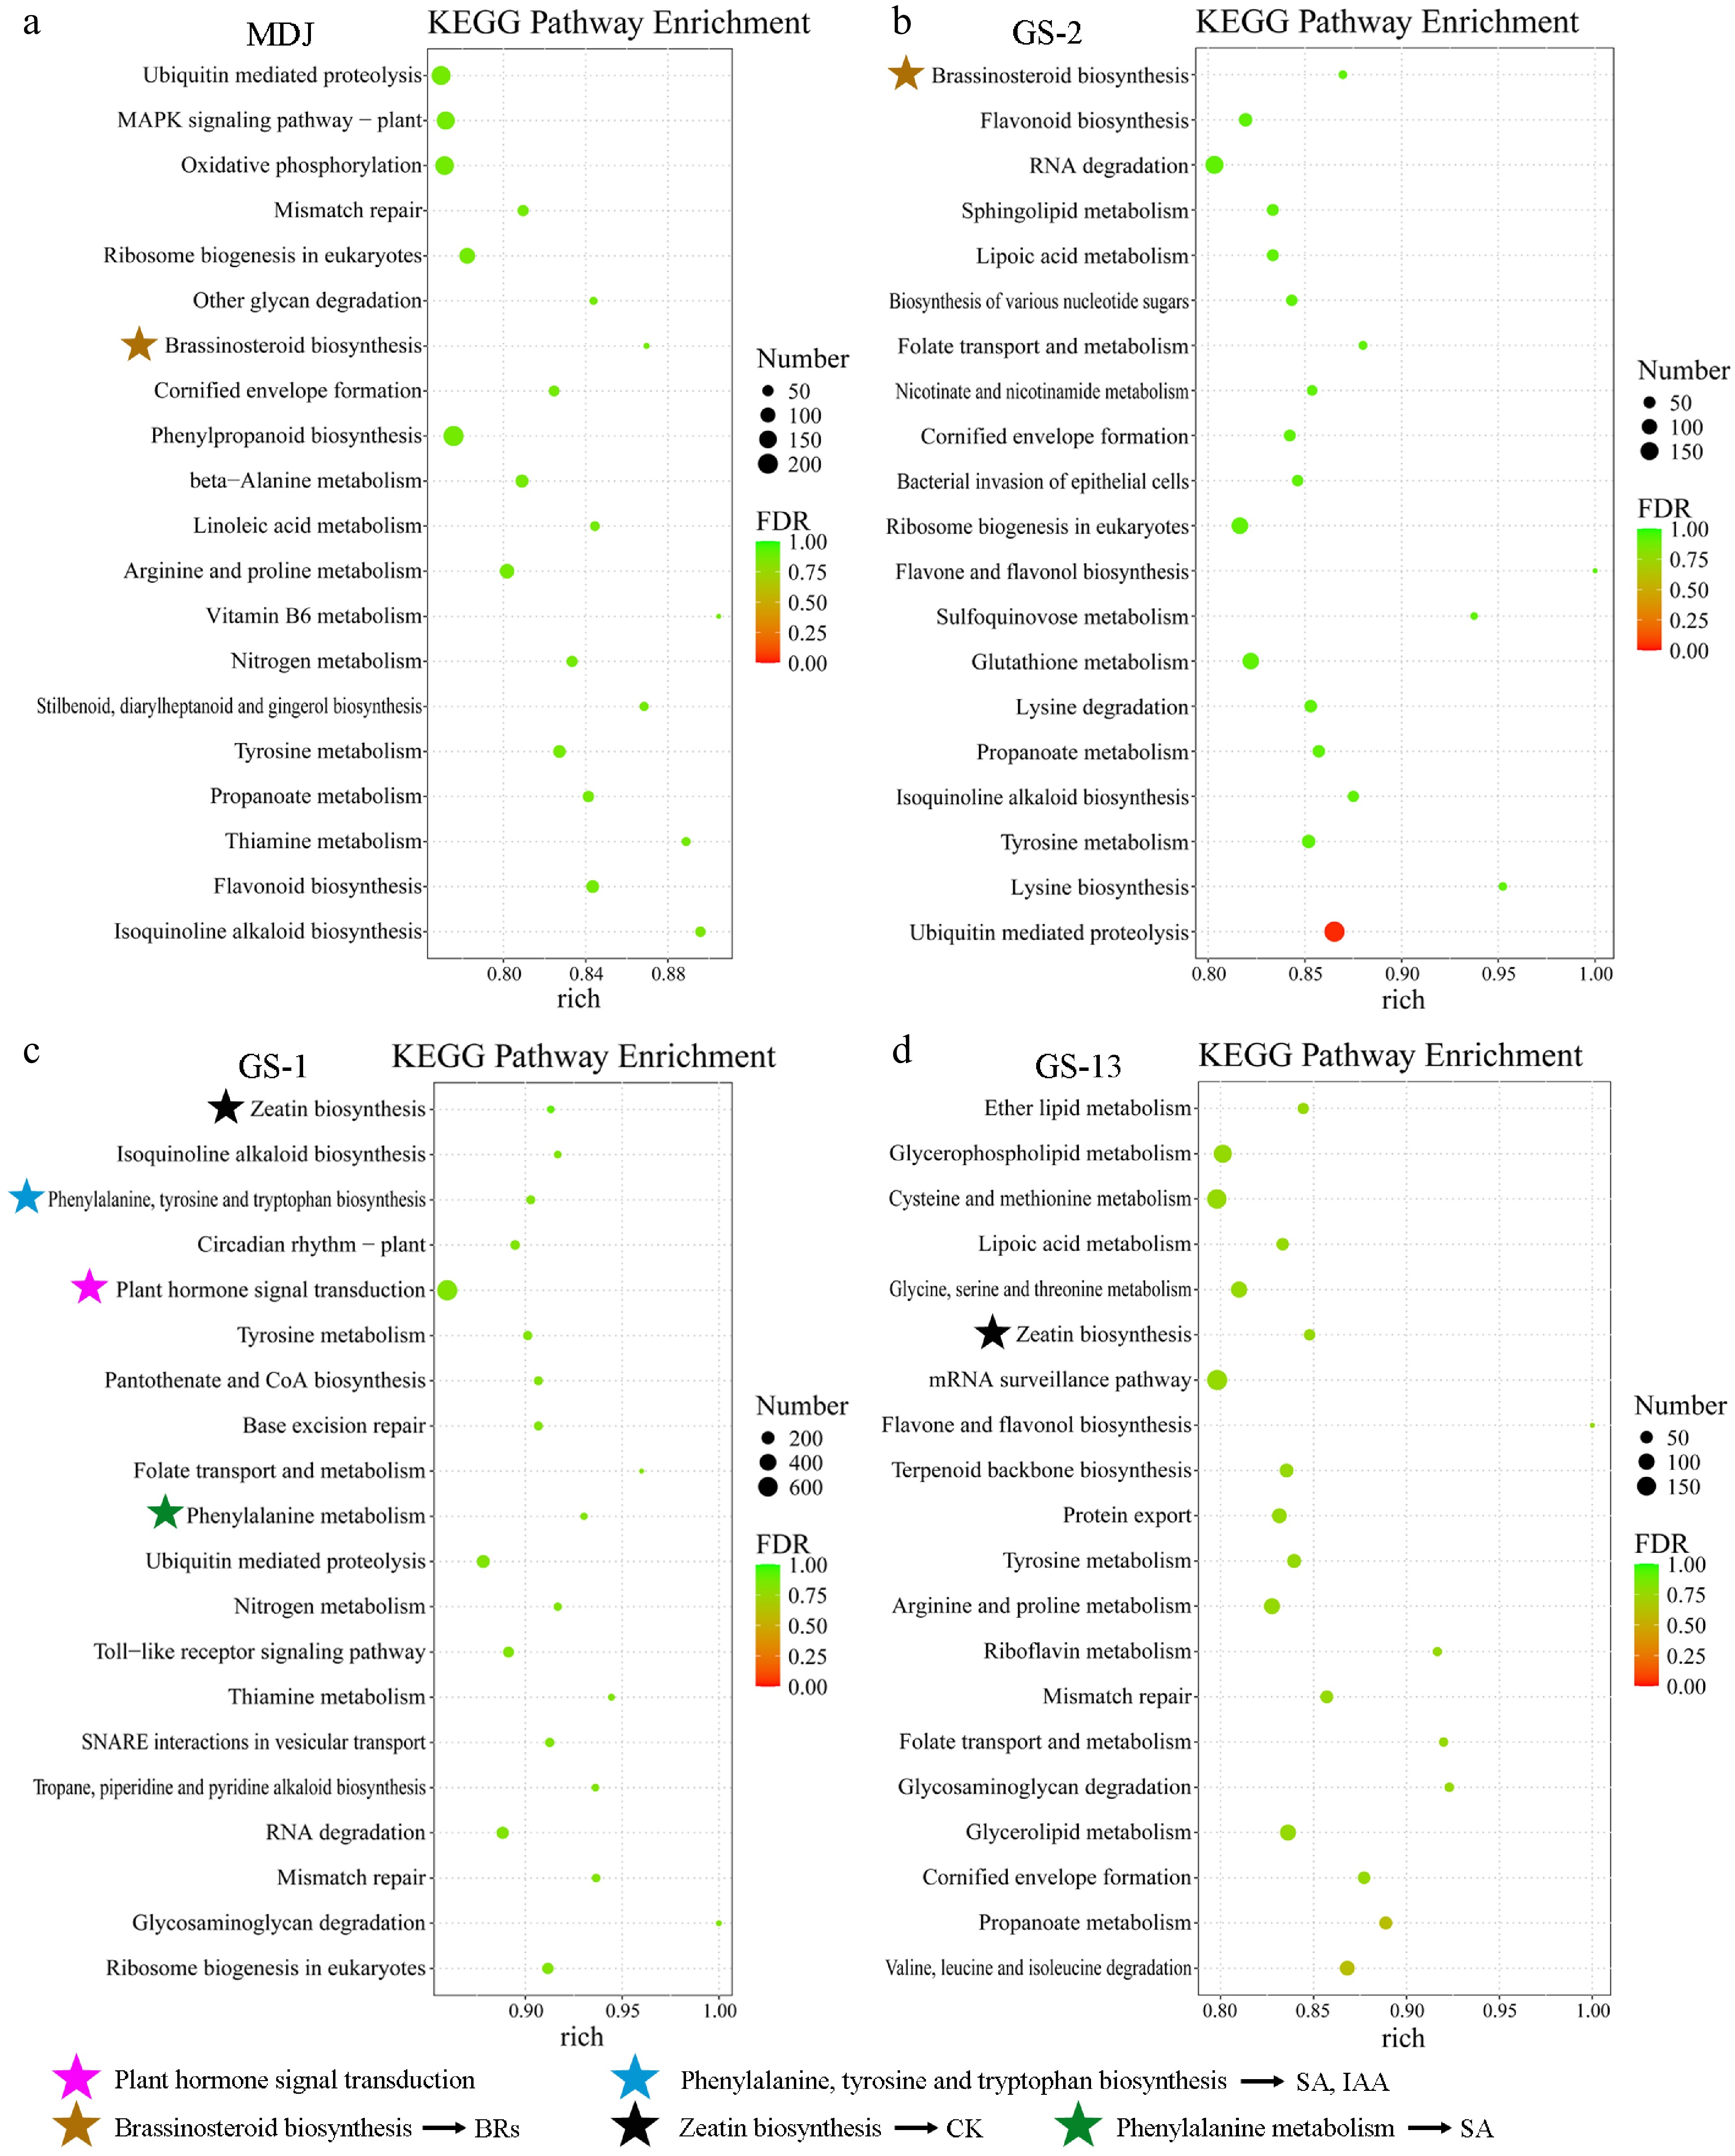
Figure 4.
KEGG pathway enrichment analysis of genes covered by structural variations (SVs) in soybean accessions (a) MDJ, (b) GS-2, (c) GS-1, and (d) GS-13. Stars mark phytohormone-related pathways: Yellow stars for BR biosynthesis, black stars for zeatin biosynthesis (CK), purple stars for plant hormone signal transduction, blue star for phenylalanine, tyrosine/tryptophan biosynthesis (SA, IAA), and green stars for phenylalanine metabolism (SA).
-
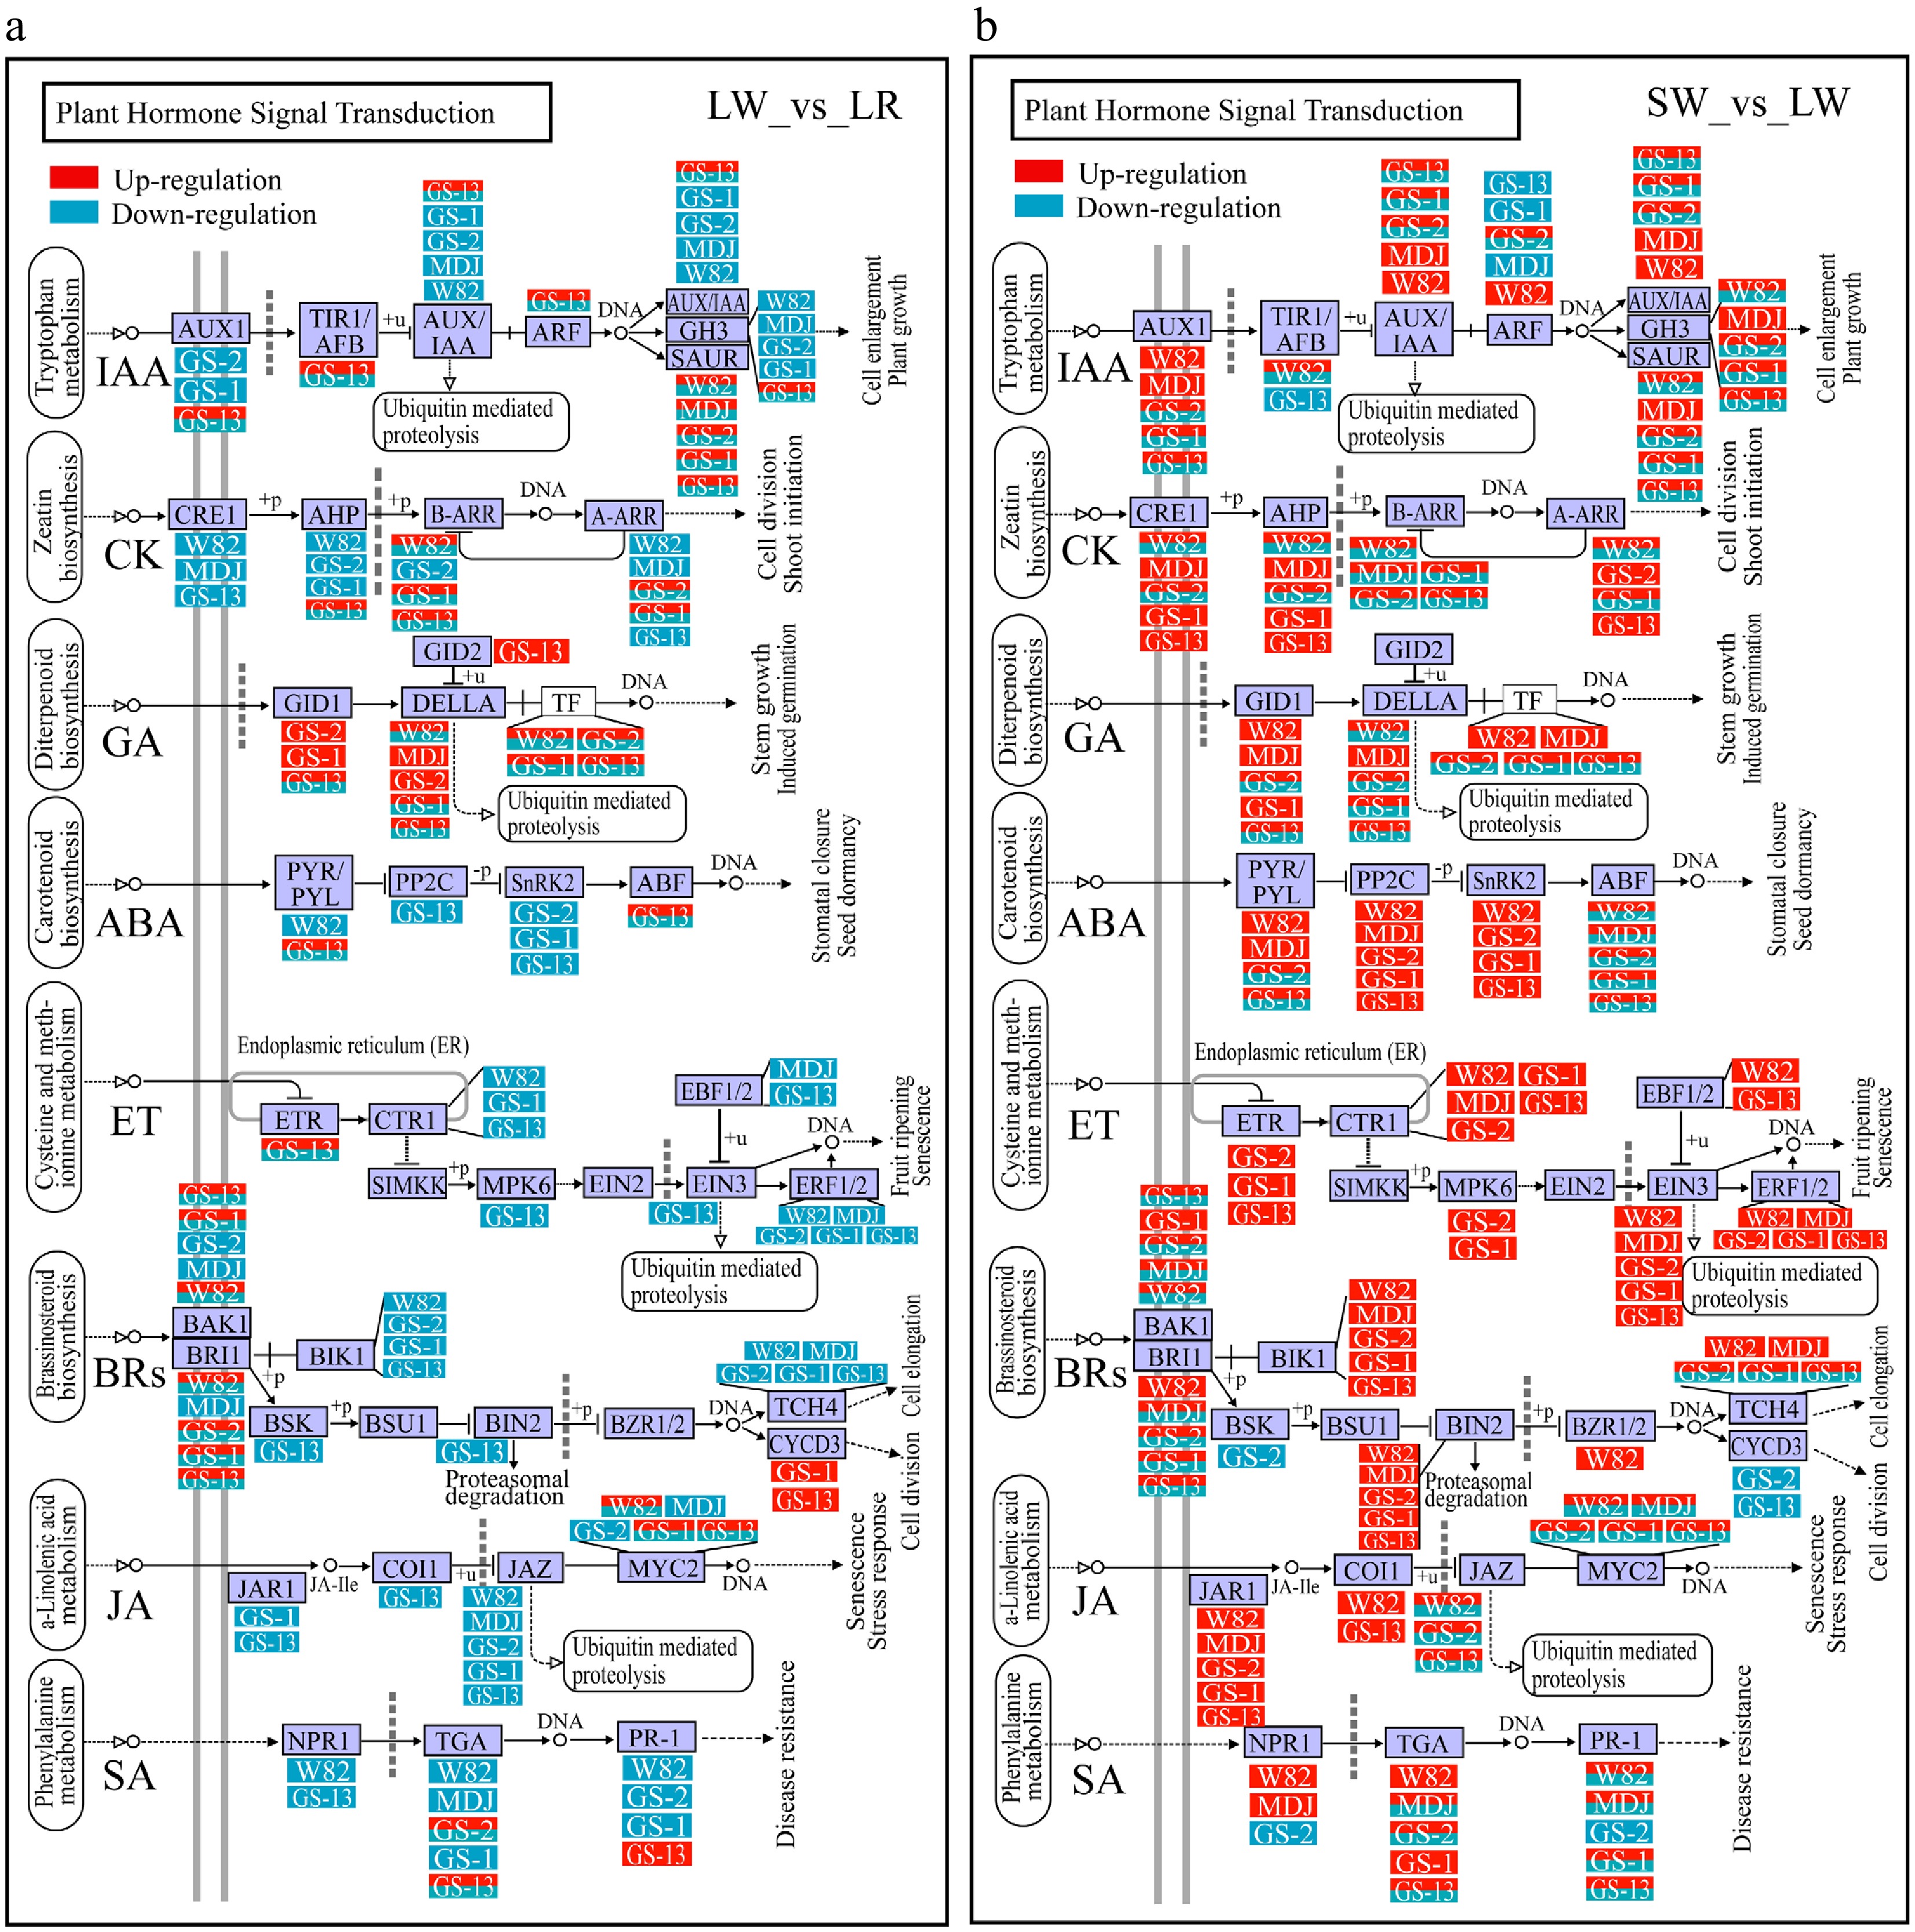
Figure 5.
Gene expression responses in the KEGG pathways for plant hormone signal transduction under different light conditions. (a) Gene expression changes in the LW vs LR comparison. (b) Gene expression changes in the SW vs LW comparison. LR, LW, and SW represent long-day white–red = 6:1 light, long-day white light, and short-day white light conditions, respectively. Red boxes indicate upregulated genes. Blue boxes indicate downregulated genes. Red–blue boxes indicate that different members of a gene family show both up- and downregulation. Gene names and their corresponding accessions (GS-13, GS-1, GS-2, W82, and MDJ) are labeled within boxes. The pathway framework was based on the KEGG database (© Kanehisa Laboratories). Hormone abbreviations: Auxin, IAA; cytokinin, CK; gibberellin, GA; abscisic acid, ABA; ethylene, ET; brassinosteroids, BRs; jasmonic acid, JA; salicylic acid, SA.
-
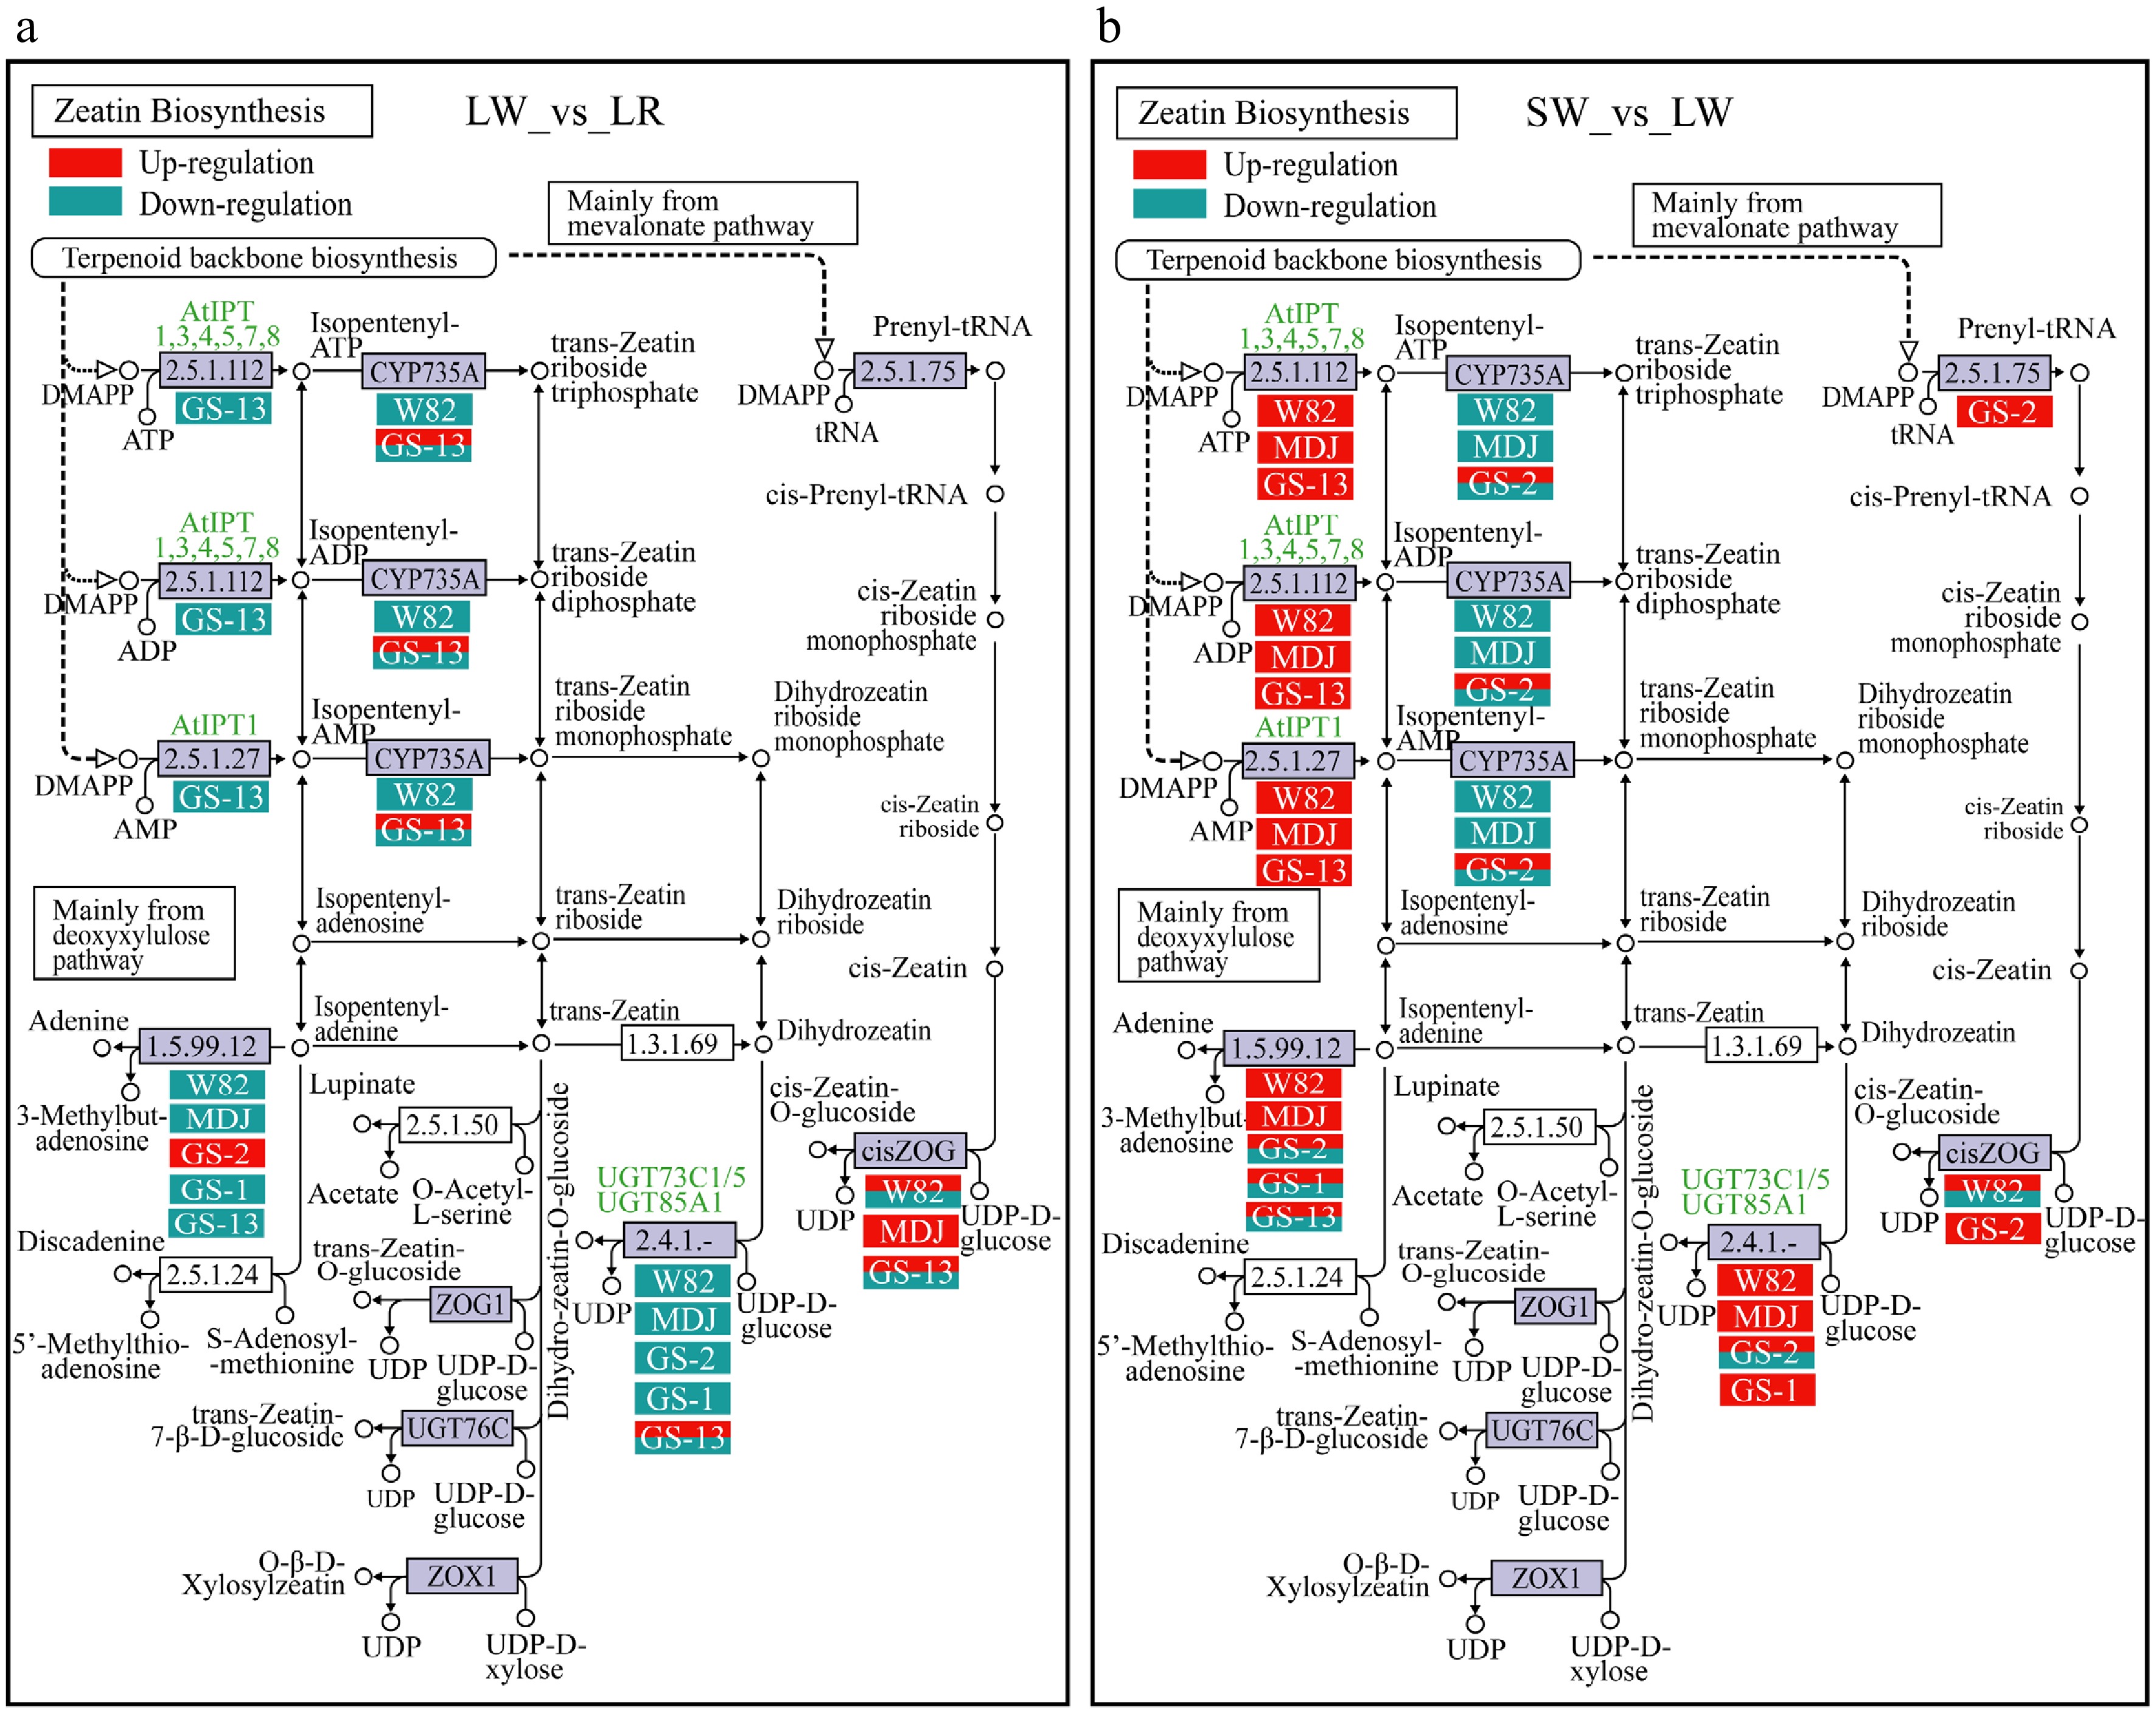
Figure 6.
Gene expression responses in the KEGG pathway of zeatin biosynthesis under different light conditions. (a) Gene expression changes in the LW vs LR comparison. (b) Gene expression changes in the SW vs LW comparison. LR, LW, and SW represent long-day white:red = 6:1 light, long-day white light, short-day white light conditions, respectively. Blue boxes indicate downregulated genes. Red–blue boxes indicate that different members of a gene family show both up- and downregulation. Gene names and their corresponding accessions (GS-13, GS-1, GS-2, W82, MDJ) are labeled within boxes. The pathway framework was based on the KEGG database (© Kanehisa Laboratories).
-
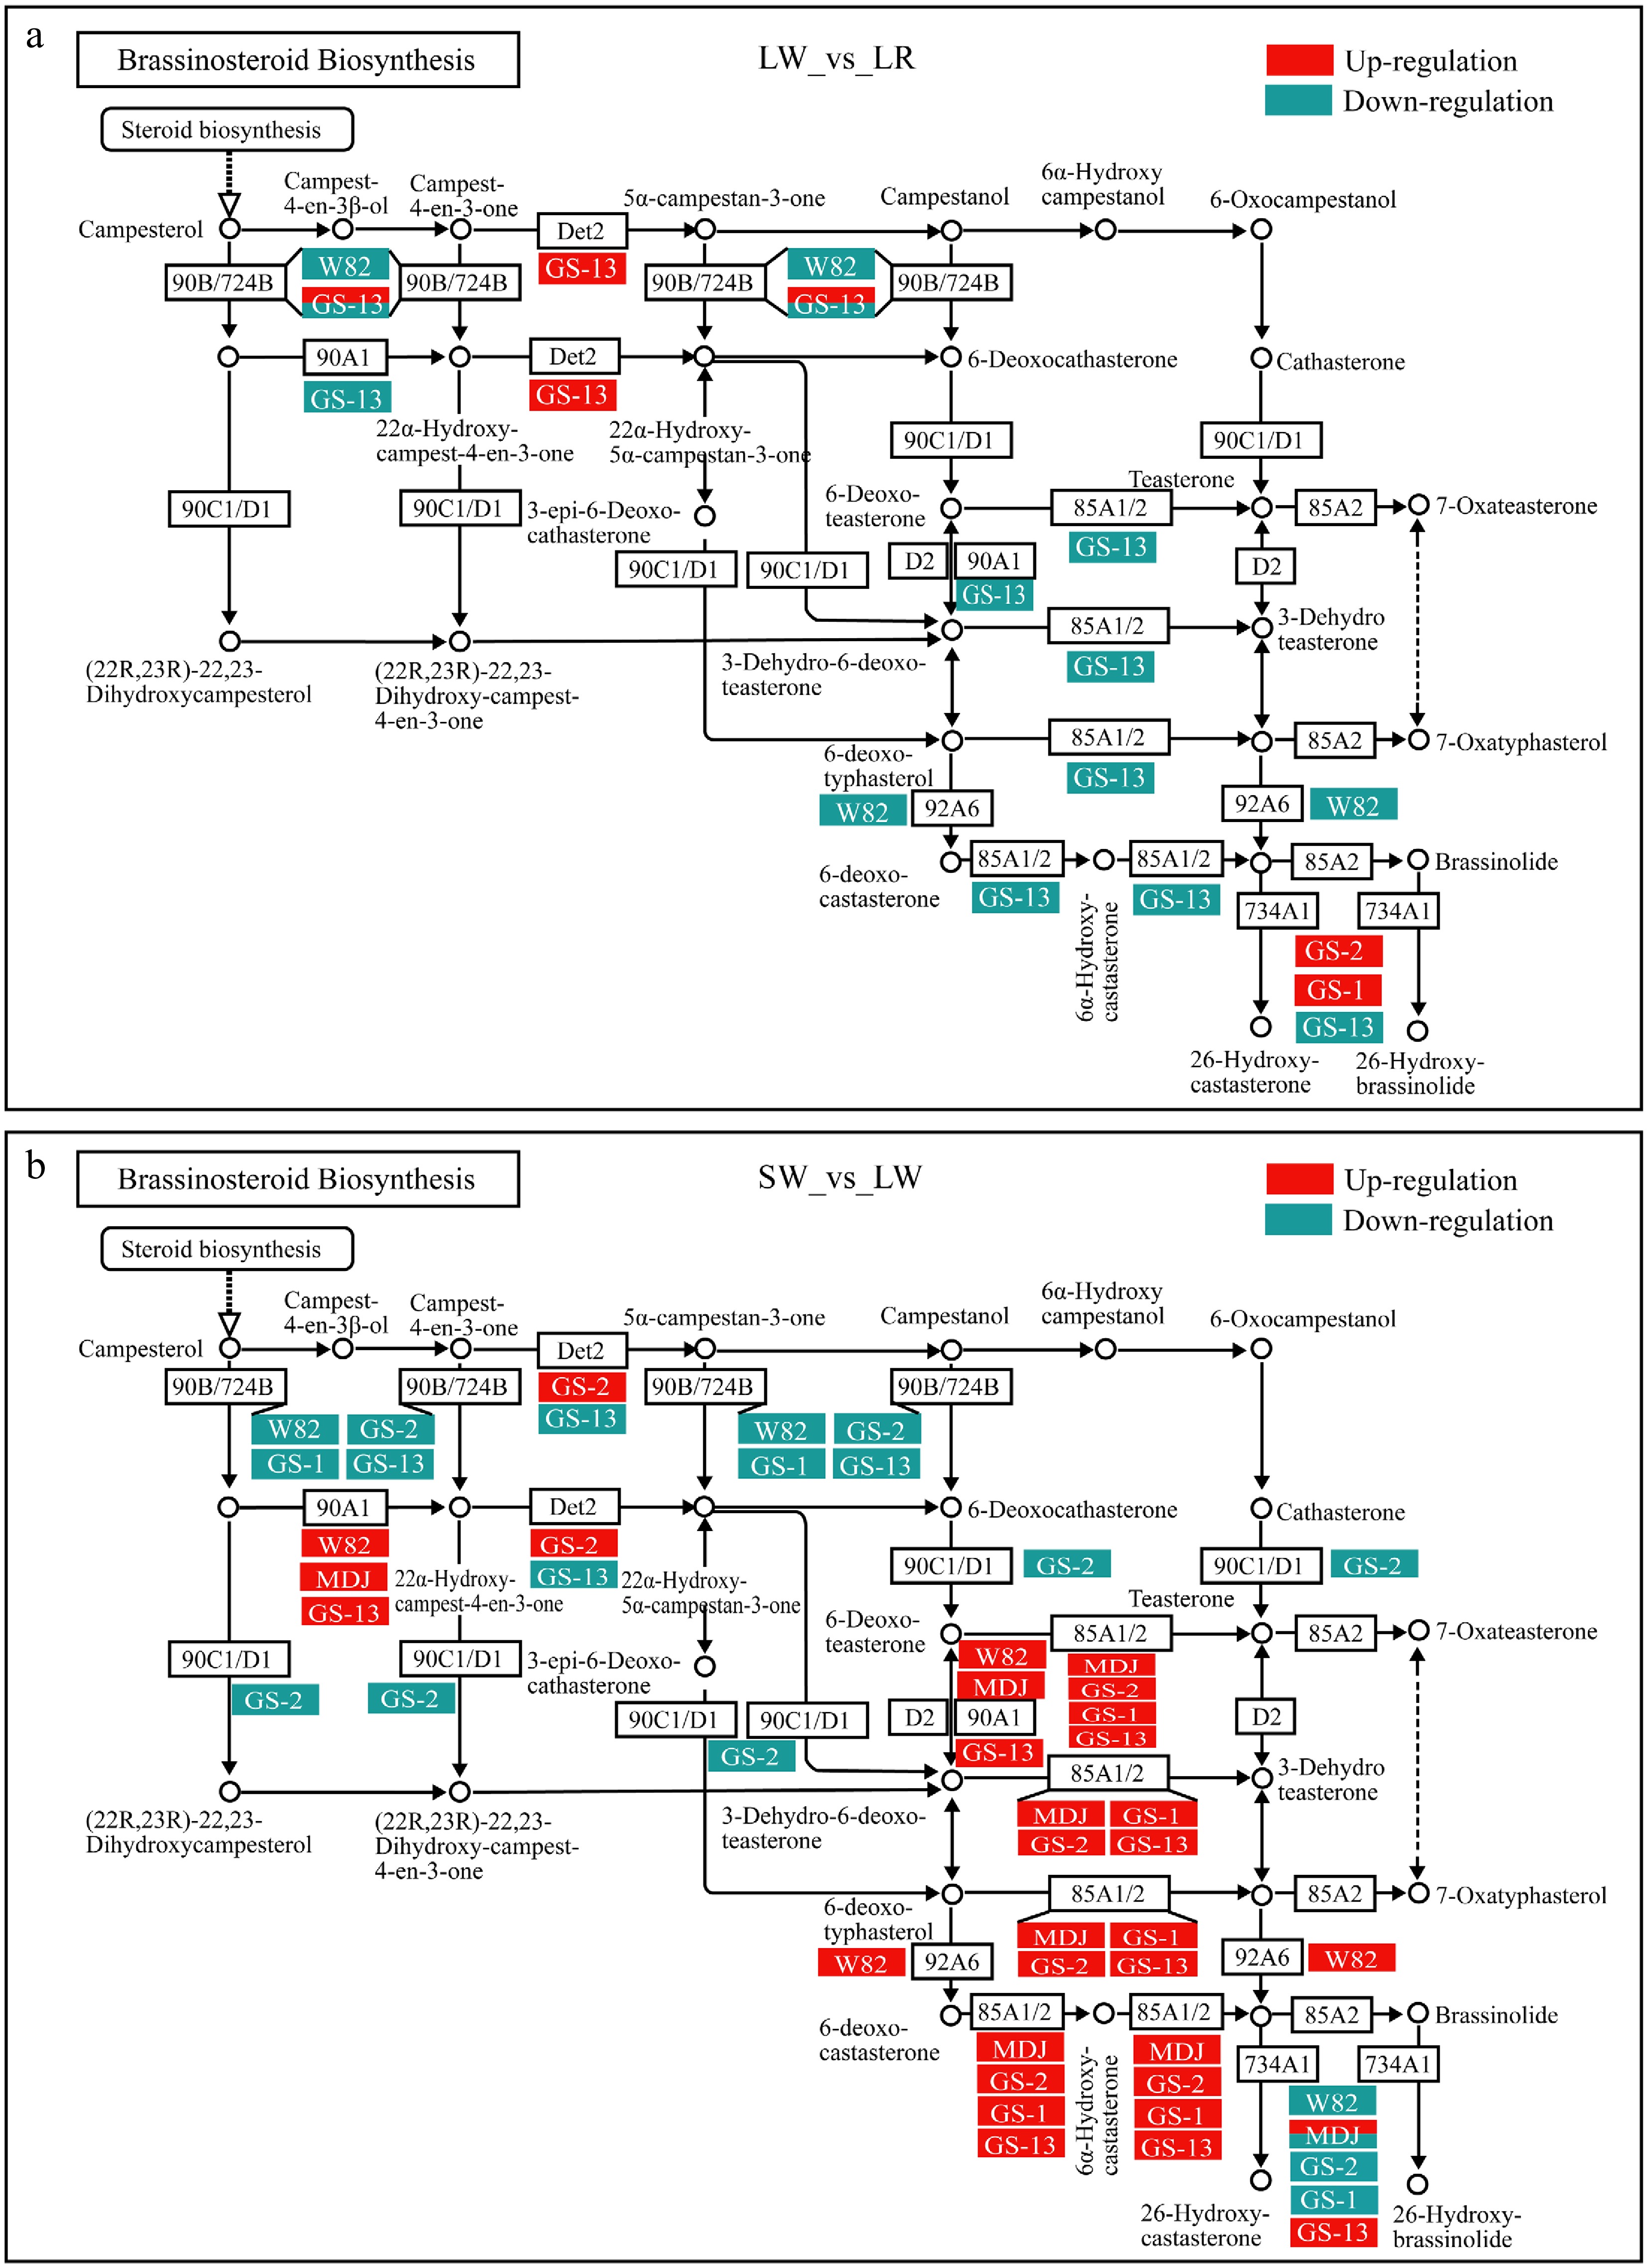
Figure 7.
Gene expression responses in the KEGG pathway of BR biosynthesis under different light conditions. (a) Gene expression changes in the LW vs LR comparison. (b) Gene expression changes in the SW vs LW comparison. LR, LW, and SW represent long-day white:red = 6:1 light, long-day white light, short-day white light conditions, respectively. Red boxes indicate upregulated genes. Blue boxes indicate downregulated genes. Red–blue boxes indicate that different members of a gene family show both up- and downregulation. Gene names and their corresponding accessions (GS-13, GS-1, GS-2, W82, MDJ) are labeled within boxes. The pathway framework was based on the KEGG database (© Kanehisa Laboratories).
-
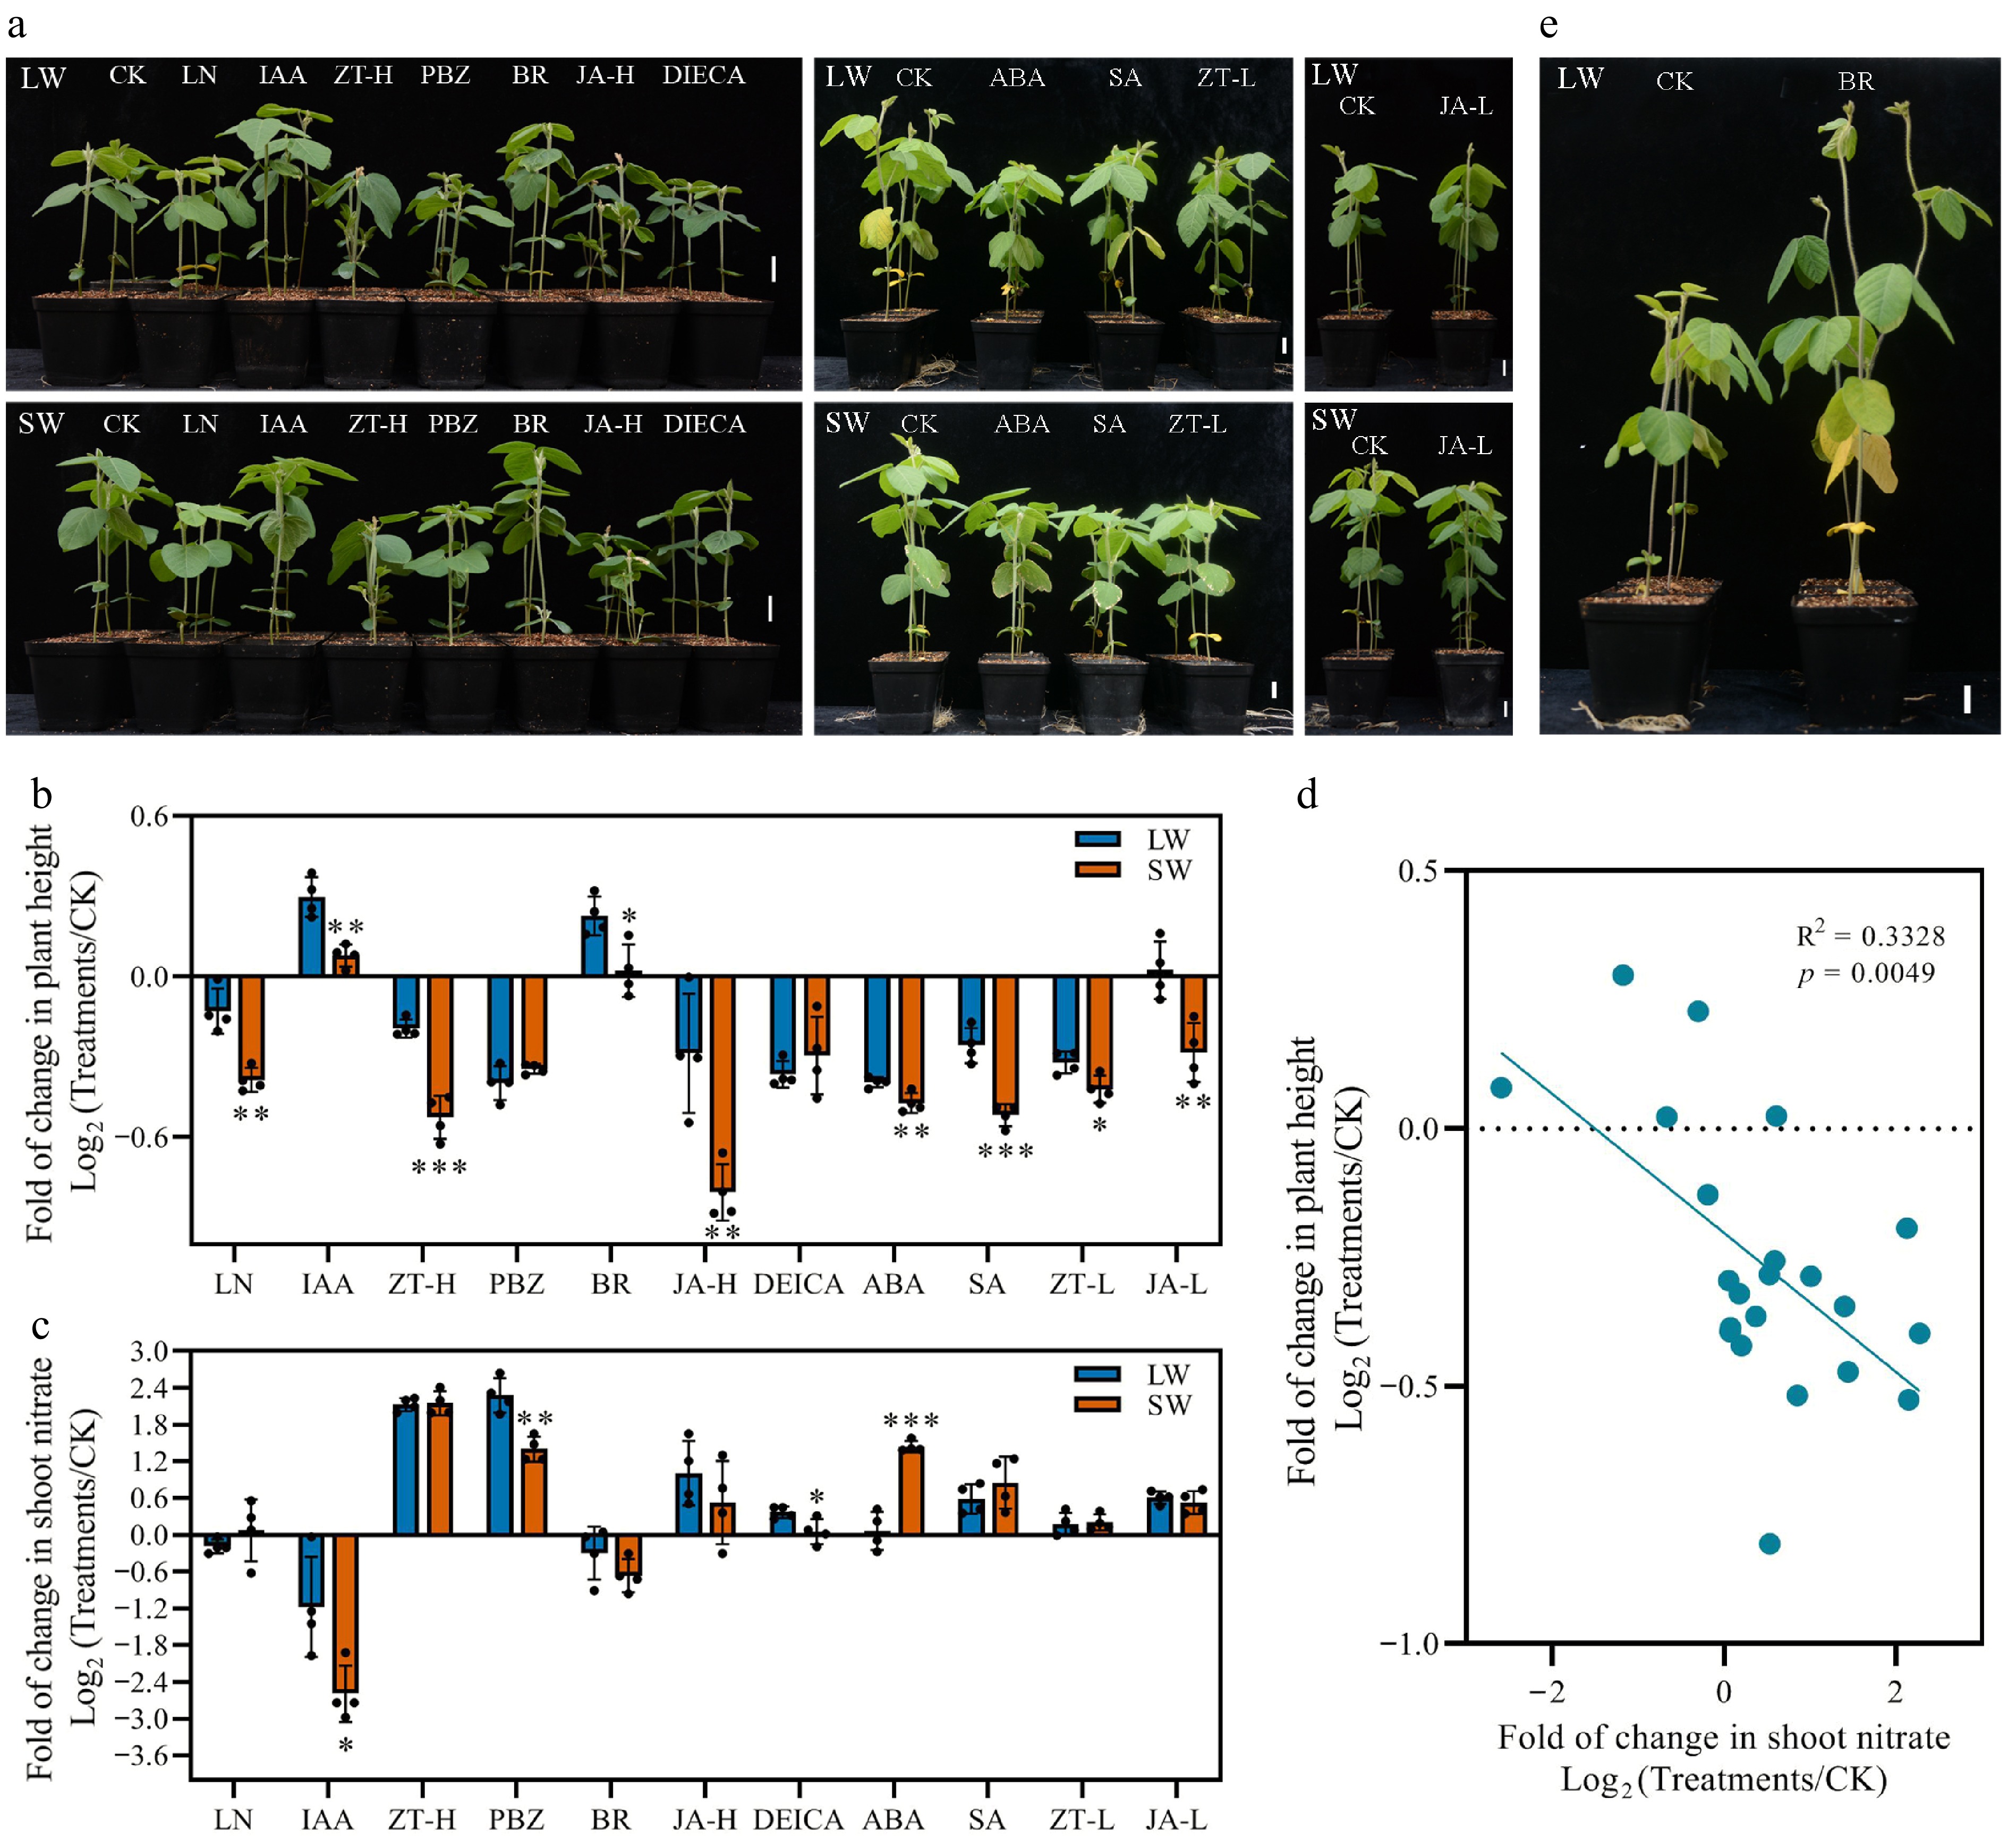
Figure 8.
Shoot apex hormone treatments regulate height in the fodder soybean MDJ in a light-dependent manner, where changes in height are negatively correlated with nitrate levels. (a) Growth phenotypes of MDJ under different light conditions with various hormone treatments. Three-week-old MDJ seedlings were treated with various hormones for 1 week under long-day white (LW) and short-day white (SW) conditions. Batch 1 (left to right): Control, CK; low nitrogen, LN; auxin, IAA; high-concentration zeatin, ZT-H; paclobutrazol, PBZ; brassinosteroid, BR; high-concentration jasmonic acid, JA-H; jasmonic acid inhibitor, DIECA. Batch 2: Control, CK; abscisic acid, ABA; salicylic acid, SA; low-concentration zeatin, ZT-L. Batch 3: Control, CK; low-concentration jasmonic acid, JA-L. Scale bar = 2 cm. Fold of changes in (b) plant height and (c) shoot nitrate concentration. Fold changes in (b) plant height and (c) shoot nitrate concentration in response to the different hormone treatments shown in (a). The log2-transformed values in (b) were derived from the data in Supplementary Fig. S11, and those in (c) were derived from the data in Supplementary Fig. S12. (d) Correlation between height and nitrate changes. (e) Growth phenotype of the fodder soybean MDJ after prolonged BR treatment under LW conditions. Data are expressed as the mean ± SD. n = 4. Asterisks denote statistically different values according to independent sample t-tests (* p < 0.05, ** p < 0.01, *** p < 0.001).
Figures
(8)
Tables
(0)