-
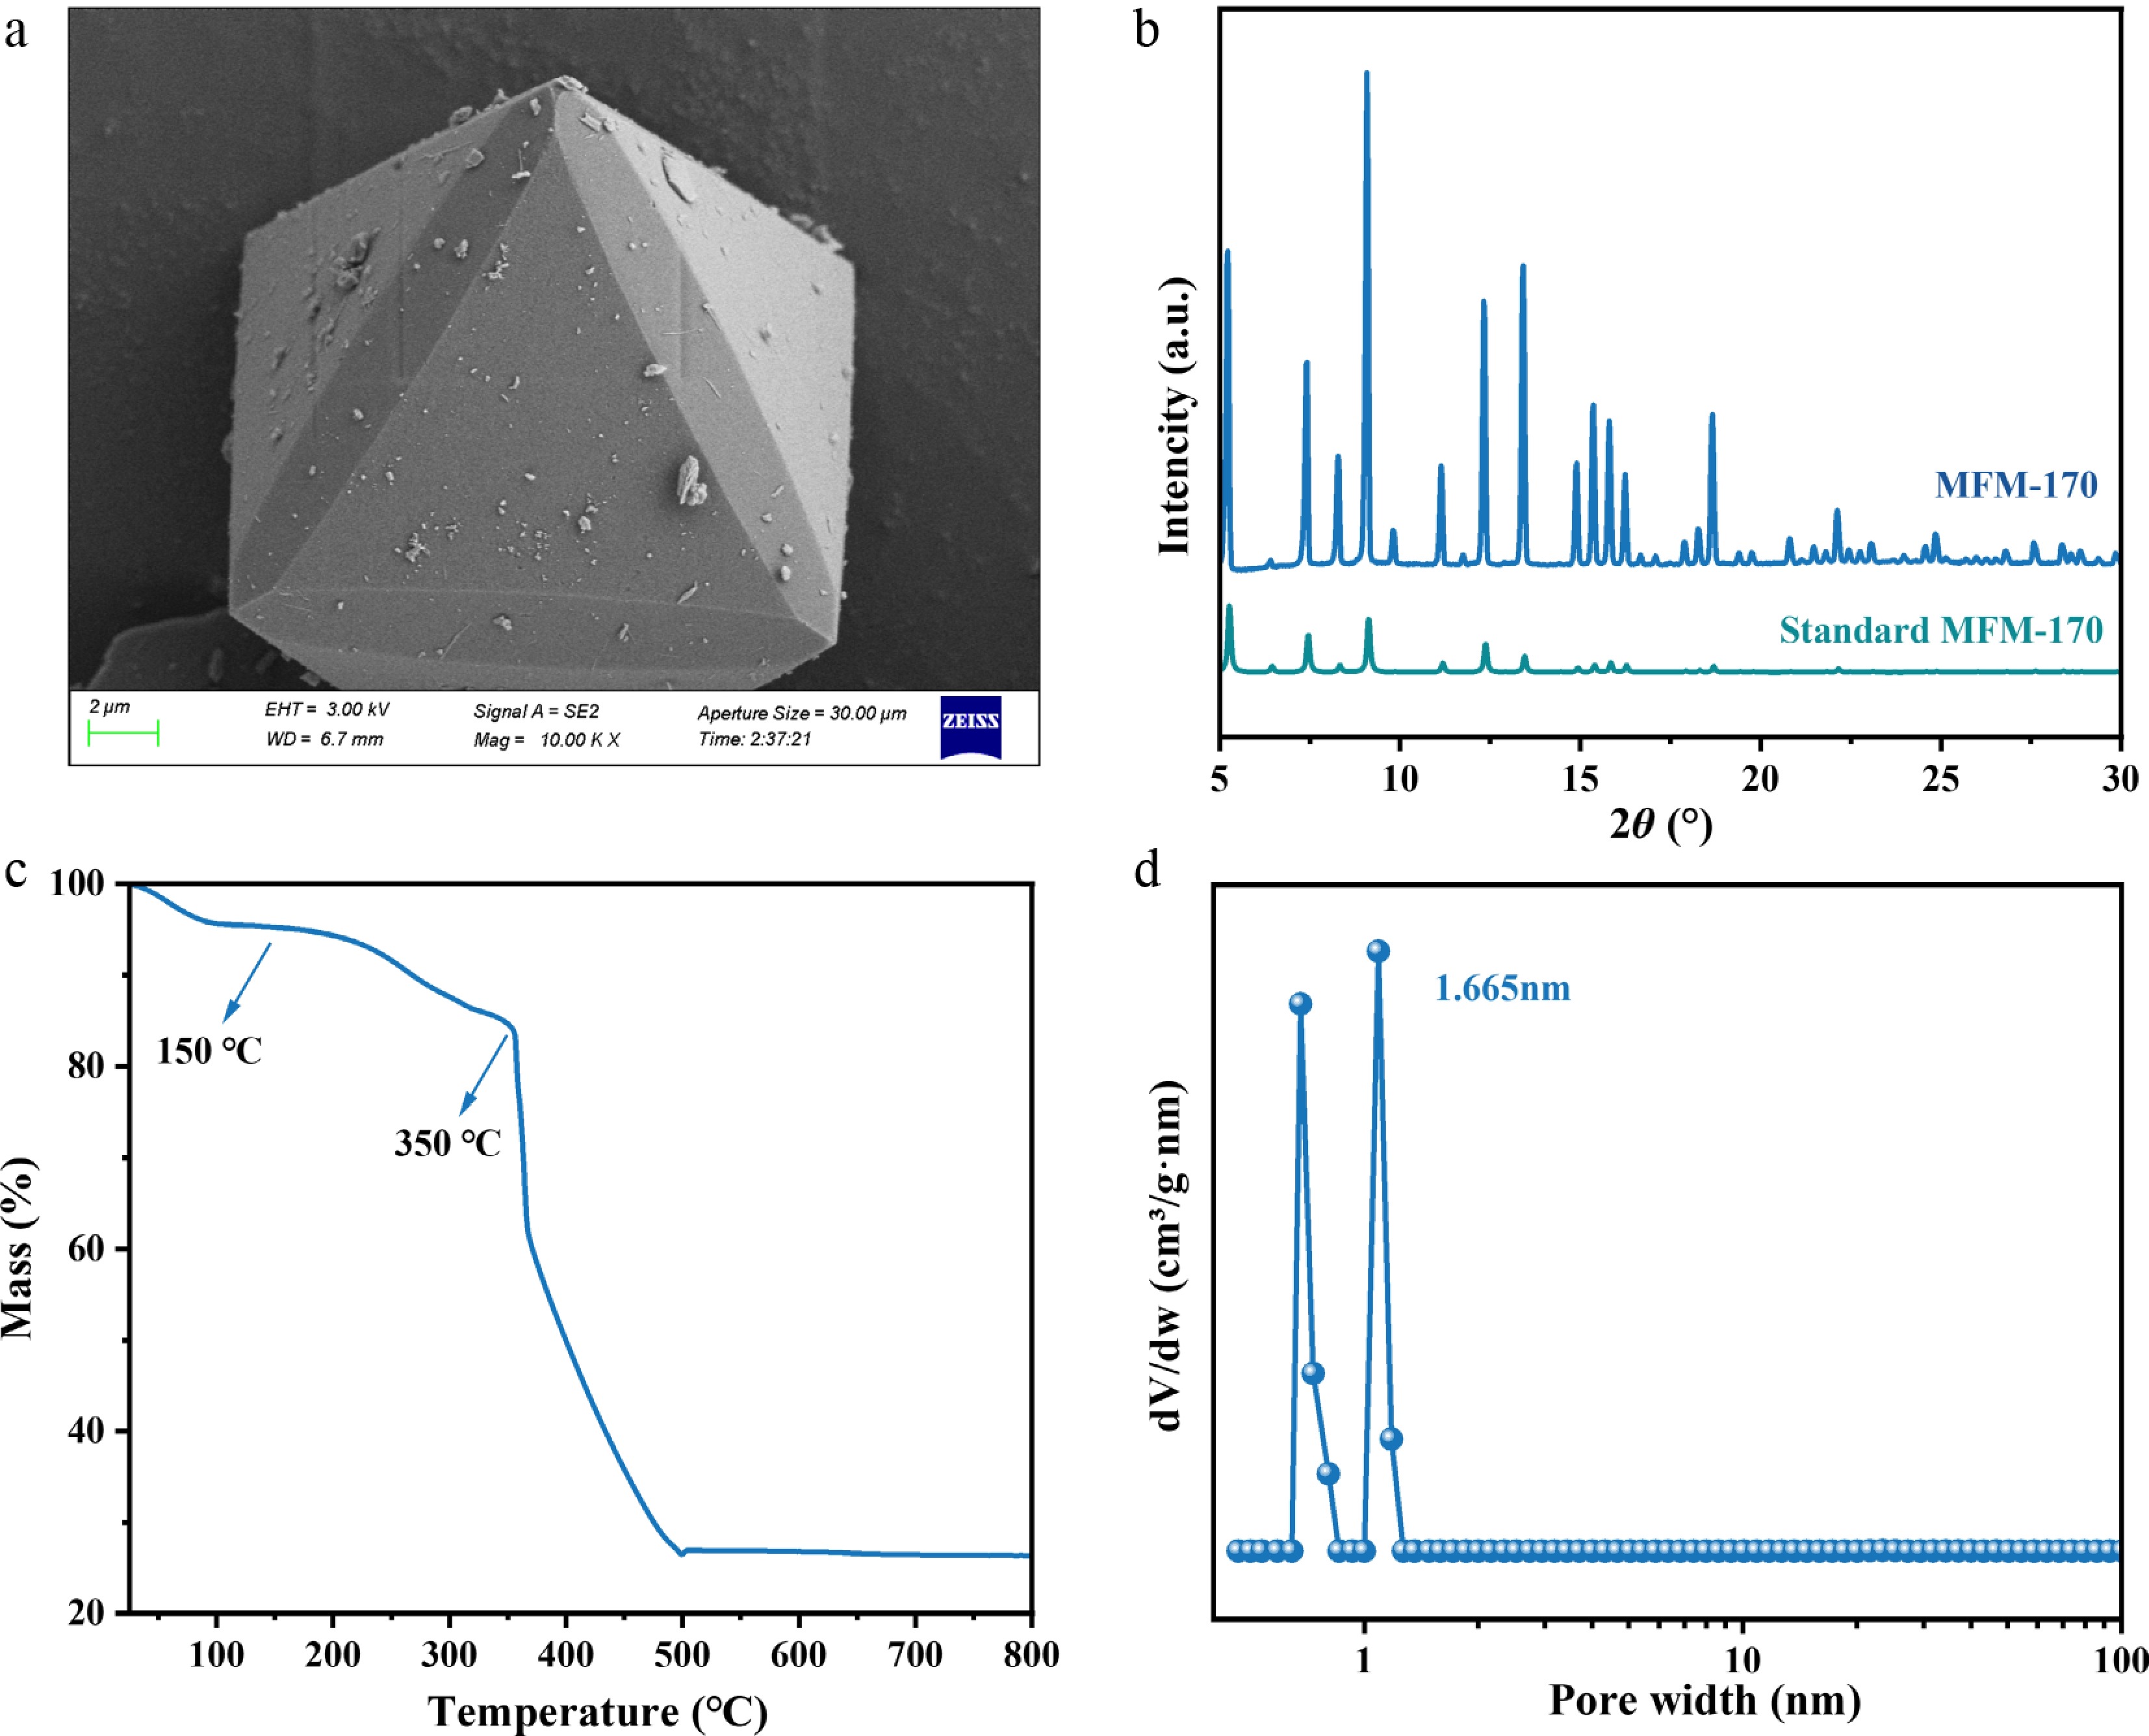
Figure 1.
Characterization results obtained for MFM-170, including (a) SEM images, (b) XRD profile, (c) TGA curve, and (d) pore size distribution diagram.
-
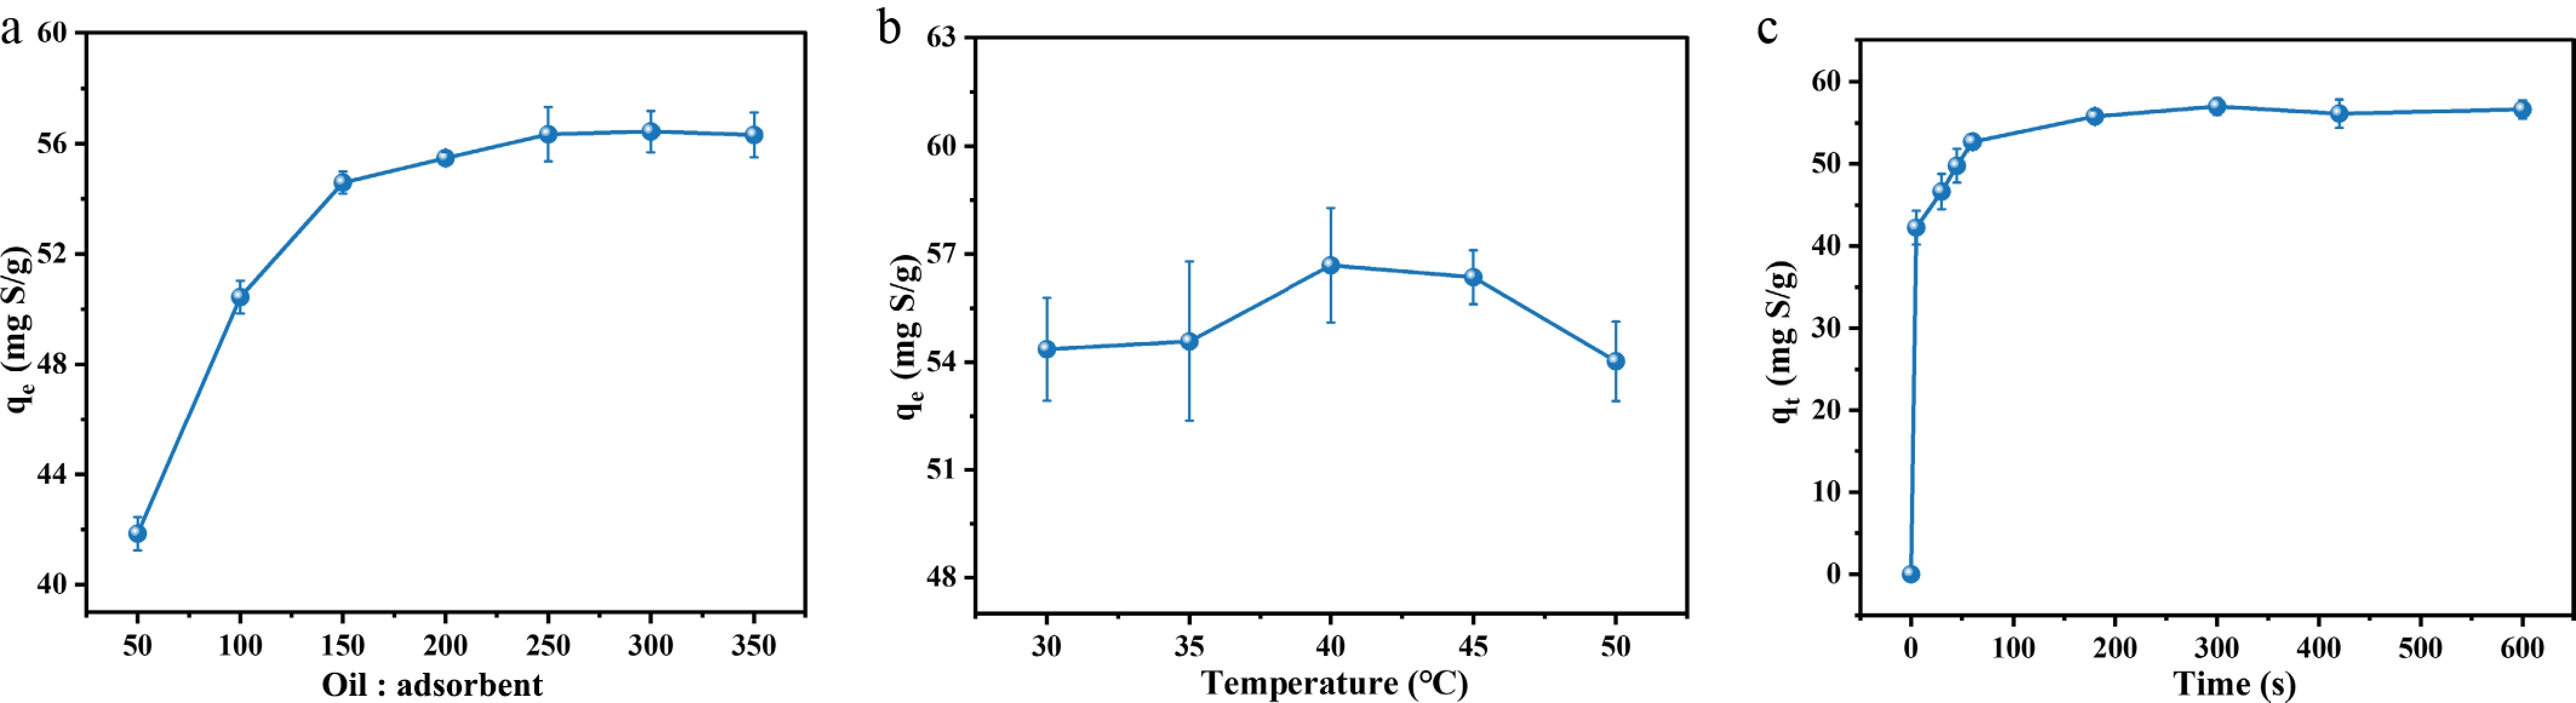
Figure 2.
(a) Adsorption capacity of MFM-170 for DBT vs. oil-to-adsorbent ratio; (b) adsorption capacity of MFM-170 for DBT vs. temperature; (c) adsorption capacity of MFM-170 for DBT vs. time.
-
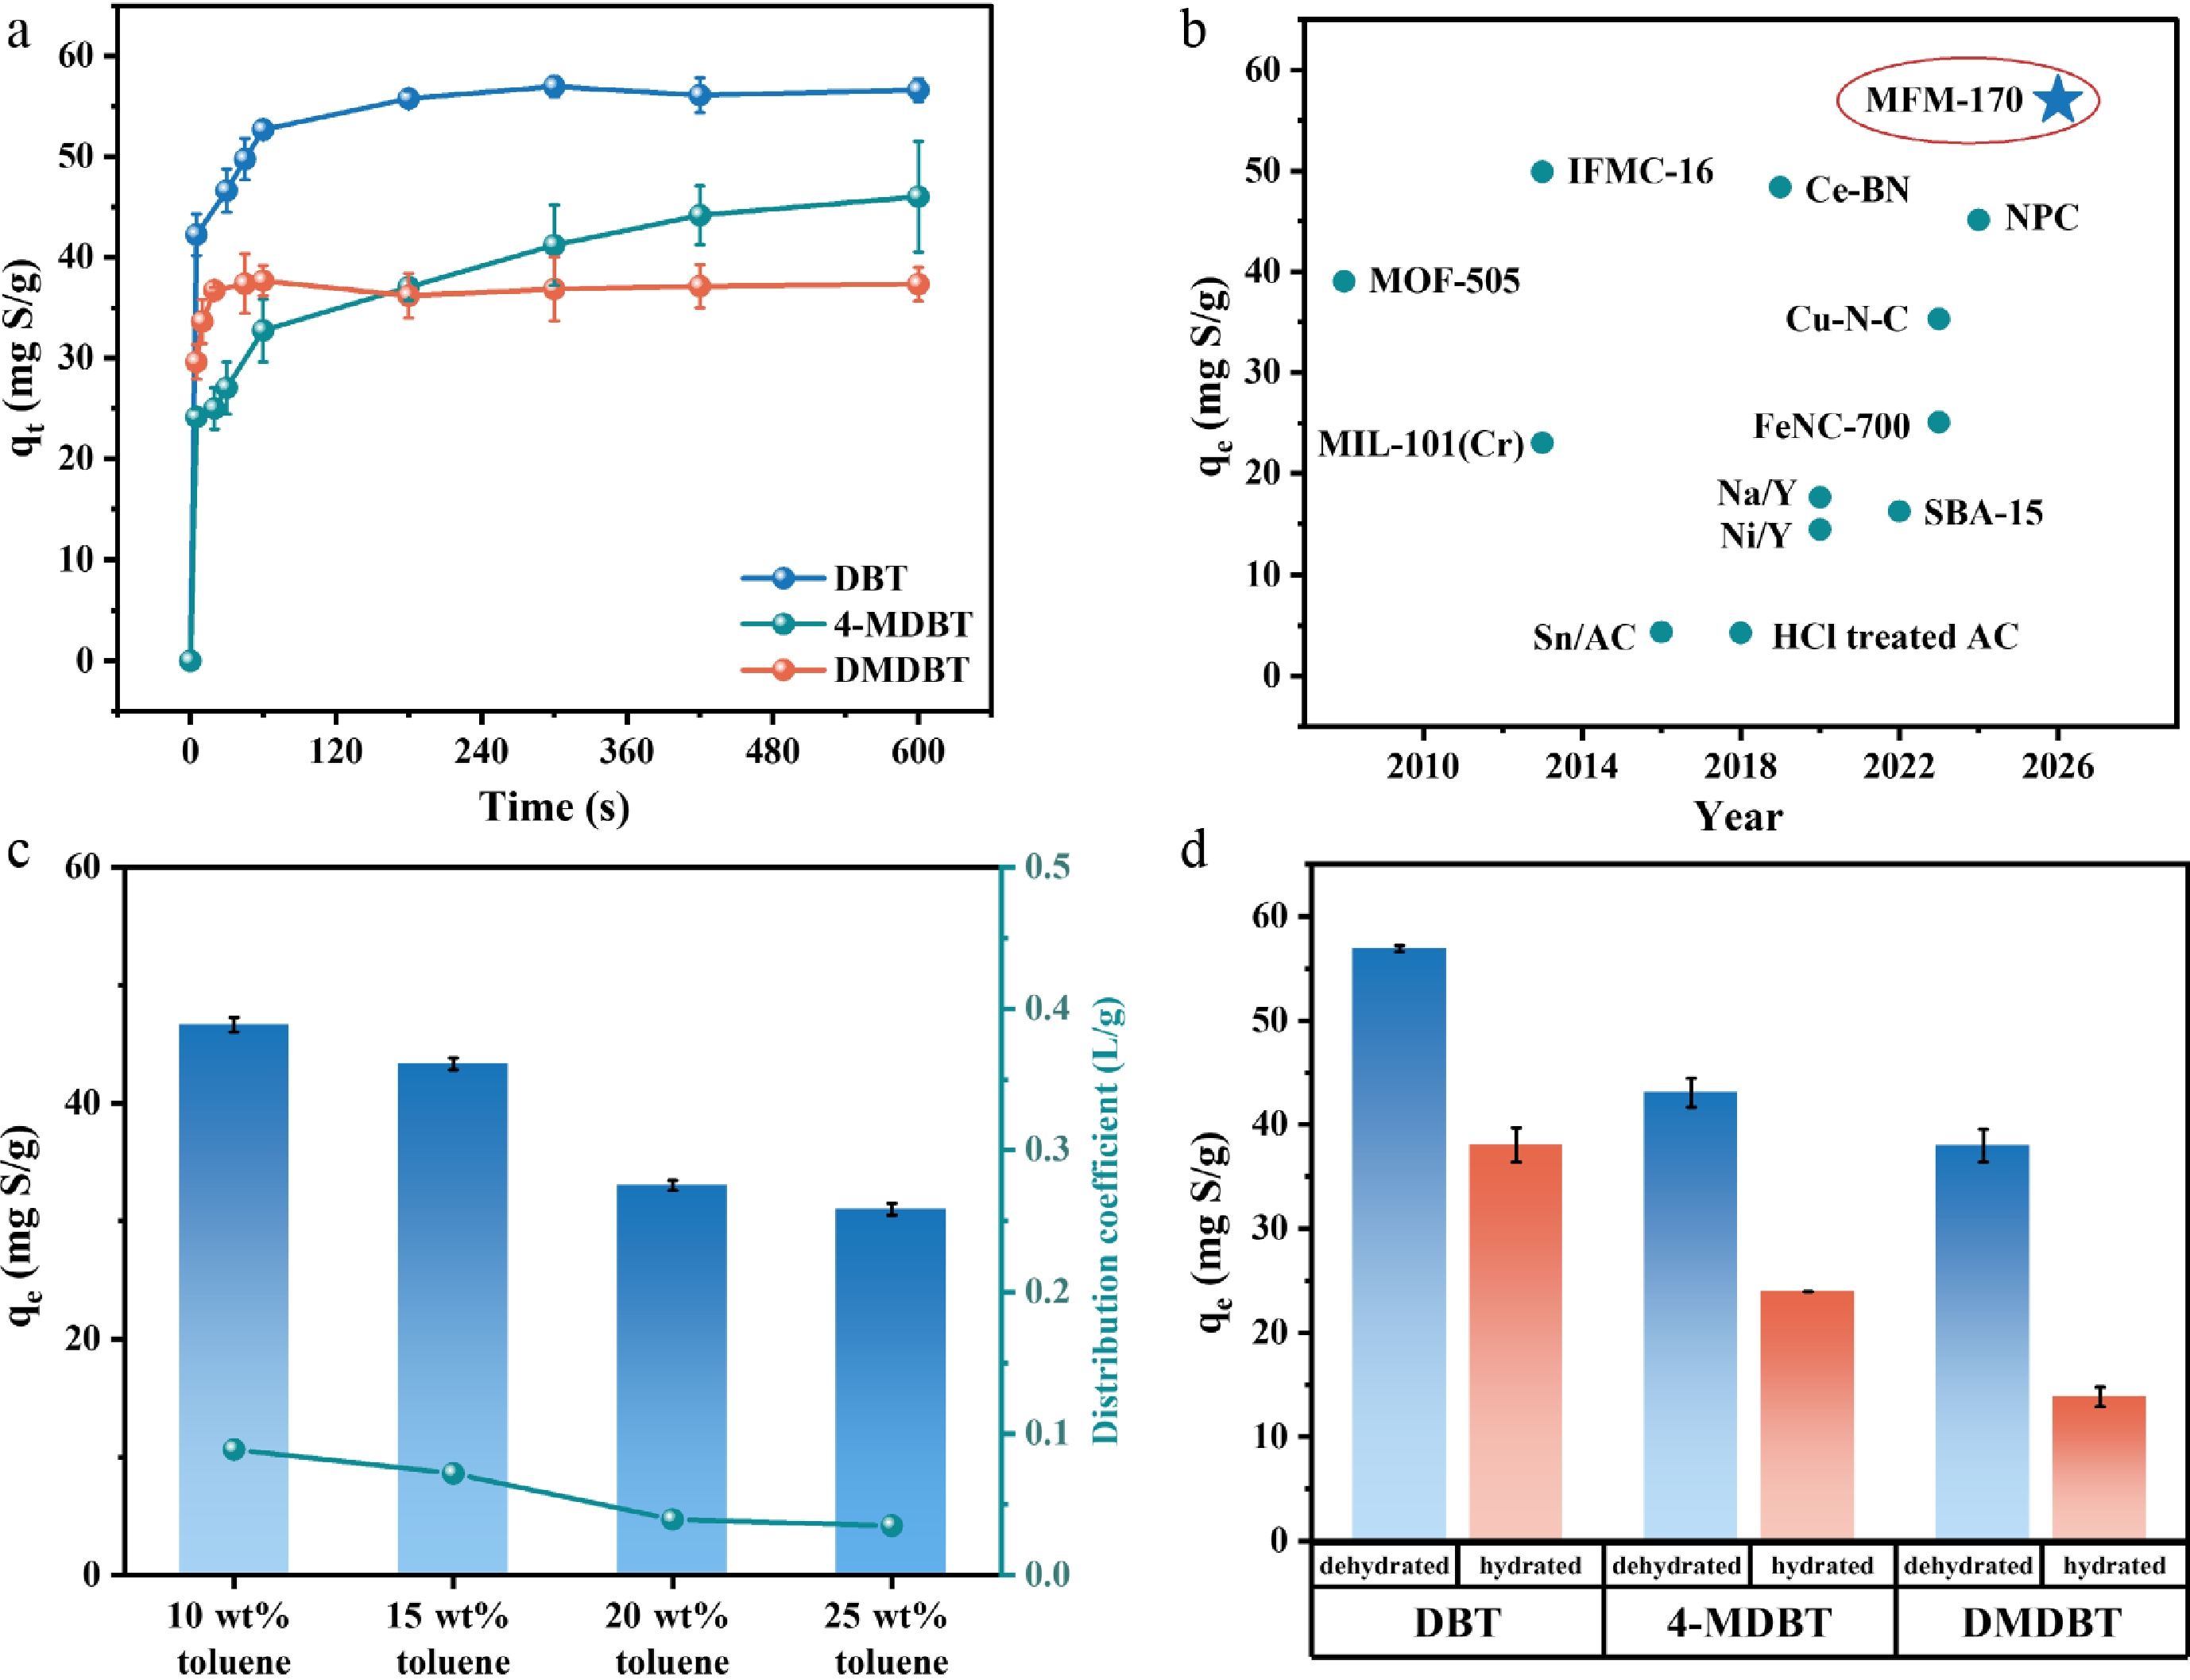
Figure 3.
(a) Adsorption capacity of MFM-170 for DBT, 4-MDBT, and DMDBT vs. time; (b) DBT adsorption capacity comparison of MFM-170 and reported adsorbents (detailed comparisons are presented in Table 1); (c) effect of toluene competitive adsorption on the adsorption capacity and distribution coefficient of DBT; (d) effect of adsorbed water on adsorption performance.
-
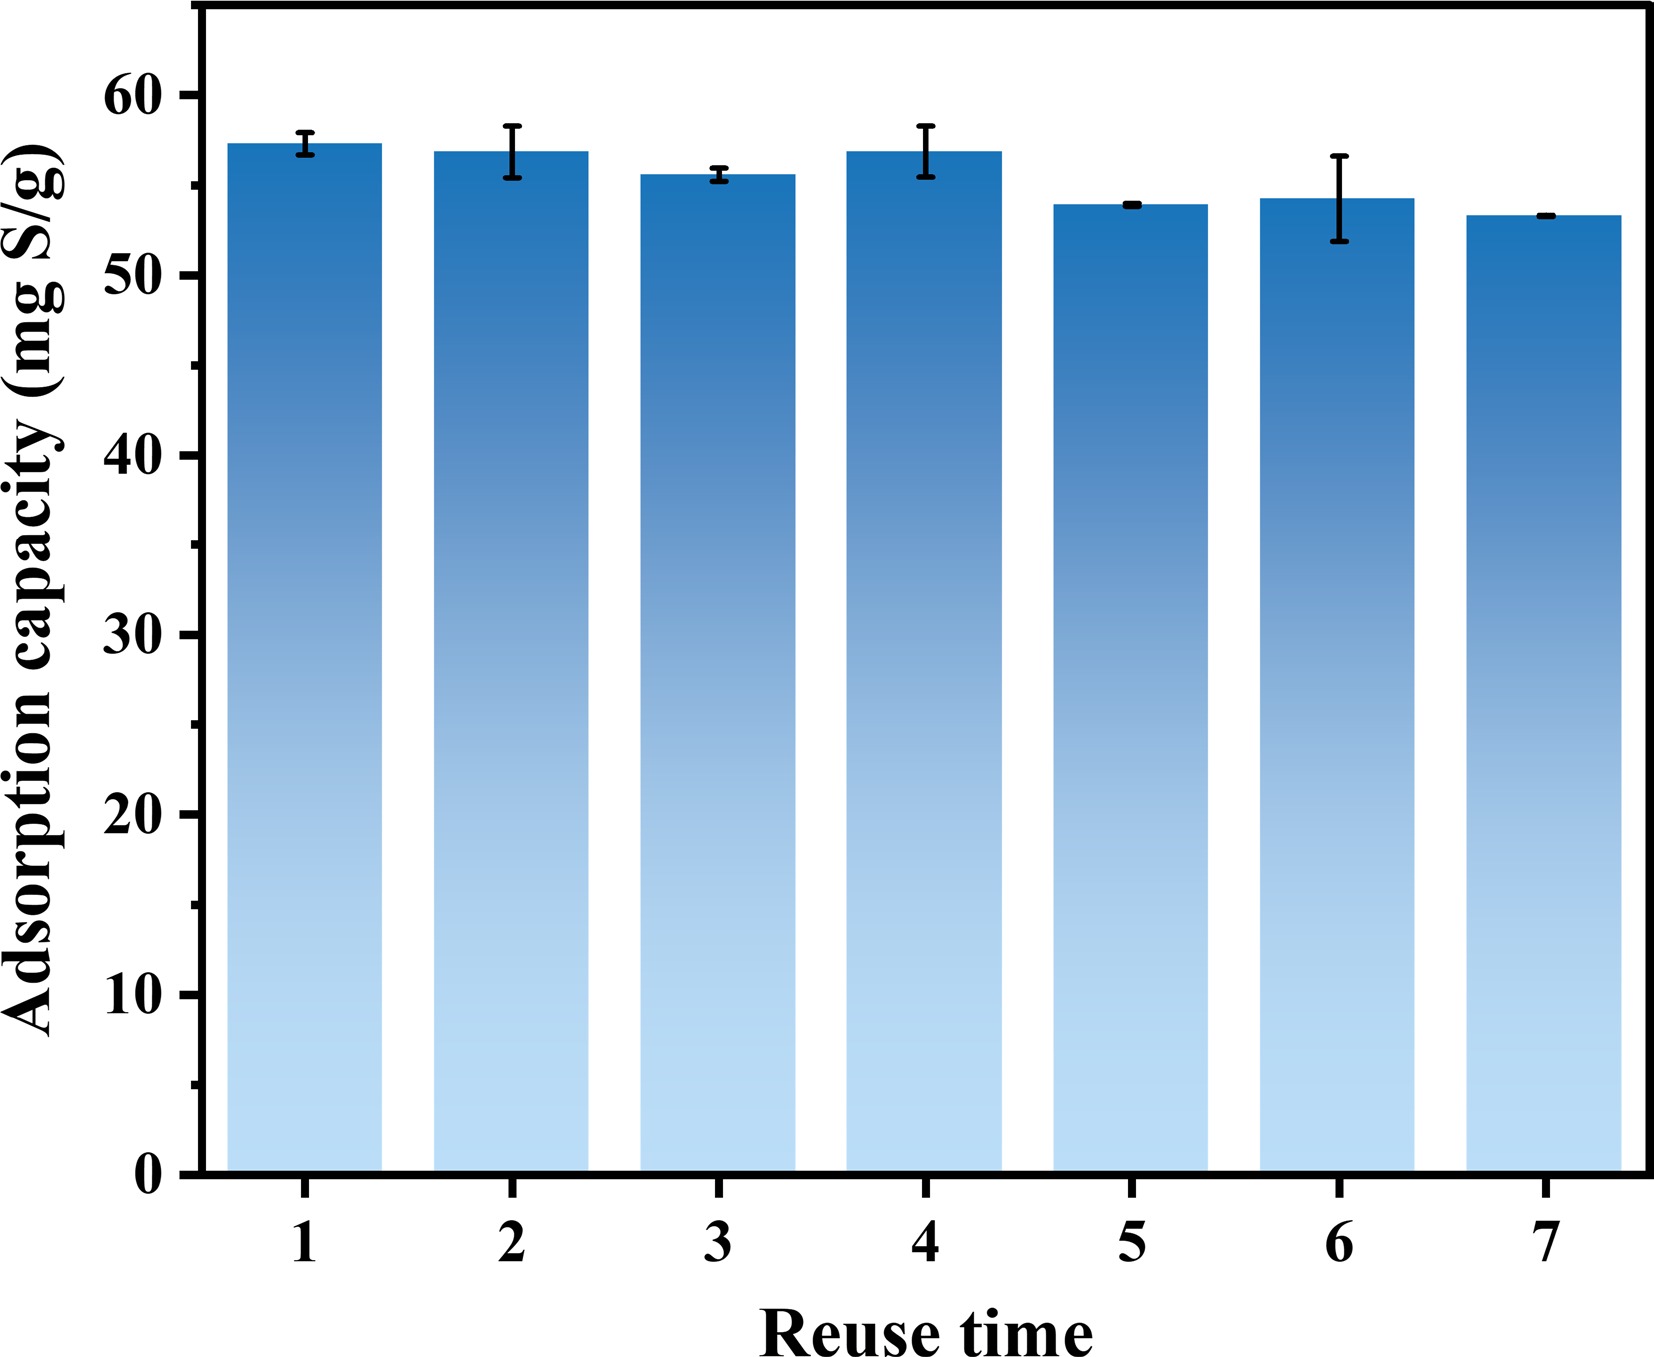
Figure 4.
Recycling performance of MFM-170.
-
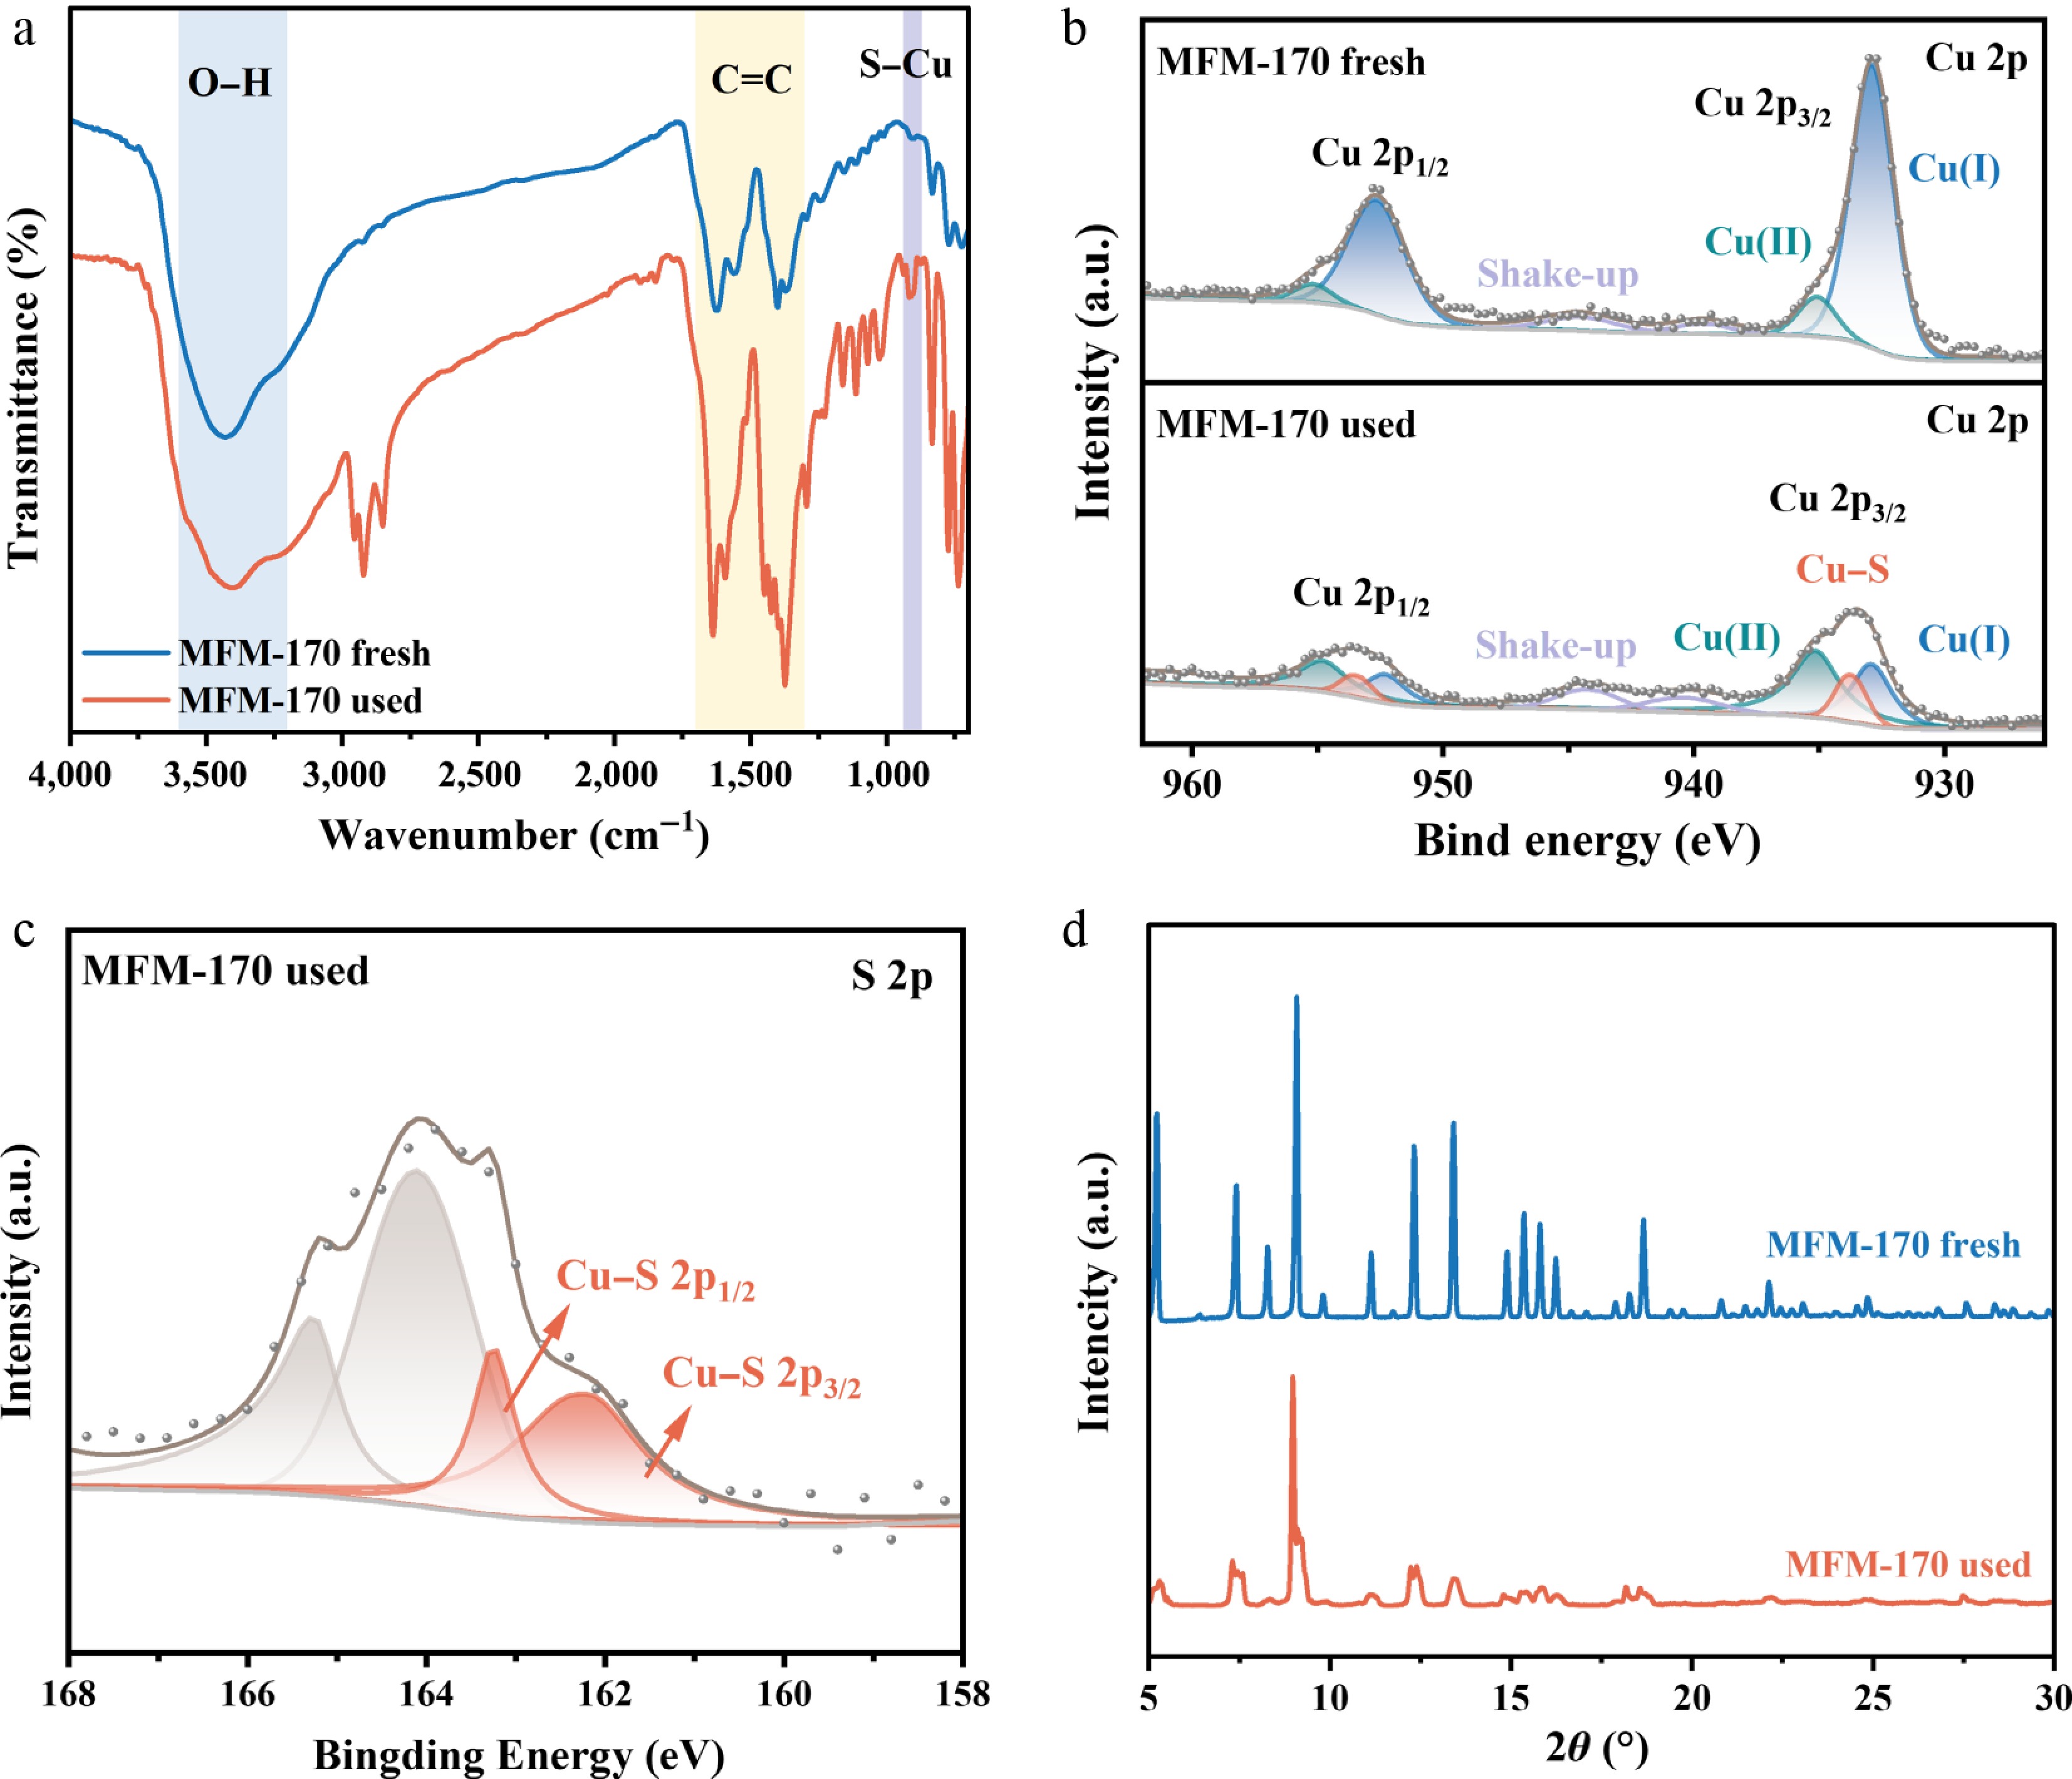
Figure 5.
(a) FT-IR profiles of fresh and used MFM-170; (b) Cu 2p XPS spectra of fresh and used MFM-170; (c) S 2p XPS spectrum of used MFM-170; (d) XRD profiles of fresh and used MFM-170.
-
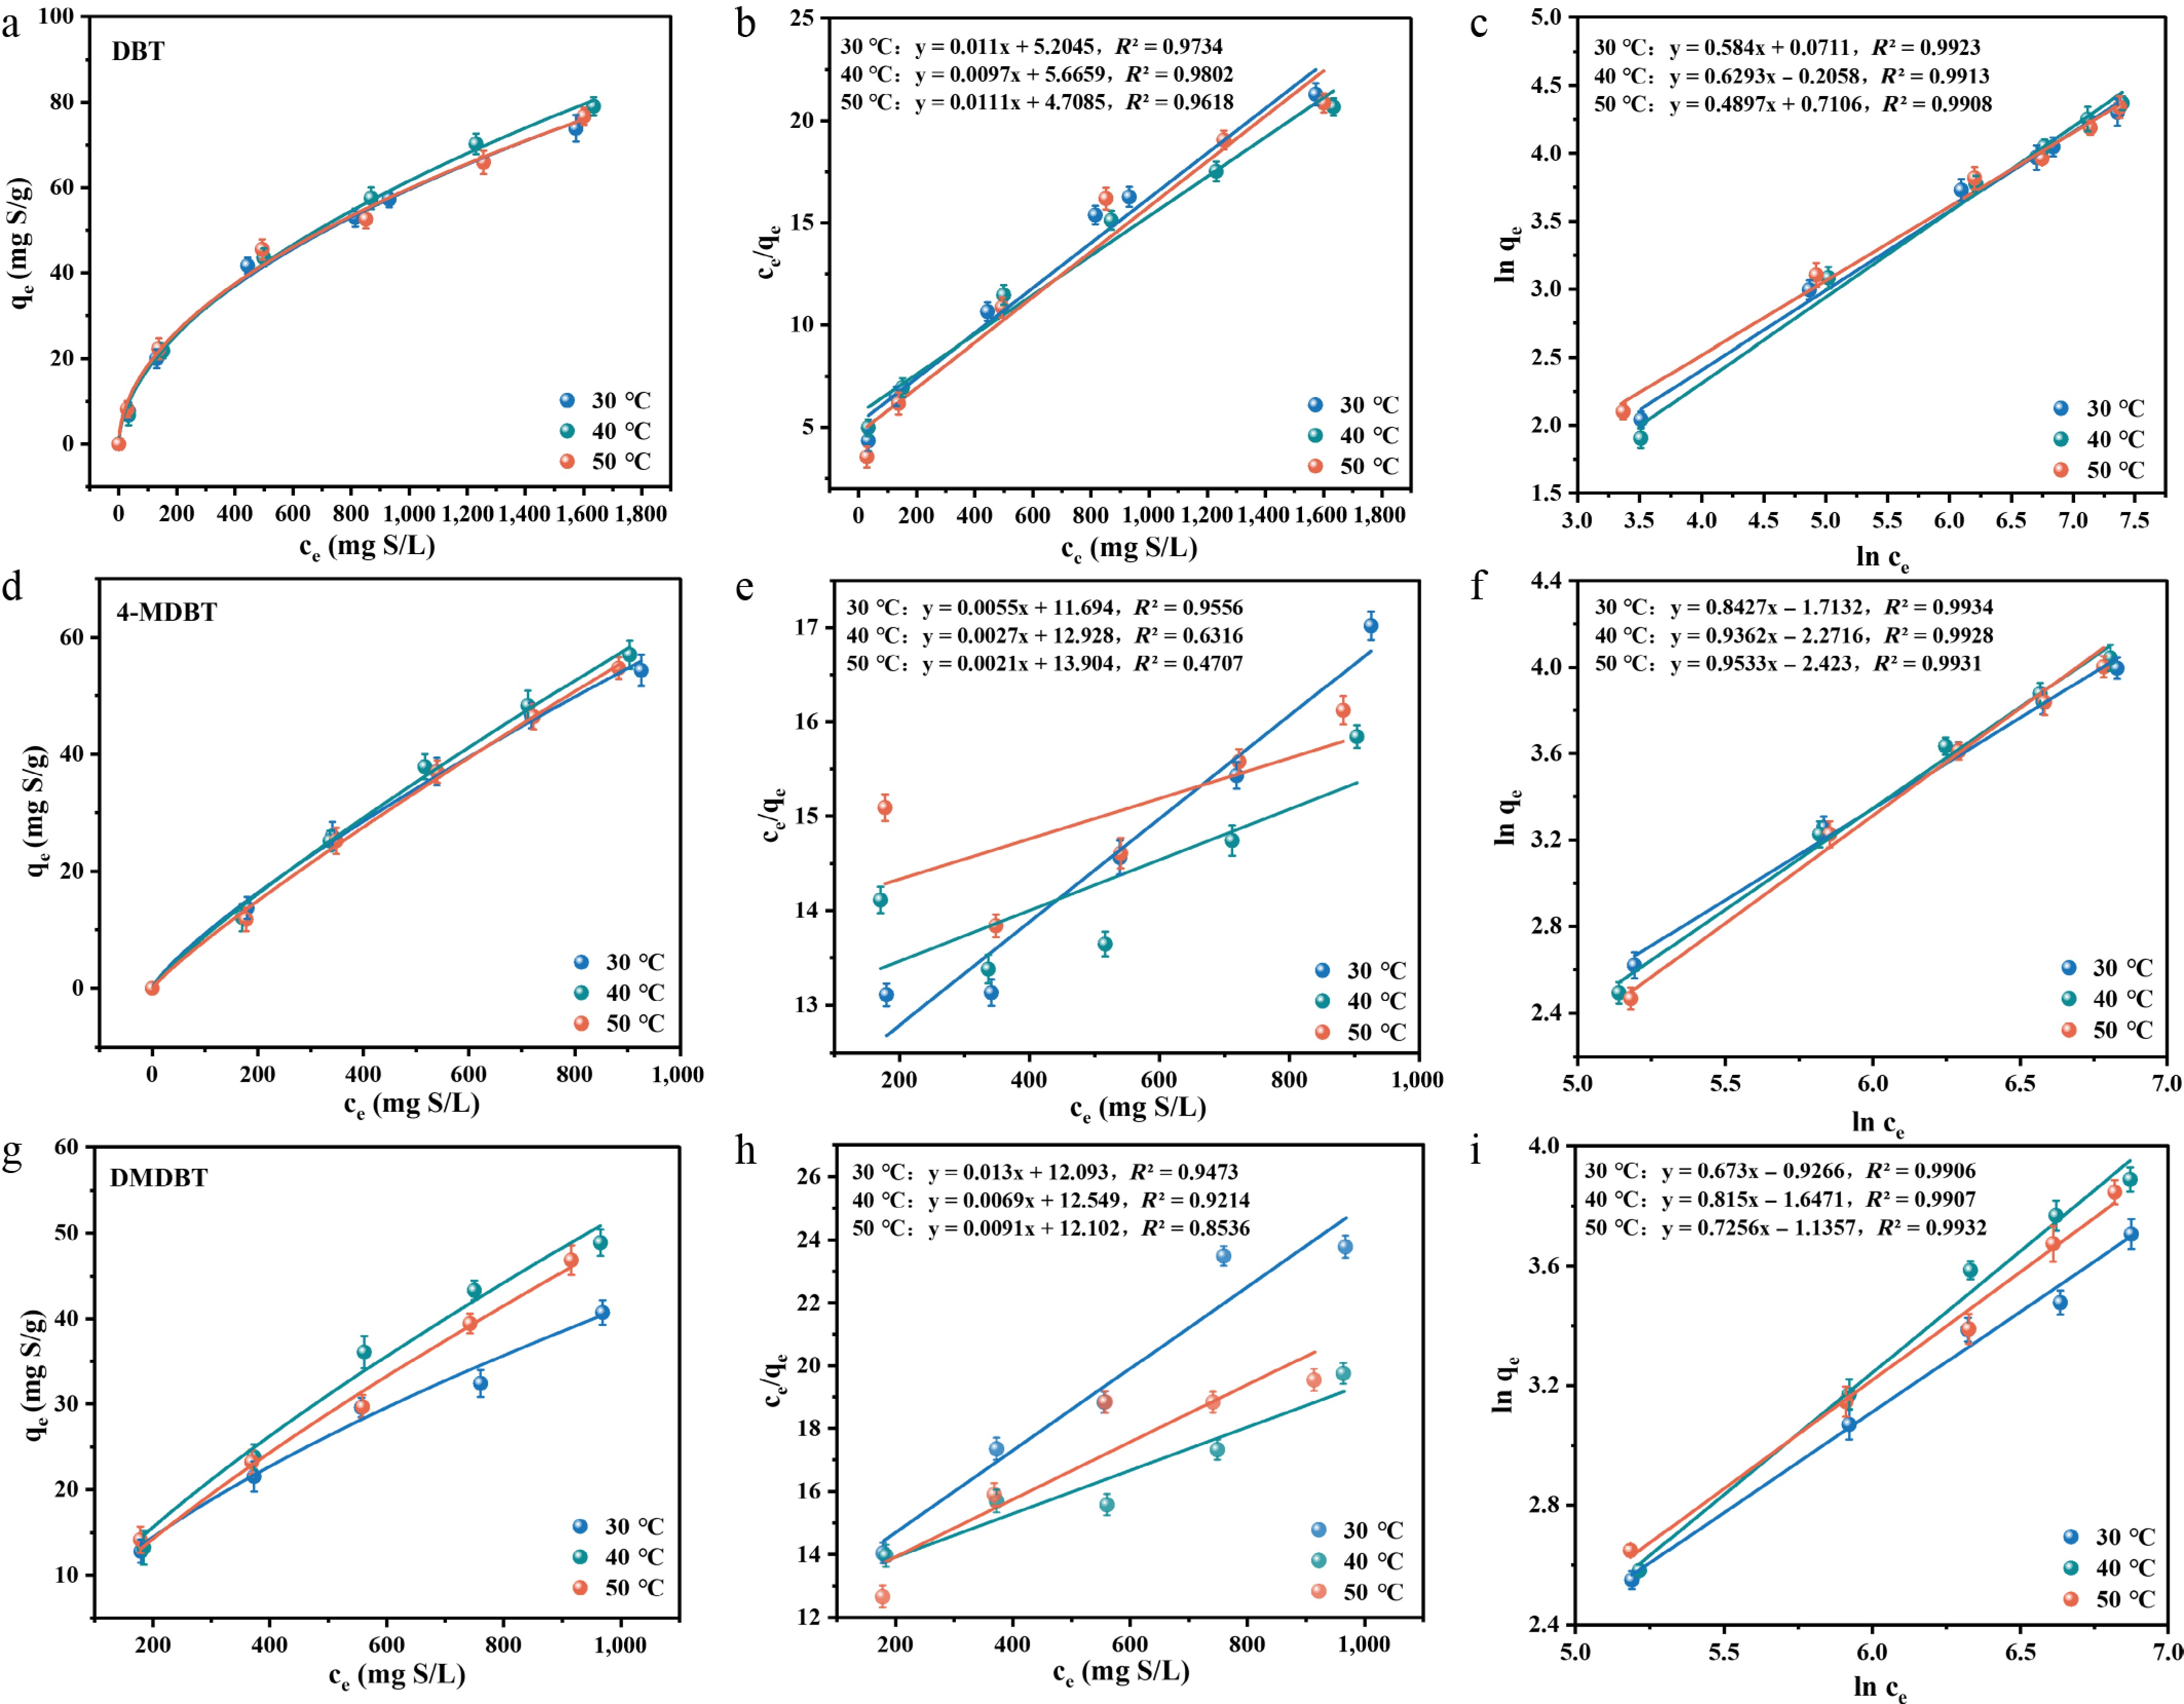
Figure 6.
Adsorption isotherms of (a) DBT, (d) 4-MDBT, and (g) DMDBT on MFM-170; Langmuir model fitting plots for (b) DBT, (e) 4-MDBT, and (h) DMDBT on MFM-170; Freundlich model fitting plots for (c) DBT, (f) 4-MDBT, and (i) DMDBT on MFM-170.
-
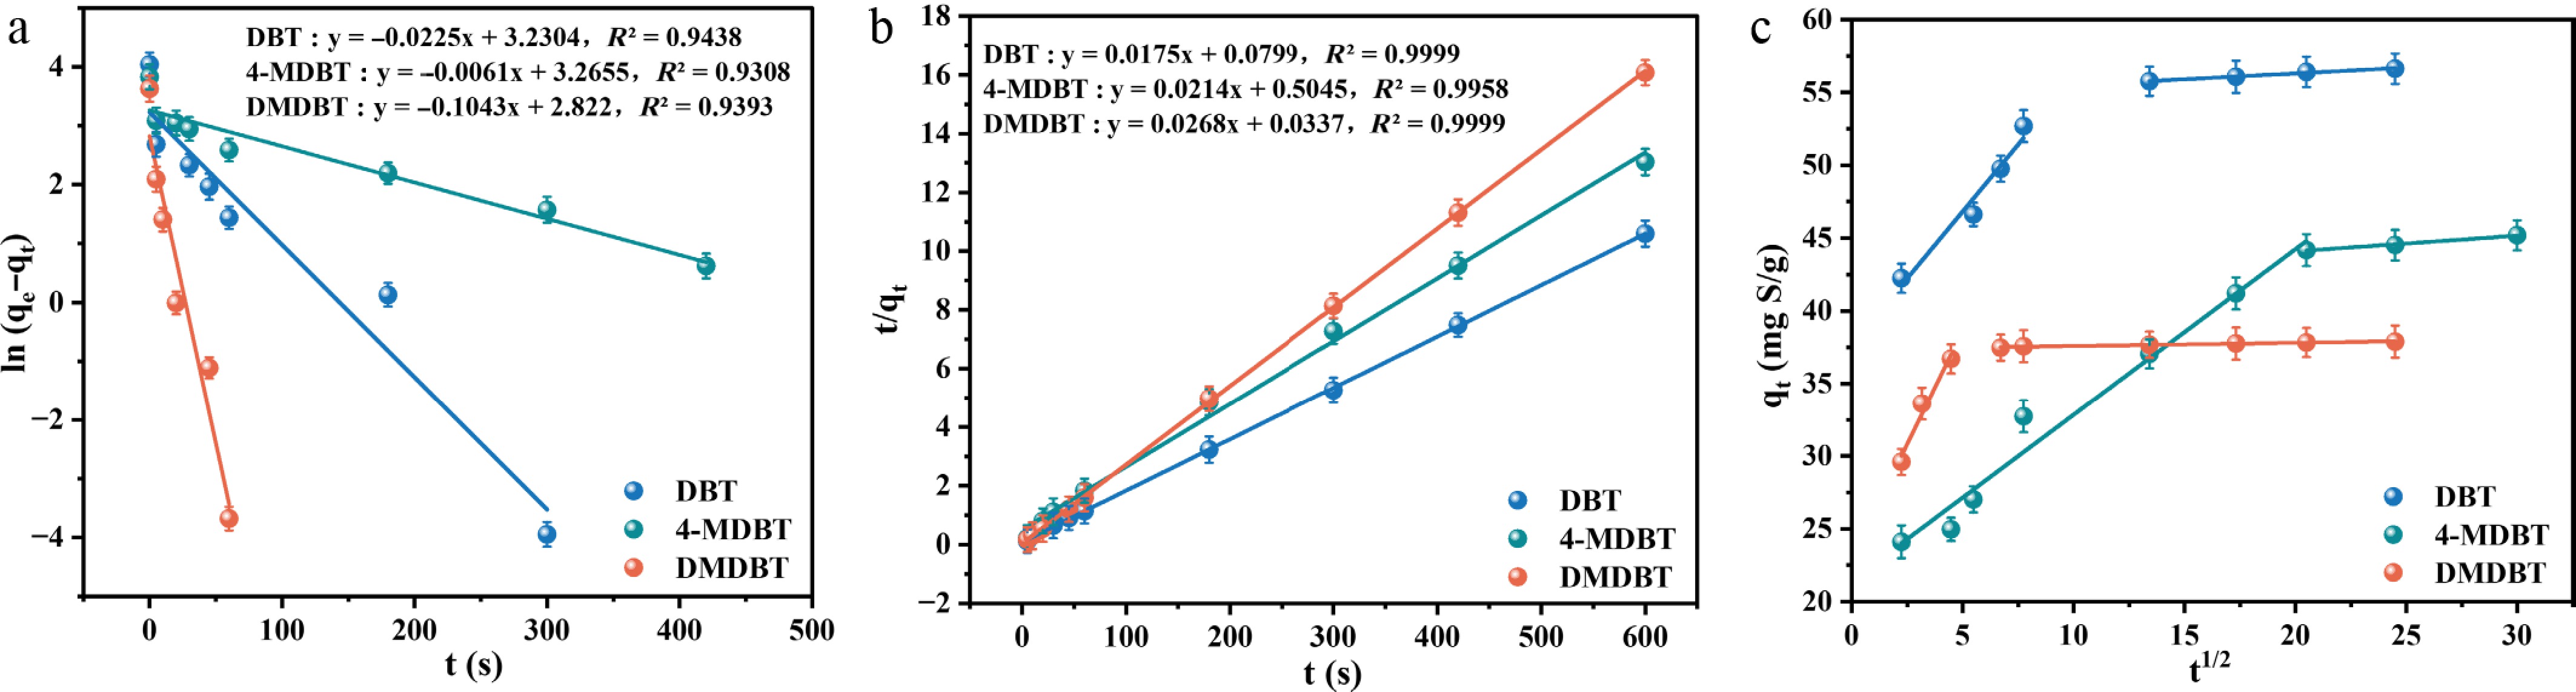
Figure 7.
Kinetic models for the adsorption of DBT, 4-MDBT, and DMDBT on MFM-170: (a) pseudo-first-order model, (b) pseudo-second-order model, and (c) Weber–Morris intraparticle diffusion model.
-
Sample Adsorbate Adsorption capacity (mg S/g) Ref. MOF-505 DBT 39.04 [14] MIL-101(Cr) DBT 23.04 [20] SBA-15 DBT 16.23 [21] Ce-BN DBT 48.40 [22] NPC DBT 45.14 [23] FeNC-700 DBT 25.08 [24] IFMC-16 DBT 49.92 [25] Cu-N-C DBT 35.32 [26] HCl treated AC DBT 4.28 [27] Sn/AC DBT 4.35 [28] Na/Y DBT 17.63 [11] Ni/Y DBT 14.43 [11] MFM-170 DBT 57.00 This work Table 1.
Comparison of the DBT adsorption capacity on various materials.
-
Temperature (°C) Adsorbates Langmuir Freundlich qmax (mg S/g) KL R2 KF n R2 30 DBT 90.91 0.0021 0.9734 1.0737 1.7123 0.9923 4-MDBT 181.82 0.0005 0.9556 0.1803 1.1867 0.9934 DMDBT 76.92 0.0011 0.9473 0.3960 1.4859 0.9906 40 DBT 103.09 0.0017 0.9802 0.8140 1.5891 0.9913 4-MDBT 370.37 0.0002 0.6316 0.1031 1.0681 0.9928 DMDBT 144.93 0.0005 0.9214 0.1926 1.2270 0.9907 50 DBT 90.09 0.0023 0.9618 2.0352 2.0421 0.9908 4-MDBT 476.19 0.0002 0.4707 0.0887 1.0490 0.9931 DMDBT 109.89 0.0007 0.8536 0.3212 1.3782 0.9932 Table 2.
Fitted parameters of Langmuir and Freundlich models.
-
Adsorbates Adsorption stage Fitting equation Kid (mg S/g/min0.5) C (mg S/g) R2 DBT 1 y = 1.8363x + 37.651 1.8363 37.651 0.9646 2 y = 0.0801x + 54.698 0.0801 54.698 0.9868 4-MDBT 1 y = 1.1392x + 21.457 1.1392 21.457 0.9755 2 y = 0.1075x + 41.939 0.1075 41.939 0.9920 DMDBT 1 y = 3.1243x + 23.029 3.1243 23.029 0.9701 2 y = 0.0222x + 37.367 0.0222 37.367 0.9691 Table 3.
Kinetic parameters of the Weber–Morris intraparticle diffusion model for the adsorption of DBT, 4-MDBT, and DMDBT on MFM-170.
Figures
(7)
Tables
(3)