-
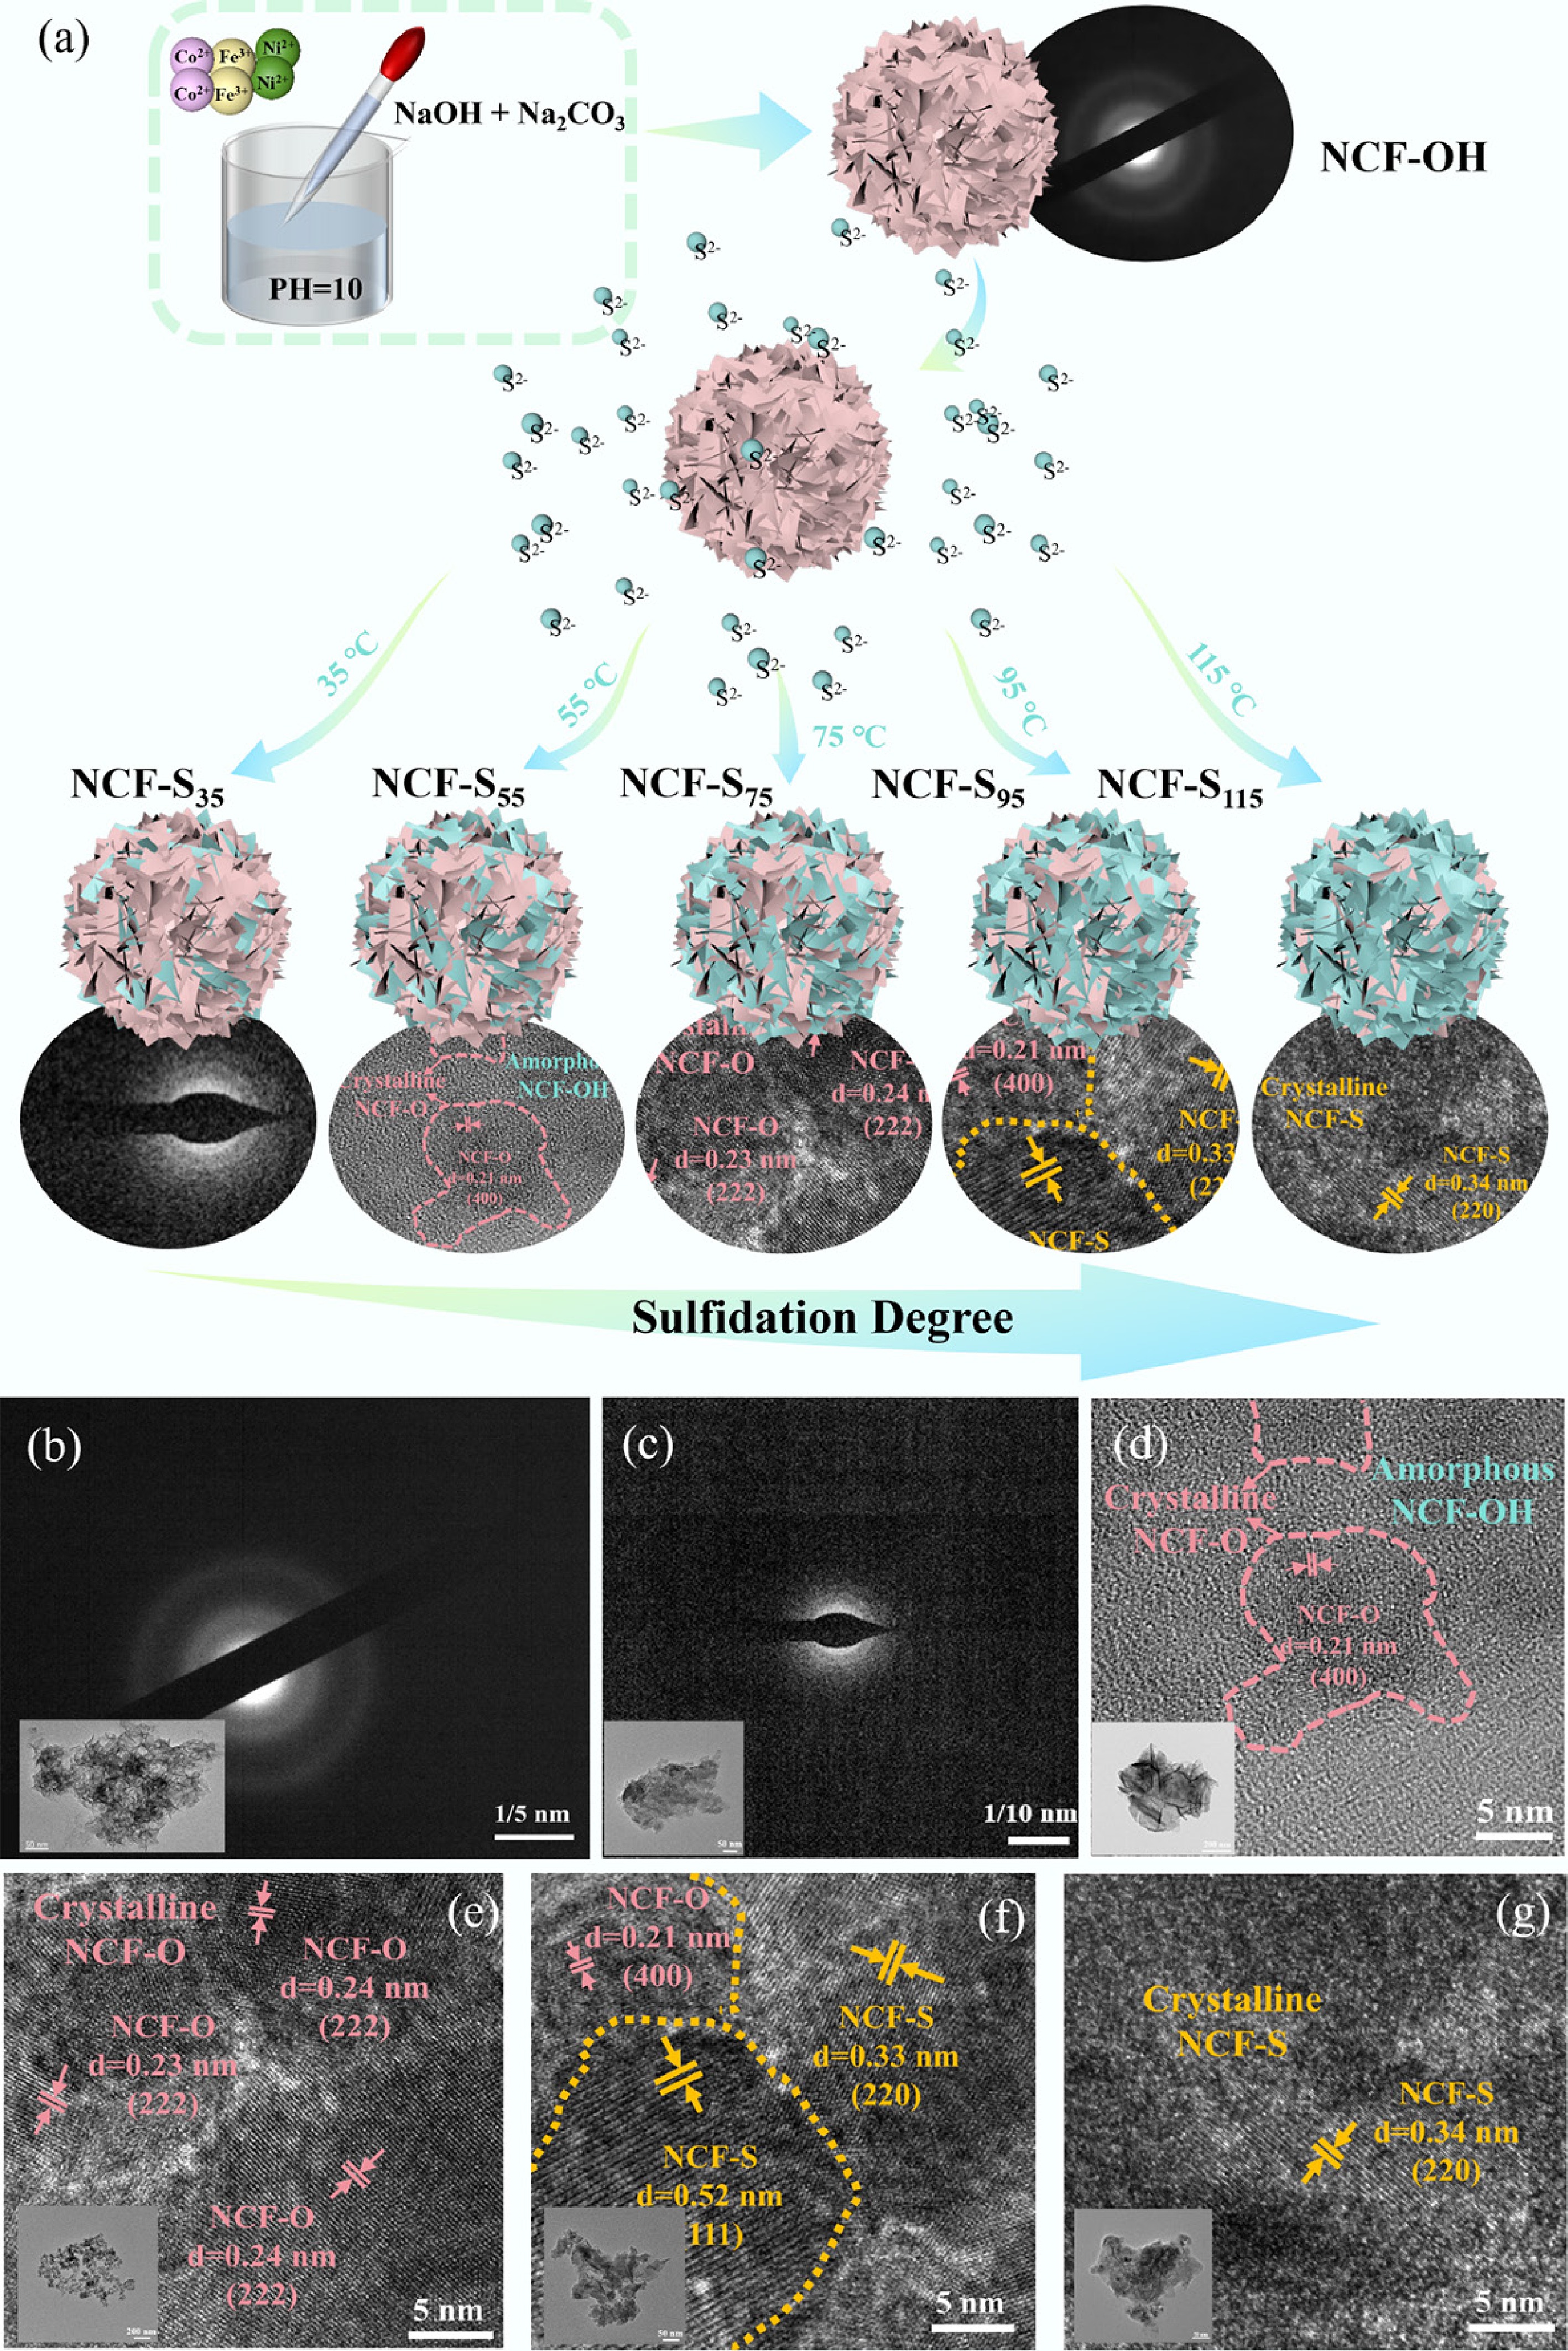
Figure 1.
(a) Preparation process diagram of NCF-S, SAED pattern images of (b) NCF-OH and (c) NCF-S35, and TEM images of (d) NCF-S55, (e) NCF-S75, (f) NCF-S95, and (g) NCF-S115.
-
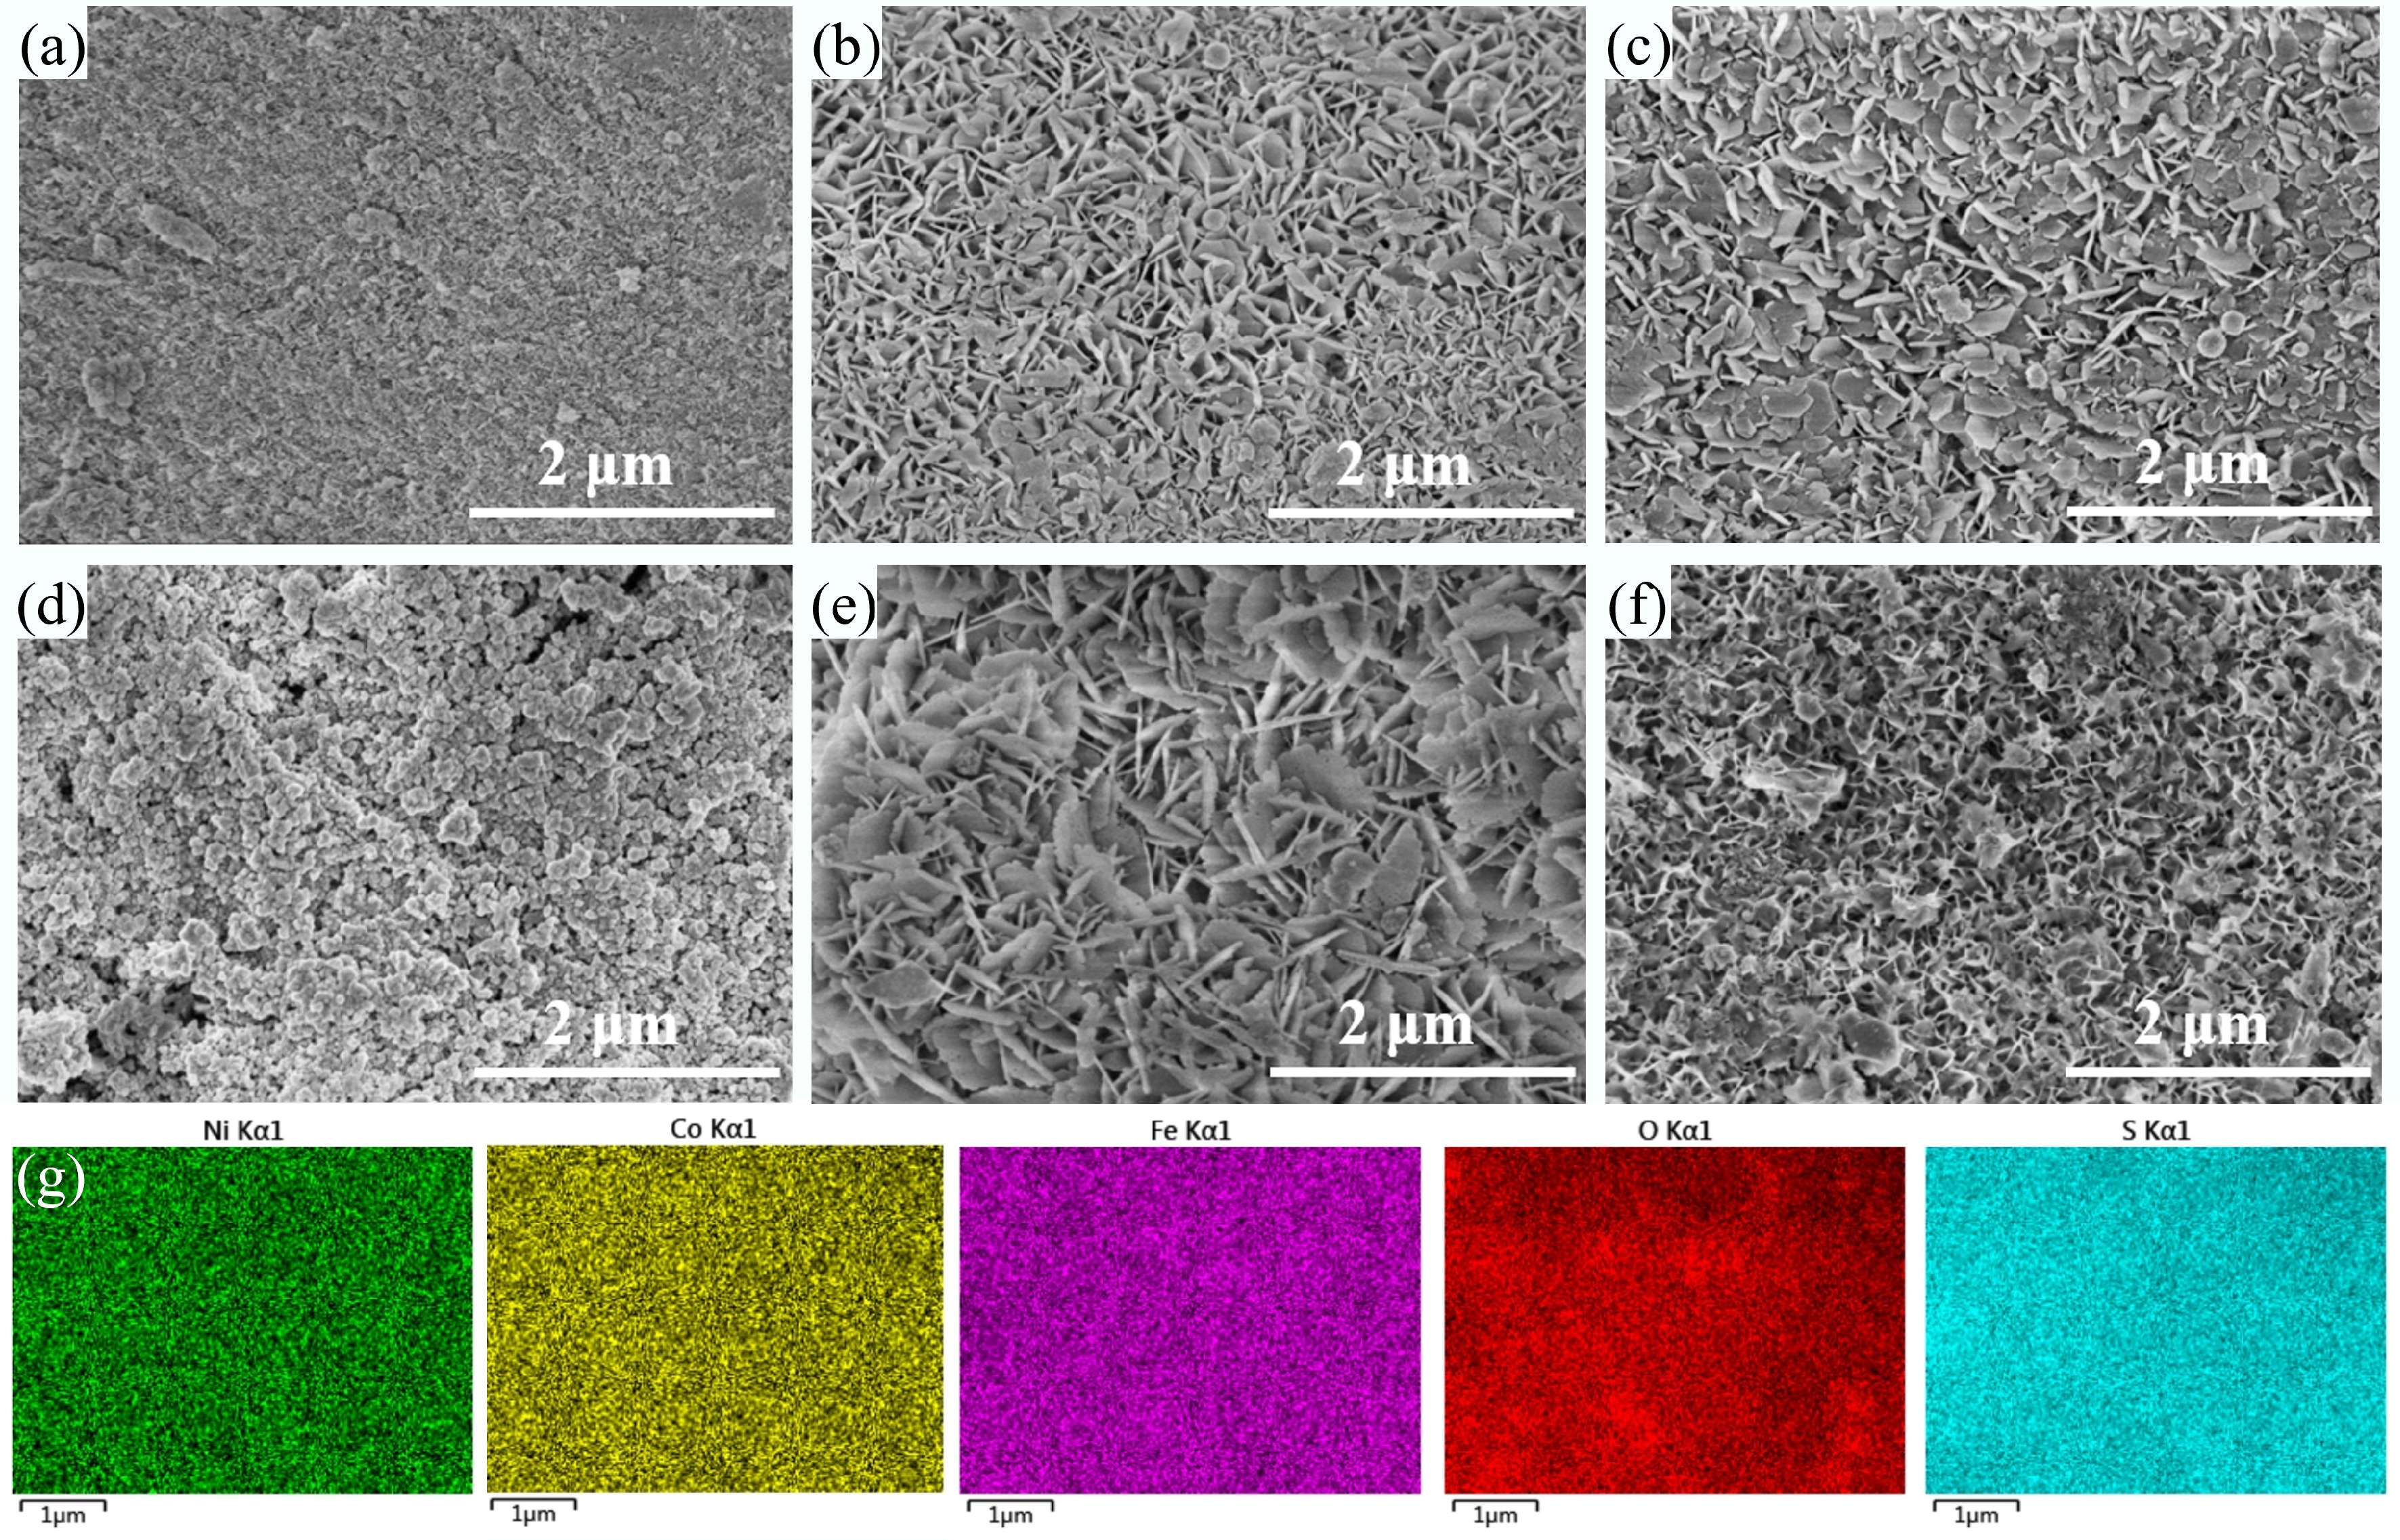
Figure 2.
SEM images of (a) NCF-OH, (b) NCF-S35, (c) NCF-S55, (d) NCF-S75, (e) NCF-S95, (f) NCF-S115, and (g) EDS of NCF-S95.
-
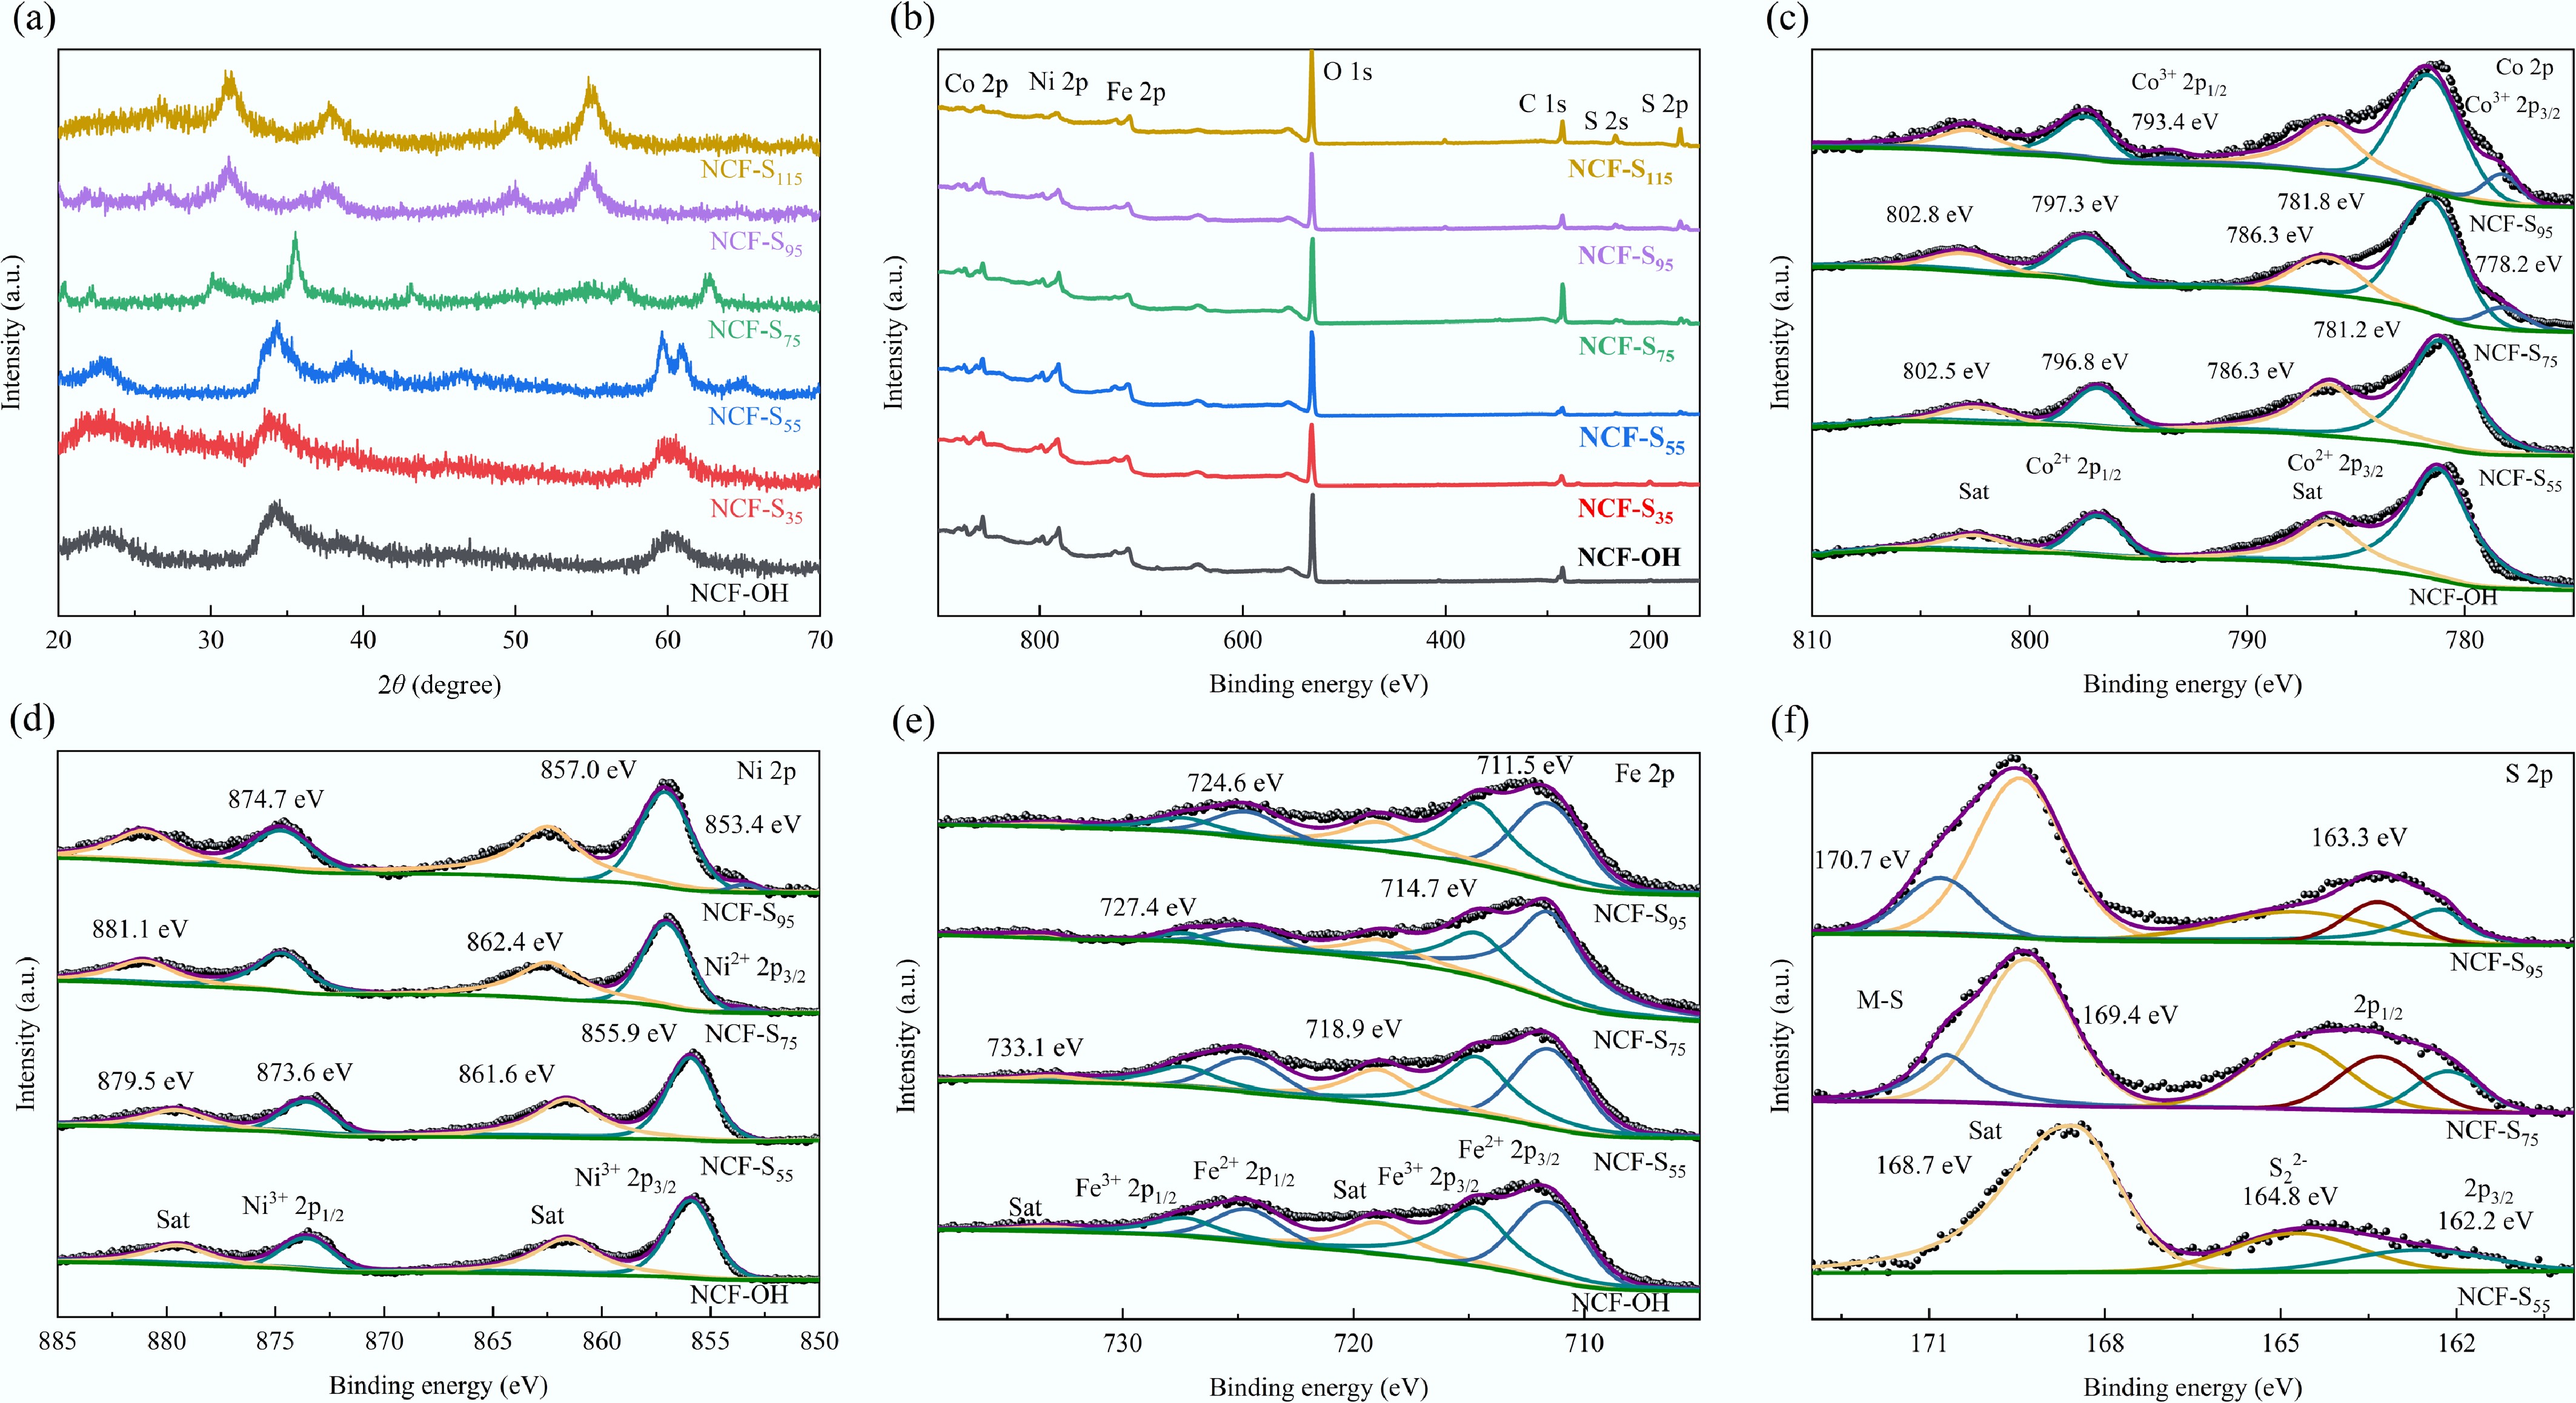
Figure 3.
(a) XRD pattern, (b) full spectrum, high-resolution spectra of (c) Co 2p, (d) Ni 2p, (e) Fe 2p, and (f) S 2p.
-
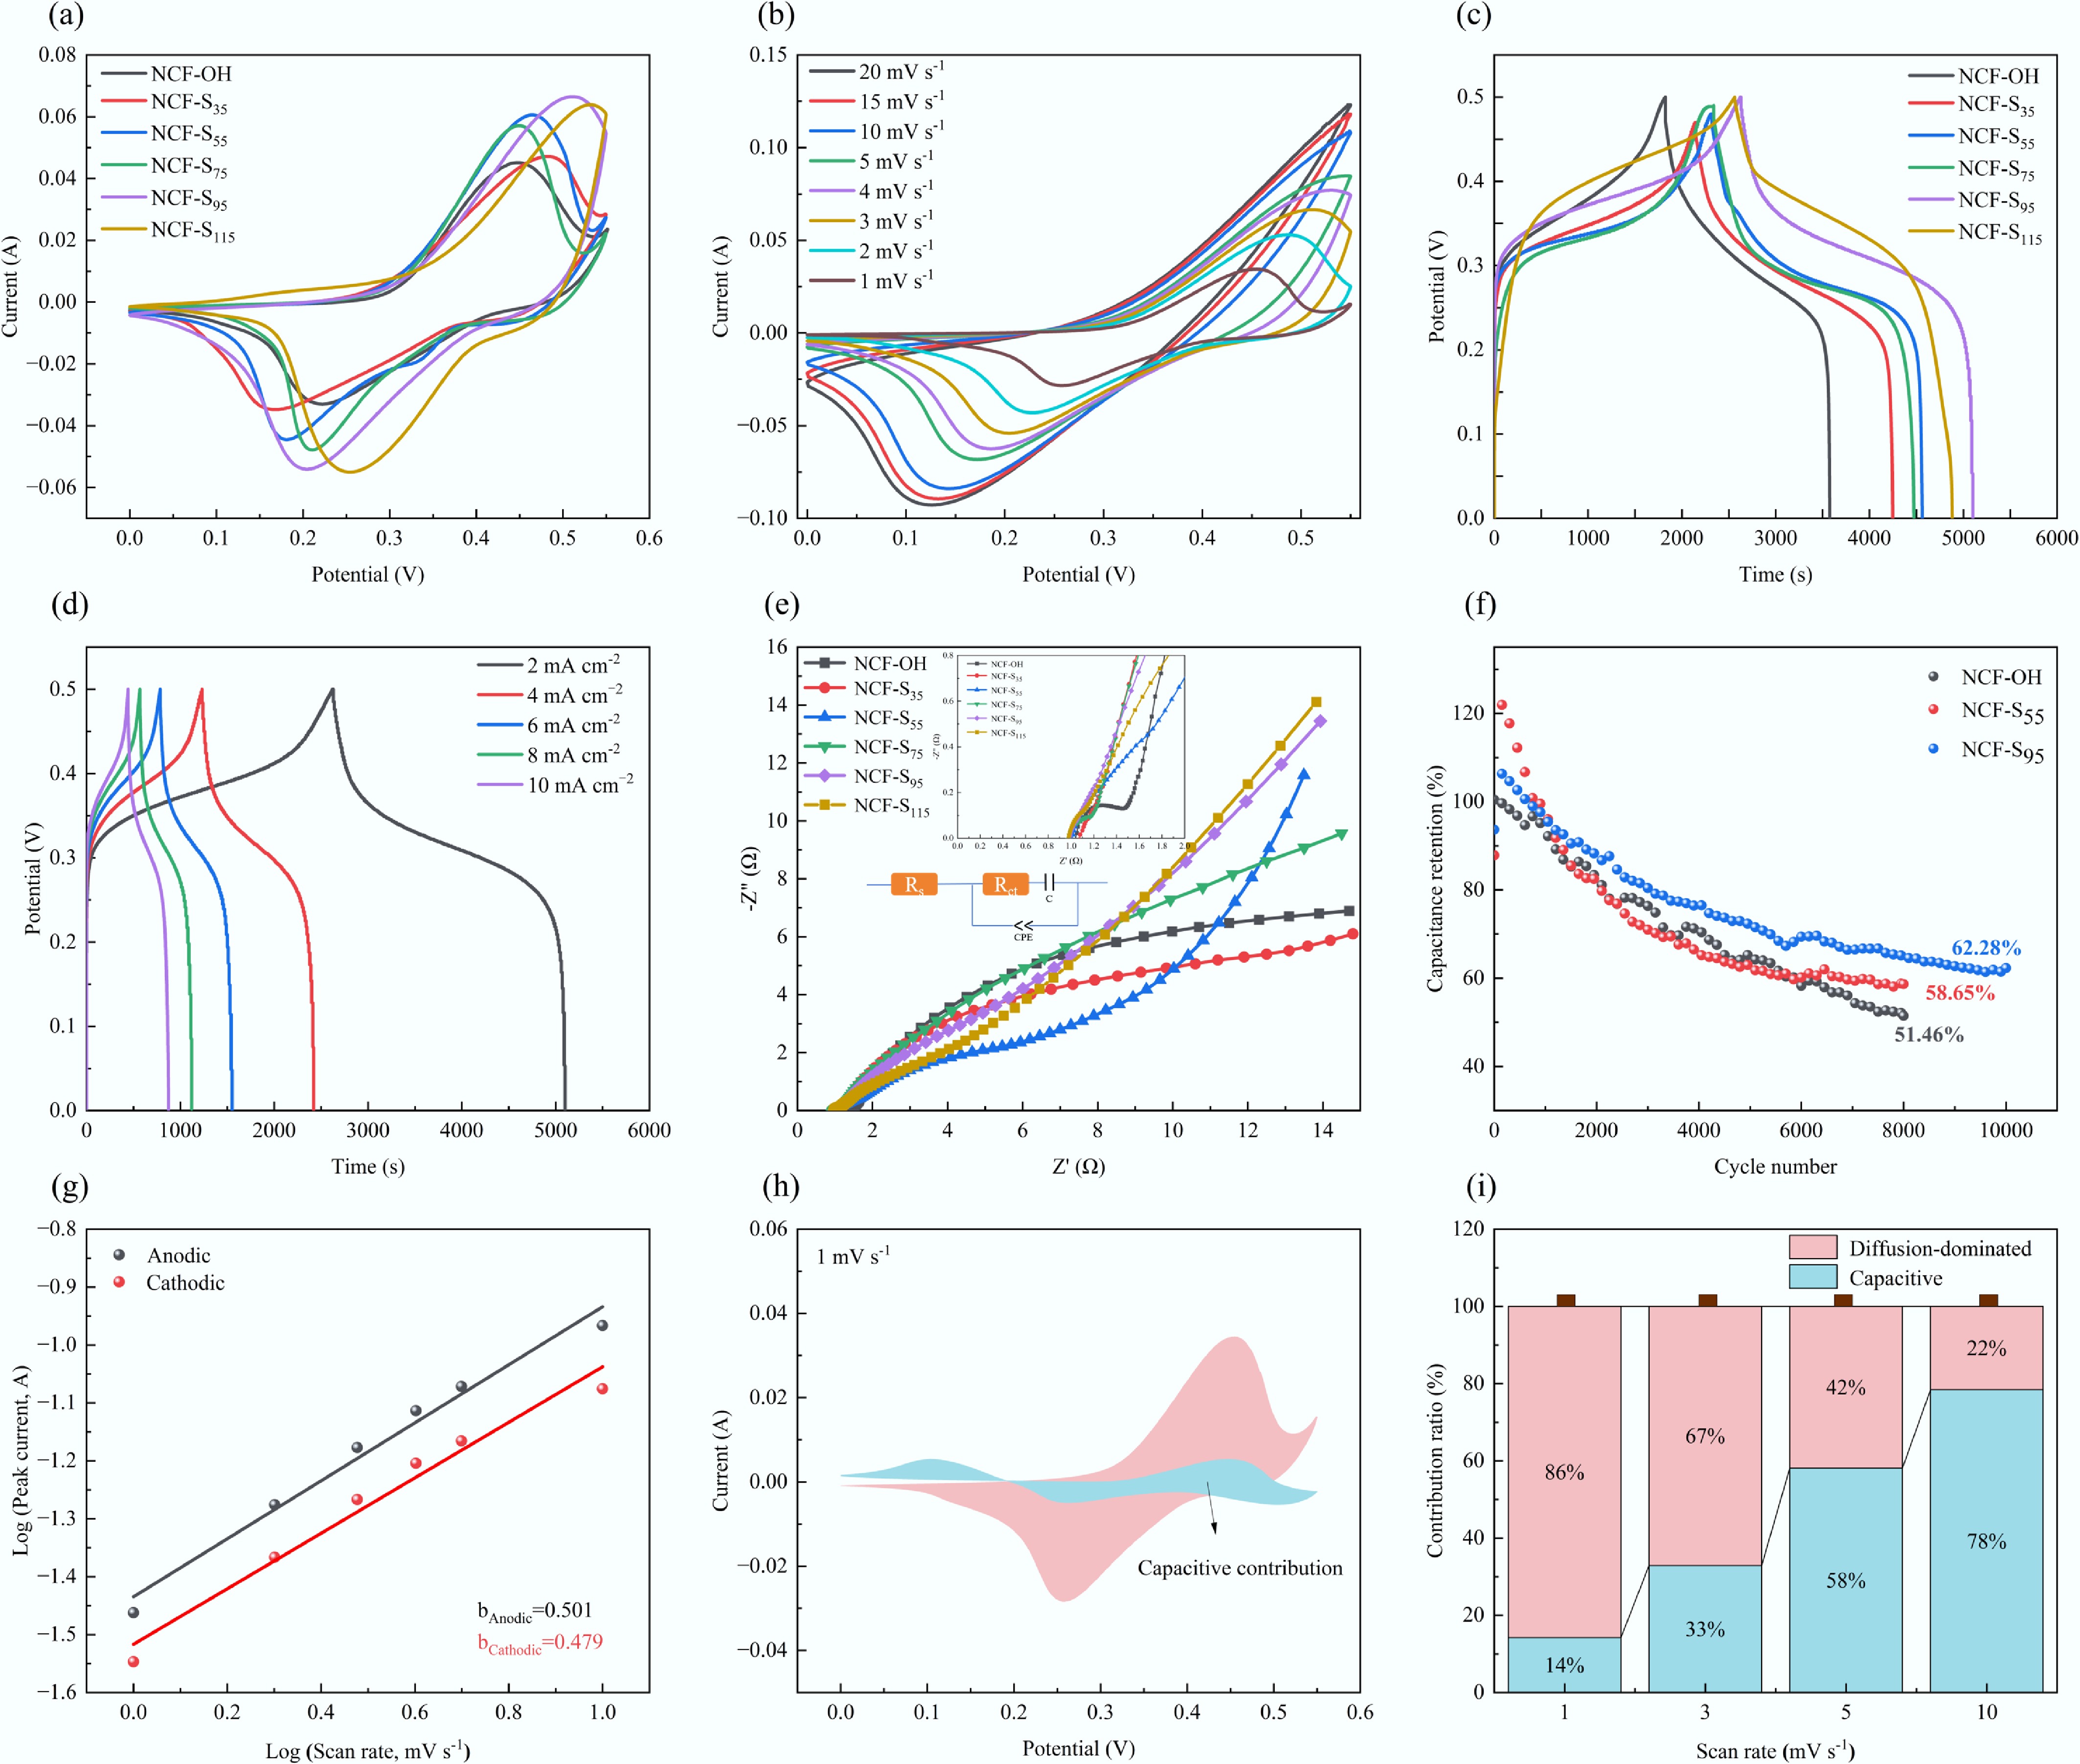
Figure 4.
(a) CV curves of different electrodes; (b) CV curves of NCF-S95; (c) GCD curves; (d) GCD curves of NCF-S95; (e) EIS curves; (f) cycle performance diagram; (g) b-value determination; (h) CV curve (shaded region) at 1 mV s−1 illustrating the capacitive and diffusion contributions. (i) Corresponding bar diagram for capacitive/diffusion contribution ratios of NCF-S95.
-
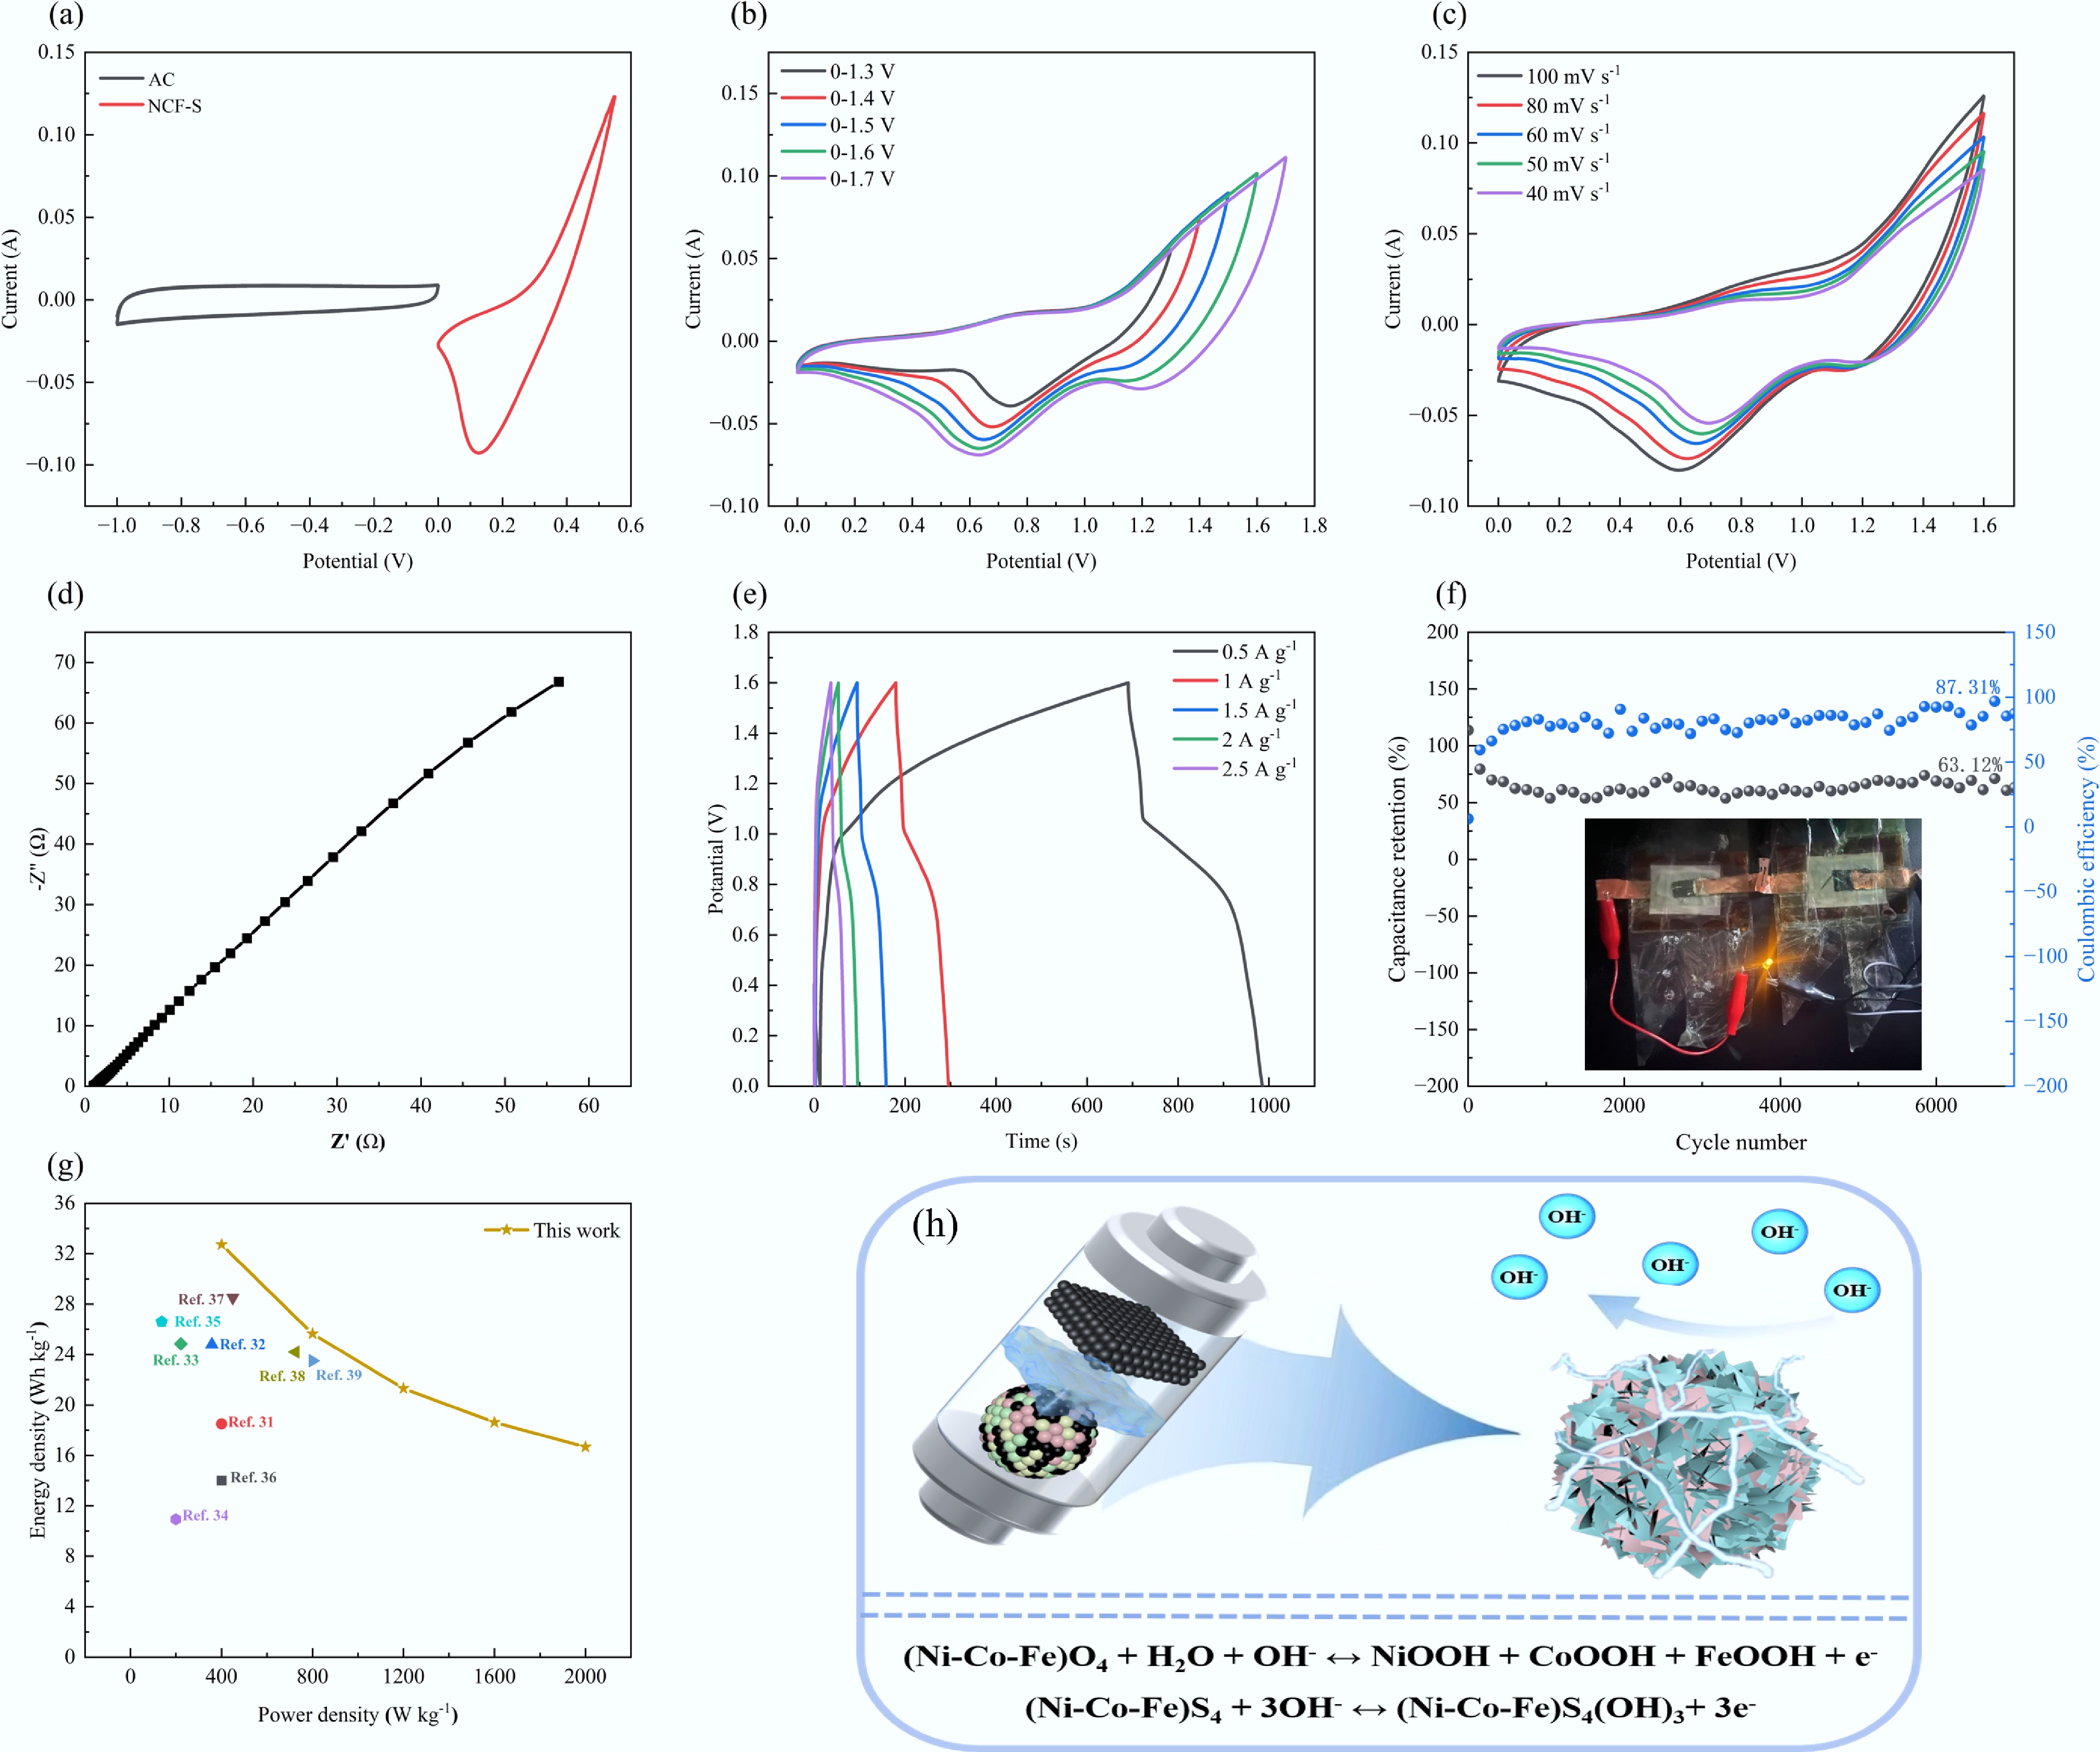
Figure 5.
(a) CV curves of NCF-S95 and AC; (b) CV curves in different potential windows; (c) CV curves at different scan rates; (d) EIS curve; (e) GCD curves; (f) cyclic stability; (g) electrochemical performance comparison diagram; (h) performance advantage diagram of NCF-S95//AC.
Figures
(5)
Tables
(0)