-
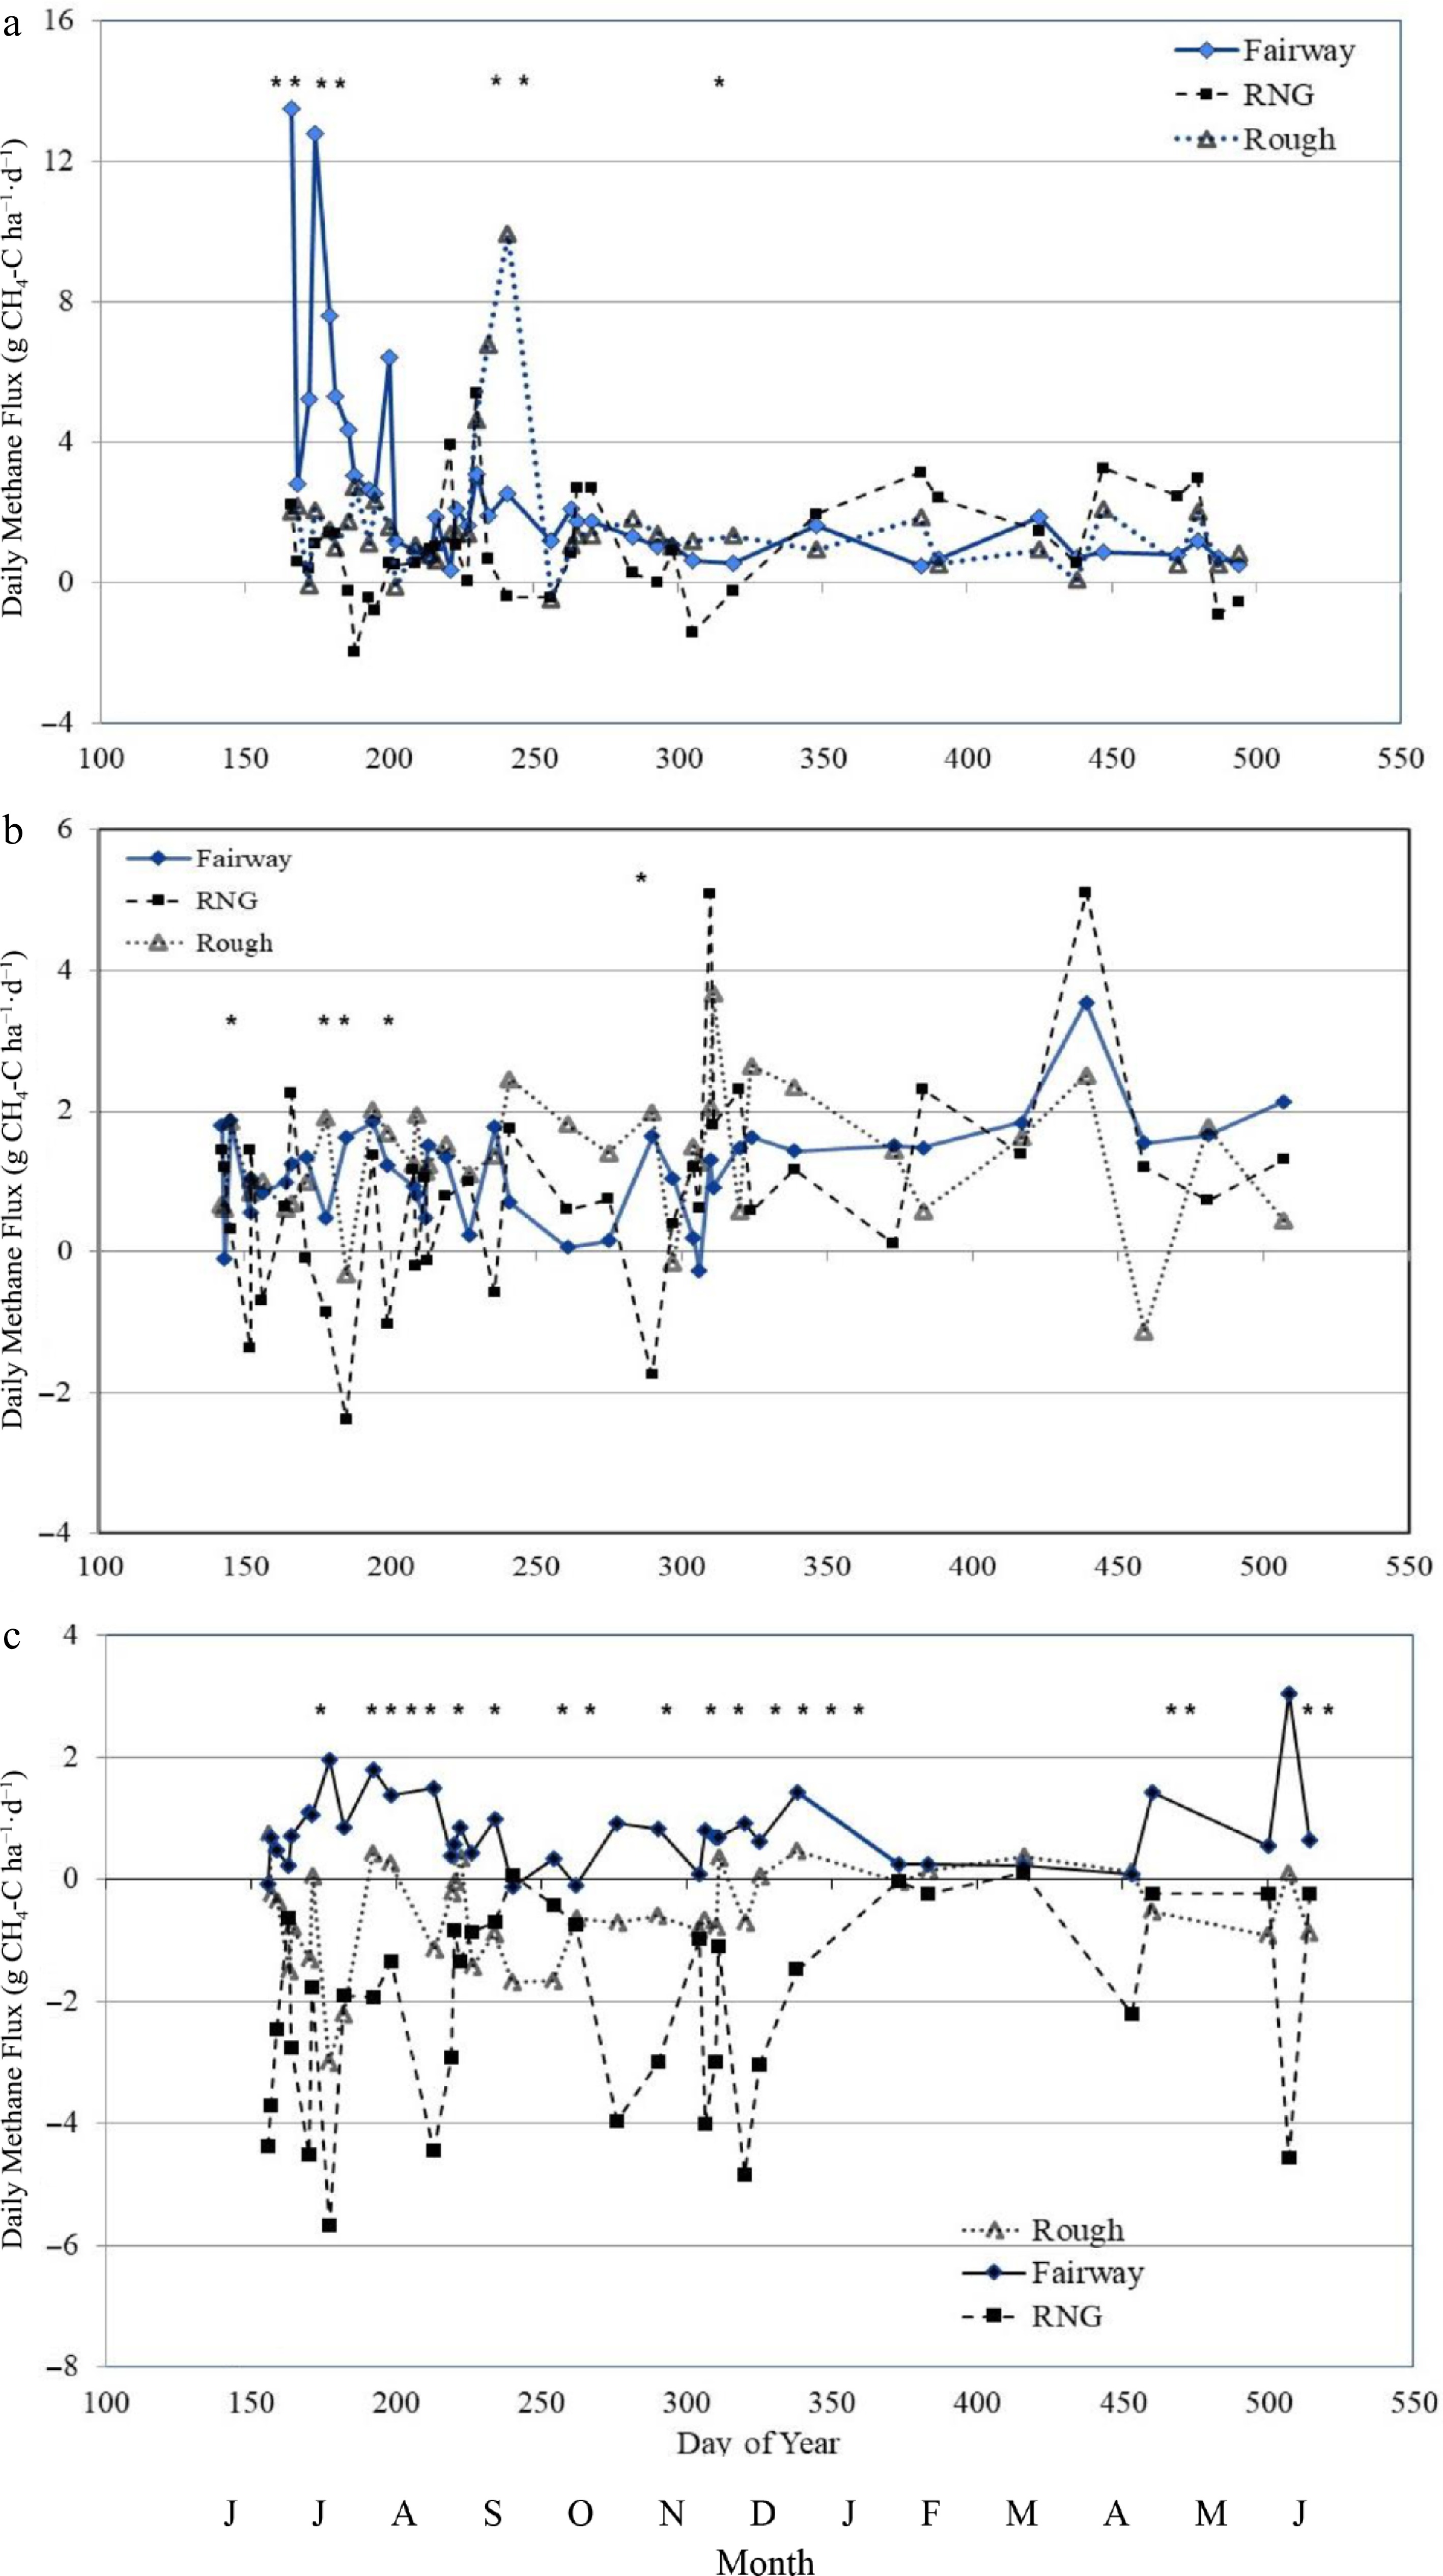
Figure 1.
Daily methane fluxes (g CH4-C ha−1·d−1) from fairway, rough, and restored native grass (RNG) soils during (a) 2011–2012, and (b) 2012–2013 at Site A, and during 2012−2013 at Site B (c). The X-axis shows the day of year (DOY) along with abbreviated months. Each methane emission data point represents the mean of three treatment replications. Asterisks (*) indicate significant differences (p < 0.05) among fairway, rough, and RNG treatments on individual measurement dates.
-
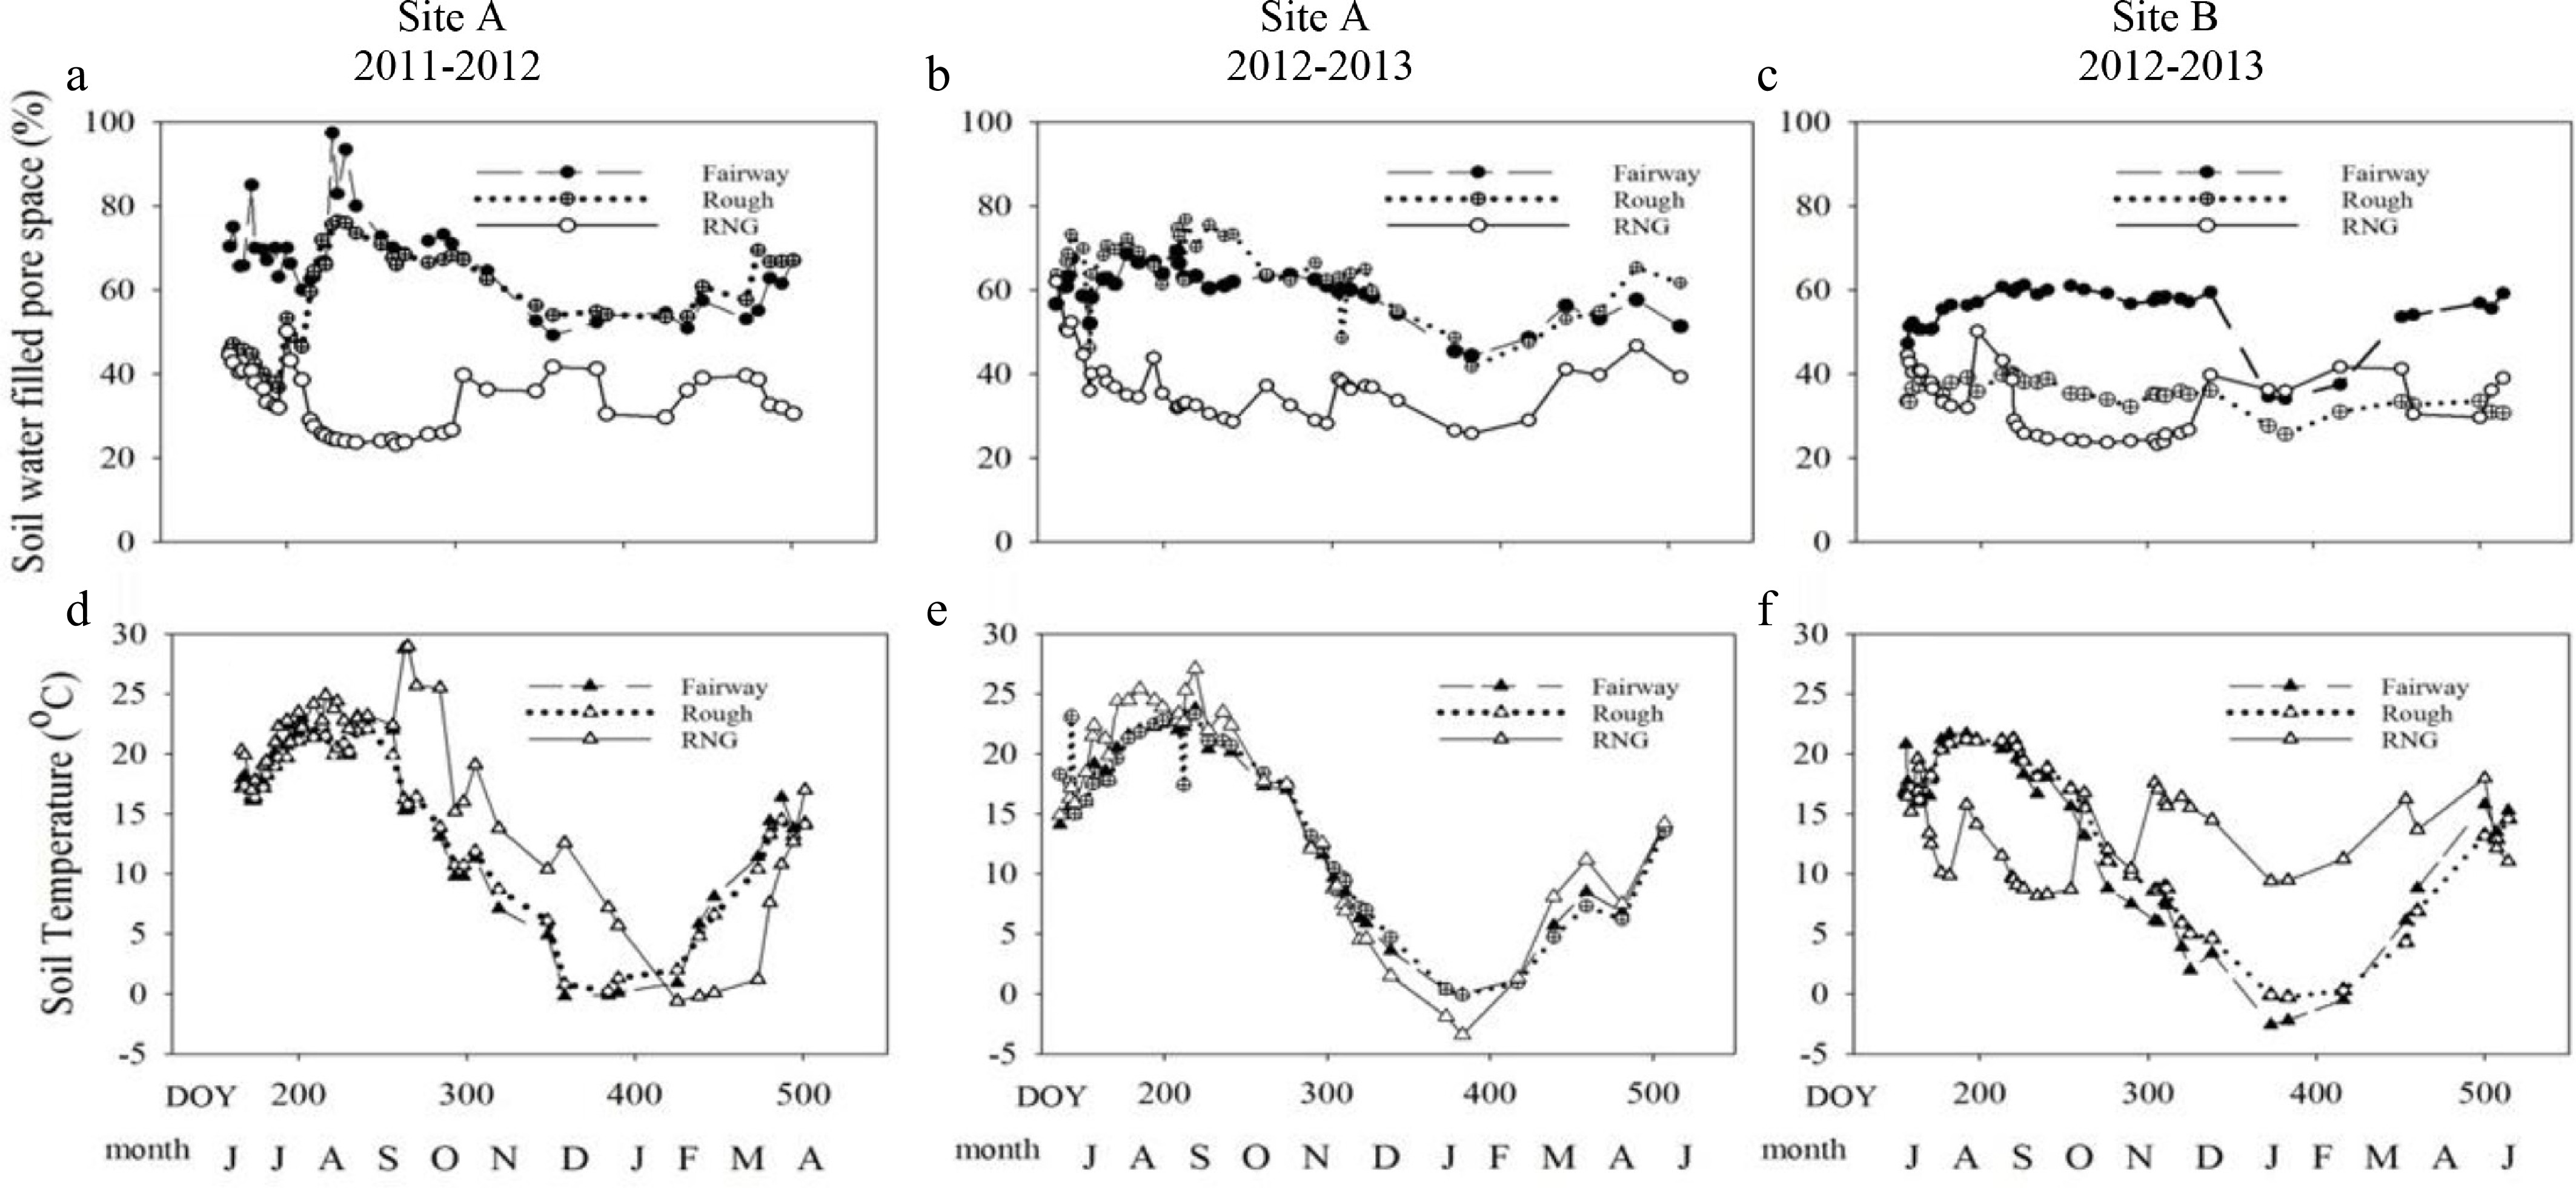
Figure 2.
(a)–(c) Soil water-filled pore space (%), and (d)–(f) soil temperature (celsius) of the top 10 cm of the soil profile are presented for each turfgrass section during the 2011–2012 and 2012–2013 seasons. The X-axis shows day of year (DOY) along with abbreviated months.
-
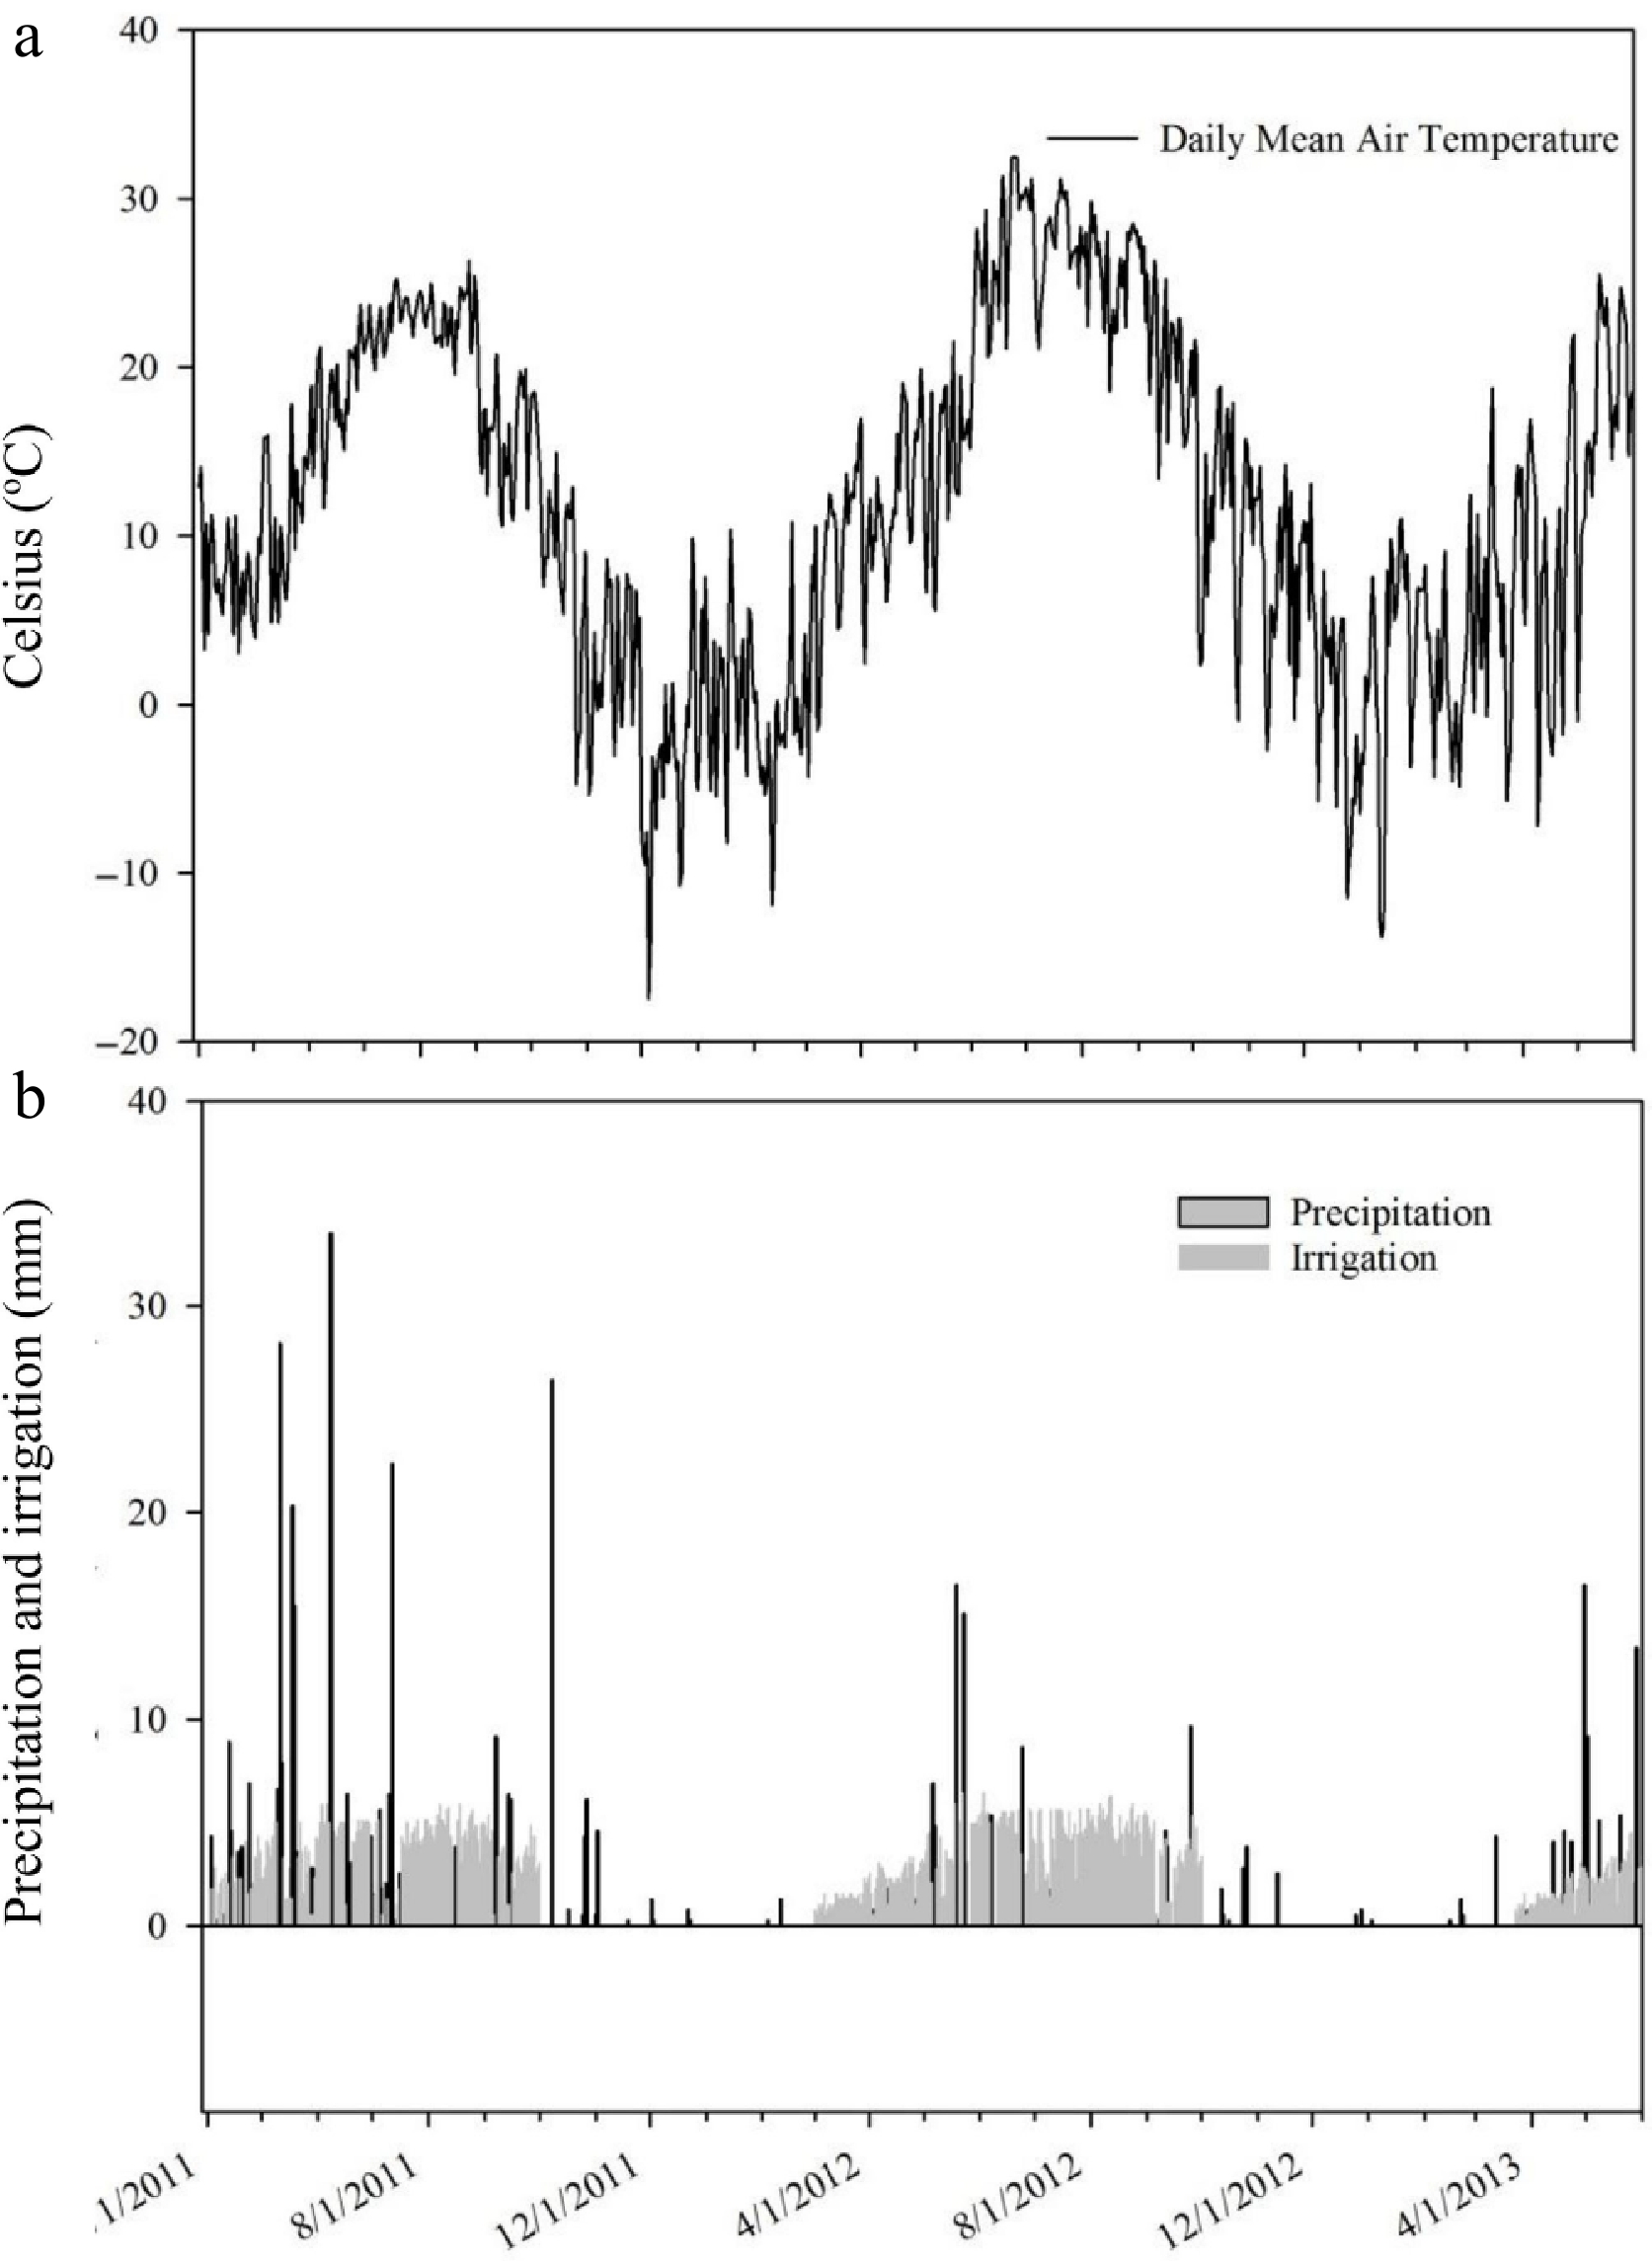
Figure 3.
(a) Daily mean air temperature; and (b) precipitation and irrigation water applications during the 2-year study period, 2011 to 2013.
-
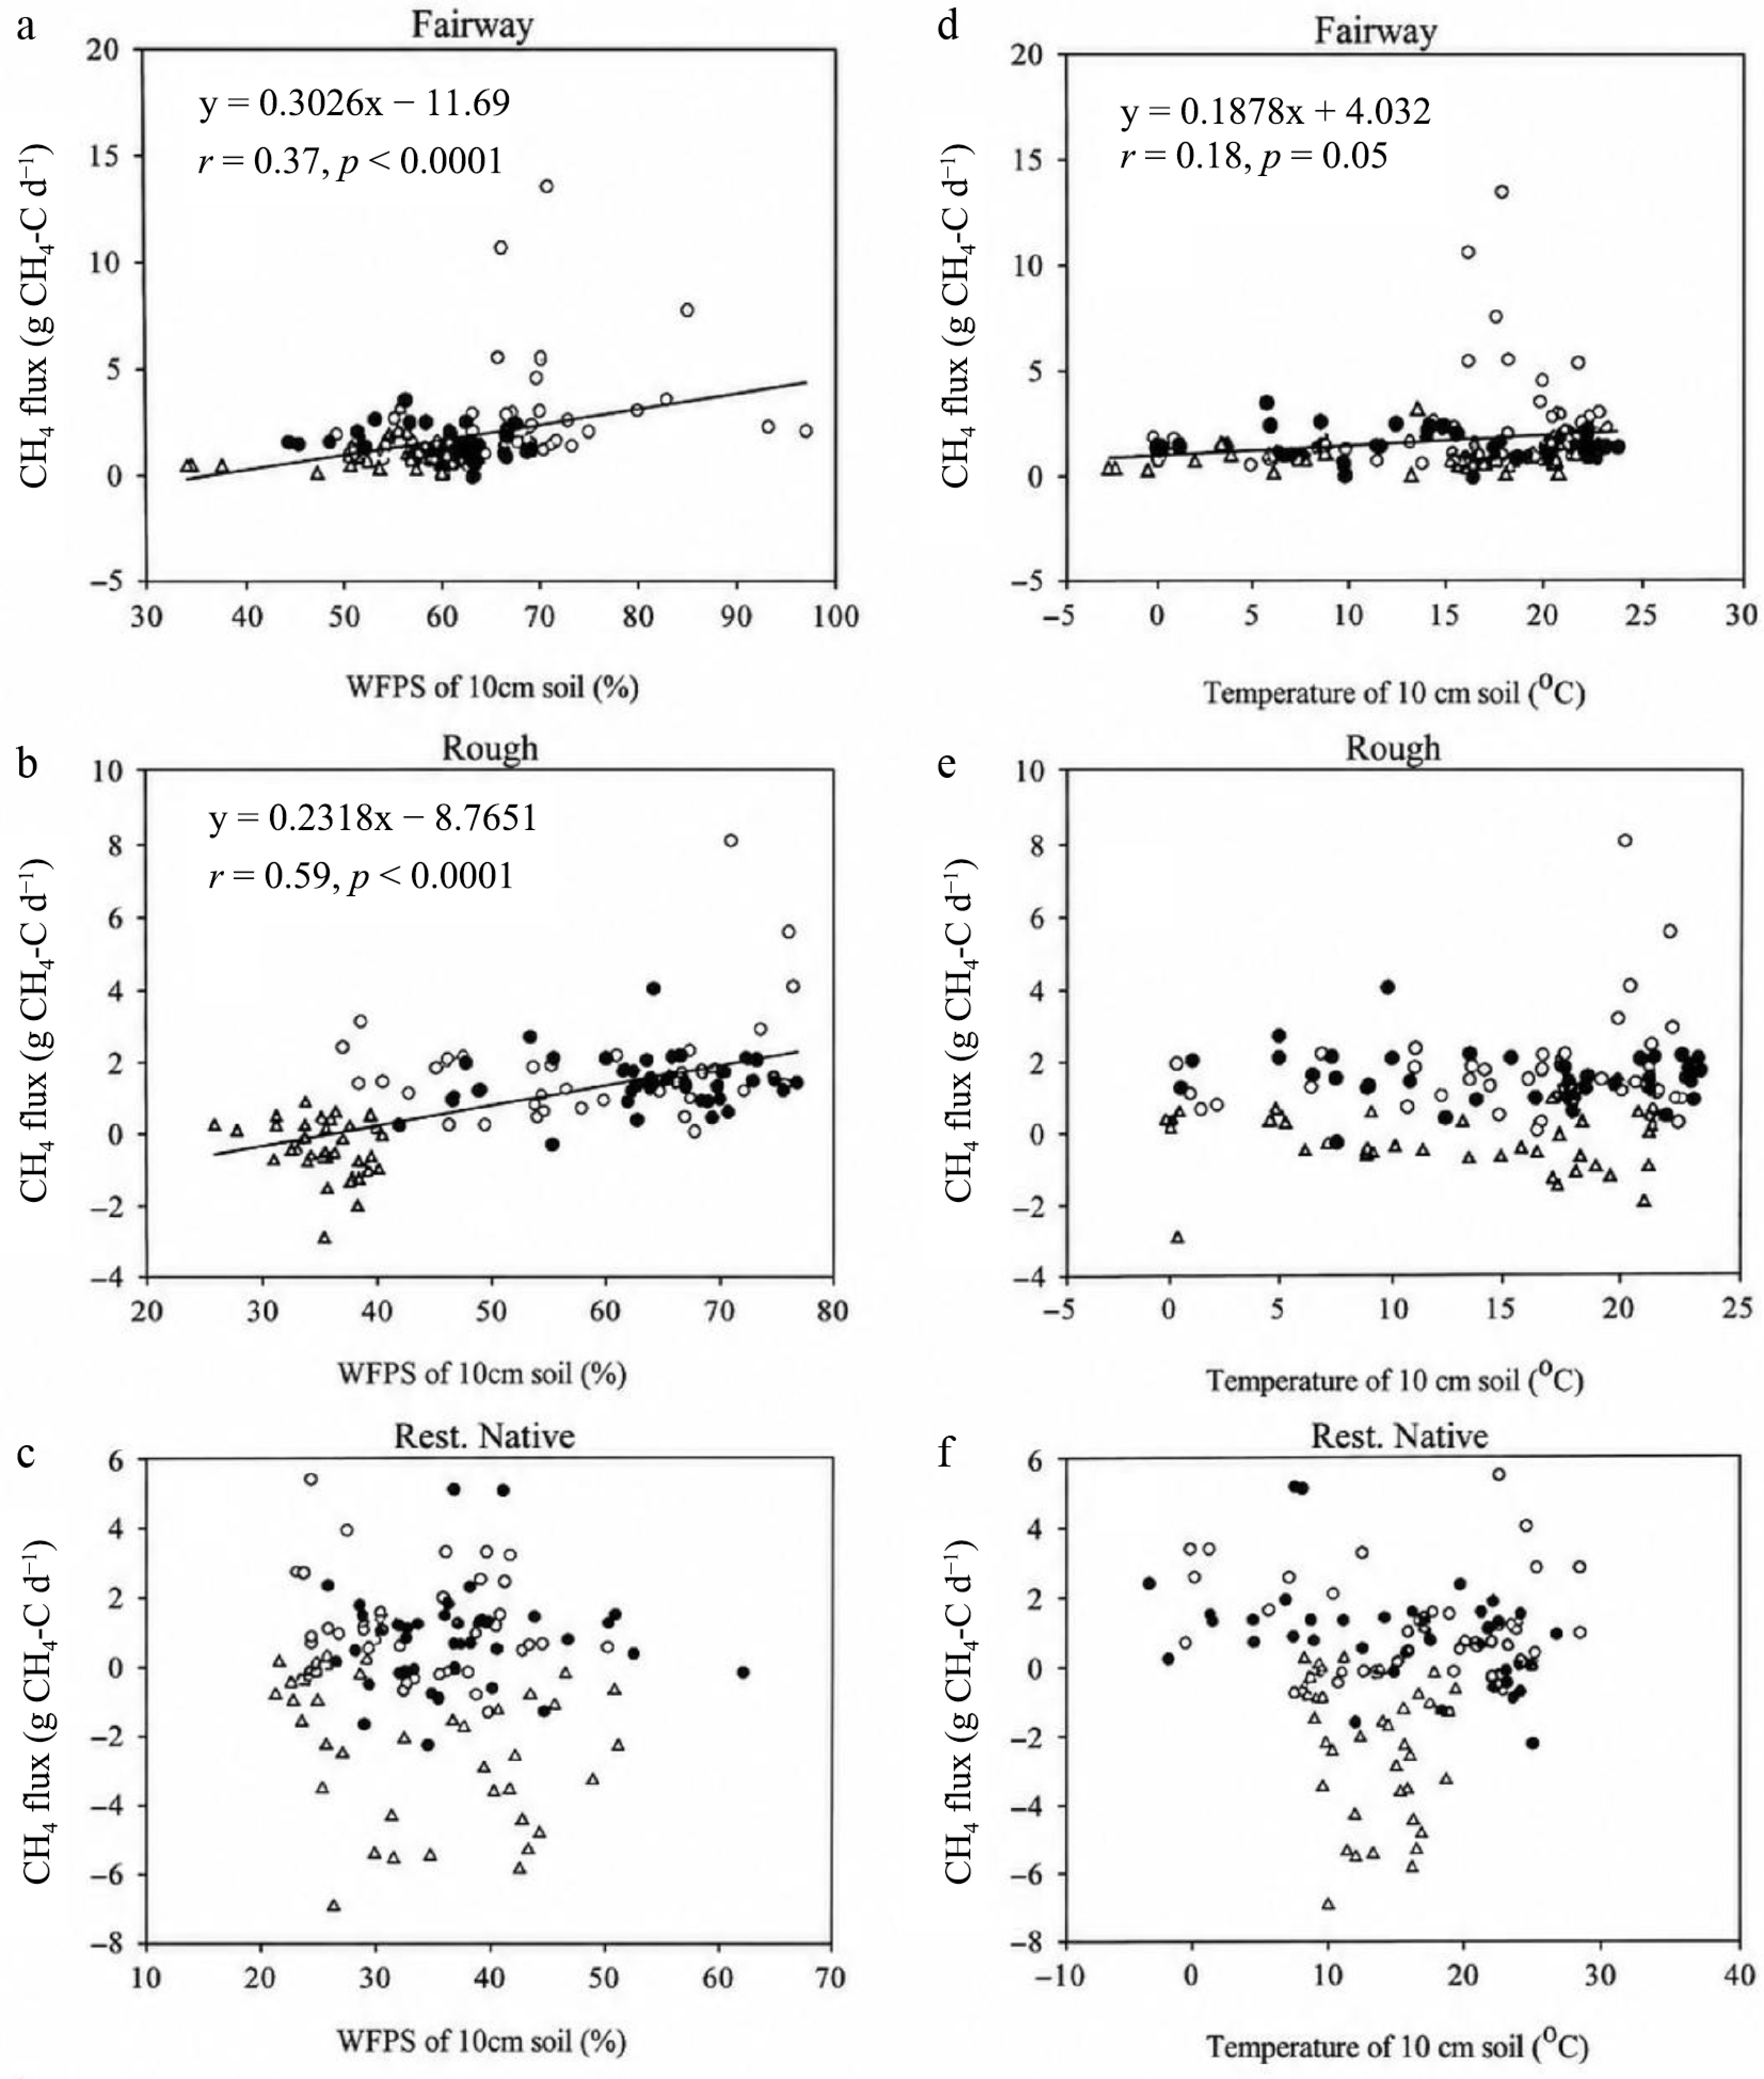
Figure 4.
(a)–(c) Correlations for soil methane flux and water-filled pore space (WFPS), and (d)–(f) temperature from soils at experimental turfgrass sites. p-values, r-values, and linear correlations are presented for each test location where significance exceeds the p < 0.05 level. Open and closed circles are from Site A soil in 2011 and 2012, respectively, and open triangles are from Site B.
-
Site Bulk density (g·cm−3) Soil WFPS (%) Soil organic carbon (g·kg−1 soil) NO3-N (mg·kg−1 soil) Texture Site A- Fairway 1.43 aᴪ 64* 9.5 aᴪ 25.6 aᴪ Sandy clay loam/sandy loam Site A-Rough 1.52 a 62** 8.4 a 37.4 a Sandy clay loam/sandy loam Site A-RNG 1.42 a 36** 0.6 b 1.0 c Sandy clay loam Site B-Fairway 1.10 b 50 11.3 a 10.5 b Sandy clay loam/sandy loam Site B-Rough 1.09 b 40 10.0 a 7.5 b Sandy clay loam Site B-RNG 1.14 b 24 0.4 b 1.1 c Sandy clay loam ᴪ means followed by different letters indicate significant differences at p < 0.05. * mean soil water-filled pore space (WFPS) is presented for Site A and Site B baseline soil samples in 2011 and 2012, respectively; *, ** significant difference between Site A and Site B for the respective turf types at p < 0.05 and p < 0.001, respectively. Table 1.
Bulk density, soil water filled pore space (WFPS), soil organic carbon (SOC), nitrate (NO3-N), and soil texture from baseline soil samples from the fairways, rough, and restored native grass areas (RNG) within the 0−10 cm soil profile.
-
Section/turf type Mean methane flux (g CH4-C ha−1·d−1) Site A Site B 2011−2012 2012−2013 2012−2013 Fairway 2.39 a Aᴪ 1.18 ab B 0.78 a C Rough 1.66 b A 1.33 a A −0.53 b B RNG area 1.18 b A 0.82 b A −2.03 c B ᴪ Methane fluxes presented are the means of treatment replications over 38−39 measurement dates: from June 15, 2011 to May 8, 2012, and from May 21, 2012 to May 21, 2013 for Site A, and from June 4, 2012 to May 28, 2013 for Site B. Means followed by different lowercase letters are significantly different among the three turf types (Fairway, Rough, and RNG) within each season. Means followed by different uppercase letters are significantly different across seasons and sites within each turf type (Fairway, Rough, or RNG). A positive methane flux value indicates a methane source, whereas a negative value indicates a methane sink. Table 2.
Average methane flux (g CH4-C ha−1·d−1) from fairways, rough, and restored native grass (RNG) areas in 2011−2012, and 2012−2013.
Figures
(4)
Tables
(2)