-
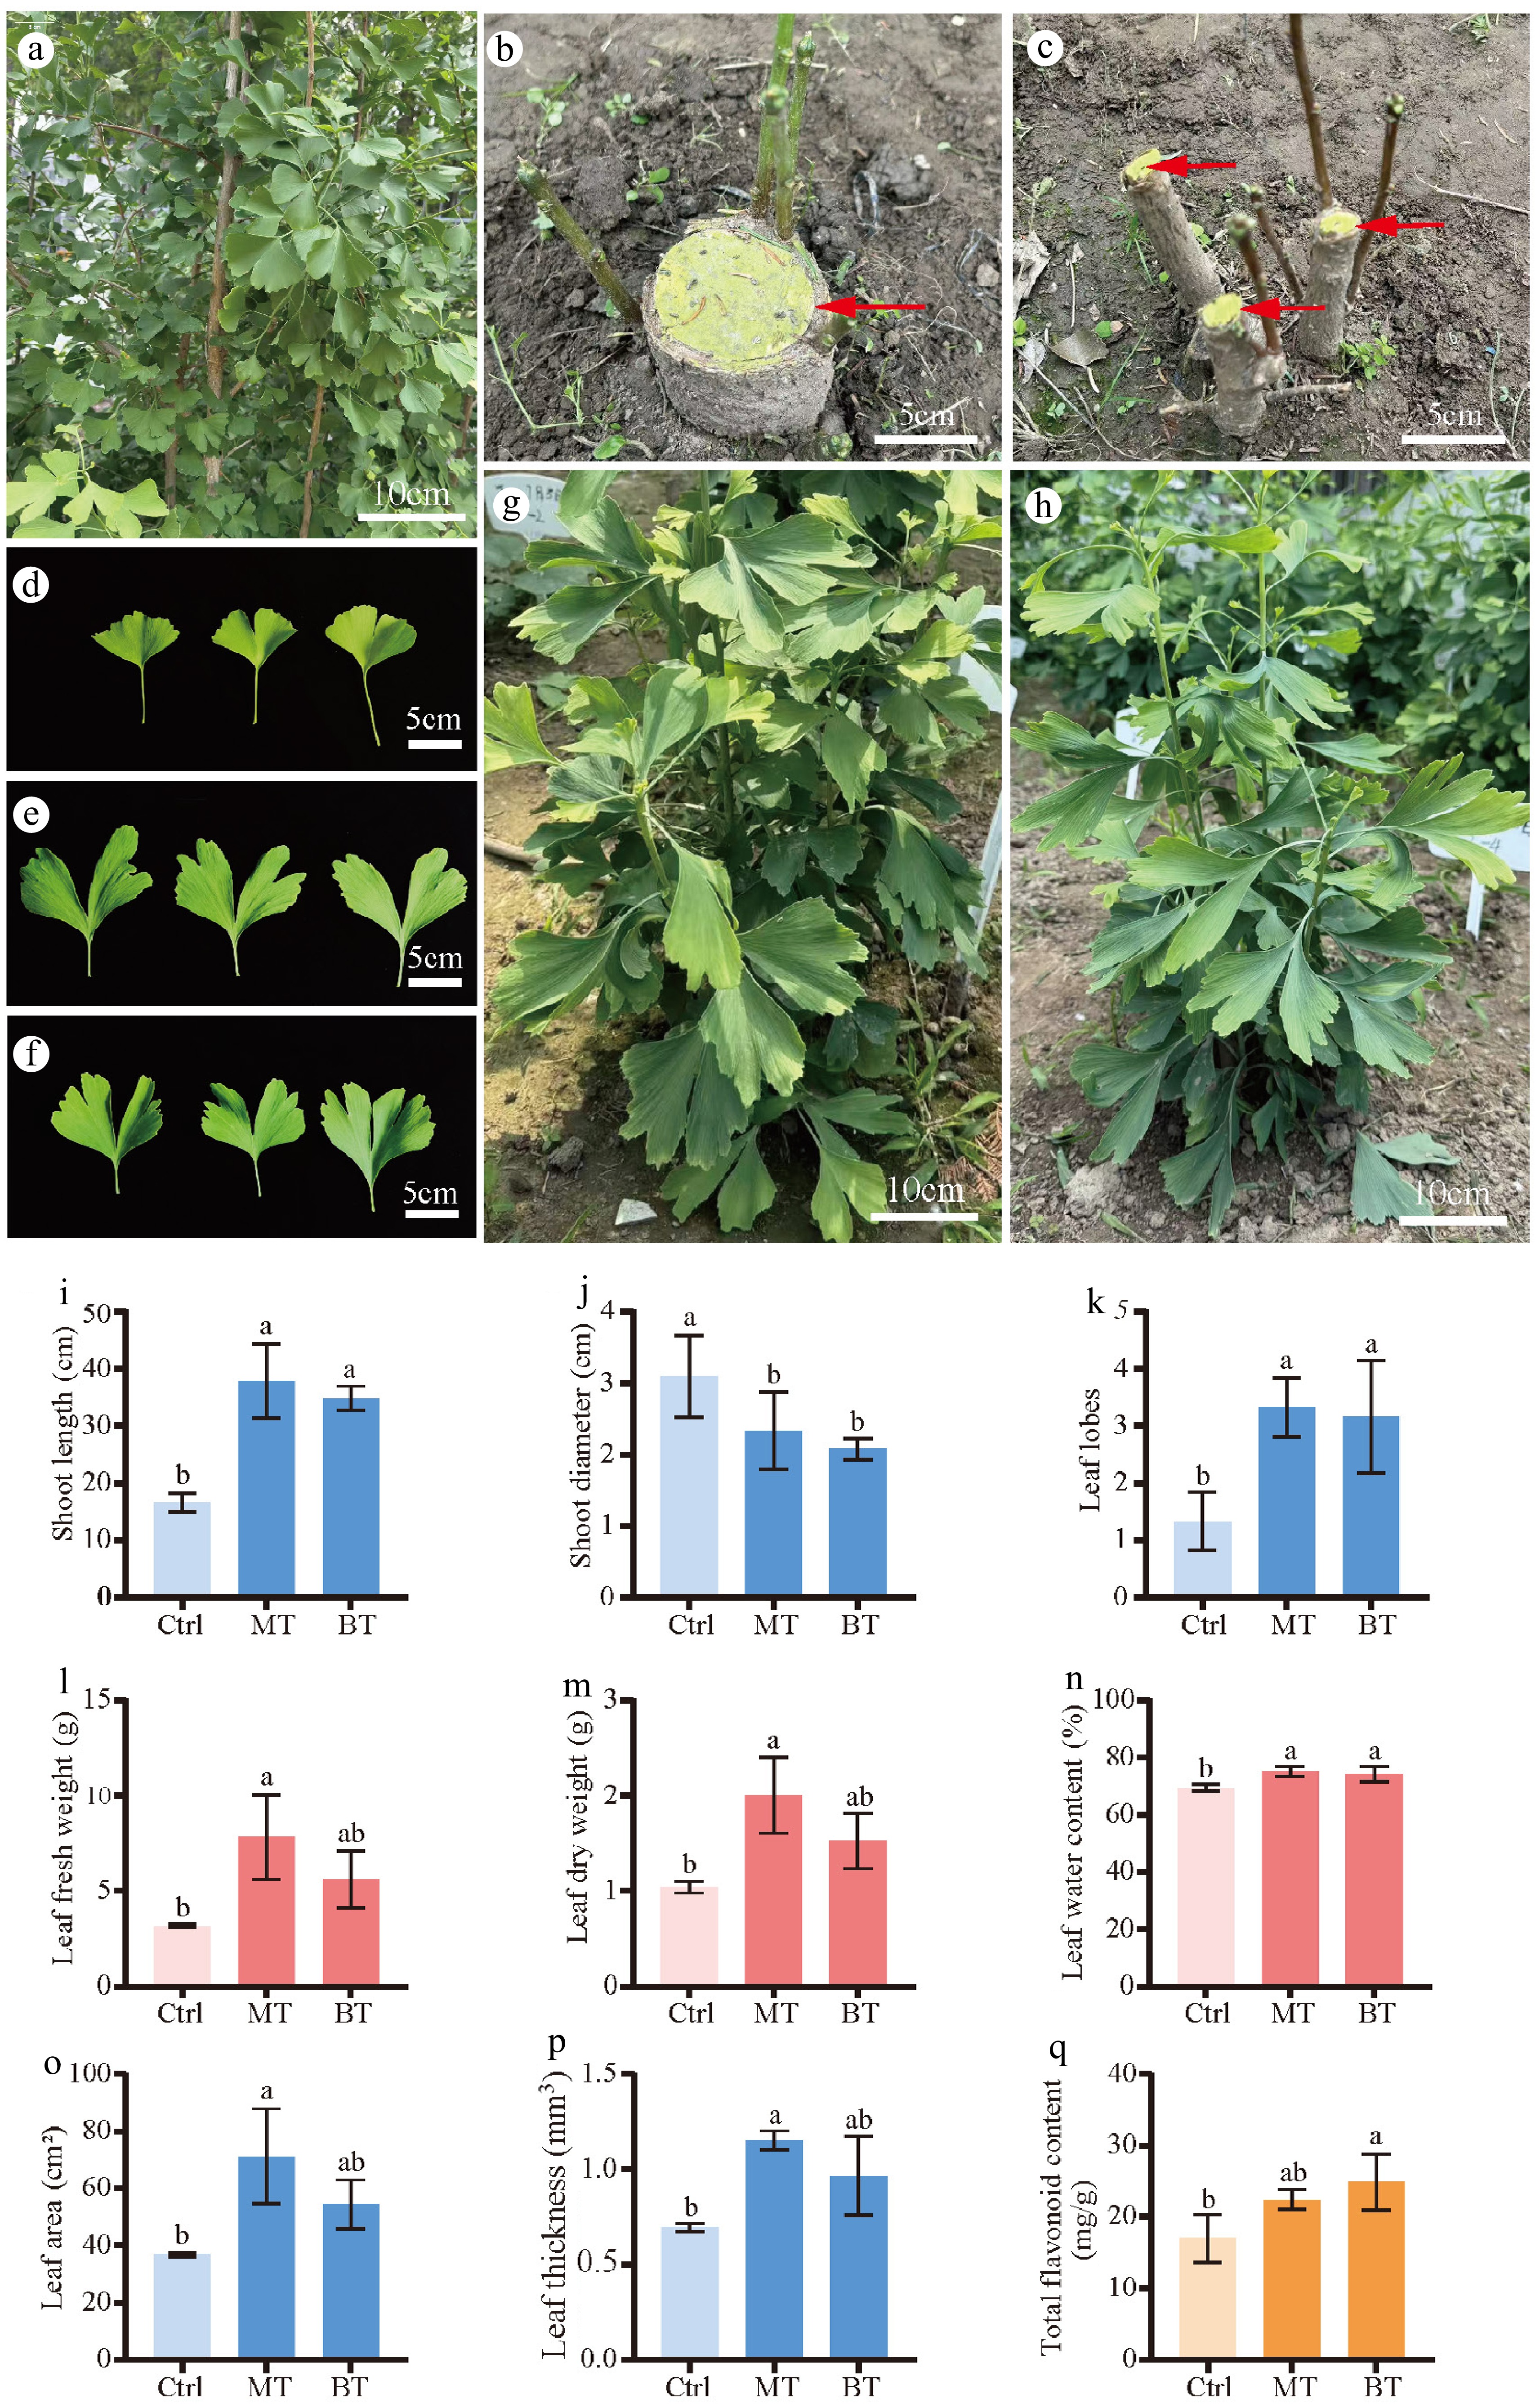
Figure 1.
Effects of different pruning treatments on plant growth and leaf traits in G. biloba. (a) Untreated control plant (Ctrl); (b) basal part of the main trunk-pruning treatment (MT); (c) basal part of the consecutive branch-pruning treatment (BT). (d) Leaves of Ctrl plants; (e) leaves of MT plants; (f) leaves of BT plants. (g) Regenerated shoots of MT plants and (h) regenerated shoots of BT plants. Quantitative analyses included (i) new shoot height, (j) new shoot stem diameter, (k) number of leaf lobes, (l) leaf fresh weight, (m) leaf dry weight, (n) leaf water content, (o) leaf area, (p) leaf thickness, and (q) total flavonoid content. Data are presented as the means of at least three biological replicates (±SD). Letters indicate significant differences based on one-way ANOVA (p < 0.05).
-
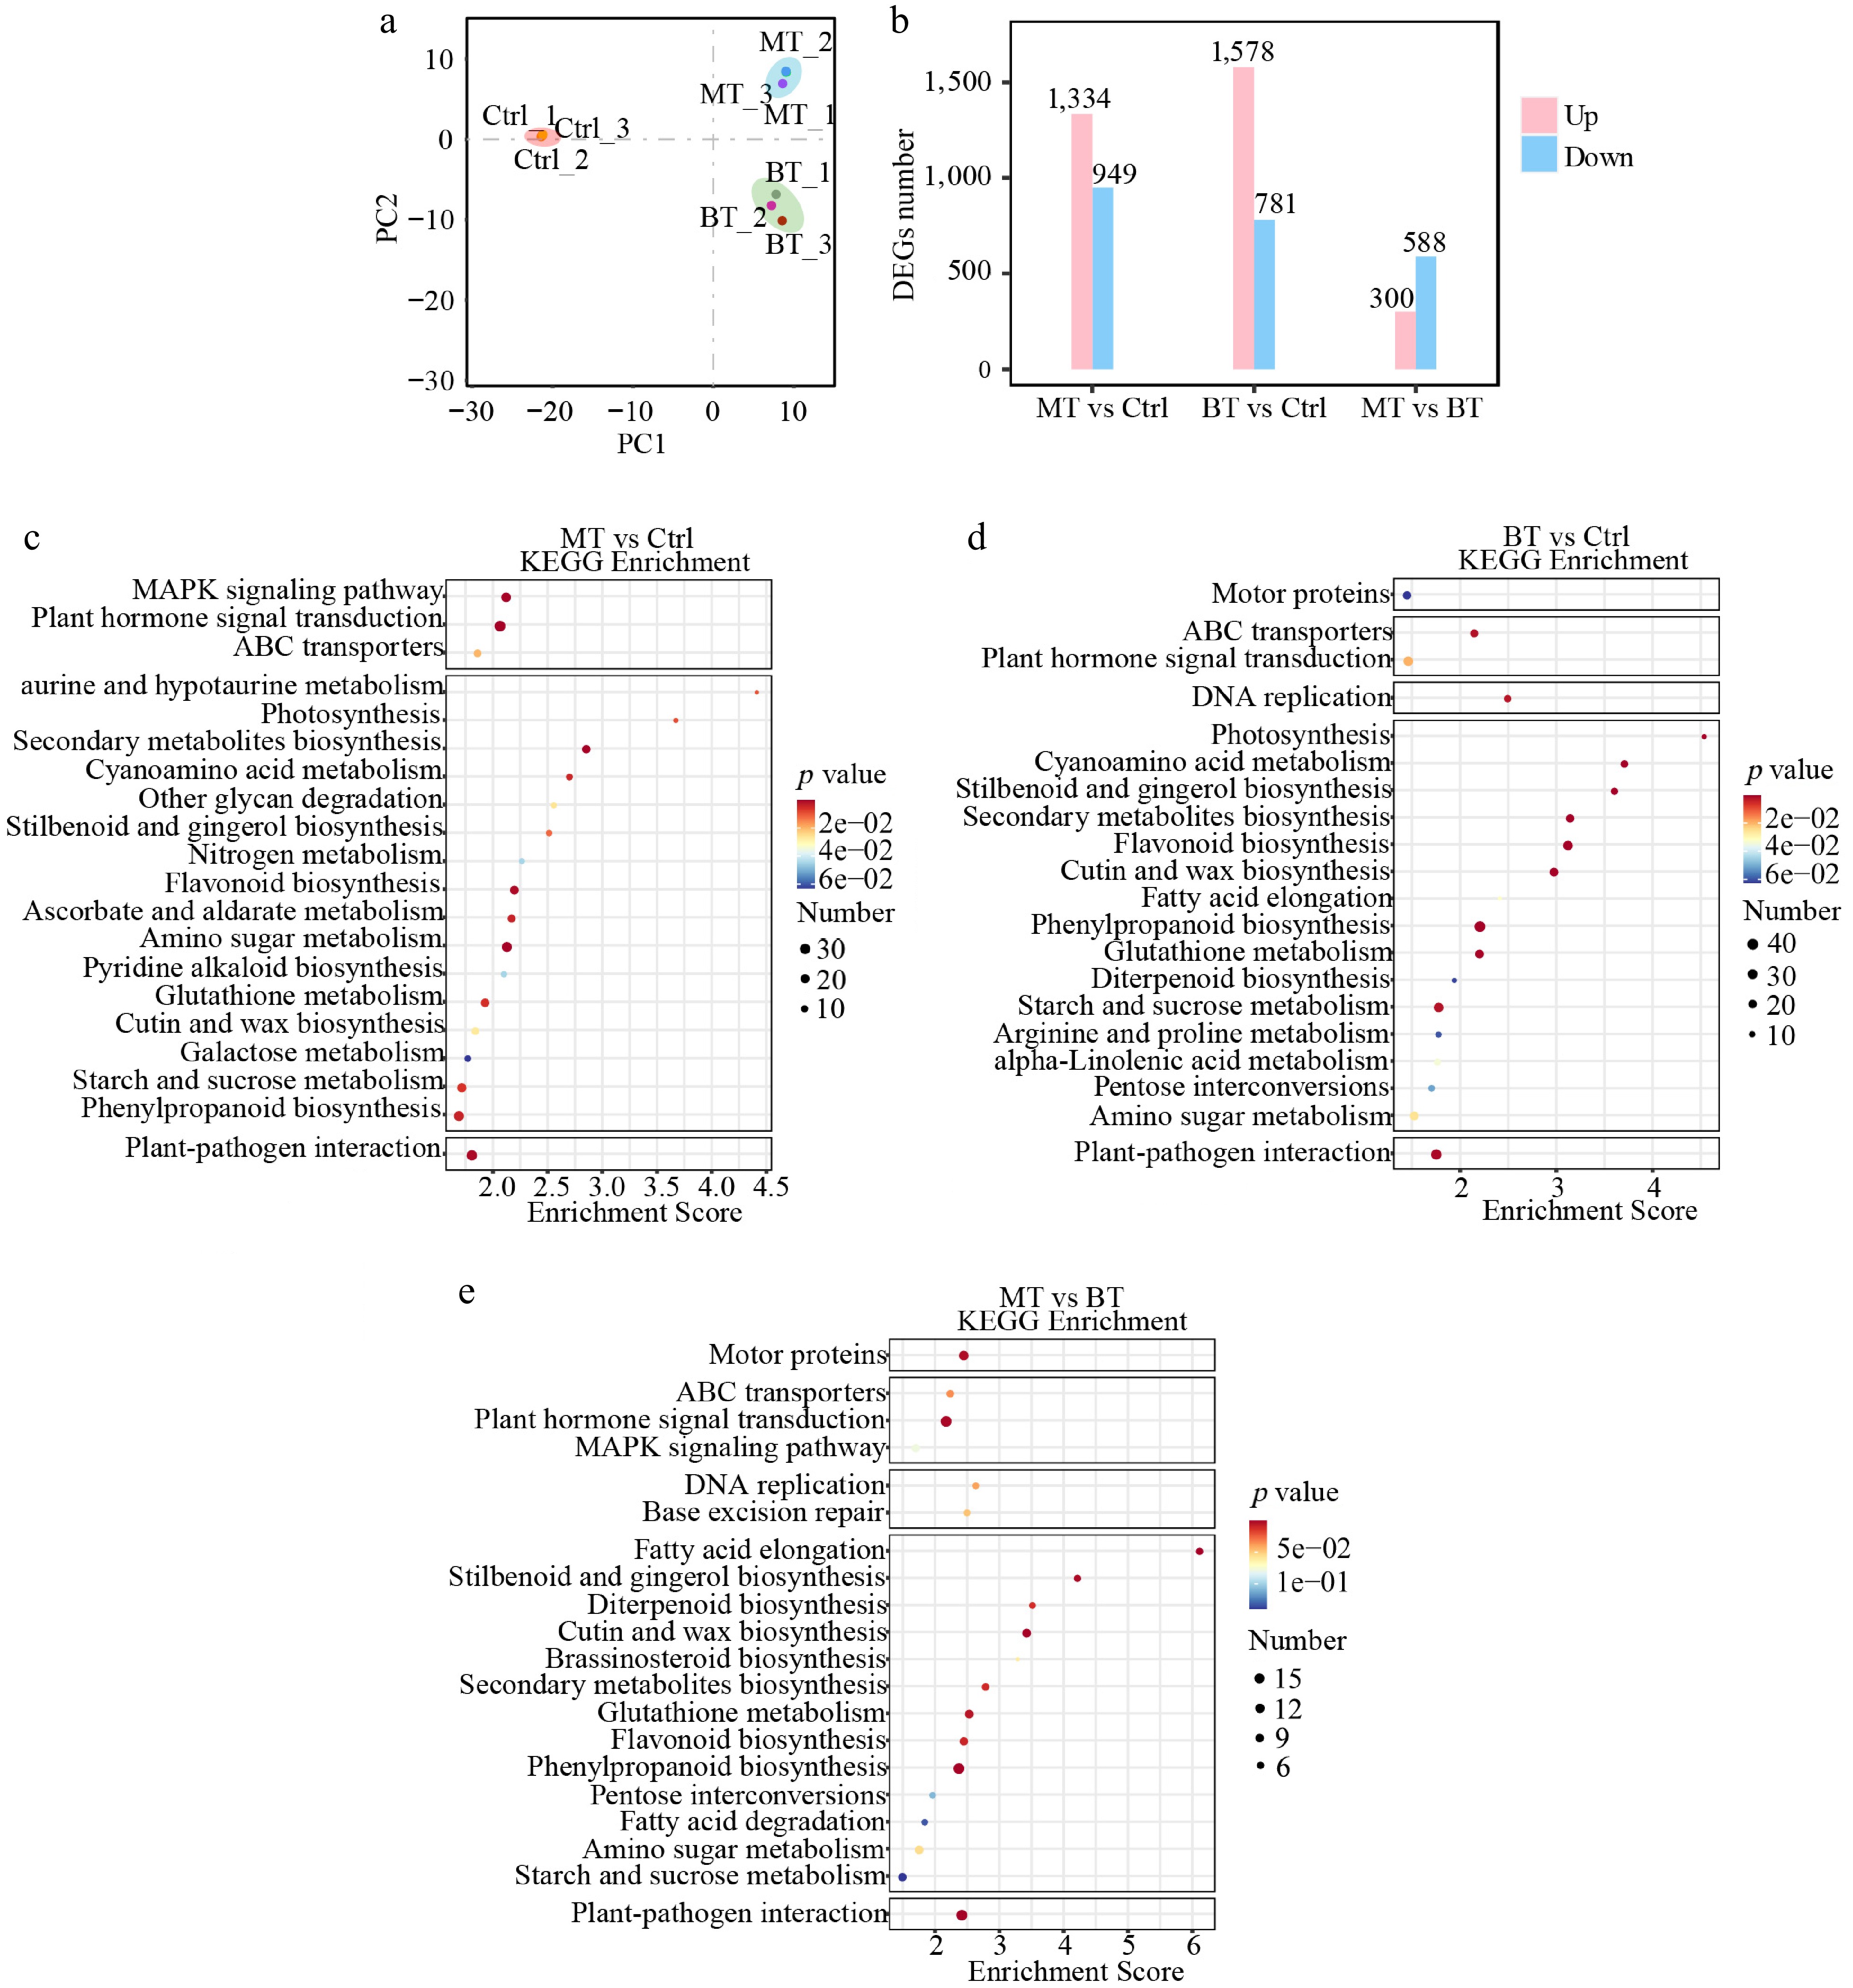
Figure 2.
Transcriptome analysis of G. biloba leaves under different pruning treatments. (a) PCA showing the clustering patterns of samples from different treatment groups. (b) Statistics of DEGs, including the numbers of upregulated and downregulated genes in three comparison groups: MT vs Ctrl, BT vs Ctrl, and MT vs BT. (c–e) KEGG pathway enrichment analysis of DEGs in the MT vs Ctrl (c), BT vs Ctrl (d), and MT vs BT (e) comparison groups, respectively.
-
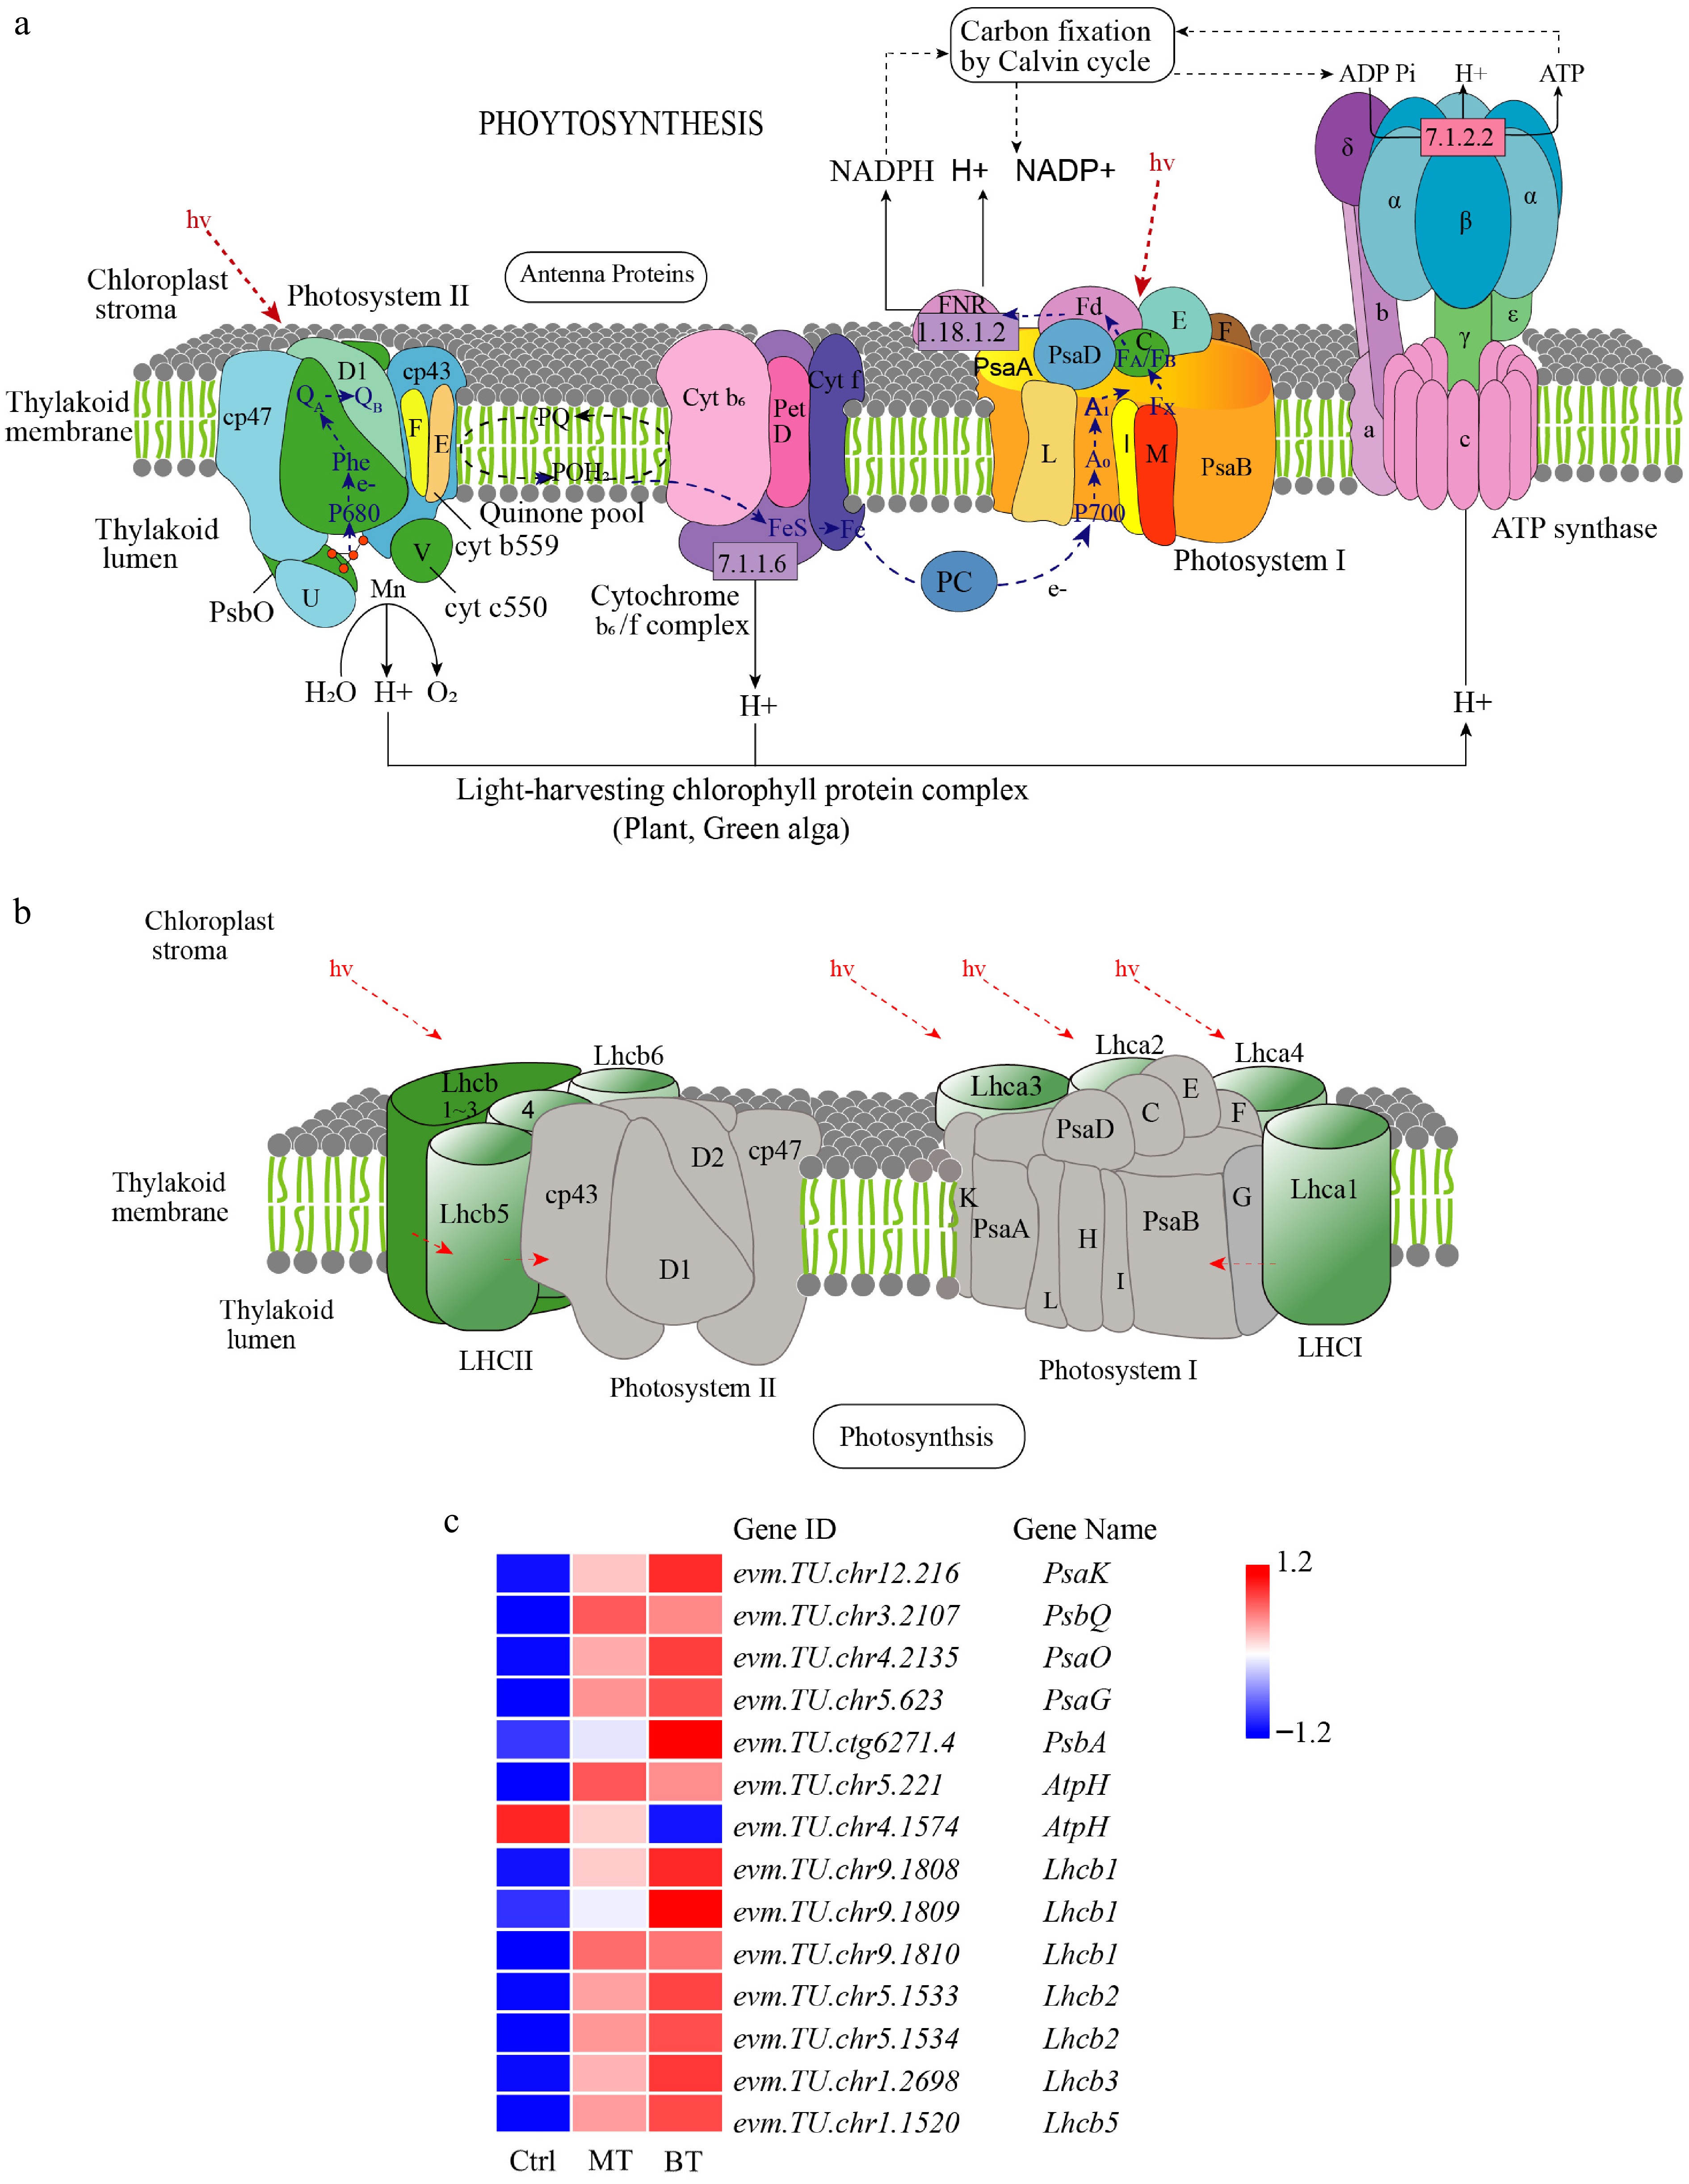
Figure 3.
Expression changes of genes related to photosynthesis pathways in G. biloba under different pruning treatments. Photosynthesis pathway (a) and photosynthetic antenna protein pathway (b) from the KEGG database. (c) Heatmap of key genes involved in each component of the photosynthesis pathway.
-
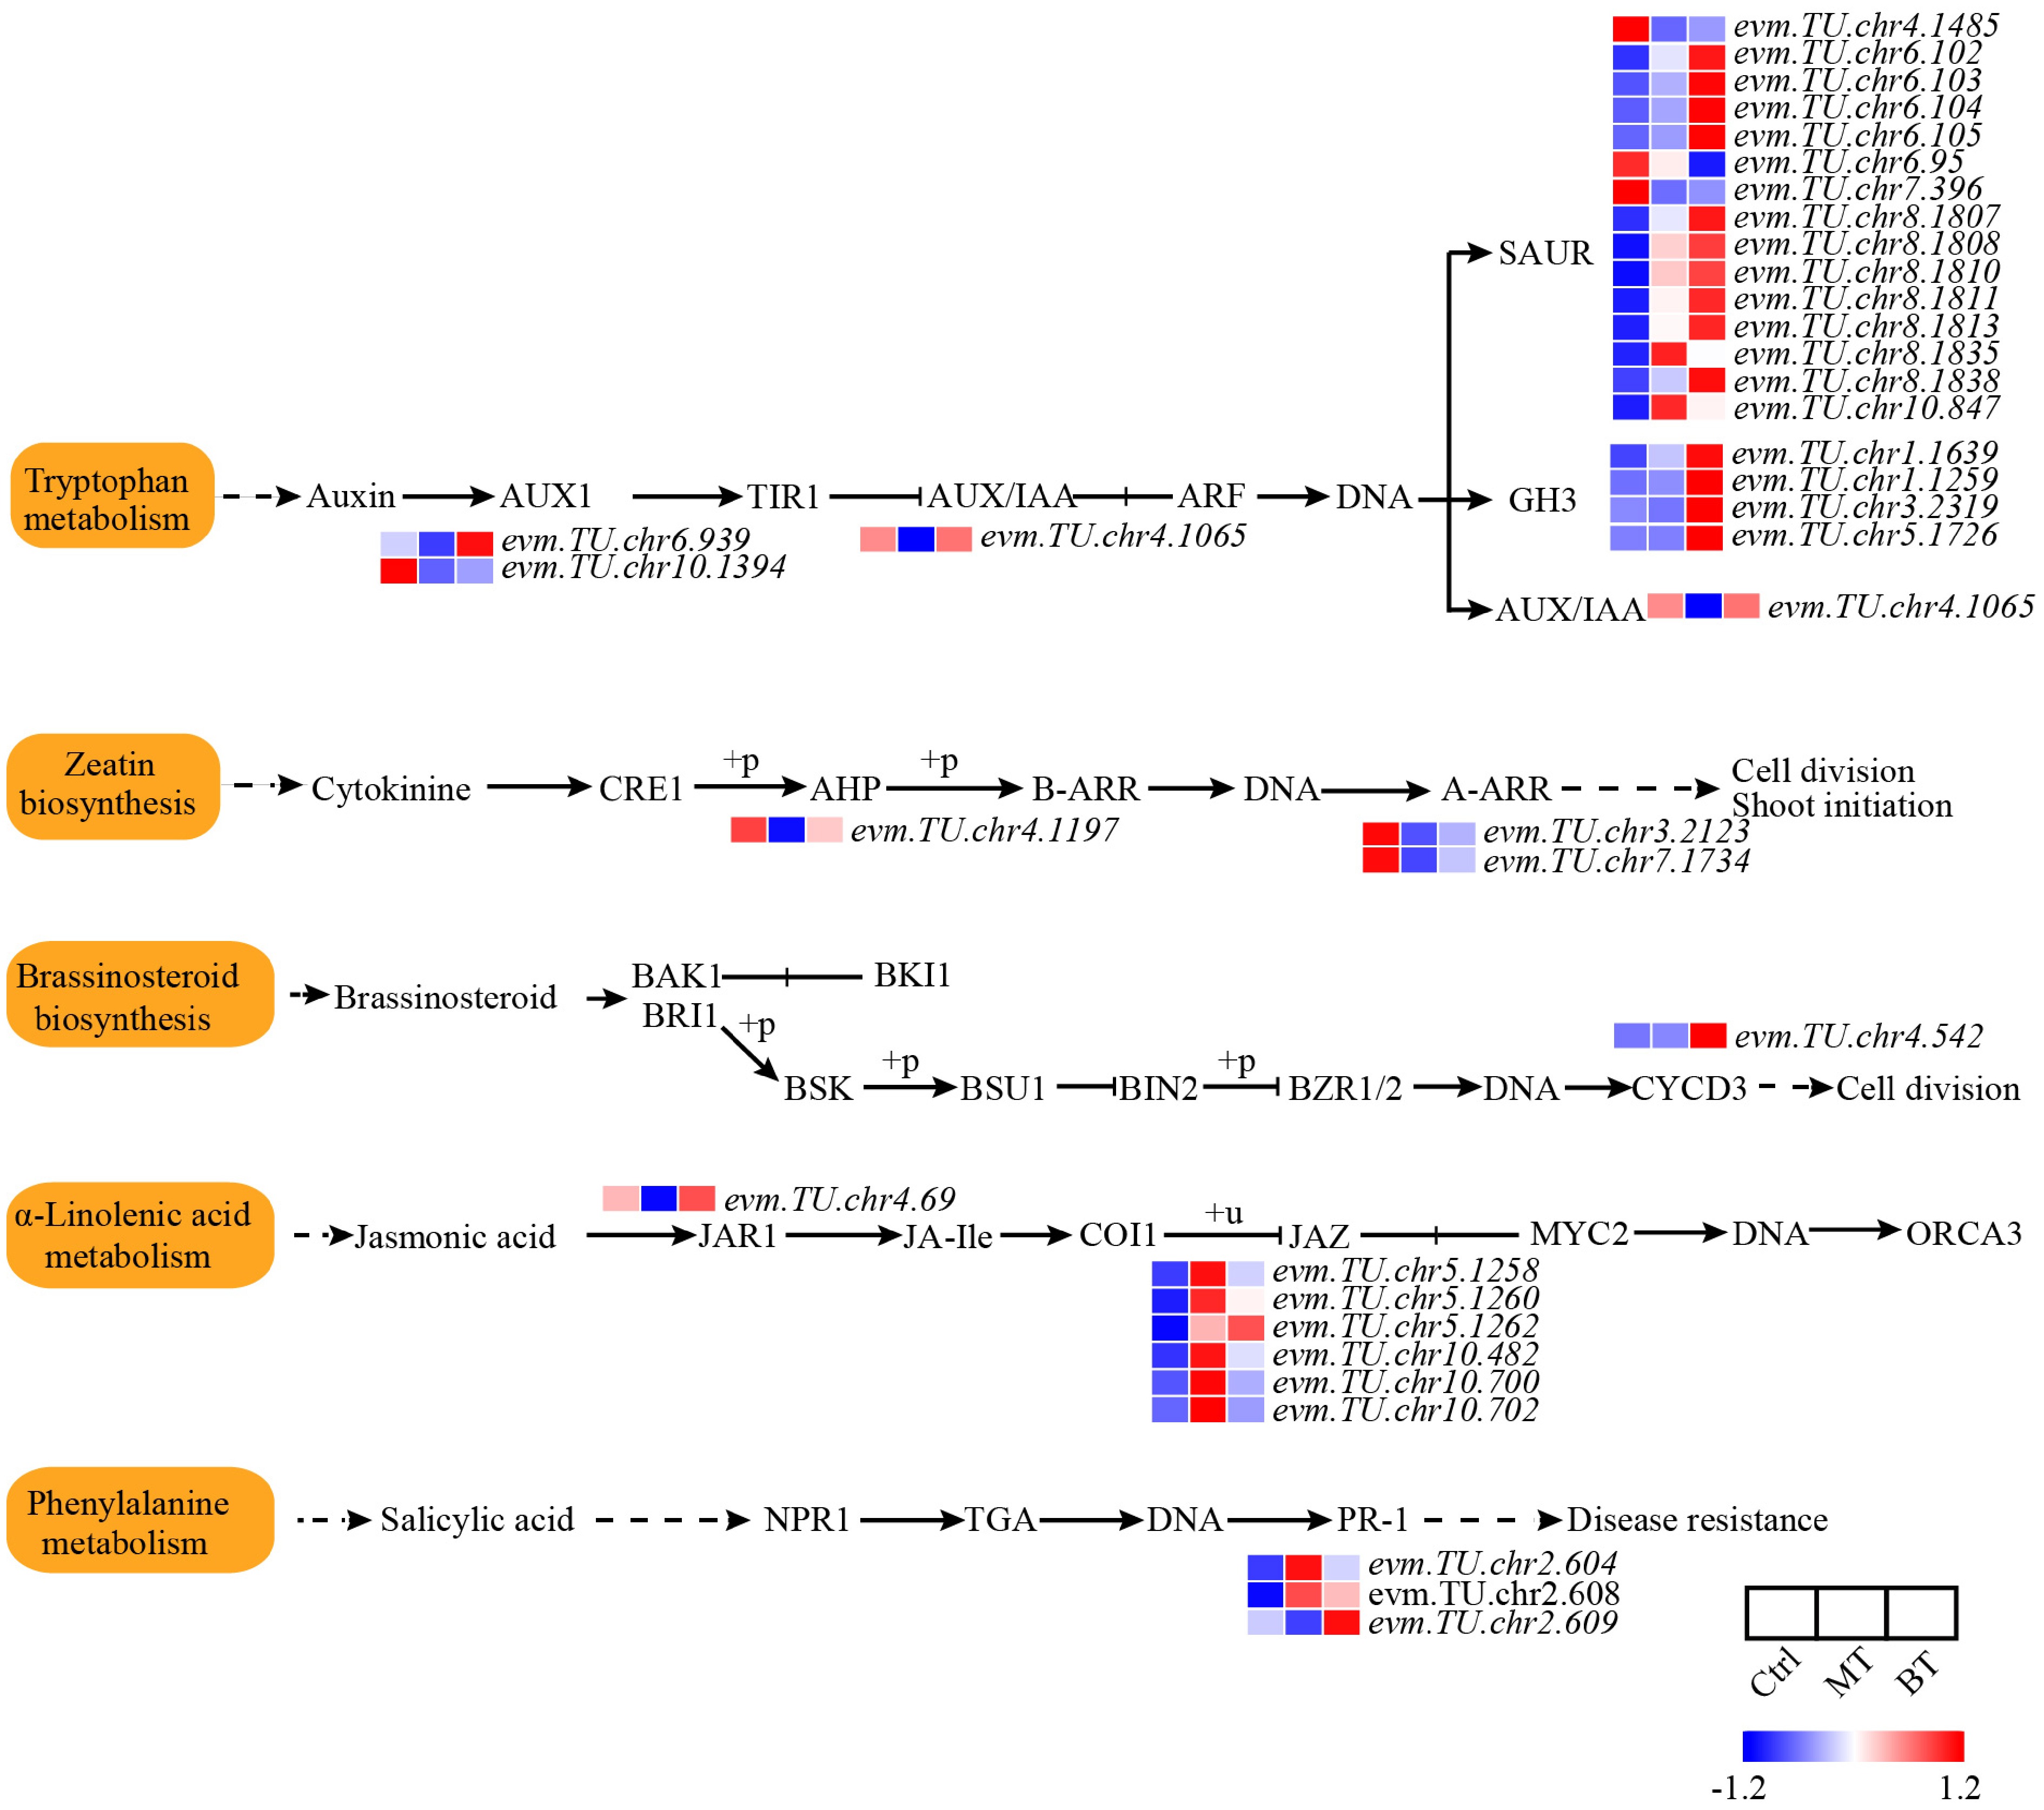
Figure 4.
Expression patterns of genes involved in plant hormone signal transduction pathways in G. biloba under different pruning treatments. GH3 and SAUR genes are involved in auxin homeostasis. ARR and AHP genes are associated with cytokinin signaling and homeostasis. CYCD3 genes participate in brassinosteroid signaling. JAZ family genes are involved in jasmonic acid signaling. PR-1 genes are associated with salicylic acid signaling.
-
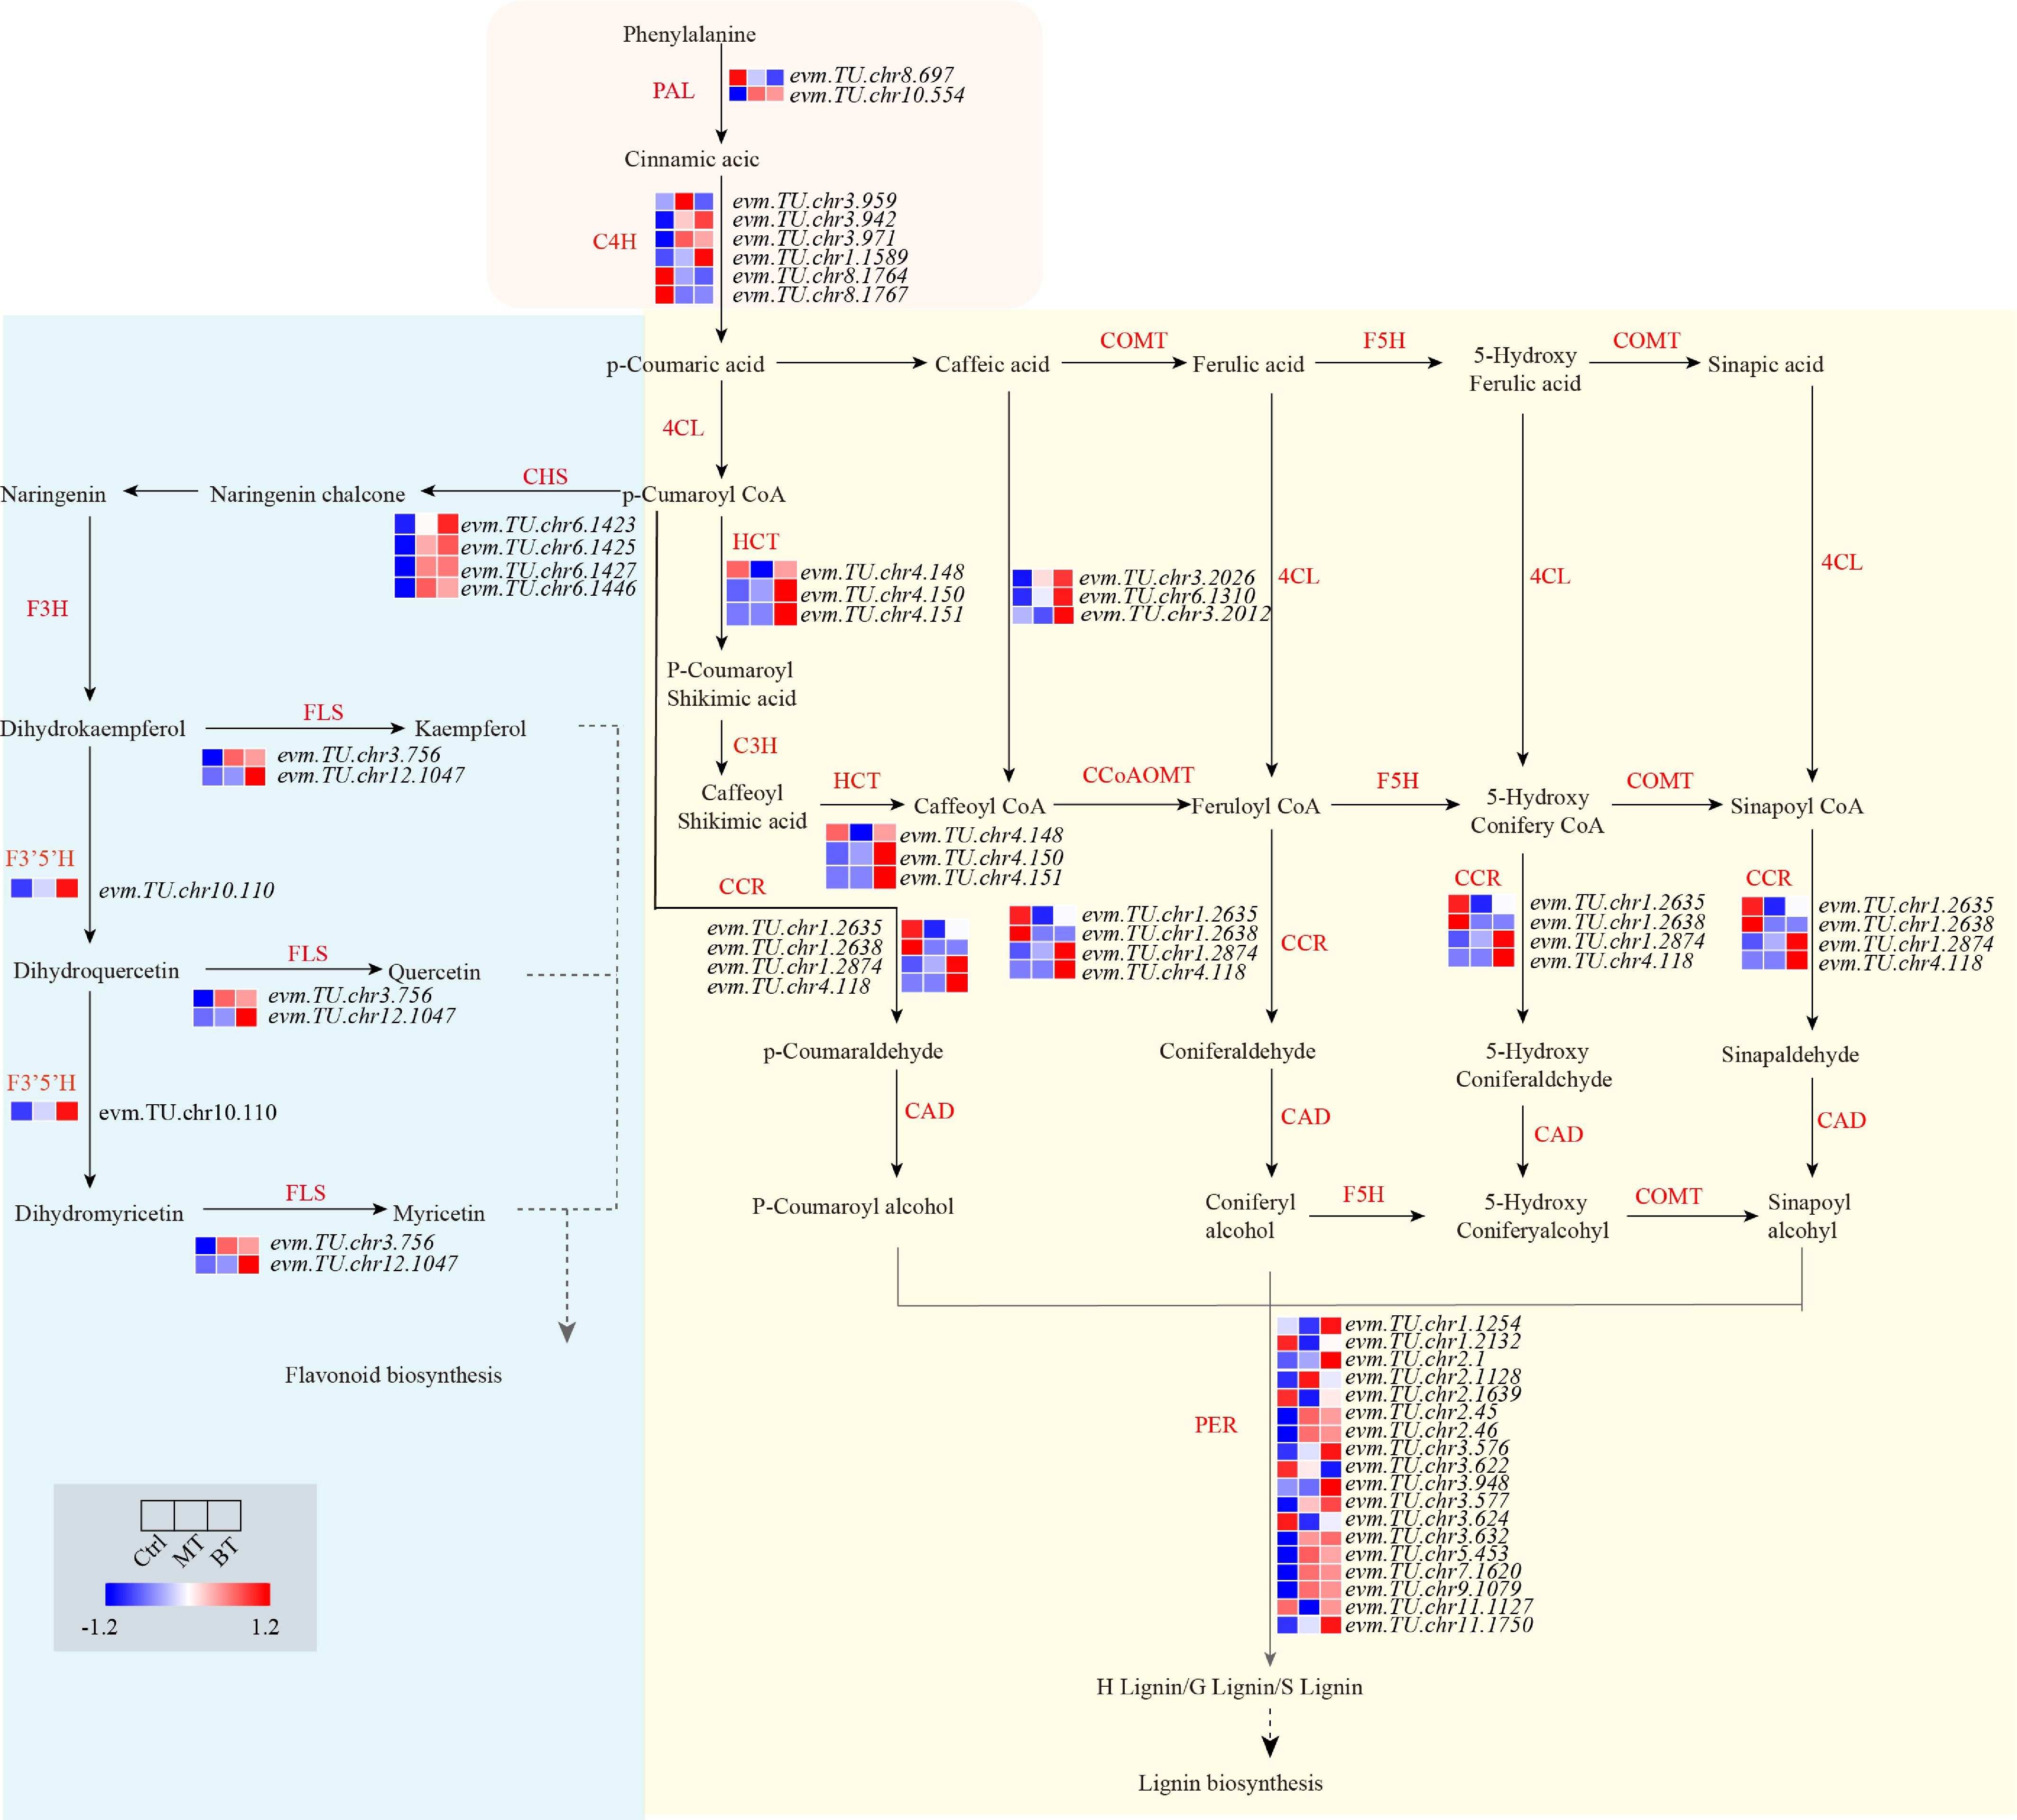
Figure 5.
Expression profiles of genes involved in flavonoid and lignin biosynthesis under different pruning treatments. Multiple PER family members are represented in the H-, G-, and S-lignin biosynthetic pathways.
-
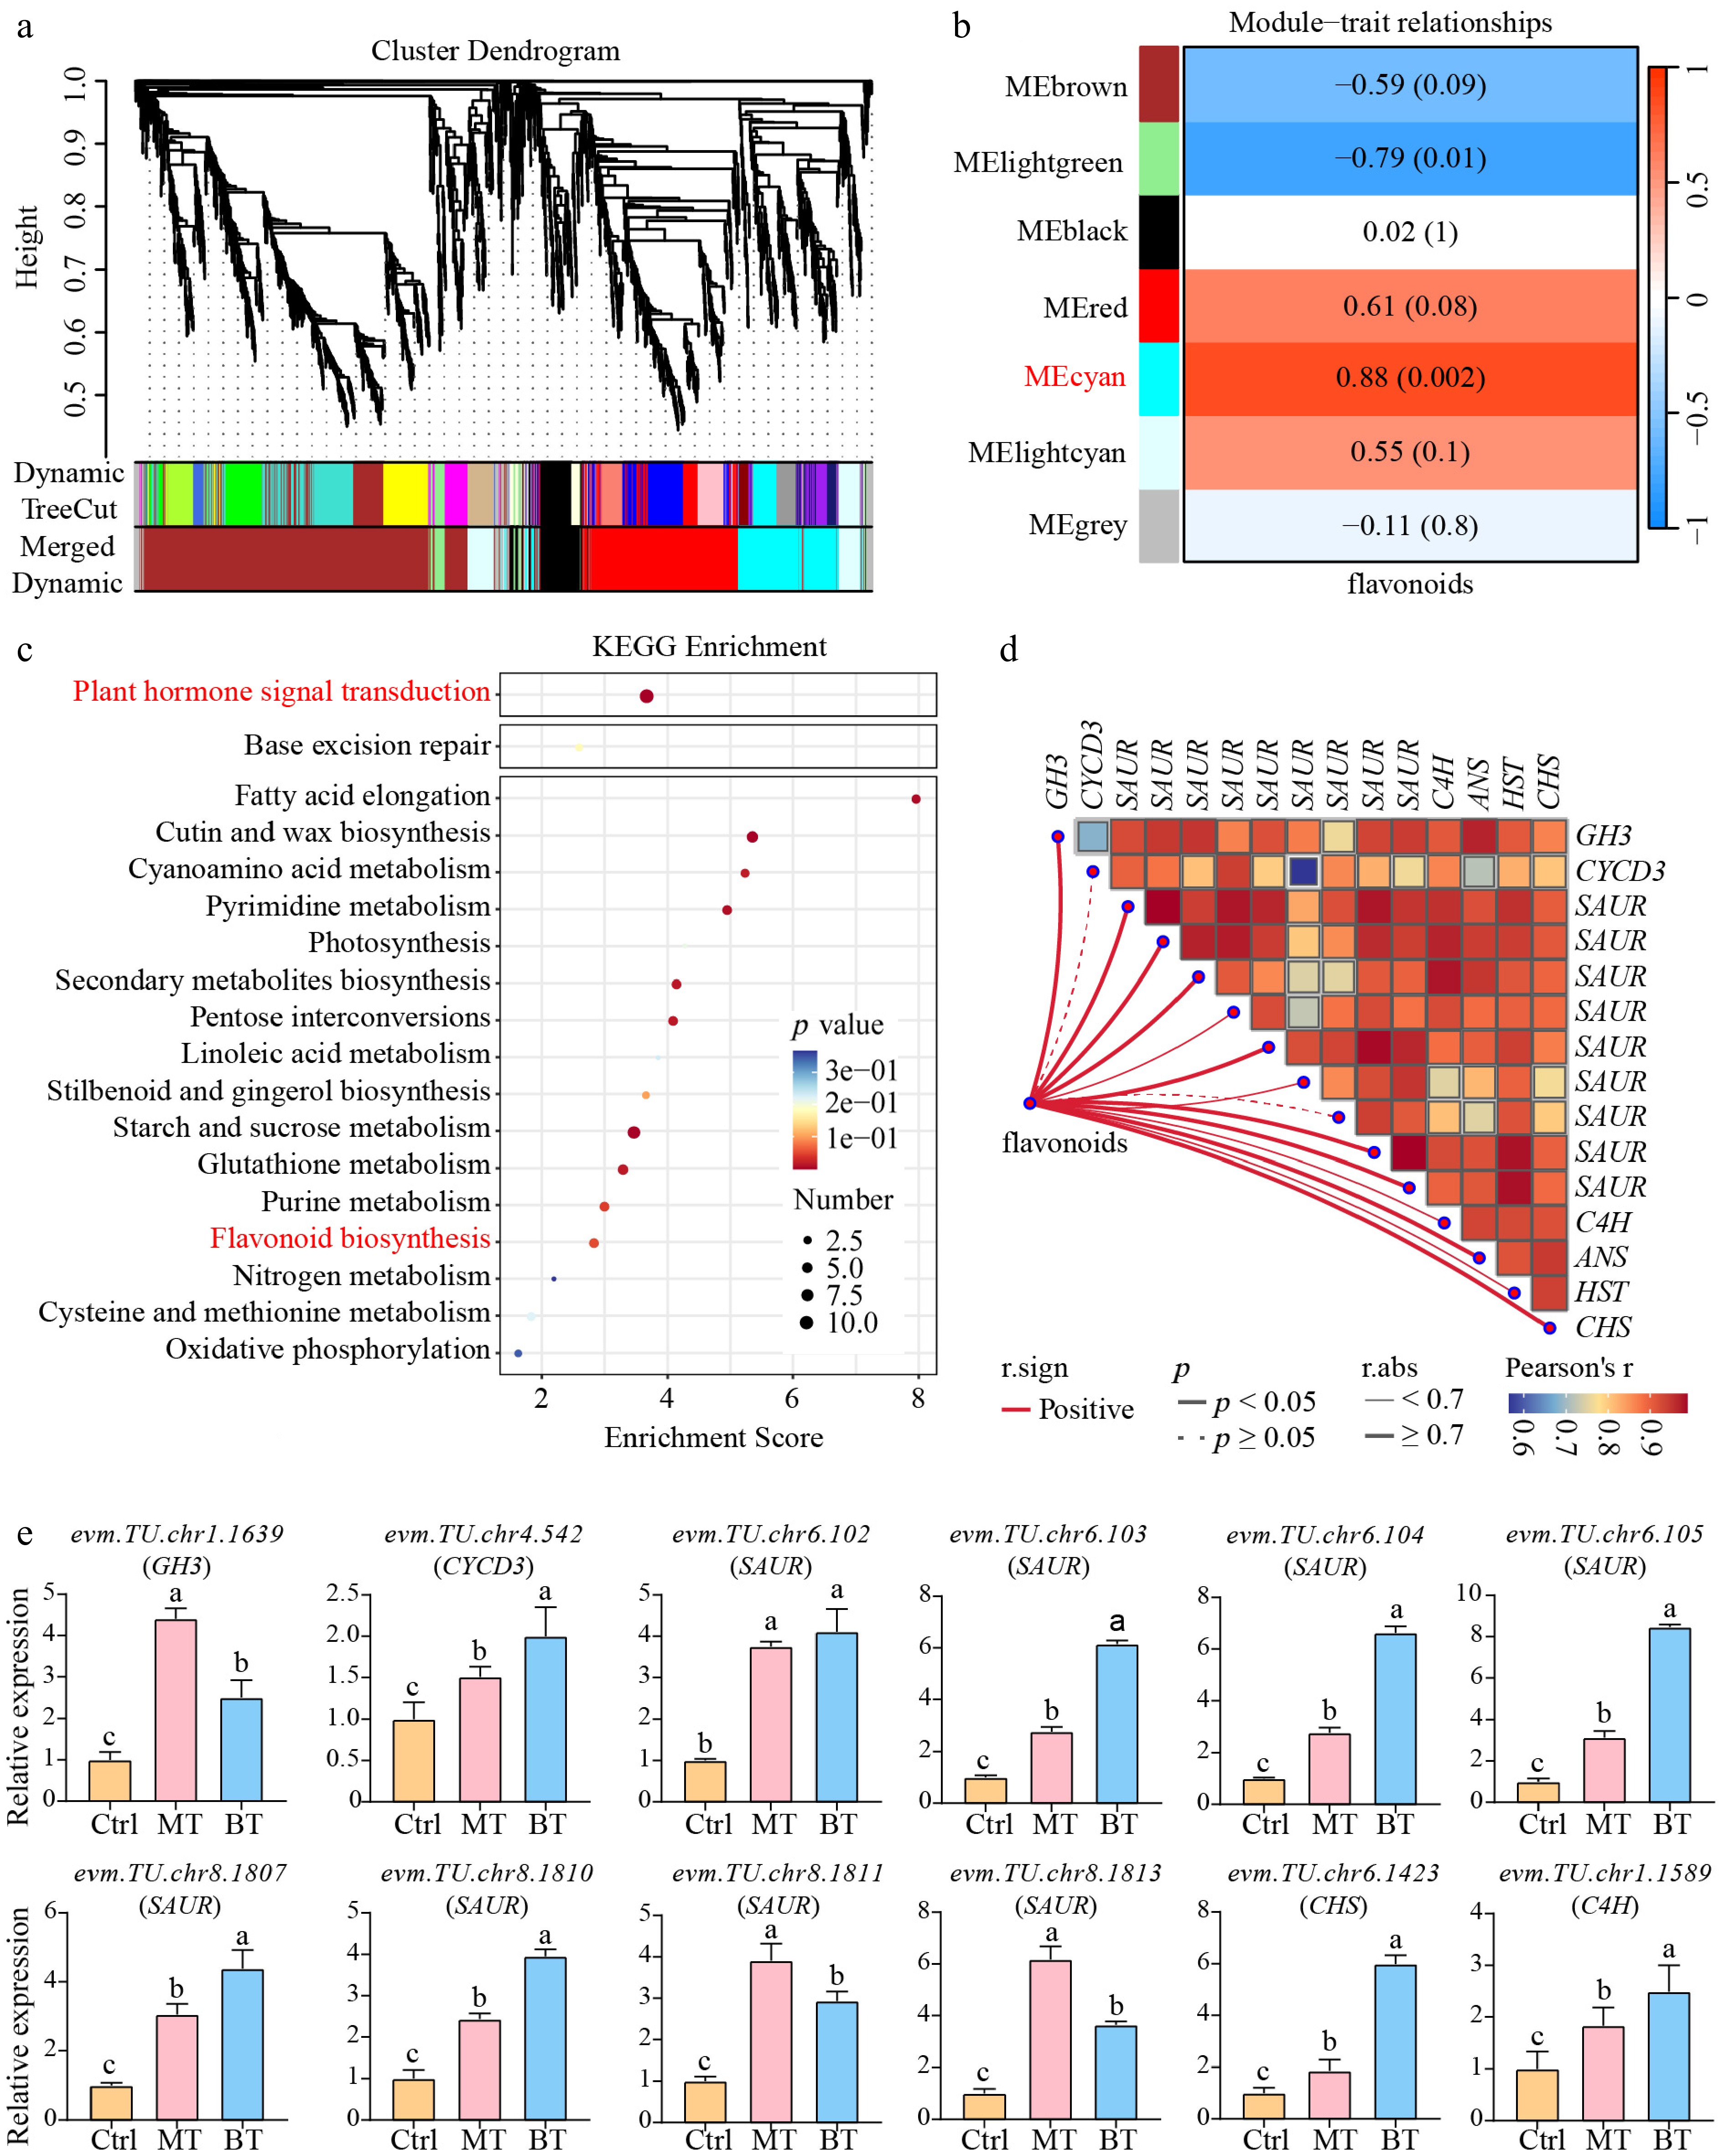
Figure 6.
WGCNA-based identification of the key modules and core genes associated with flavonoid biosynthesis. (a) Clustering dendrogram based on the dissimilarity topological overlap of DEGs between different pruning treatment groups. Seven distinct modules were identified. (b) Relationships between the modules and flavonoid content. (c) KEGG enrichment analysis of genes in the MEcyan module. (d) Screening of the genes significantly correlated with flavonoid content in the MEcyan module by correlation analysis. SAURs are auxin early-responsive genes rather than transcription factors. (e) Expression levels of the key genes related to flavonoid biosynthesis in the Ctrl, MT, and BT groups detected by qRT-PCR. Data are presented as the means of at least three biological replicates (±SD). Letters indicate significant differences based on one-way ANOVA (p < 0.05).
Figures
(6)
Tables
(0)