-
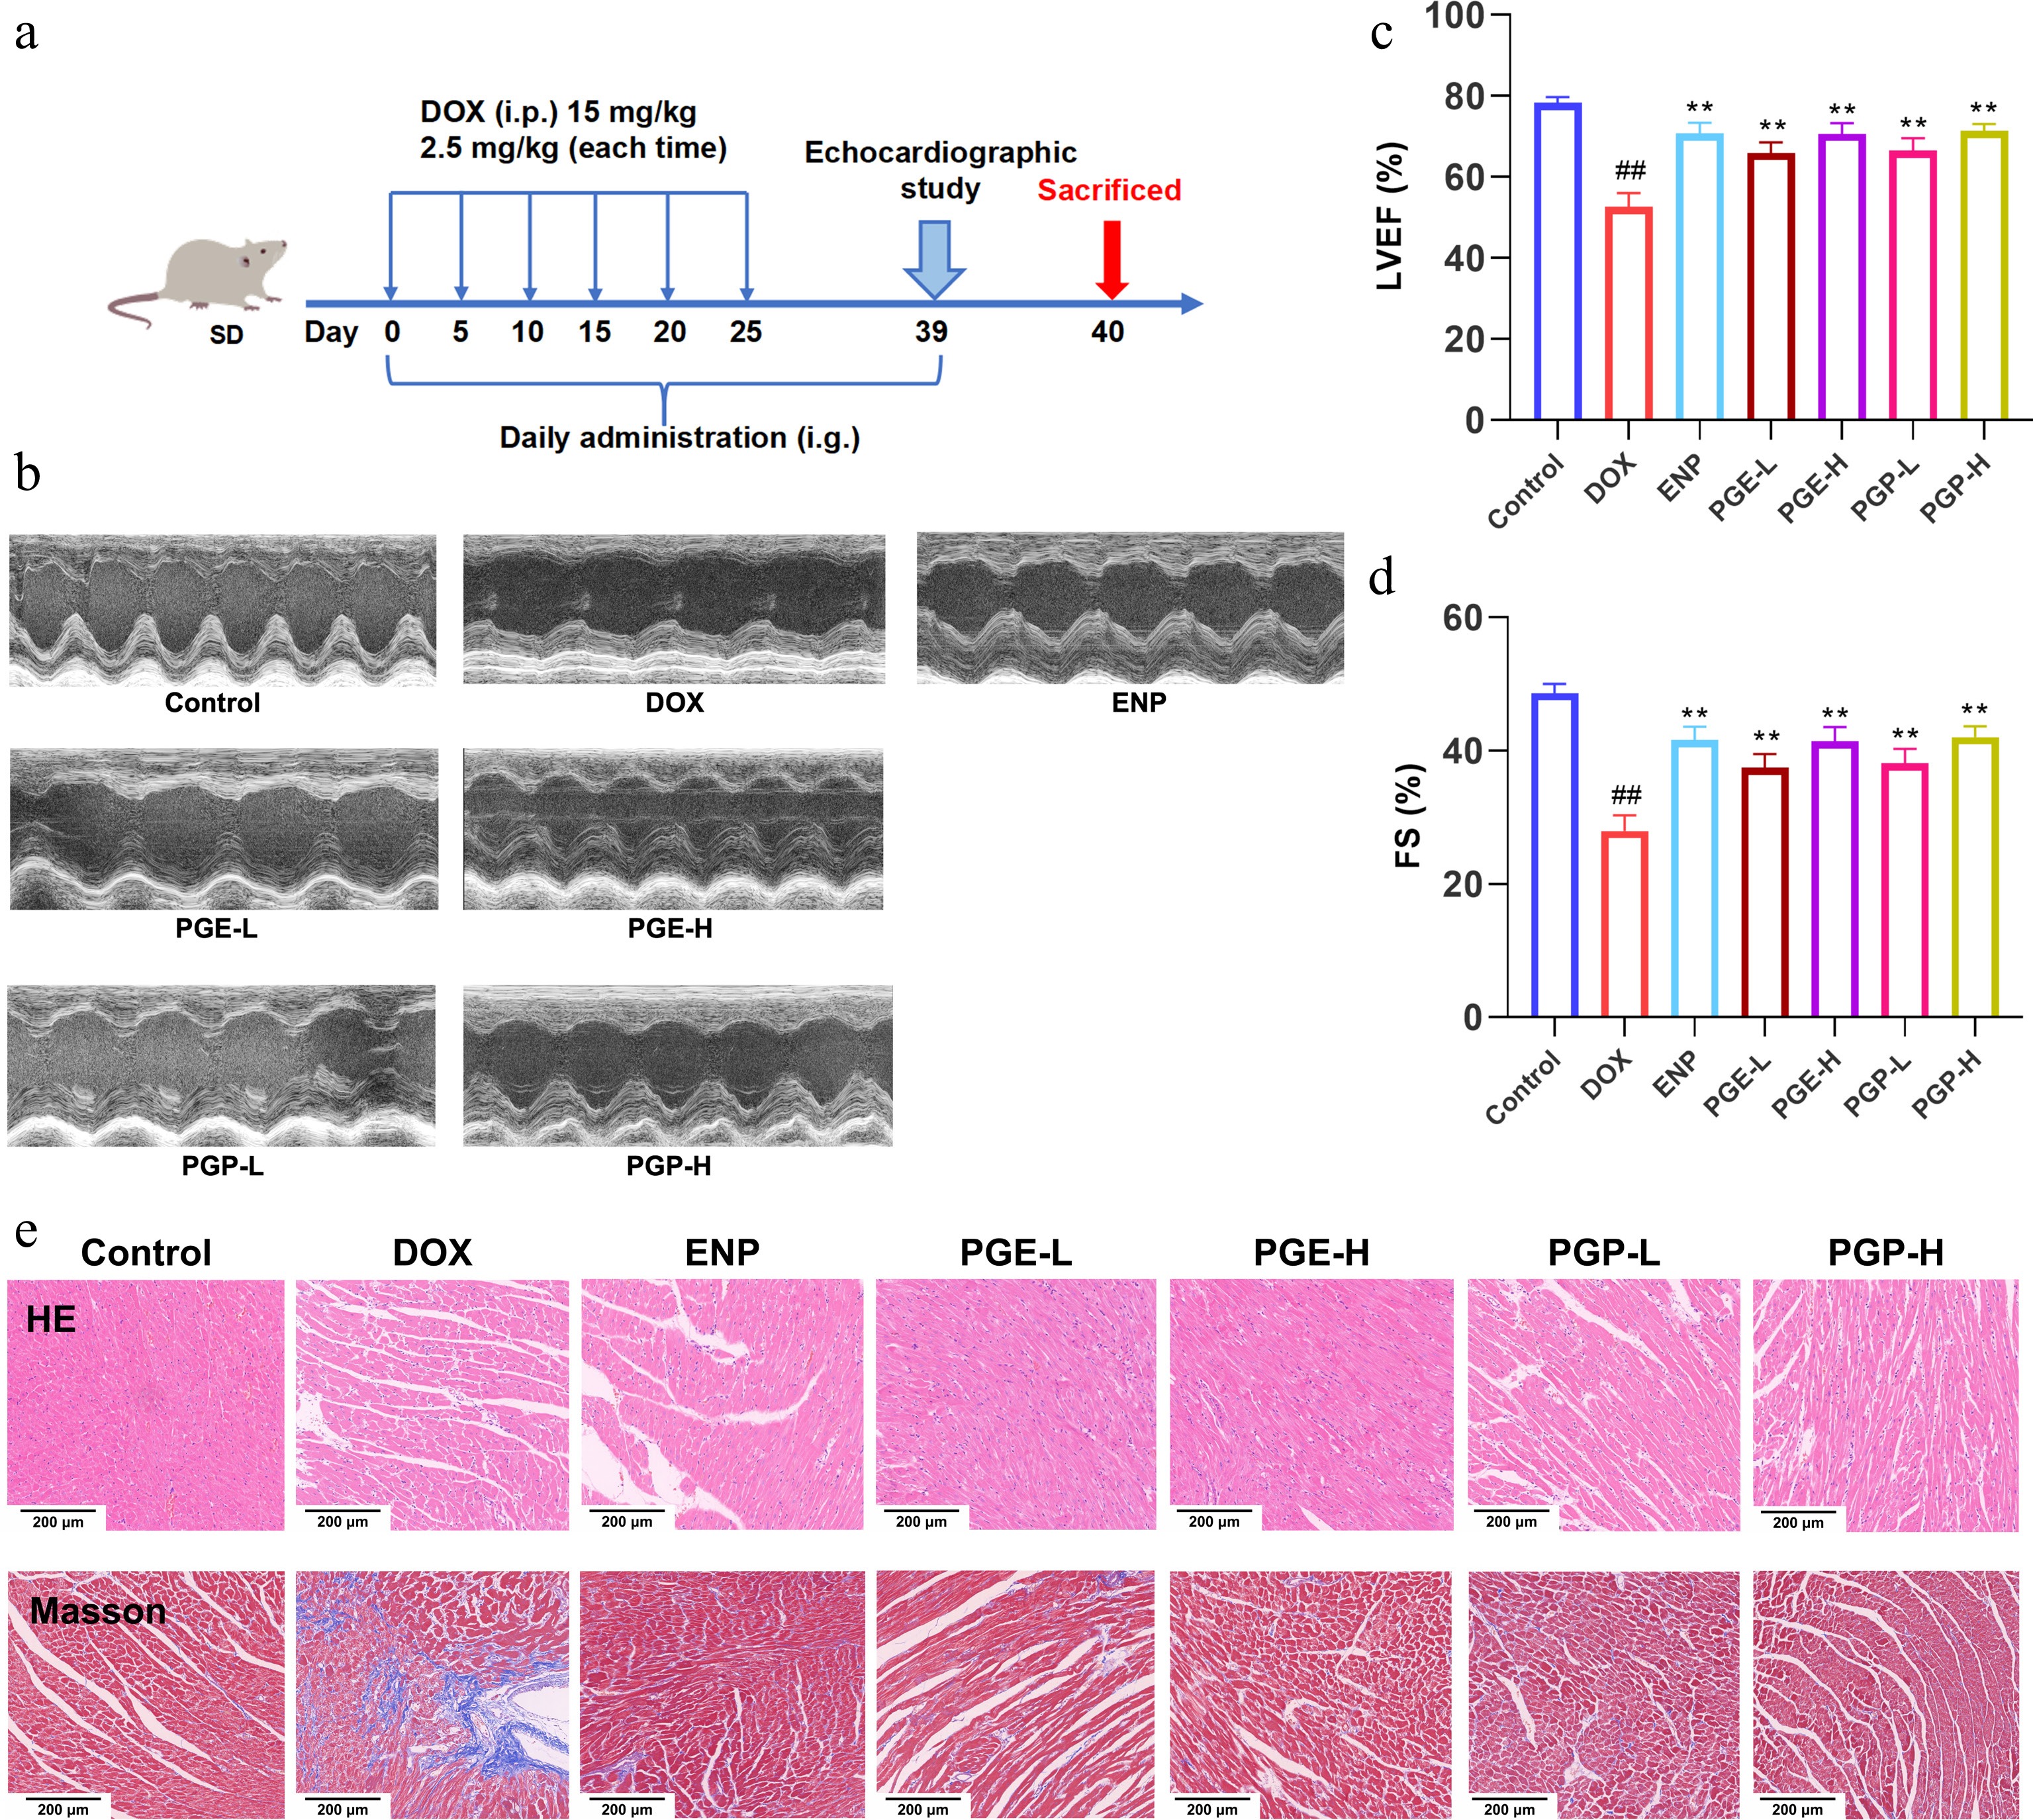
Figure 1.
Preliminary evaluation of the cardioprotective effects of PGE and PGP on DOX-induced CHF rats. (a) Experimental procedure; (b) M-mode echocardiogram of the left ventricle; (c) left ventricular ejection fraction (LVEF); (d) fractional shortening (FS) of the left ventricle; (e) H&E staining results (scale bar = 200 μm) and Masson's trichrome staining results (scale bar = 200 μm). Here, n = 6; # p < 0.05,## p < 0.01 vs. control group; * p < 0.05, ** p < 0.01 vs. DOX group.
-
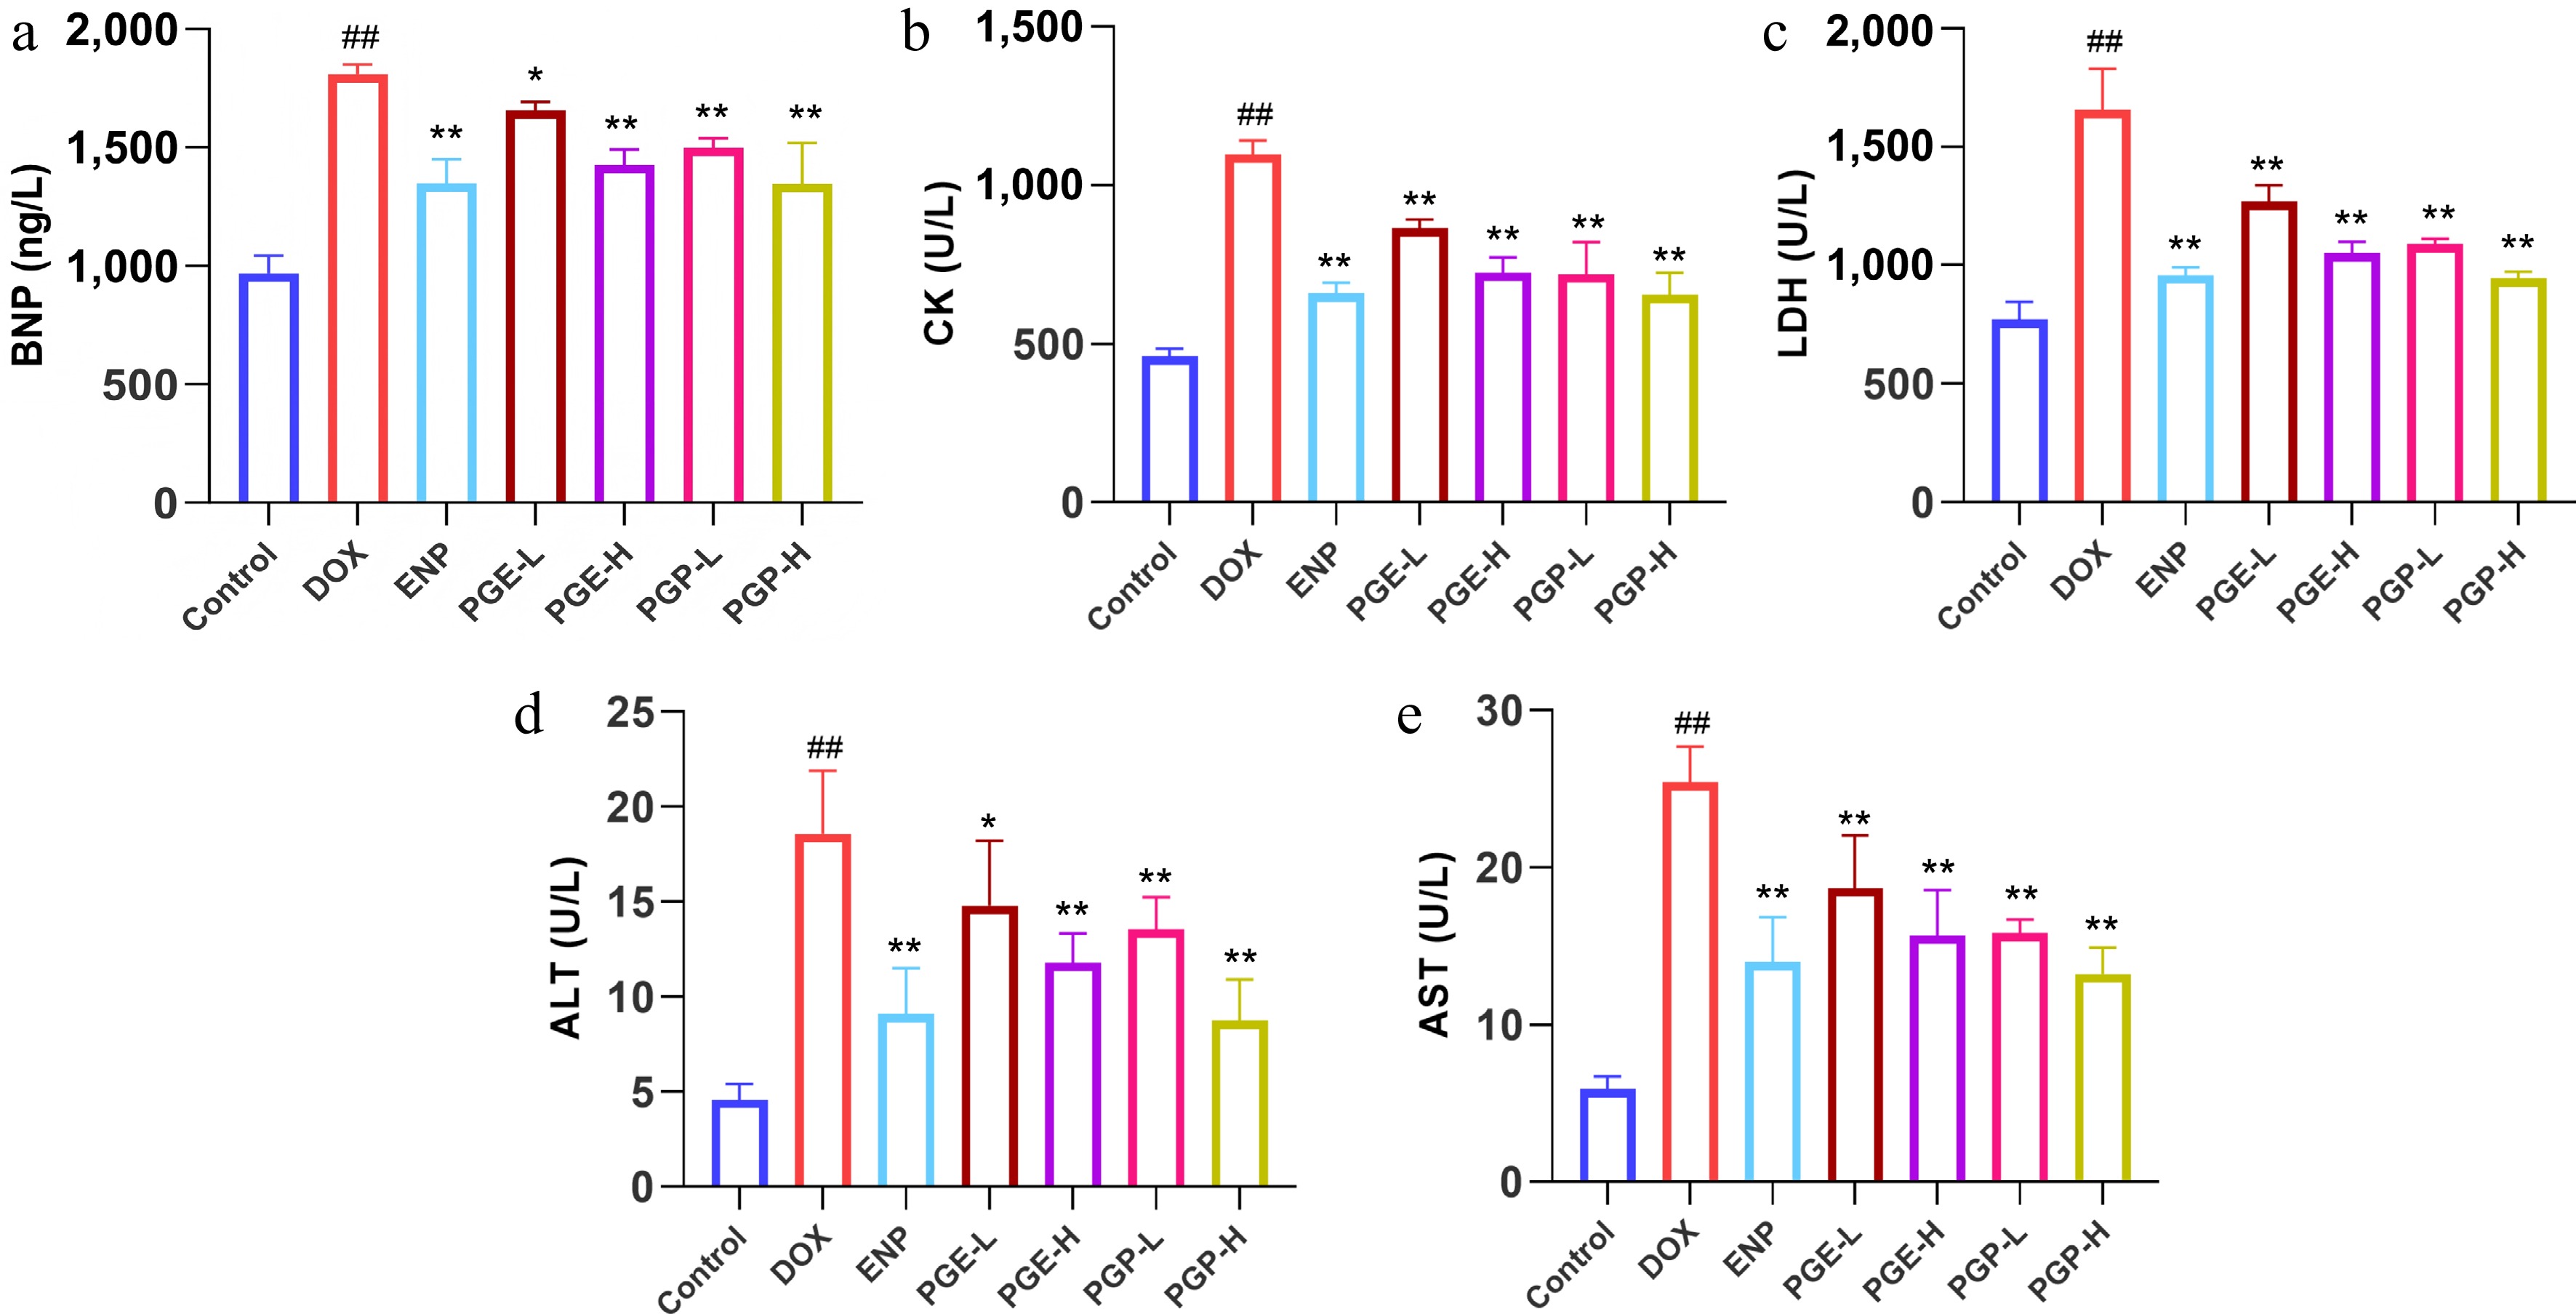
Figure 2.
Effects of PGE and PGP on myocardial and hepatic injury biomarkers in the serum of rats with DOX-induced CHF. (a) Brain natriuretic peptide (BNP); (b) creatine kinase (CK); (c) lactate dehydrogenase (LDH); (d) alanine aminotransferase (ALT); (e) aspartate aminotransferase (AST). Here, n = 6; # p < 0.05, ## p < 0.01 vs. control group; * p < 0.05, ** p < 0.01 vs. DOX group.
-
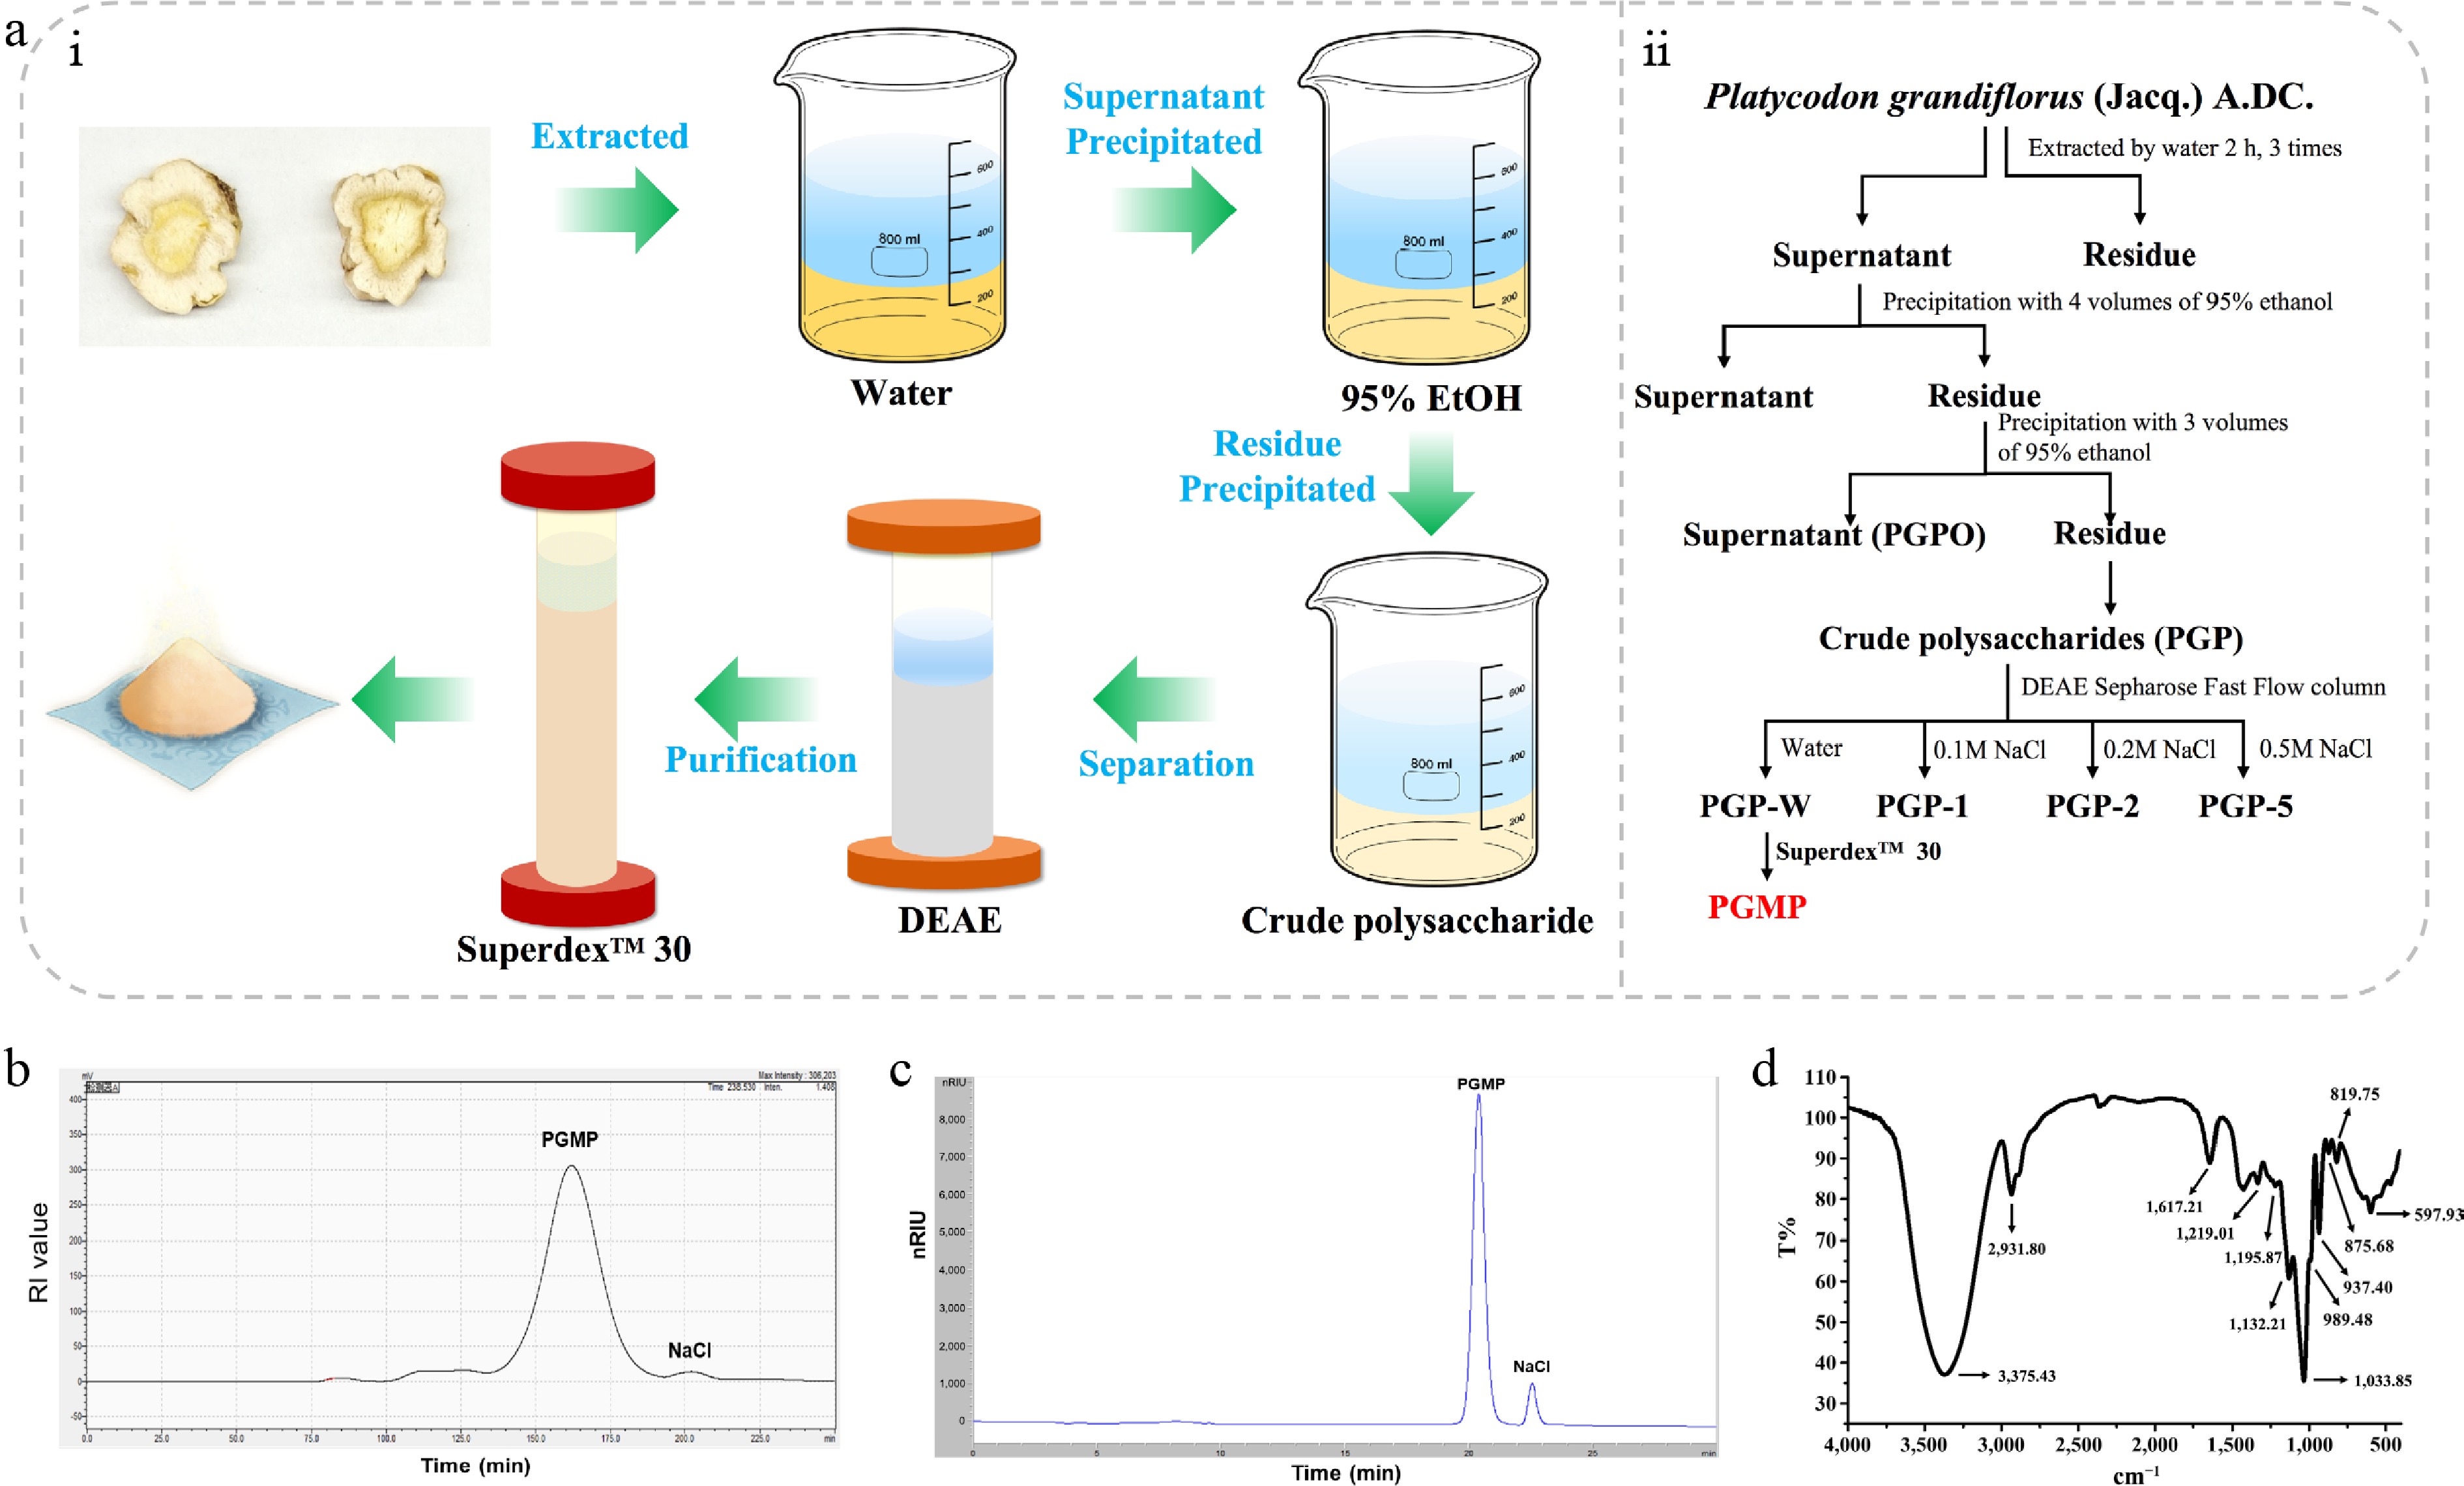
Figure 3.
Isolation, purification and structural characterization of PGMP. (a) Flow chart for the purification of PGMP; (b) Purification chromatogram of PGMP from PG on Superdex™ 30 column; (c) High-performance liquid chromatogram of PGMP (refractive index detector, super hydrogel linear chromatographic column KS-804 and KS-802 connected in series). (d) FT-IR spectrum of PGMP.
-
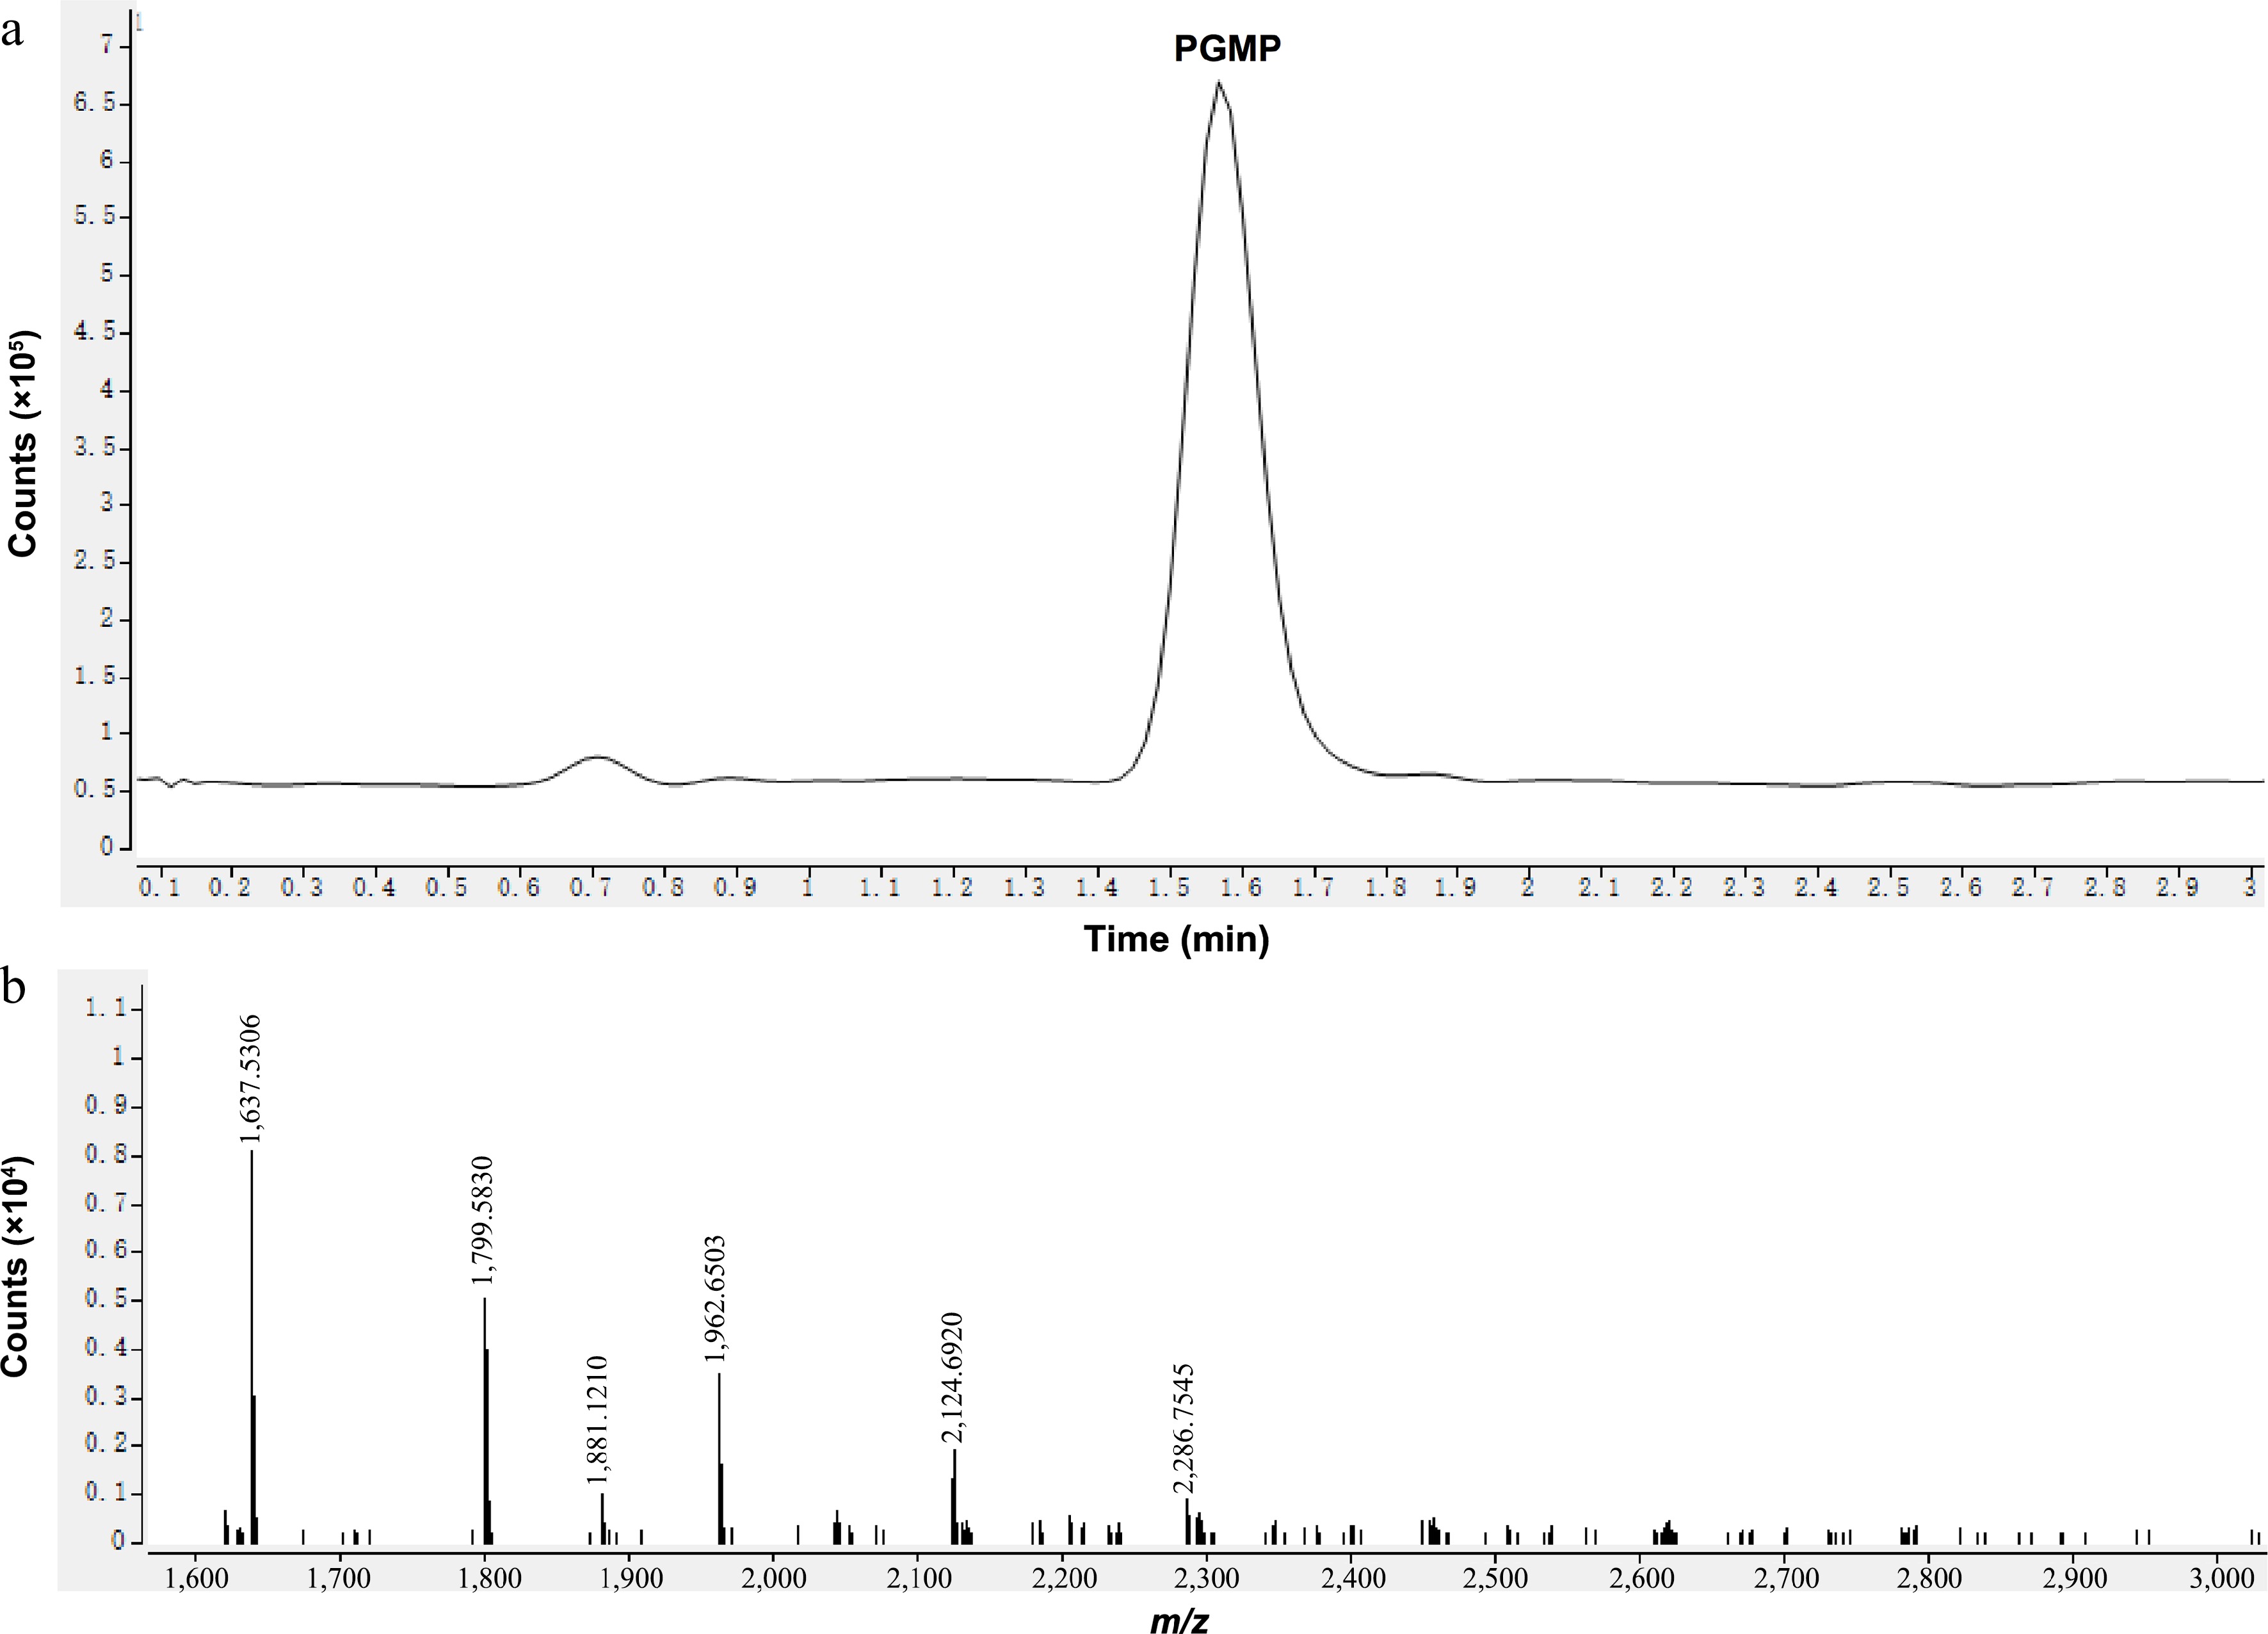
Figure 4.
Mass spectrometry analysis of PGMP. (a) Total ion chromatogram of PGMP; (b) Secondary fragment peaks of PGMP under negative ion modes.
-
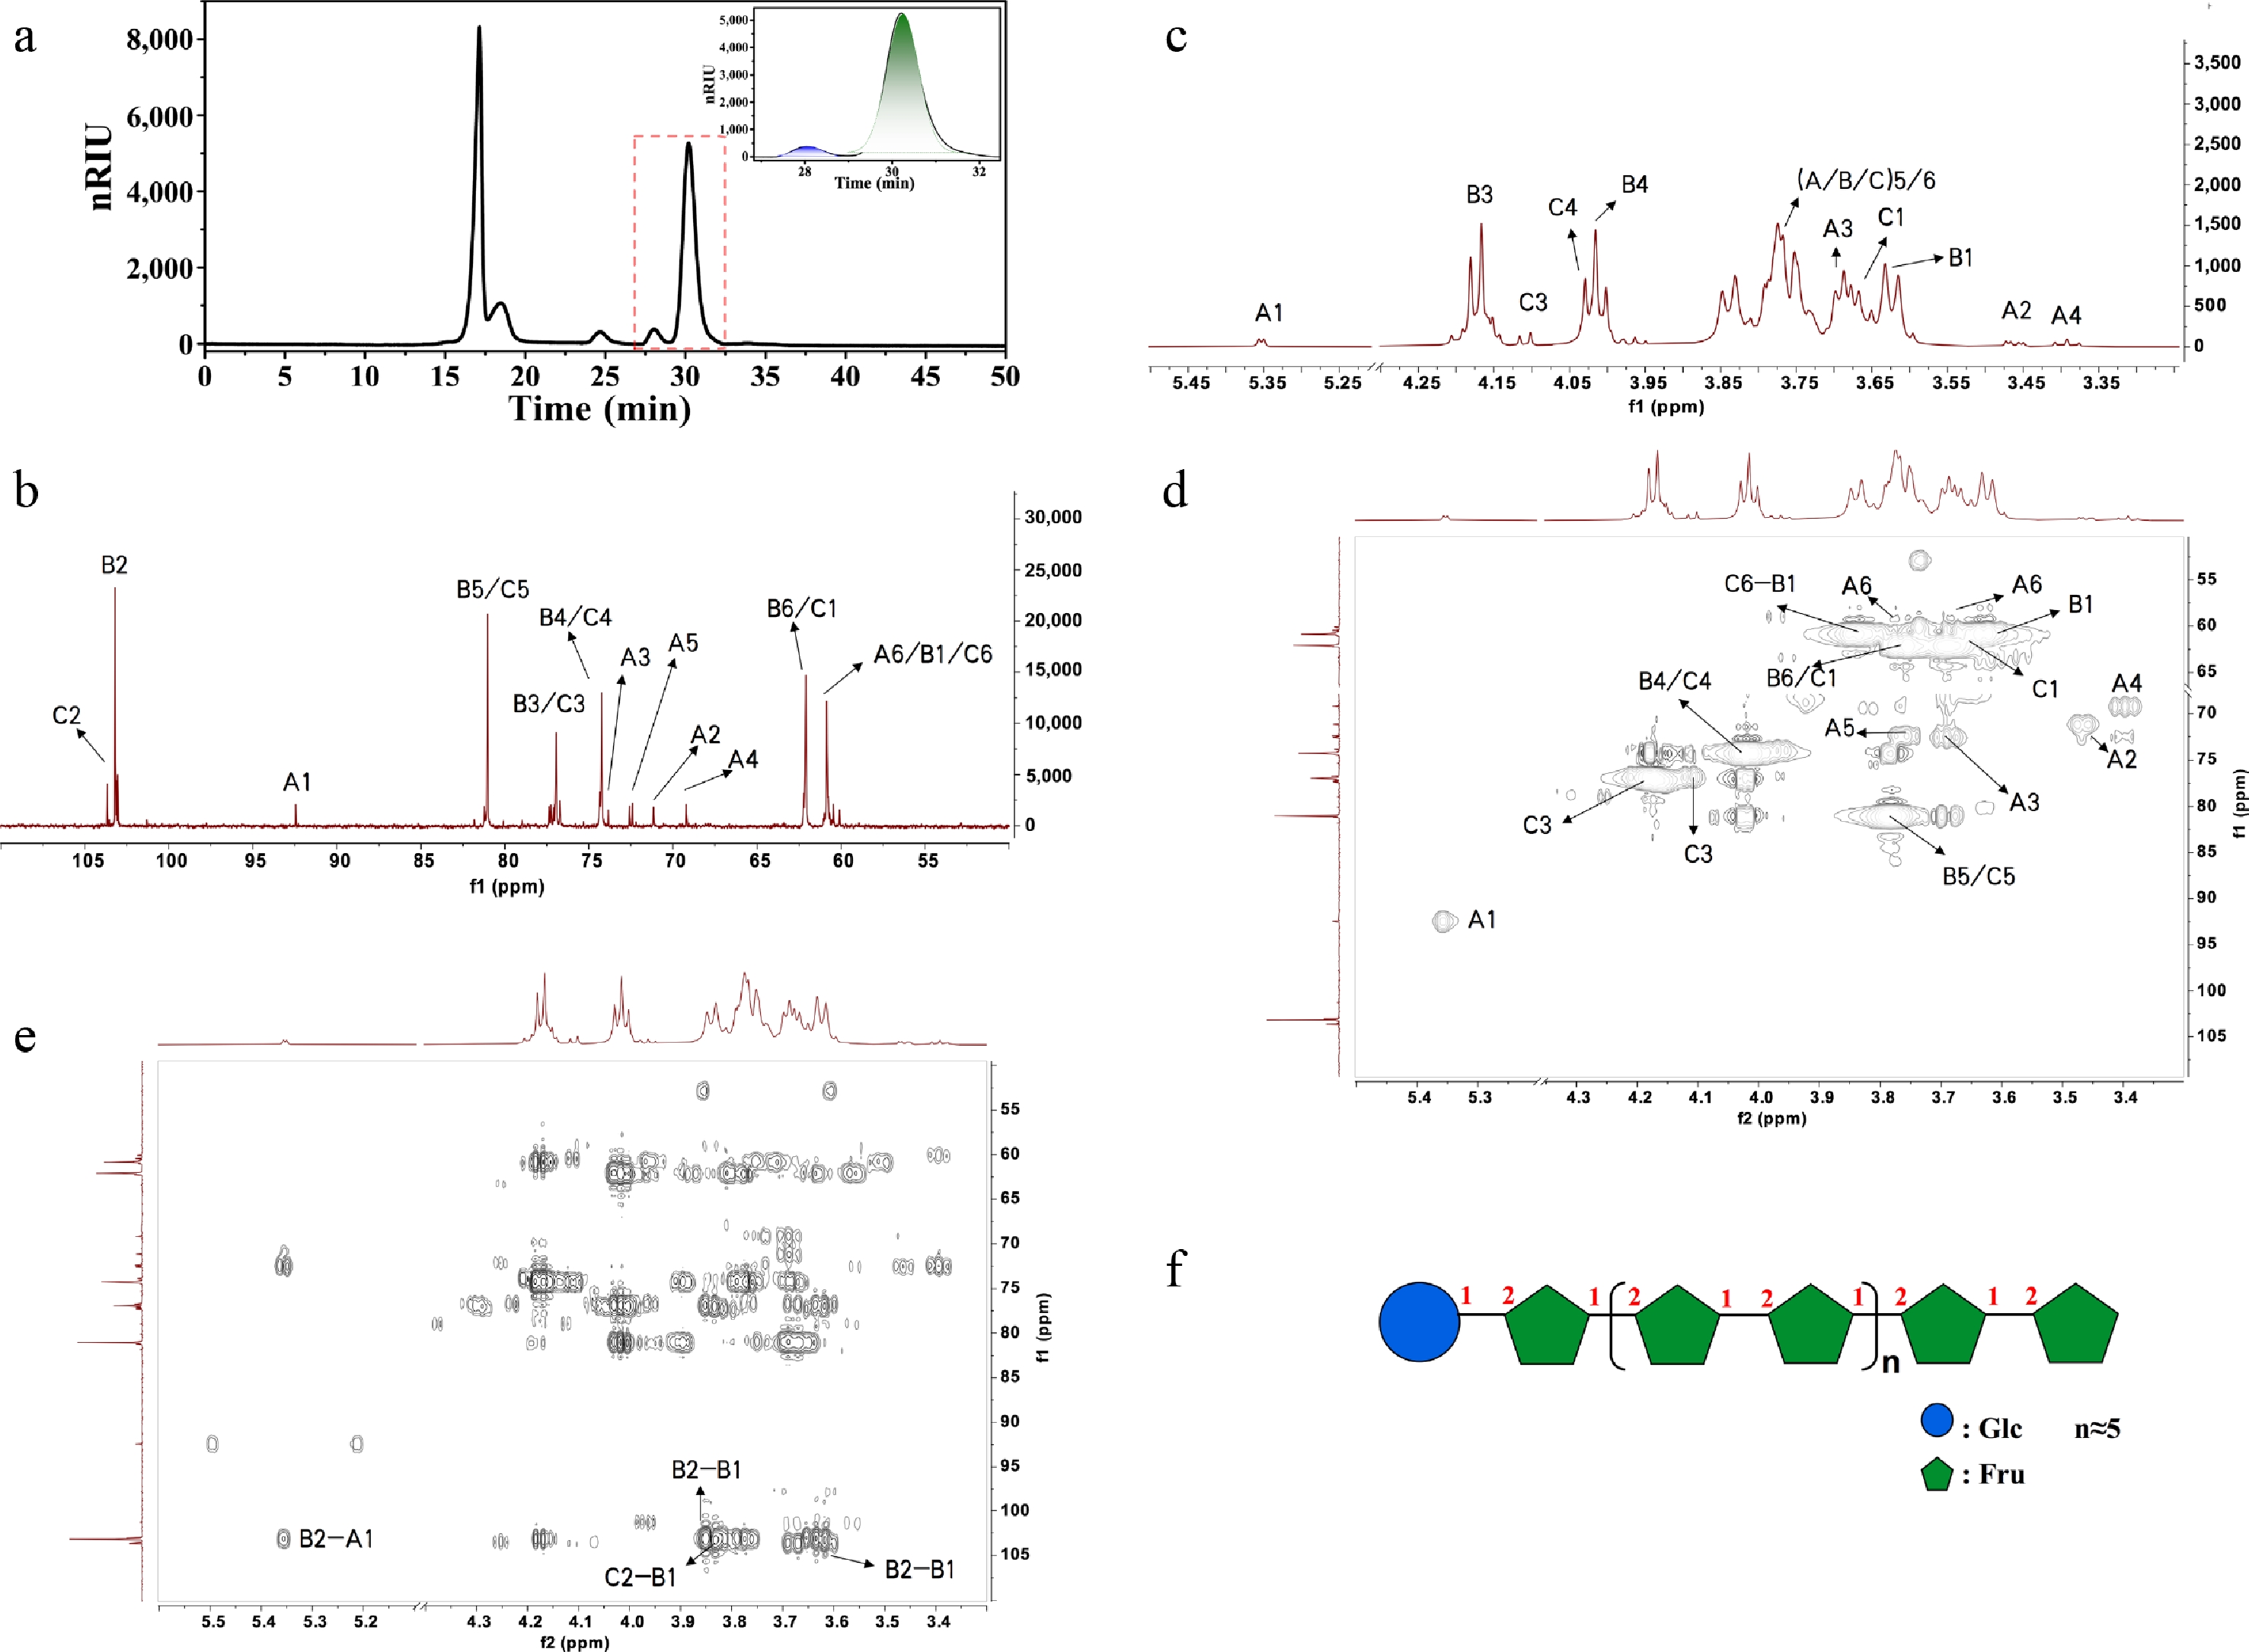
Figure 5.
Monosaccharide composition and NMRl analysis results of PGMP. (a) HPLC-RID chromatogram of the monosaccharide composition analysis of PGMP; (b) 1H-NMR spectrum of PGMP; (c) 13C-NMR spectrum of PGMP; (d) HSQC-TOCSY spectrum of PGMP; (e) HMBC spectrum of PGMP; (f) Proposed chemical structure of PGMP. (A, α-Glcp; B, 2,1-β-Fruf; C, 2-β-Fruf).
-
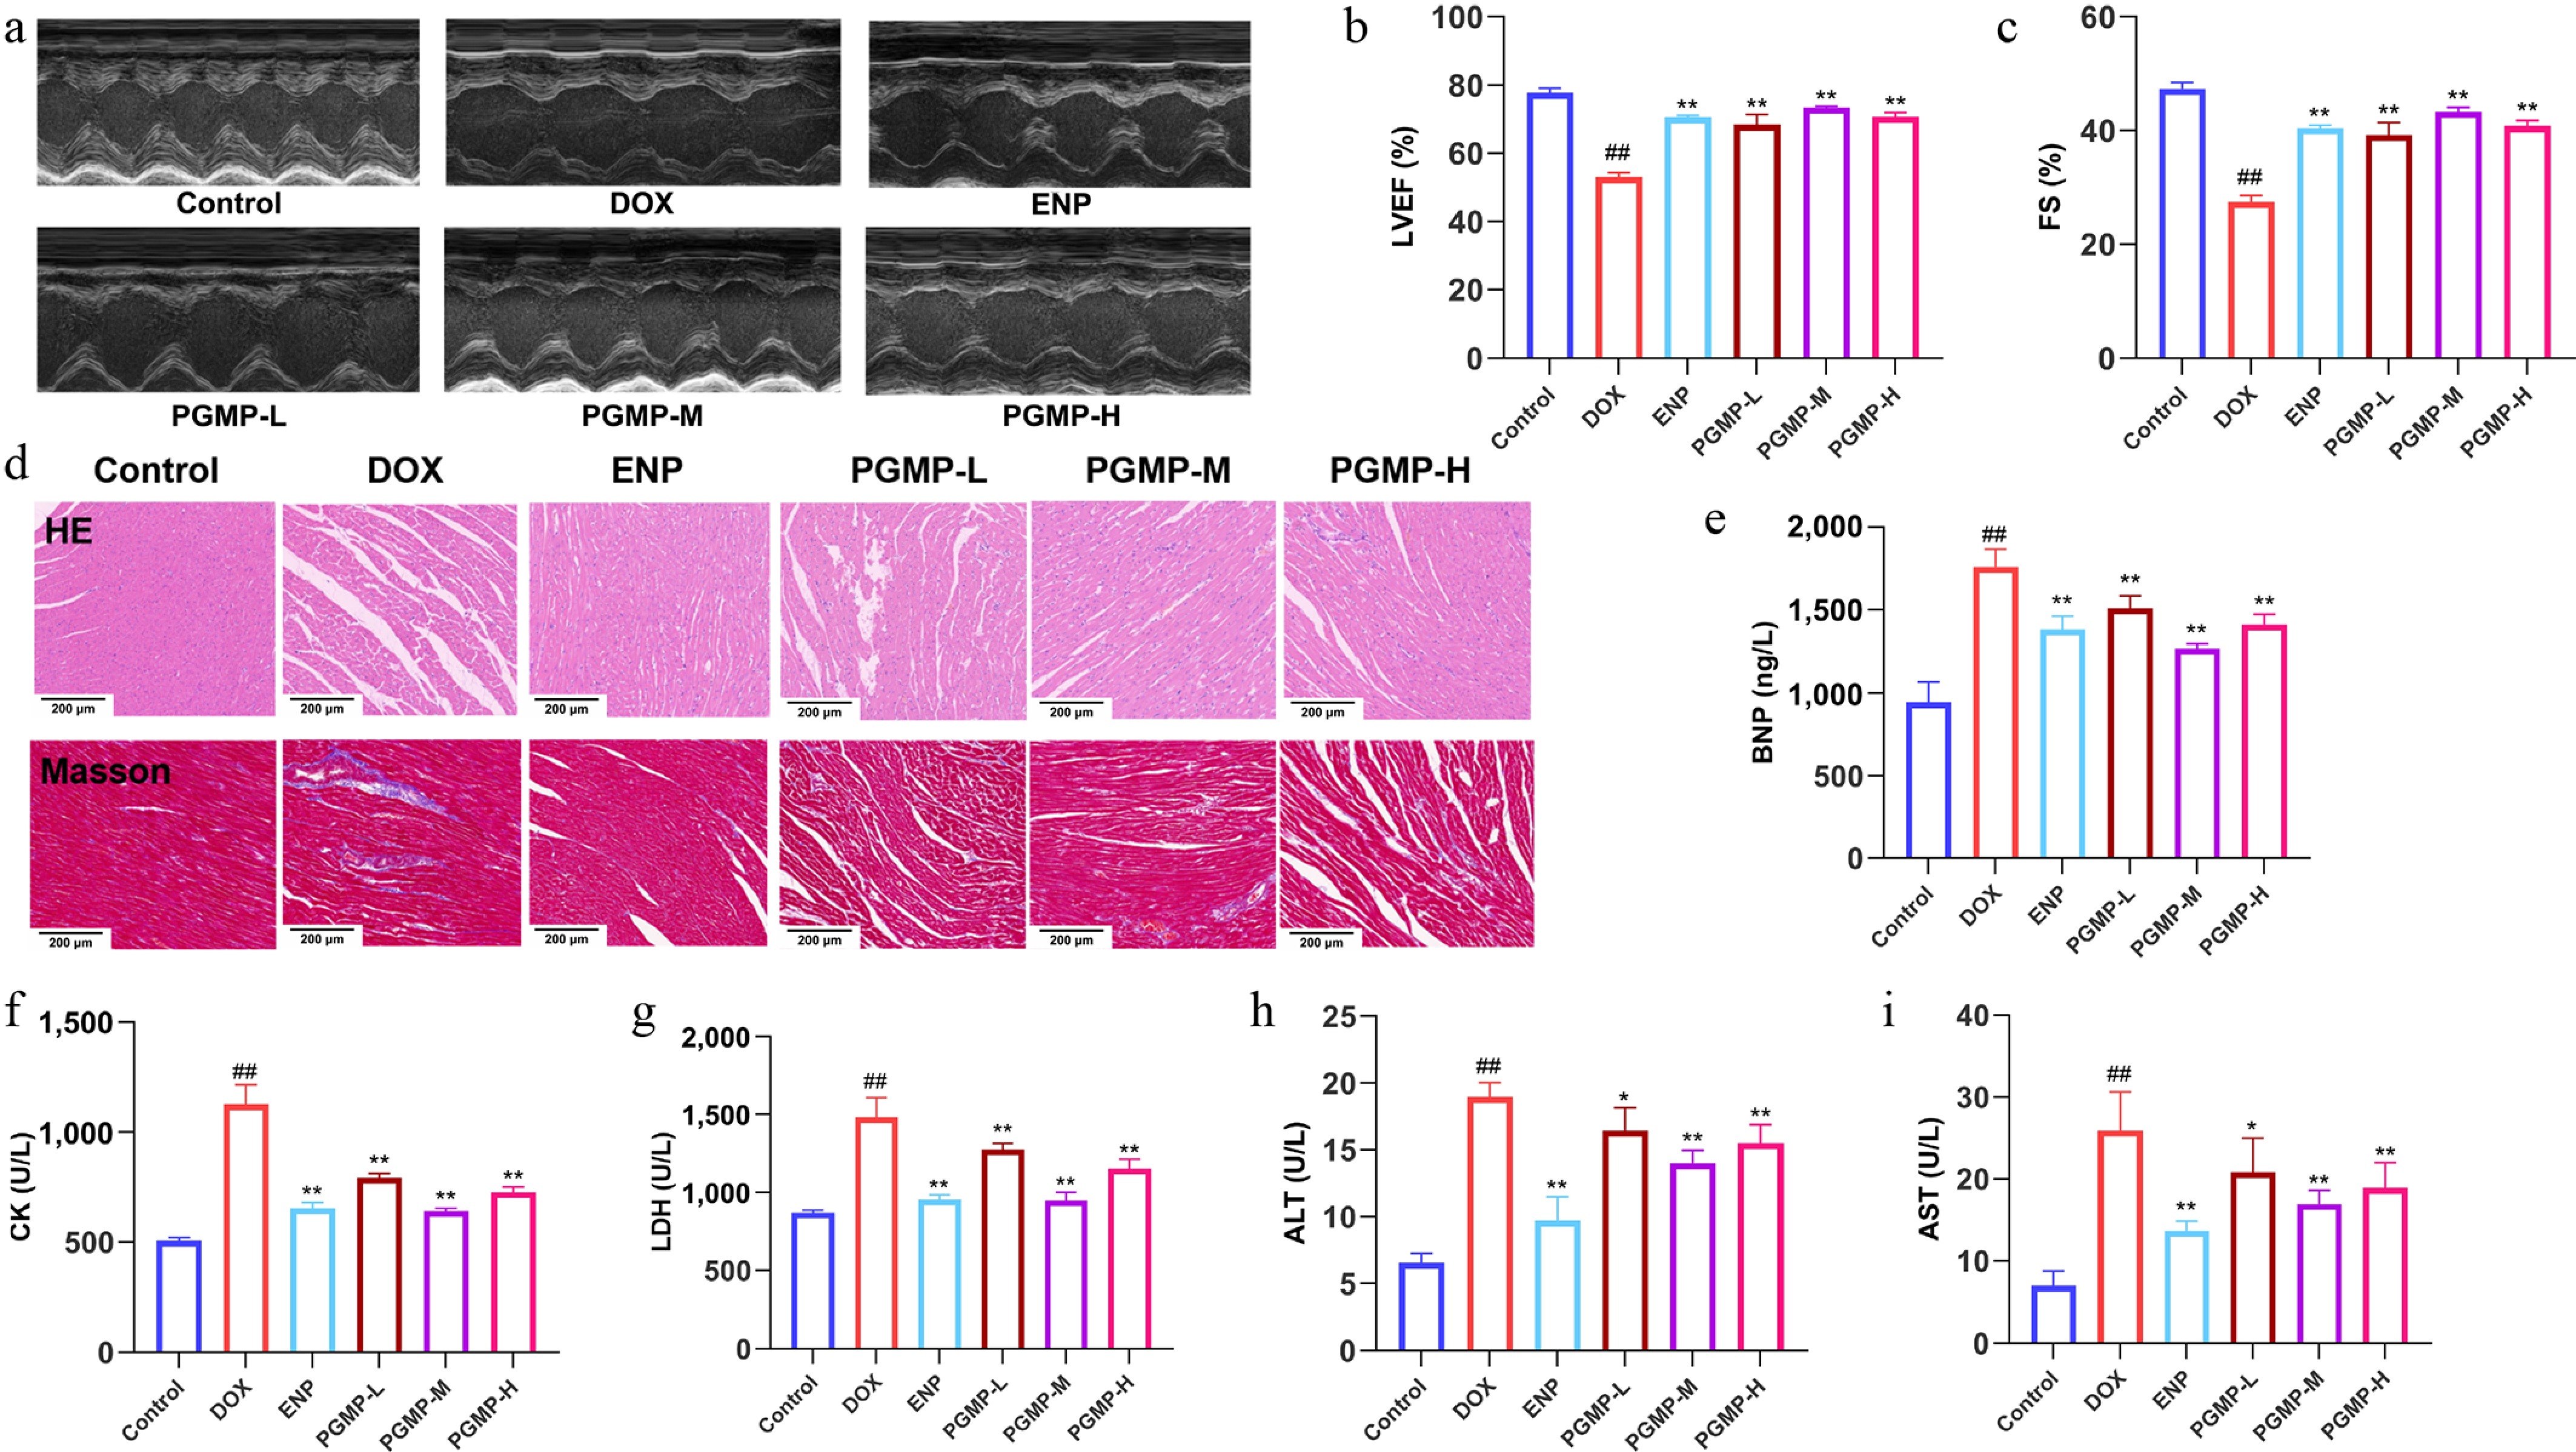
Figure 6.
Effects of PGMP on echocardiographic examination indicators, myocardial and hepatic injury markers in serum of DOX-induced chronic heart failure rats. (a) M-mode echocardiograms of the left ventricle; (b) left ventricular ejection fraction (LVEF); (c) fractional shortening (FS); (d) H&E staining results and Masson's trichrome staining results (scale bar = 200 μm). (e) Brain natriuretic peptide (BNP); (f) creatine kinase (CK); (g) lactate dehydrogenase (LDH); (h) alanine aminotransferase (ALT); (i) aspartate aminotransferase (AST). Here, n = 6; # p < 0.05, ## p < 0.01 vs. control group; * p < 0.05, ** p < 0.01 vs. DOX group.
-
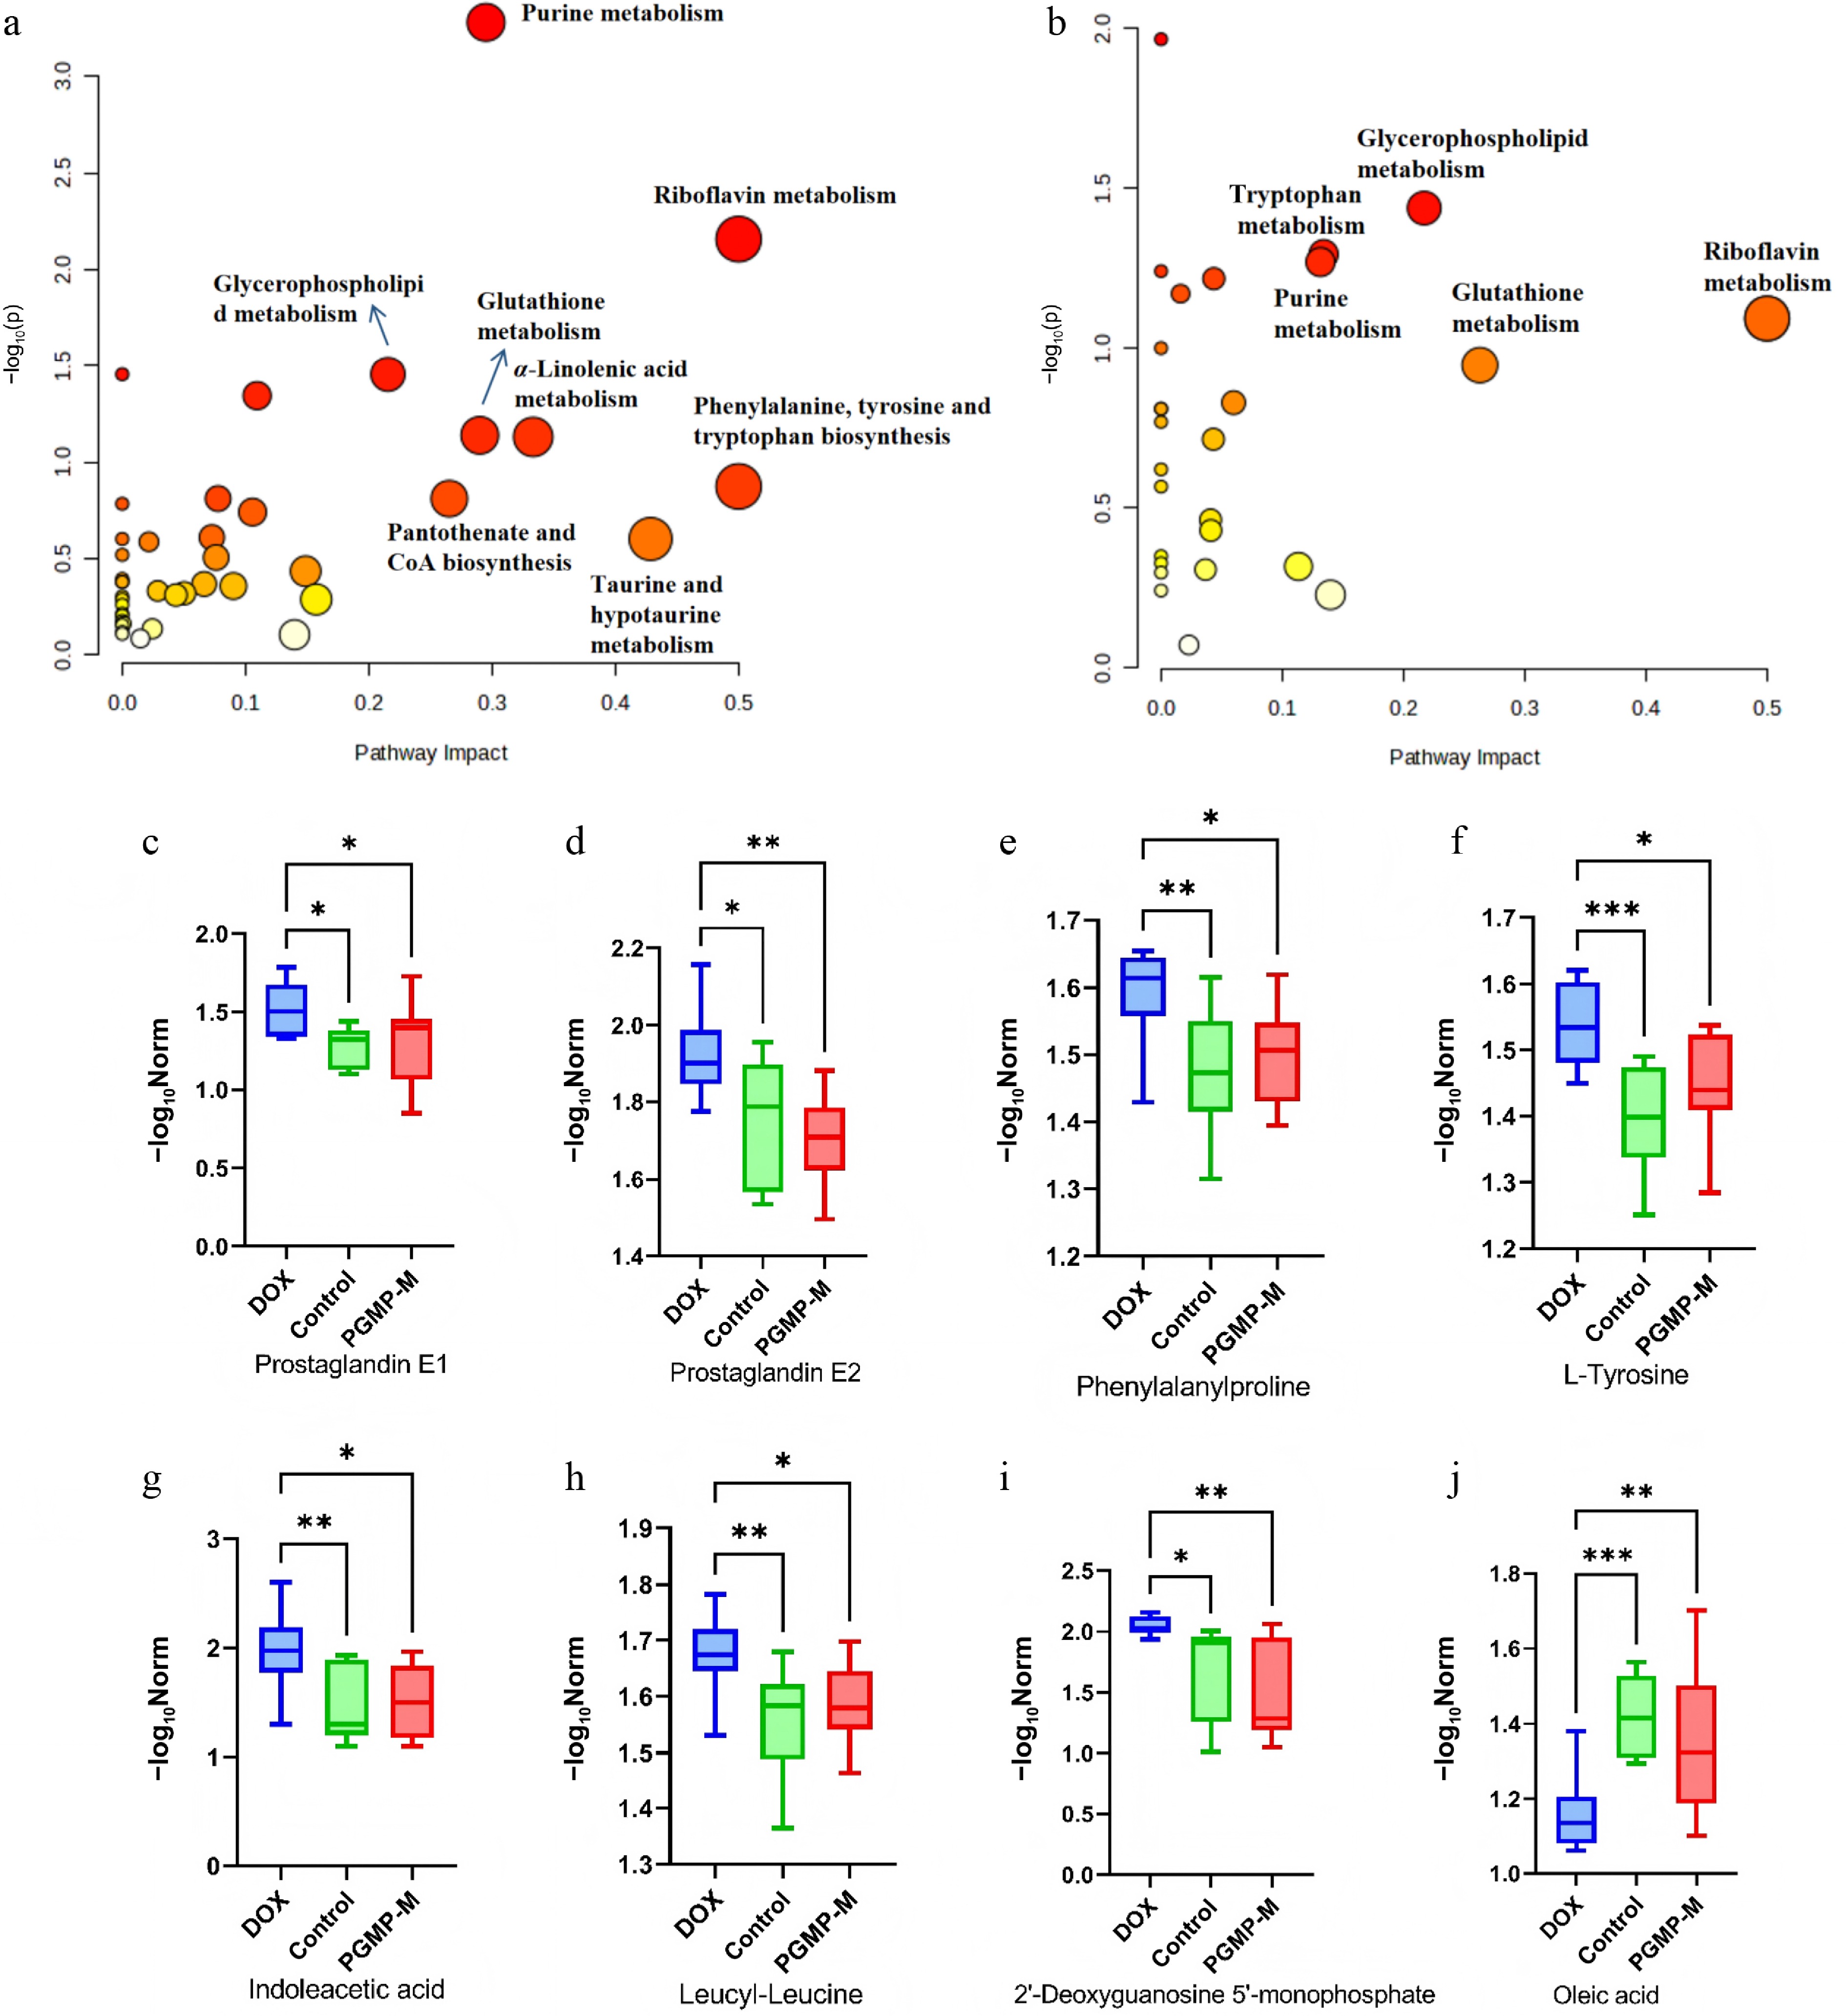
Figure 7.
Effects of PGMP on metabolism in DOX-induced CHF. Differential metabolite pathway analysis: (a) control/DOX group; (b) PGMP-M/DOX group. Relative abundance of differential metabolites: (c) Prostaglandin E1; (d) prostaglandin E2; (e) phenylalanylproline; (f) L-tyrosine; (g) indoleacetic acid; (h) leucyl-leucine; (i) 2'-deoxyguanosine-5'-monophosphate; (j) oleic acid. * p < 0.05, ** p < 0.01.
-
C-1/H-1 C-2/H-2 C-3/H-3 C-4/H-4 C-5/H-5 C-6/H-6 α-Glcp C 92.43 71.12 73.79 69.19 72.41 60.83 A H 5.35 3.46 3.67 3.36 3.76 3.67/3.76 2,1-β-Fruf C 60.83 103.18 76.94 71.18 81.09 62.07 B H 3.79 − 4.17 4.01 3.77 3.74 2-β-Fruf C 62.05 103.64 76.94 71.18 81.09 60.83 C H 3.61/3.82 − 4.09 4.03 3.74 3.73 Table 1.
1H and13C NMR chemical shifts of sugar residues in PGMP.
Figures
(7)
Tables
(1)